Abstract
The quest for water-splitting photocatalysts to generate hydrogen as a clean energy source from two-dimensional (2D) materials has enormous implications for sustainable energy solutions. Photocatalytic water splitting, a major field of interest, is focused on the efficient production of hydrogen from renewable resources such as water using 2D materials. Tin sulfide and tin disulfide, collectively known as SnS and SnS2, respectively, are metal sulfide compounds that have gained attention for their photocatalytic properties. Their unique electronic structures and morphological characteristics make them promising candidates for harnessing solar energy for environmental and energy-related purposes. CdS/SnS/SnS2 photocatalysts with two Sn phases (II and IV) were synthesized using a solvothermal method in this study. CdS was successfully placed on a broad SnS/SnS2 plane after a series of characterizations. We found that it is composited in the same way as a core-shell shape. When the SnS/SnS2 phase ratio was dominated by SnS and the structure was composited with CdS, the degradation efficiency was optimal. This material demonstrated high photocatalytic hydrogenation efficiency as well as efficient photocatalytic removal of Cr(VI) over 120 min. Because of the broad light absorption of CdS, the specific surface area, which is the reaction site, became very large. Second, it served as a transport medium for electron transfer from the conduction band (CB) of the SnS to the CB of the SnS2. Because of the composite, these electrons flowed into the CB of CdS, improving the separation efficiency of the photogenerated carriers even further. This material, which was easily composited, also effectively prevented mineral corrosion, which is a major issue with CdS.
1. Introduction
Because of its high energy density, hydrogen gas is a promising future energy resource [,,]. Furthermore, hydrogen is an environmentally friendly fuel because its combustion produces only water, whereas conventional fossil fuels emit pollutants and greenhouse gases, causing environmental destruction and global climate change []. As a result, the production of hydrogen gas as an environmentally friendly and renewable energy source will be a significant achievement for future environmental protection. One of the most promising approaches to producing renewable hydrogen as an energy source is solar-powered photocatalytic water splitting []. Significant progress has been made in the development of photocatalytic water-splitting systems, which have sparked intense interest in recent years. In recent years, there has been a lot of interest in the production of hydrogen gas using sunlight and semiconductor photocatalysts. Semiconductor-based photocatalytic technology is attracting attention due to its advantages such as eco-friendliness, stability, and the lack of need for additional energy. However, some challenges must be overcome before this technology can be used sustainably, including relatively low efficiency, stability problems against photocorrosion, and visible-light driving []. One important point to note is that UV light accounts for only about 5% of total energy in the solar spectrum. In contrast, visible light (wavelength 400–800 nm) accounts for more than half of solar energy, and developing long-wavelength reactive photocatalysts is critical to achieving truly efficient renewable hydrogen production []. As a result, the development of visible-light-driven photocatalysts is critical to the success of this technology. Many researchers have studied enhanced absorption across the entire solar spectrum, improved electron–hole separation, and accelerated charge transfer to achieve more satisfactory catalytic performance. So far, several strategies for optimizing materials have been reported, including constructing heterostructures by combining binary or multicomponent composites [], doping [], bandgap engineering [], and shape modulation []. In the reported literature, the construction of composites has been identified as a successful method for improving photocatalytic performance []. Composite methods that smooth the carrier movement between interfaces by band aligning the low-solar-energy absorption band and the fast electron–hole recombination problem are being studied variously [].
SnS is a p-type semiconductor with a broad absorption capacity in the visible-to-near-infrared region of the solar spectrum []. SnS is also abundant on Earth, inexpensive, and non-toxic, and has shown promise in photocatalysis and photodetectors. This material has a curved honeycomb structure similar to black phosphorus []. The bandgap can be adjusted based on the thickness as well as the electrical and optical properties. Because of the combination of cationic and anionic layers in an orthorhombic crystal structure of Sn and S, it exhibits anisotropy with a curved honeycomb structure and has high chemical stability []. The bandgap of the 2D SnS layer does not decrease monotonically but exhibits odd–even quantum confinement effects due to different energy band splits associated with different thicknesses but symmetrical fluctuations []. More importantly, the 2D SnS layer has significantly higher in-plane/anisotropy and mobility than BP. The SnS sheet is a very promising material as a nanoelectronic semiconductor because of its adjustable bandgap and high carrier mobility []. Furthermore, unlike expensive BP, SnS is advantageous for commercialization because it is inexpensive and simple to synthesize. High water stability can be a huge benefit in photocatalytic reactions that occur in humid environments []. Different valence states of Sn combined with Sn(SnS/SnS2), for example, can form heterogeneous structures that promote photolysis. For example, Chang et al. studied photodetectors with strong visible-light absorption, good photoelectric conversion efficiency, and effective control of the behavior of photogenerated carriers at low temperatures through SnS and CdS nanorod structures []. Furthermore, many high-performance, flexible photodetectors have been synthesized using CdS/SnS2 heterostructure films []. This is a promising method for fabricating double heterojunctions of SnS2 in conjunction with other semiconductor materials to increase activity and promote electron–hole separation. Pioneering research has revealed that SnS and CdS are superior candidates for forming double heterojunctions with SnS2 to inhibit electron–hole recombination and broaden the photoresponse range [].
In this study, we synthesized CdS/SnS/SnS2 core-shell composites of three materials using solvothermal and high-energy ultrasound methods. The characteristics and advantages of these composite structures were investigated through various analysis methods. It was also found that this material exhibits excellent performance as a photocatalyst for hydrogen production through benzyl alcohol reduction and water decomposition. In this process, a mechanism was discovered that inhibits electron–hole recombination to increase the carrier lifetime, thereby improving its efficiency.
2. Results and Discussion
2.1. Material Characterization
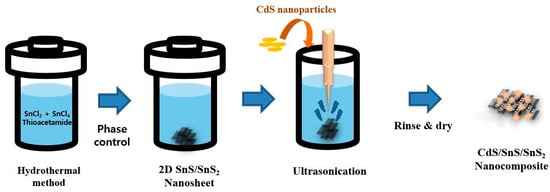
The CdS/SnS/SnS2 composite was synthesized in two steps: the first was a hydrothermal reaction, and the second was a sonication step (Scheme 1). The SnS sheet structure was obtained in the first step using a temperature-controlled hydrothermal reaction. CdS nanoparticles were uniformly distributed on the SnS in the following sonication step. The external appearance is similar irrespective of the temperature, but the internal composition ratio varies.
Scheme 1.
Schematic illustration of the preparation of CdS/SnS/SnS2 composite structure.
First, as shown in Figure 1, the morphologies of the CdS, SnS, and CdS/SnS/SnS2 samples were preferentially analyzed via FE-SEM. The CdS sample, as shown in Figure 1a, is made up of uniform nanoparticles with very small grain sizes. In addition, Figure 1b confirms that SnS is synthesized as a two-dimensional sheet. This means that the SnS obtained through this method is a layered bulk material. The surface of the synthesized nanosheet is smooth, and SnS2 particles are mixed on it. This laminated sheet-like material was exfoliated in NMP solution using ultrasonication. The ultrasonically bonded CdS/SnS/SnS2 compound (Figure 1c) was then overlaid on a sheet to reveal a rough surface. It can be created as a core-shell structure covered with CdS nanoparticles on a sheet of SnS/SnS2.
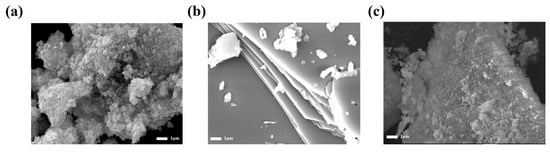
Figure 1.
FE-SEM images of CdS nanoparticles (a), SnS/SnS2 nanosheet (b), and CdS/SnS/SnS2 composite (c).
To better understand the microstructure and morphology of CdS/SnS/SnS2, TEM measurements were taken. The prepared CdS sample, as shown in Figure 2a,b, is composed of nanoparticles with a size of 10 nm or less. A lattice of CdS QDs with a diameter of several nm can be seen in Figure 2b. CdS particles have a lattice width of 0.305 nm, which corresponds to the hexagonal [101] crystal plane []. The surface structure of SnS/SnS2 can be seen in Figure 2c,d. It takes the shape of a large sheet, with lattices corresponding to SnS2 particles randomly distributed throughout. These SnS2 particles are found to be distributed in the form of small QDs. It is confirmed that the plate morphology of SnS is dominant, with only a trace of SnS2 present. SnS2 has a lattice spacing of 0.327 nm, which is attributed to the hexagonal phase’s [1 0 0] plane []. The microstructure of the CdS/SnS/SnS2 composite is shown in Figure 2e,f. It is confirmed here that CdS is distributed on the surface of the SnS/SnS2 structure in the form of a core-shell. The surface is covered in small CdS particles. CdS serves as the backbone for the massive structure of SnS/SnS2. Lattice spacing corresponding to 0.332 nm for the [0 0 2] lattice plane of CdS, 0.275 nm for the [0 4 0] lattice plane of SnS, and 0.327 nm for SnS2 is observed [].
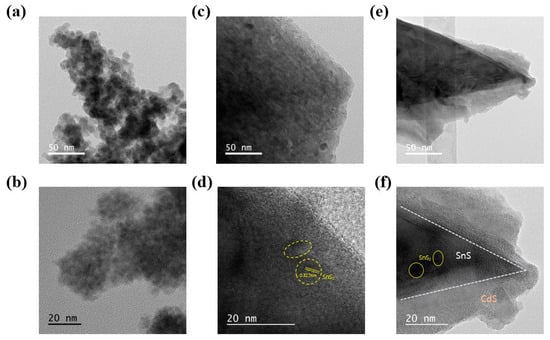
Figure 2.
Typical low- and high-magnification high-resolution TEM image of CdS nanoparticles (a,b), synthesized SnS/SnS2 nanosheet (c,d), and CdS/SnS/SnS2 composite (e,f).
EDS analysis via TEM confirms the elemental distribution of each structure. Figure 3a depicts the CdS particles, while Figure 3b depicts the EDS data of the structure of SnS/SnS2. Figure 3c depicts the EDS data of the CdS/SnS/SnS2 compound, which is confirmed by mapping over the SnS/SnS2 structure. This shape improves photocatalytic performance by encouraging the movement of light-generated carriers, and it can have a larger specific surface area than the sheet-like shape of SnS.
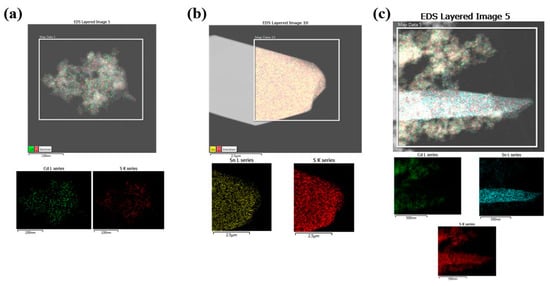
Figure 3.
HR-TEM EDX elemental mapping of CdS nanoparticles (a), synthesized SnS/SnS2 nanosheet (b), and CdS/SnS/SnS2 composite (c).
BET measurements were taken to investigate the improved reaction site and specific surface area over the SnS (Figure 4a,b) []. Furthermore, the difference in specific surface area between the two materials was determined using nitrogen adsorption/desorption BET. As a result, little adsorption is observed in the SnS/SnS2 sheets, whereas the BET surface area value in the CdS/SnS/SnS2 sample is 121.8 m2/g. The high specific surface area of the CdS/SnS/SnS2 composite is beneficial for the adsorption of reactive species and reactants on the surface, which improves photocatalytic performance [].
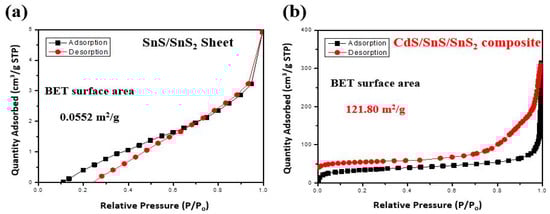
Figure 4.
BET surface isotherms for N2 at 77 K on a linear scale of SnS/SnS2 (a) and CdS/SnS/SnS2 composite (b).
The crystal structure and phase of the sample were determined using XRD (Figure 5a). The XRD pattern of the synthesized SnS/SnS demonstrates high crystallinity, with diffraction peak sets of 22° [1 1 0], 26.0° [1 2 0], 31.6° [1 1 1], 32.1° [0 4 0], 39° [1 3 1], and 45.5° [1 5 0], which is due to the orthorhombic SnS (JCPDS 39-0354) []. In general, SnS2 has a hexagonal crystal structure (JCPDS 21-1231). The peaks correspond to 28.2° [1 0 0], 30.5° [0 0 2], 50.3° [1 1 0], 52.6° [1 1 1], and 58.4° [2 0 0] at the 2θ values []. Because of the low diffraction intensity, the diffraction peak corresponding to CdS appears as a broad peak in the XRD pattern. This is due to CdS’s relatively low crystallinity and small grain size.
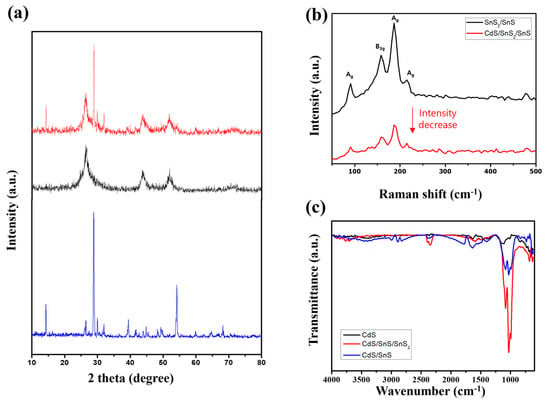
Figure 5.
XRD (a), Raman spectra (b), FT-IR data (c) based on the CdS nanoparticles, synthesized SnS/SnS2 nanosheet, and CdS/SnS/SnS2 composite.
Solid-state Raman spectroscopy can confirm the sample’s structure further (Figure 5b). It was not measured in Raman spectroscopy due to the low crystallinity of CdS and laser damage. As a result, the spectra of SnS/SnS2 and CdS/SnS/SnS2 composites are observed to be similar. This demonstrates that SnS/SnS2 was stably bound without any abnormalities during the CdS conjugation process. There are four distinct peaks at 95.9, 164.0, 192.0, and 219.5 cm−1 []. These peaks are attributed to the various Raman modes of Ag in SnS and B3g. Ag 40.1 cm−1 and Ag 219.3 cm−1 correspond to the layer shear mode and “NaCl”-type oscillations, respectively []. The other two Ag peaks, at 95.9 and 192.0 cm−1, occur in “shake” and “breathing” modes, respectively, whereas B3g 49.1 cm−1 and B3g 164.0 cm−1 are zigzag shear oscillations and “NaCl”-type oscillations []. Furthermore, the peak corresponding to the SnS2 mode is very low, near 300 cm−1. This is due to the fact that they exist in the form of very small quantum dots, as seen in TEM.
The samples’ Fourier transform infrared (FT-IR) spectra (Figure 5c) were measured. Similarly, the peak intensity of CdS in FT-IR is very low, and it is confirmed that bonding with SnS/SnS2 increased the peak of the vibration mode near 1000 cm−1, corresponding to the vibration of the -S bond.
The chemical composition of SnS/SnS2 components were identified using XPS (Figure 6). XPS analysis can provide detailed observations of a material’s surface state and composition. The XPS irradiation spectrum in Figure 6 reveals the presence of C, O, Sn, Cd, and S atoms in the prepared samples. In general, the elements C and O can be found in samples that have absorbed CO2 from the air []. Figure 6 depicts the Sn peak. The peaks at 486.7 and 495.2 eV are attributable to Sn 3d5/2 and 3d3/2 to the Sn(IV) of SnS2, respectively. And the two peaks at 484.7 and 493.2 eV can be attributed to Sn 3d5/2 and 3d3/2, respectively, which correspond to Sn(II) in the SnS reference data [,]. SnS is more dominant in Figure 6a, Figure 6b has a similar proportion, and Figure 6c is SnS2-dominant. As a result, the phase ratios of Sn (IV) and Sn (II) could be controlled based on the synthesis mole ratio and temperature. Sample c, which was placed on SnS2 in SnS sheet form, demonstrates the highest efficiency, so it was used for all the samples.
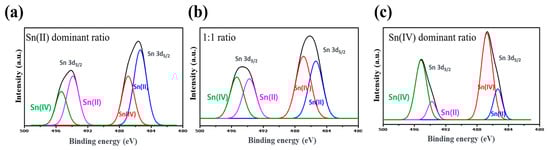
Figure 6.
(a–c) SnS and SnS2 phase XPS Sn 3d-level data according to the synthesis molar ratio.
Figure 7 depicts the high-resolution XPS spectra for S 2p and Cd 3d. In Figure 7a, the XPS spectrum of Cd 3d has two peaks measured at 411.9 eV and 405.1 eV, corresponding to the binding energies of Cd 3d3/2 and Cd 3d5/2, respectively []. The shoulder peak closest to the left corresponds to the loss. The S 2p spectrum (Figure 7b) indicates the presence of S 2 anions, S 2p3/2, and S 2p1/2, at binding energies of 162.7 eV and 161.5 eV, respectively [].
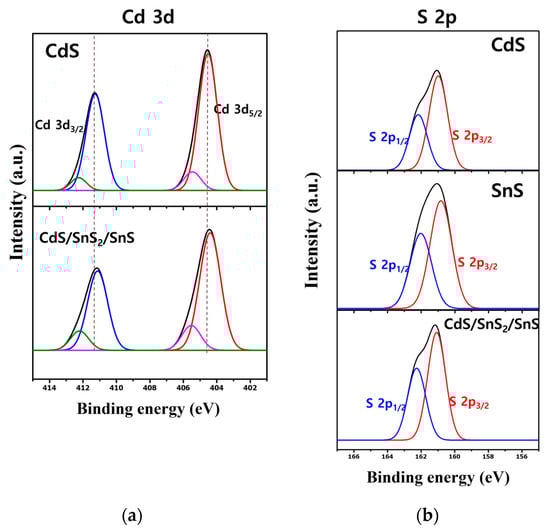
Figure 7.
XPS Cd 3d- (a) and S 2p-level (b) data of single material and CdS/SnS/SnS2 composite.
The photoelectrochemical properties of tin sulfide are primarily related to its light absorption properties, photogenic carrier generation, segregation, and interface transfer between the tin sulfide and the CdS []. UV-Vis diffuse reflection spectroscopy was used to obtain the diffuse reflectance curves of the samples. CdS/SnS/SnS2 absorbs more than SnS/SnS2 in the UV–visible region, as shown in Figure 8a. Kubelka Munc’s law was used to calculate the bandgap energies of the materials [].
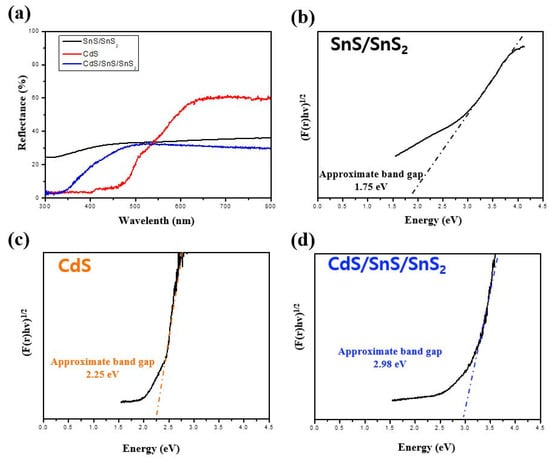
Figure 8.
(a) UV-Vis diffuse reflectance spectra (DRS) and (b–d) estimated band-gap energies of SnS/SnS2, CdS, and CdS/SnS/SnS2 composite.
The bandgap value is the x-intercept of the tangent of this graph []. In Figure 8b–d, CdS/SnS/SnS2 heterojunction nanosheets absorb light in a wide range from UV to NIR. The Eg value of the CdS/SnS/SnS2 composite nanosheets is 2.98 eV, which is wider than those of SnS/SnS2 1.75 eV and CdS 2.25 eV.
2.2. Photocatalytic Reaction Properties
We investigated whether previously synthesized SnS/SnS2 is a suitable material for visible-light-driven photocatalytic hydrogen generation and how it affects composite formation with CdS. The photocatalytic hydrogen generation experiment was performed using SnS/SnS2 and CdS, as well as SnS and SnS2 as controls, as shown in Figure 9. A small amount of IPA/methanol was added to the reaction solution as a sacrificial reagent to suppress the reverse reaction and increase the quantum yield. It is confirmed in Figure 9a,b that all single materials have little activity for visible-light-driven hydrogen generation. The average hydrogen generation efficiency was 35.57 μmol/h, single CdS was 1220.27 μmol/h, and when a complex was formed, the efficiency increased up to 2467.83 μmol/h. A recycling test was also performed to confirm the durability of photocorrosion, which is the most serious issue in the photocatalytic reaction of CdS materials. As a result, even though the CdS/SnS/SnS2 recycling test was repeated approximately six times, the photocatalytic hydrogen generation efficiency was maintained and slightly increased from the initial one.
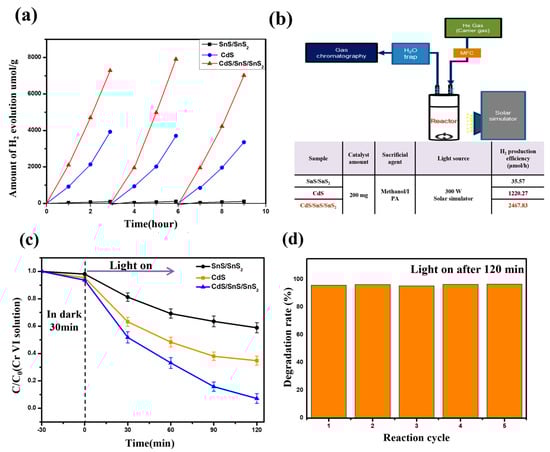
Figure 9.
(a) Comparison of the hydrogen generation and cycling tests for SnS/SnS2, CdS, and CdS/SnS/SnS2 composite. (b) Schematic diagram, experimental conditions, and efficiency of hydrogen production reaction experiment. (c) Changes in Ct/CO concentration of Cr(VI) with time using different catalysts. (d) Photoreduction 5-cycle decomposition rate of Cr(VI) using CdS/SnS/SnS2 composite.
To investigate the photocatalytic performance of the samples further, photoreduction Cr(VI) was performed [,]. The time-dependent reduction rates of Cr(VI) for various photocatalysts are shown in Figure 9c. A clean 15 mg/L Cr(VI) solution under illumination, as shown in the figure, indicates that no autocatalytic reduction of Cr(VI) can occur. Due to the relatively bulky SnS material’s poor light and light carrier transport properties, the majority of the conformation-dependent SnS structures demonstrate weak photocatalytic Cr(VI) reduction ability. The Cr(VI) reduction rate of SnS QDs, on the other hand, decreases to 80% of the Cr(VI) concentration at 120 min due to a change in the band whereby it becomes smaller and thinner. Furthermore, materials with two different bands are combined in CdS/SnS/SnS2 to prevent photocarrier recombination, and the reduction efficiency is improved due to the wide catalytic reaction site. The combination of two samples with different thicknesses and sizes, despite being made of the same material, significantly improve the light reduction performance. At 120 min, the CdS/SnS/SnS2 composite reduces by 100% Cr(VI), indicating excellent photoreduced Cr(VI) performance. Furthermore, the concentration of Cr(VI) drops sharply during the first 5 min before slowing down over the next few minutes. This should be caused by gradually decreasing Cr2O7 levels. In Figure 9d, a recycling experiment was carried out by continuously repeating the Cr(VI) photoreduction experiment of SnS MS. Even after 5 iterations, this demonstrates consistent performance.
There are several reasons why the photocatalytic efficiency and stability of the CdS/SnS/SnS2 composite are increased. Once on the advantage of the SnS/SnS2 mixed material is that the bonding with SnS inhibits the reduction reaction of the pure SnS2 material because the electrons for SnS2 provided via photogeneration are accepted rather than transferred to the Sn4− ion of the SnS2 lattice []. Therefore, the stability can be further improved. In addition, because the Cds/SnS/SnS2 sample has a much larger specific surface area than standard SnS/SnS2, more photocatalytic reactions can take place on the surface. Because photocatalysts are studied primarily through surface chemistry, a large surface area is a highly favorable condition for photocatalytic reactions []. Second, the photocatalytic efficiency was increased by lowering the recombination rate of photoinduced electron–hole charge carriers in the complex system and the increasing lifetime. To compensate, the carrier lifetimes of the samples were measured using PL and TRPL (Figure 10a,b) [,,]. As a result, the photoinduced charge carrier lifetime of CdS/SnS/SnS2 was longer than that of conventional single materials, and a 60% increase in carrier lifetime was confirmed. This follows the same pattern as the photocatalyst efficiency graph. Finally, to explain the photocatalytic reaction mechanism, a schematic diagram of the photoinduced charge carrier transport process through the TP/RP sample interface under visible-light irradiation was proposed (Figure 10c). The photocatalytic reaction mechanism is shown below. First, broad light absorption by CdS on the surface of the sample particle results in the formation of electron holes []. It then forms an electron by reacting with an unshared oxygen radical (e−). At this point, the electrons move to the adjacent CdS’s conduction band (CB) and react with oxygen to form a peroxide anion. Furthermore, they positively react with water molecules on the particle surface to form OH radicals, which then revert to their original state []. The composite samples outperformed the CdS or SnS single samples in terms of photocatalytic hydrogen evolution. This improvement in photocatalytic activity performance can be explained as follows. First, because the VB edge positions of SnS/SnS2 are higher than those of CdS, holes can easily move through the interface to the VB of the SnS. The migrated carriers can reduce the probability of recombination, effectively separating the charge carriers and improving photocatalytic efficiency []. The composite structure’s interface is also important in the separation efficiency of photoinduced electrons and holes []. Furthermore, in the case of CdS, fast photocorrosion is a disadvantage, but SnS/SnS2 acts as an acceptor, improving stability.
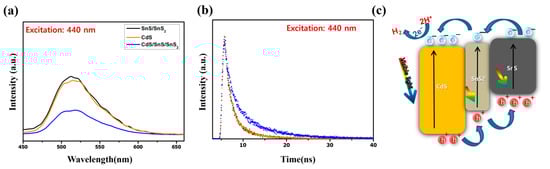
Figure 10.
(a) Photoluminescence spectra (excitation wavelength: 440 nm), and (b) time-resolved photoluminescence spectra (excitation wavelength: 440 nm) of SnS/SnS2, CdS, and CdS/SnS/SnS2 composite. (c) Schematic diagram of CdS/SnS/SnS2 photocatalyst efficiency improvement mechanism.
3. Materials and Methods
3.1. Materials
CdS nanoparticles, Dimethylformamide (DMF), Thioacetamide(C2H5NS), Tin(II) chloride, Tin(IV) chloride, Potassium dichromate(VI), N-methyl-2-pyrrolidone (NMP), and all other chemicals were acquired from Sigma-Aldrich (St. Louis, MO, USA) and used without further purification. Distilled water was purified using a tertiary filter, and ethyl alcohol (98%) and acetone (99%) were used as solvents.
3.2. Preparation of CdS/SnS/SnS2 Nanocomposite
SnS/SnS2 nanosheets were synthesized using the solvothermal method. In 38 mL of DMF, SnCl2, SnCl4, and Thioacetamide were each adjusted in molar ratio and mixed under vacuum for 1 h. Then, we put the solution in a 50 mL Teflon autoclave to react at 200 °C for 12 h. After cooling naturally, it was washed three times with ethanol and dried via centrifugation. The exfoliation process was performed via high-energy sonication of N-methyl-2-pyrrolidone (NMP) solution while cooling the bath.
We dispersed the synthesized SnS/SnS2 nanosheet and CdS nanoparticles in a mixed solution of ethanol and distilled water. After this, high-energy ultra horn sonication was performed in an ice bath for 5 h. Finally, high-speed centrifugation was performed and the sample was washed with ethanol 3 times.
3.3. Photocatalytic Hydrogen Evolution Measurements
The photocatalytic hydrogen evolution test was used to perform hydrogen evolution photocatalytic activation in a reaction vessel using a 250 W Xe lamp equipped with a 400 nm cut-off filter. Distilled water and methanol/IPA were mixed in a photoreactor in a volume ratio of 5:1:1, and 0.2 g of photocatalyst powder was added and stirred so as to be uniformly dispersed. Before irradiation, the reaction solution was evacuated several times to remove air, and the reaction temperature was always maintained at 279 K. To determine the amount of H2 produced, gas chromatography (YoungIn Chromass GC6500 system, PDD detector, Anyang, Republic of Korea) was performed using high-purity He as a carrier gas.
3.4. Photocatalytic Organic Pollutant Degradation
The photocatalytic reduction of Cr(VI) was carried out using 15 mg/L of a 50 mL K2Cr2O7 solution and 10 mg photocatalyst, as well as 20 vol% triethanolamine (TEOA) as a sacrificial agent. To achieve adsorption/desorption equilibrium, the K2Cr2O7 solution containing the photocatalyst was stirred in the dark for 30 min before light irradiation, and the temperature of the Cr(VI) photoreduction reaction was also maintained to avoid thermal effects. A solar simulator (Datech’s Model-DXP300, Seoul, Republic of Korea) with a UV cut filter (output wavelength: 400–1000 nm) was used as the light source. A total of 4 mL of the reaction solution was obtained from the reactor at 0 °C at 5 min intervals and centrifuged at 10,000 rpm for 5 min to collect the supernatant. The Cr(VI) concentration was determined as follows. Finally, UV-Vis spectroscopy was used to examine the magenta complex, which has a distinct absorption peak at 540 nm. Following this, a recycling test was carried out as follows. First, the sample was washed and centrifuged with distilled water after the photocatalyst was measured. To remove the dye from the sample surface, the procedure was repeated several times. For each photocatalyst reaction time, five recycle tests were performed.
3.5. Characterization
Field emission scanning electron microscopy (FE-SEM, Model JSM-7100 F, JEOL, Tokyo, Japan) was used to evaluate the surface morphologies of all samples. Cs-corrected transmission electron microscopy (Cs correct TEM, Model JEM ARM 200F, JEOL, Tokyo, Japan) at an accelerating voltage of 80–200 kV was used to examine the lattice structures and exfoliation status of all samples. This unit included an EM unit, a high-angle annular dark-field detector, an FLC unit, an ultra-scan charge-coupled detector (CCD) camera unit, and an energy-dispersive spectrometry (EDS) unit. X-ray diffraction (XRD, D/Max Ultima III Rigaku Corporation, Tokyo, Japan) was used to determine the crystallinity of the material. UV-Vis absorption spectroscopy was used to monitor the catalytic decomposition of Cr(VI) (UV-3600 Plus UV-Vis-NIR Spectrophotometer, SHIMADZU, Kyoto, Japan). In addition, UV-Vis absorption techniques were used to assess photocatalytic stability and catalyst capacity. A laser with a 532 nm wavelength was linearly polarized from the confocal Raman spectroscopy measurements (NTEGRA Spectra, NT-MDT Co., Zelenograd, Russia). The objective lens used in all experiments had 0.7 NA and a magnification of 100× (Mitutoyo, Japan). A CCD (Andor, Abingdon-on-Thames, UK) cooled to 75 °C and a spectrometer with a grating of 1800 grooves/mm blazed at 500 nm were used to obtain Raman scattering signals.
4. Conclusions
The solvothermal method was used to synthesize a composite by controlling the phase of Sn and combining it with CdS. Sonication was used to separate the two materials for nanocomposite synthesis. Various spectroscopy methods were used to examine this material. In a solar simulator equipped with a UV cut-off filter, our composite catalyst demonstrated excellent photocatalytic performance for high-concentration water -splitting hydrogen production and Cr(VI) reduction (wavelength 400–1000 nm). The efficiency of hydrogen production increased to 2467.83 umol/h, which is far superior to other reported photocatalysts. Furthermore, even after up to six cycles of the photocatalytic reaction, no reduction in efficiency or material deterioration was observed. This increased photoactivity and stability are attributed to the two materials’ large specific surface area, anti-recombination, and fast conductivity effects.
We presented a method for simultaneously solving the problem of CdS stability and fast and dominant electron–hole recombination in this study. When we applied two-dimensional SnS to the photocatalysts, we discovered a lot of potential and possibilities. Building a database of various materials will have a positive impact on the design of photocatalysts for other purposes when designing photocatalyst materials. Furthermore, the oxidation control of BP via plasma treatment is expected to be applicable to other materials. We believe that this research opens new possibilities for the various two-dimensional-material photocatalysts that are currently being investigated. Furthermore, the development of a hybrid photocatalyst material that can decompose both air and water pollutants at the same time could be a fundamental solution to the environmental pollution problem.
Author Contributions
Conceptualization, R.H.J.; methodology, R.H.J.; software, R.H.J.; validation, R.H.J. and J.-H.B.; formal analysis, R.H.J.; investigation, R.H.J.; resources, J.H.L.; data curation, R.H.J.; writing—original draft preparation, R.H.J.; writing—review and editing, J.H.L. and J.-H.B.; visualization, R.H.J.; supervision, J.-H.B.; project administration, J.-H.B.; funding acquisition, J.H.L. and J.-H.B. All authors have read and agreed to the published version of the manuscript.
Funding
This work was supported by a grant from the New and Renewable Energy Program of the Korea Institute of Energy Technology Evaluation and Planning (KETEP) funded by the Korean government’s Ministry of Knowledge Economy (No. 20213030010430). This work was also supported by Basic Science Research Program through the National Research Foundation of Korea (NRF) funded by the Ministry of Education (No. NRF-2019R1A6A1A10073079).
Institutional Review Board Statement
Not applicable.
Informed Consent Statement
Not applicable.
Conflicts of Interest
The authors declare no conflict of interest.
References
- Dawood, F.; Anda, M.; Shafiullah, G.M. Hydrogen production for energy: An overview. Int. J. Hydrogen Energy 2020, 45, 3847–3869. [Google Scholar] [CrossRef]
- Pinaud, B.A.; Benck, J.D.; Seitz, L.C.; Forman, A.J.; Chen, Z.; Deutsch, T.G.; James, B.D.; Baum, K.N.; Baum, G.N.; Ardo, S.; et al. Technical and economic feasibility of centralized facilities for solar hydrogen production via photocatalysis and photoelectrochemistry. Energy Environ. Sci. 2013, 6, 1983–2002. [Google Scholar] [CrossRef]
- Howarth, R.W.; Jacobson, M.Z. How green is blue hydrogen? Energy Sci. Eng. 2021, 9, 1676–1687. [Google Scholar] [CrossRef]
- Davis, S.J.; Caldeira, K.; Matthews, H.D. Future CO2 Emissions and Climate Change from Existing Energy Infrastructure. Science 2010, 329, 1330–1333. [Google Scholar] [CrossRef] [PubMed]
- Wang, Z.; Li, C.; Domen, K. Recent developments in heterogeneous photocatalysts for solar-driven overall water splitting. Chem. Soc. Rev. 2019, 48, 2109–2125. [Google Scholar] [CrossRef]
- Cao, S.; Piao, L.; Chen, X. Emerging Photocatalysts for Hydrogen Evolution. Trends Chem. 2020, 2, 57–70. [Google Scholar] [CrossRef]
- Lewis, N.S. Research opportunities to advance solar energy utilization. Science 2016, 351, aad1920. [Google Scholar] [CrossRef]
- Marschall, R. Semiconductor Composites: Strategies for Enhancing Charge Carrier Separation to Improve Photocatalytic Activity. Adv. Funct. Mater. 2014, 24, 2421–2440. [Google Scholar] [CrossRef]
- Ida, S.; Okamoto, Y.; Matsuka, M.; Hagiwara, H.; Ishihara, T. Preparation of Tantalum-Based Oxynitride Nanosheets by Exfoliation of a Layered Oxynitride, CsCa2Ta3O10−xNy, and Their Photocatalytic Activity. J. Am. Chem. Soc. 2012, 134, 15773–15782. [Google Scholar] [CrossRef]
- Yan, X.; Yuan, K.; Lu, N.; Xu, H.; Zhang, S.; Takeuchi, N.; Kobayashi, H.; Li, R. The interplay of sulfur doping and surface hydroxyl in band gap engineering: Mesoporous sulfur-doped TiO2 coupled with magnetite as a recyclable, efficient, visible light active photocatalyst for water purification. Appl. Catal. B Environ. 2017, 218, 20–31. [Google Scholar] [CrossRef]
- Li, X.; Xue, H.; Pang, H. Facile synthesis and shape evolution of well-defined phosphotungstic acid potassium nanocrystals as a highly efficient visible-light-driven photocatalyst. Nanoscale 2017, 9, 216–222. [Google Scholar] [CrossRef]
- Luo, B.; Liu, G.; Wang, L. Recent advances in 2D materials for photocatalysis. Nanoscale 2016, 8, 6904–6920. [Google Scholar] [CrossRef] [PubMed]
- Lin, L.; Hisatomi, T.; Chen, S.; Takata, T.; Domen, K. Visible-Light-Driven Photocatalytic Water Splitting: Recent Progress and Challenges. Trends Chem. 2020, 2, 813–824. [Google Scholar] [CrossRef]
- Steichen, M.; Djemour, R.; Gütay, L.; Guillot, J.; Siebentritt, S.; Dale, P.J. Direct Synthesis of Single-Phase p-Type SnS by Electrodeposition from a Dicyanamide Ionic Liquid at High Temperature for Thin Film Solar Cells. J. Phys. Chem. C 2013, 117, 4383–4393. [Google Scholar] [CrossRef]
- Huang, W.; Li, C.; Gao, L.; Zhang, Y.; Wang, Y.; Huang, Z.N.; Chen, T.; Hu, L.; Zhang, H. Emerging black phosphorus analogue nanomaterials for high-performance device applications. J. Mater. Chem. C 2020, 8, 1172–1197. [Google Scholar] [CrossRef]
- Khan, H.; Mahmood, N.; Zavabeti, A.; Elbourne, A.; Rahman, A.; Zhang, B.Y.; Krishnamurthi, V.; Atkin, P.; Ghasemian, M.B.; Yang, J.; et al. Liquid metal-based synthesis of high performance monolayer SnS piezoelectric nanogenerators. Nat. Commun. 2020, 11, 3449. [Google Scholar] [CrossRef]
- Xin, C.; Zheng, J.; Su, Y.; Li, S.; Zhang, B.; Feng, Y.; Pan, F. Few-Layer Tin Sulfide: A New Black-Phosphorus-Analogue 2D Material with a Sizeable Band Gap, Odd−Even Quantum Confinement Effect, and High Carrier Mobility. J. Phys. Chem. C 2016, 120, 22663–22669. [Google Scholar] [CrossRef]
- Tian, Z.; Guo, C.; Zhao, M.; Li, R.; Xue, J. Two-Dimensional SnS: A Phosphorene Analogue with Strong In-Plane Electronic Anisotropy. ACS Nano 2017, 11, 2219–2226. [Google Scholar] [CrossRef]
- Brent, J.R.; Lewis, D.J.; Lorenz, T.; Lewis, E.A.; Savjani, N.; Haigh, S.J.; Seifert, G.; Derby, B.; O’brien, P. Tin(II) Sulfide (SnS) Nanosheets by Liquid-Phase Exfoliation of Herzenbergite: IV−VI Main Group Two-Dimensional Atomic Crystals. J. Am. Chem. Soc. 2015, 137, 12689–12696. [Google Scholar] [CrossRef]
- Chang, Y.; Wang, J.; Wu, F.; Tian, W.; Zhai, W. Structural Design and Pyroelectric Property of SnS/CdS Heterojunctions Contrived for Low-Temperature Visible Photodetectors. Adv. Funct. Mater. 2020, 30, 2001450. [Google Scholar] [CrossRef]
- Amroun, M.; Khadraoui, M.; Miloua, R.; Kebbab, Z.; Sahraoui, K. Sahraoui, Investigation on the structural, optical and electrical properties of mixed SnS2—CdS thin films. Optik 2017, 131, 152–164. [Google Scholar] [CrossRef]
- Li, X.; Zhu, J.; Li, H. Comparative study on the mechanism in photocatalytic degradation of different-type organic dyes on SnS2 and CdS. Appl. Catal. B Environ. 2012, 123–124, 174–181. [Google Scholar] [CrossRef]
- Zhang, J.; Zhang, Q.; Wang, L.; Li, X.; Huang, W. Interface induce growth of intermediate layer for bandgap engineering insights into photoelectrochemical water splitting. Sci. Rep. 2016, 6, 27241. [Google Scholar] [CrossRef]
- Mandari, K.K.; Son, N.; Kang, M. Synergistic effects of Tin sulfide Nitrogen-doped titania Nanobelt-Modified graphitic carbon nitride nanosheets with outstanding photocatalytic activity. J. Colloid Interface Sci. 2022, 606, 1767–1778. [Google Scholar] [CrossRef]
- Chava, R.K.; Do, J.Y.; Kang, M. Enhanced photoexcited carrier separation in CdS—SnS2 heteronanostructures: A new 1D–0D visiblelight photocatalytic system for the hydrogen evolution reaction. J. Mater. Chem. A 2019, 7, 13614. [Google Scholar] [CrossRef]
- Francisco, M.S.P.; Mastelaro, V.R.; Nascente, P.A.P.; Florentino, A.O. Activity and Characterization by XPS, HR-TEM, Raman Spectroscopy, and BET Surface Area of CuO/CeO2-TiO2 Catalysts. J. Phys. Chem. B 2001, 105, 10515–10522. [Google Scholar] [CrossRef]
- Hao, R.; Wang, G.; Jiang, C.; Tang, H.; Xu, Q. In situ hydrothermal synthesis of g-C3N4/TiO2 heterojunction photocatalysts with high specific surface area for Rhodamine B degradation. Appl. Surf. Sci. 2017, 411, 400–410. [Google Scholar] [CrossRef]
- Ru, J.; He, T.; Chen, B.; Feng, Y.; Zu, L.; Wang, Z.; Zhang, Q.; Hao, T.; Meng, R.; Che, R.; et al. Covalent Assembly of MoS2 Nanosheets with SnS Nanodots as Linkages for Lithium/Sodium-Ion Batteries. Angew. Chem. Int. Ed. 2020, 59, 14621–14627. [Google Scholar] [CrossRef]
- Jiang, J.; Huang, J.; Ye, Z.; Ruan, S.; Zeng, Y. Self-Powered and Broadband Photodetector Based on SnS2/ZnO1−xSx Heterojunction. Adv. Mater. Interfaces 2020, 7, 2000882. [Google Scholar] [CrossRef]
- Chandrasekhar, H.R.; Humphreys, R.G.; Zwick, U.; Cardona, M. Infrared and Raman spectra of the IV-VI compounds SnS and SnSe. Phys. Rev. B 1977, 15, 2177–2183. [Google Scholar] [CrossRef]
- Li, M.; Wu, Y.; Li, T.; Chen, Y.; Ding, H.; Lin, Y.; Pan, N.; Wang, X. Revealing anisotropy and thickness dependence of Raman spectra for SnS flakes. RSC Adv. 2017, 7, 48759. [Google Scholar] [CrossRef]
- Liang, D.; Liu, S.; Wang, Z.; Guo, Y.; Jiang, W.; Liu, C.; Wang, H.; Wang, N.; Ding, W.; He, M.; et al. Coprecipitation synthesis of N, Fe doped anatase TiO2 nanoparticles and photocatalytic mechanism. J. Mater. Sci. Mater. Electron. 2019, 30, 12619–12629. [Google Scholar] [CrossRef]
- Hu, X.; Song, G.; Li, W.; Peng, Y.; Jiang, L.; Xue, Y.; Liu, Q.; Chen, Z.; Hu, J. Phase-controlled synthesis and photocatalytic properties of SnS, SnS2 and SnS/SnS2 heterostructure nanocrystals. Mater. Res. Bull. 2013, 48, 2325–2332. [Google Scholar] [CrossRef]
- Liu, Q.; Liu, S.; Wu, A.; Huang, H.; Zhou, L. SnS2 and SnS/SnS2 heterojunction nanosheets prepared by in-situ one-step sulfurization and visible light-assisted electrochemical water splitting properties. J. Alloys Compd. 2020, 834, 155174. [Google Scholar] [CrossRef]
- Navarro, R.; Delvalle, F.; Fierro, J. Photocatalytic hydrogen evolution from CdS–ZnO–CdO systems under visible light irradiation: Effect of thermal treatment and presence of Pt and Ru cocatalysts. Int. J. Hydrogen Energy 2008, 33, 4265–4273. [Google Scholar] [CrossRef]
- Ma, F.; Zhao, G.; Li, C.; Wang, T.; Wu, Y.; Lv, J.; Zhong, Y.; Hao, X. Fabrication of CdS/BNNSs nanocomposites with broadband solar absorption for efficient photocatalytic hydrogen evolution. CrystEngComm 2016, 18, 631–637. [Google Scholar] [CrossRef]
- Arulanantham, A.; Valanarasu, S.; Jeyadheepan, K.; Ganesh, V.; Shkir, M. Development of SnS (FTO/CdS/SnS) thin films by nebulizer spray pyrolysis (NSP) for solar cell applications. J. Mol. Struct. 2018, 1152, 137–144. [Google Scholar] [CrossRef]
- Kubelka, P.; Munk, F. An Article on Optics of Paint Layers. Z. Tech. Phys. 1931, 12, 259–274. [Google Scholar]
- Murphy, A.B. Band-gap determination from diffuse reflectance measurements of semiconductor films, and application to photoelectrochemical water-splitting. Sol. Energy Mater. Sol. Cells 2007, 91, 1326–1337. [Google Scholar] [CrossRef]
- Singh, J.; Sharma, P.; Tripathi, N.; Shishkina, D.; Rymzhina, A.; Boltov, E.A.; Platonov, V.; Pavelyev, V.; Volkov, V.S.; Arsenin, A.V.; et al. Synthesis of highly sensitive nanomaterial for ultra-fast photocatalytic activity: A detailed study on photocatalytic capabilities of rod-shaped TiS3 nanostructures. Catal. Commun. 2022, 162, 106381. [Google Scholar] [CrossRef]
- Zhang, G.; Huang, S.; Li, X.; Chen, D.; Li, N.; Xu, Q.; Li, H.; Lu, J. Internal electric field engineering of bifunctional 2D/2D heterojunction photocatalyst for cooperative H2 production and alcohol conversion. Appl. Catal. B Environ. 2023, 331, 122725. [Google Scholar] [CrossRef]
- Wu, C.-Y.; Lee, C.-J.; Yu, Y.-H.; Tsao, H.-W.; Su, Y.-H.; Kaun, C.-C.; Chen, J.-S.; Wu, J.-J. Efficacious CO2 Photoconversion to C2 and C3 Hydrocarbons on Upright SnS−SnS2 Heterojunction Nanosheet Frameworks. ACS Appl. Mater. Interfaces 2021, 13, 4984–4992. [Google Scholar] [CrossRef] [PubMed]
- Peng, J.; Chen, X.; Ong, W.-J.; Zhao, X.; Li, N. Surface and Heterointerface Engineering of 2D MXenes and Their Nanocomposites: Insights into Electro- and Photocatalysis. Chemistry 2019, 5, 18–50. [Google Scholar] [CrossRef]
- Etacheri, V.; Roshan, R.; Kumar, V. Mg-Doped ZnO Nanoparticles for Efficient Sunlight-Driven Photocatalysis. ACS Appl. Mater. Interfaces 2012, 4, 2717–2725. [Google Scholar] [CrossRef] [PubMed]
- Dozzi, M.V.; D’Andrea, C.; Ohtani, B.; Valentini, G.; Selli, E. Fluorine-Doped TiO2 Materials: Photocatalytic Activity vs. TimeResolved Photoluminescence. J. Phys. Chem. C 2013, 117, 25586–25595. [Google Scholar] [CrossRef]
- Ebihara, M.; Ikeda, T.; Okunaka, S.; Tokudome, H.; Domen, K.; Katayama, K. Charge carrier mapping for Z-scheme photocatalytic water-splitting sheet via categorization of microscopic time-resolved image sequences. Nat. Commun. 2021, 12, 3716. [Google Scholar] [CrossRef]
- Liu, Q.; He, X.; Tao, J.; Tang, H.; Liu, Z. Oxygen Vacancies Induced Plasmonic Effect for Realizing Broad-Spectrum-Driven Photocatalytic H2 Evolution over an S-Scheme CdS/W18O49 Heterojunction. Chem. Nano Mat. 2021, 7, 44–49. [Google Scholar] [CrossRef]
- Wenderich, K.; Mul, G. Methods, Mechanism, and Applications of Photodeposition in Photocatalysis: A Review. Chem. Rev. 2016, 116, 14587–14619. [Google Scholar] [CrossRef]
- Ben-Shahar, Y.; Philbin, J.P.; Scotognella, F.; Ganzer, L.; Cerullo, G.; Rabani, E.; Banin, U. Charge Carrier Dynamics in Photocatalytic Hybrid Semiconductor—Metal Nanorods: Crossover from Auger Recombination to Charge Transfer. Nano Lett. 2018, 18, 5211–5216. [Google Scholar] [CrossRef]
- Ma, X.; Dai, Y.; Yu, L.; Huang, B. Energy transfer in plasmonic photocatalytic composites. Light Sci. Appl. 2016, 5, e16017. [Google Scholar] [CrossRef]
Disclaimer/Publisher’s Note: The statements, opinions and data contained in all publications are solely those of the individual author(s) and contributor(s) and not of MDPI and/or the editor(s). MDPI and/or the editor(s) disclaim responsibility for any injury to people or property resulting from any ideas, methods, instructions or products referred to in the content. |
© 2023 by the authors. Licensee MDPI, Basel, Switzerland. This article is an open access article distributed under the terms and conditions of the Creative Commons Attribution (CC BY) license (https://creativecommons.org/licenses/by/4.0/).