
Measuring Up: A Comparison of TapeStation 4200 and Bioanalyzer 2100 as Measurement Tools for RNA Quality in Postmortem Human Brain Samples

 ,
, 
Abstract
:1. Introduction
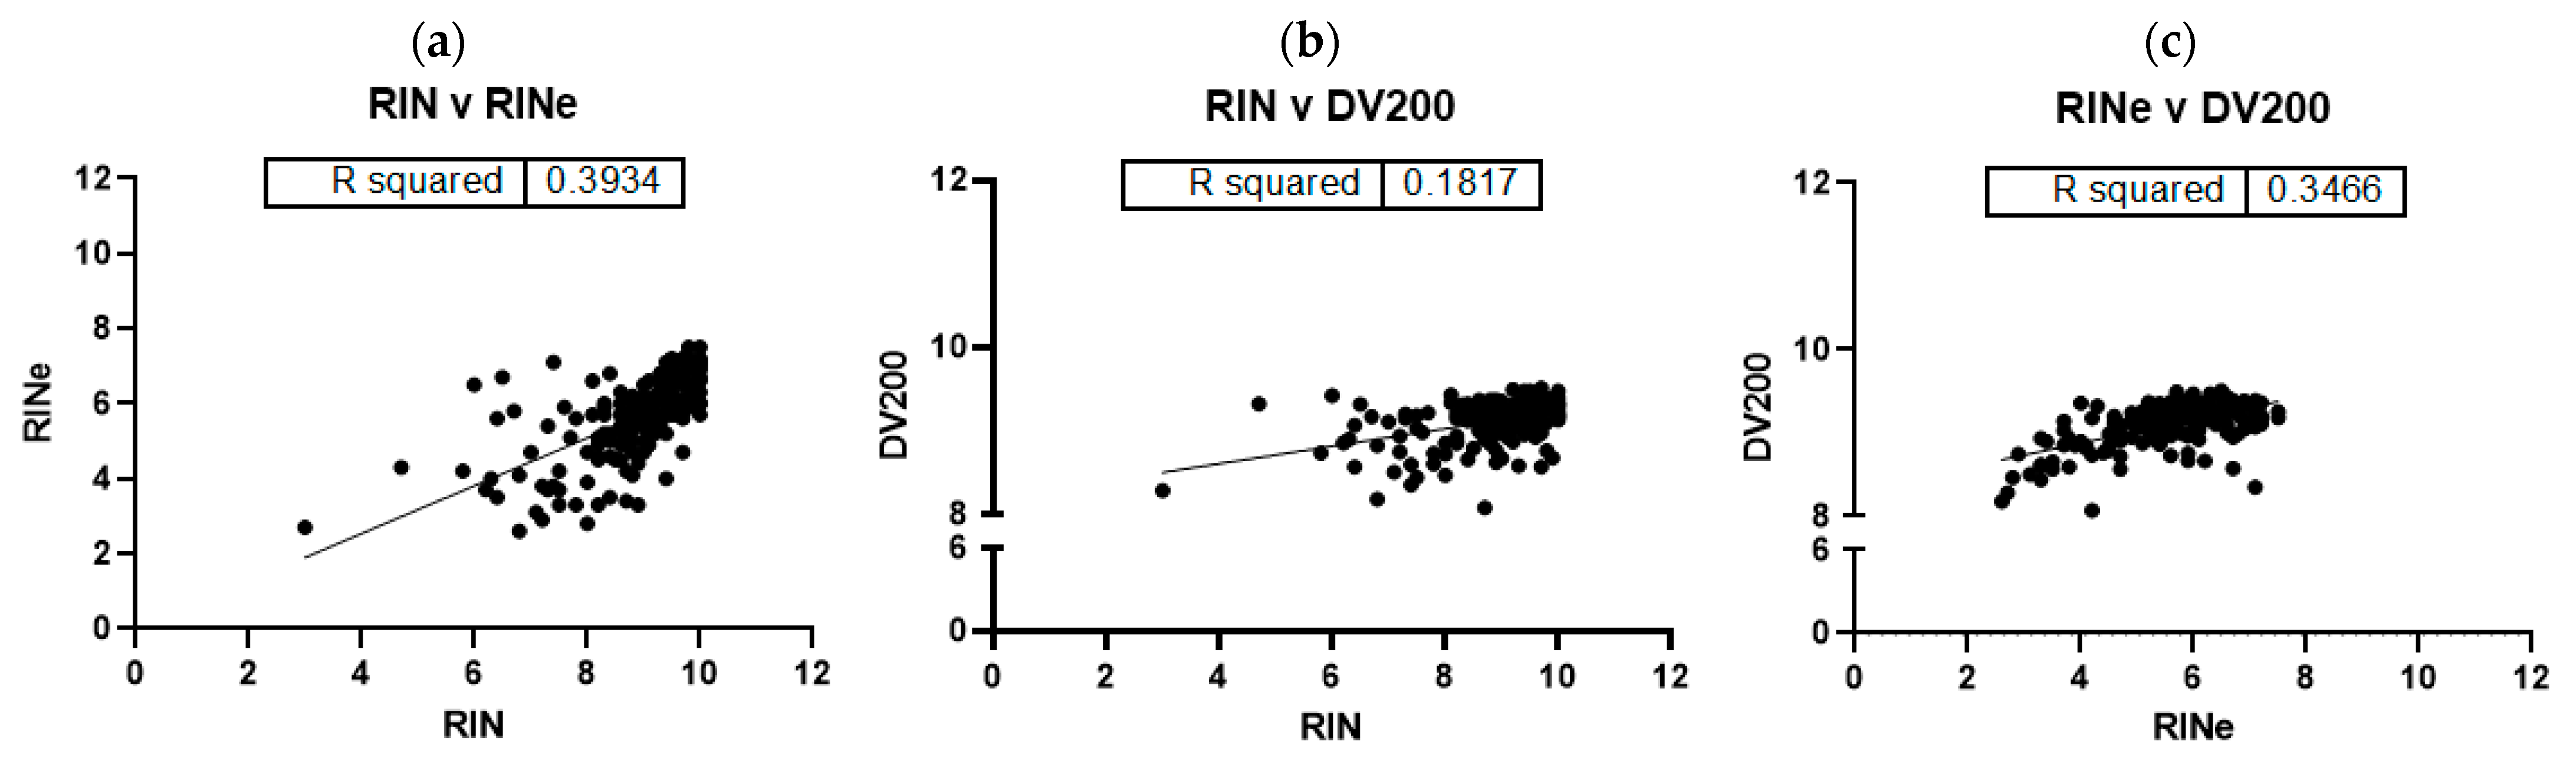
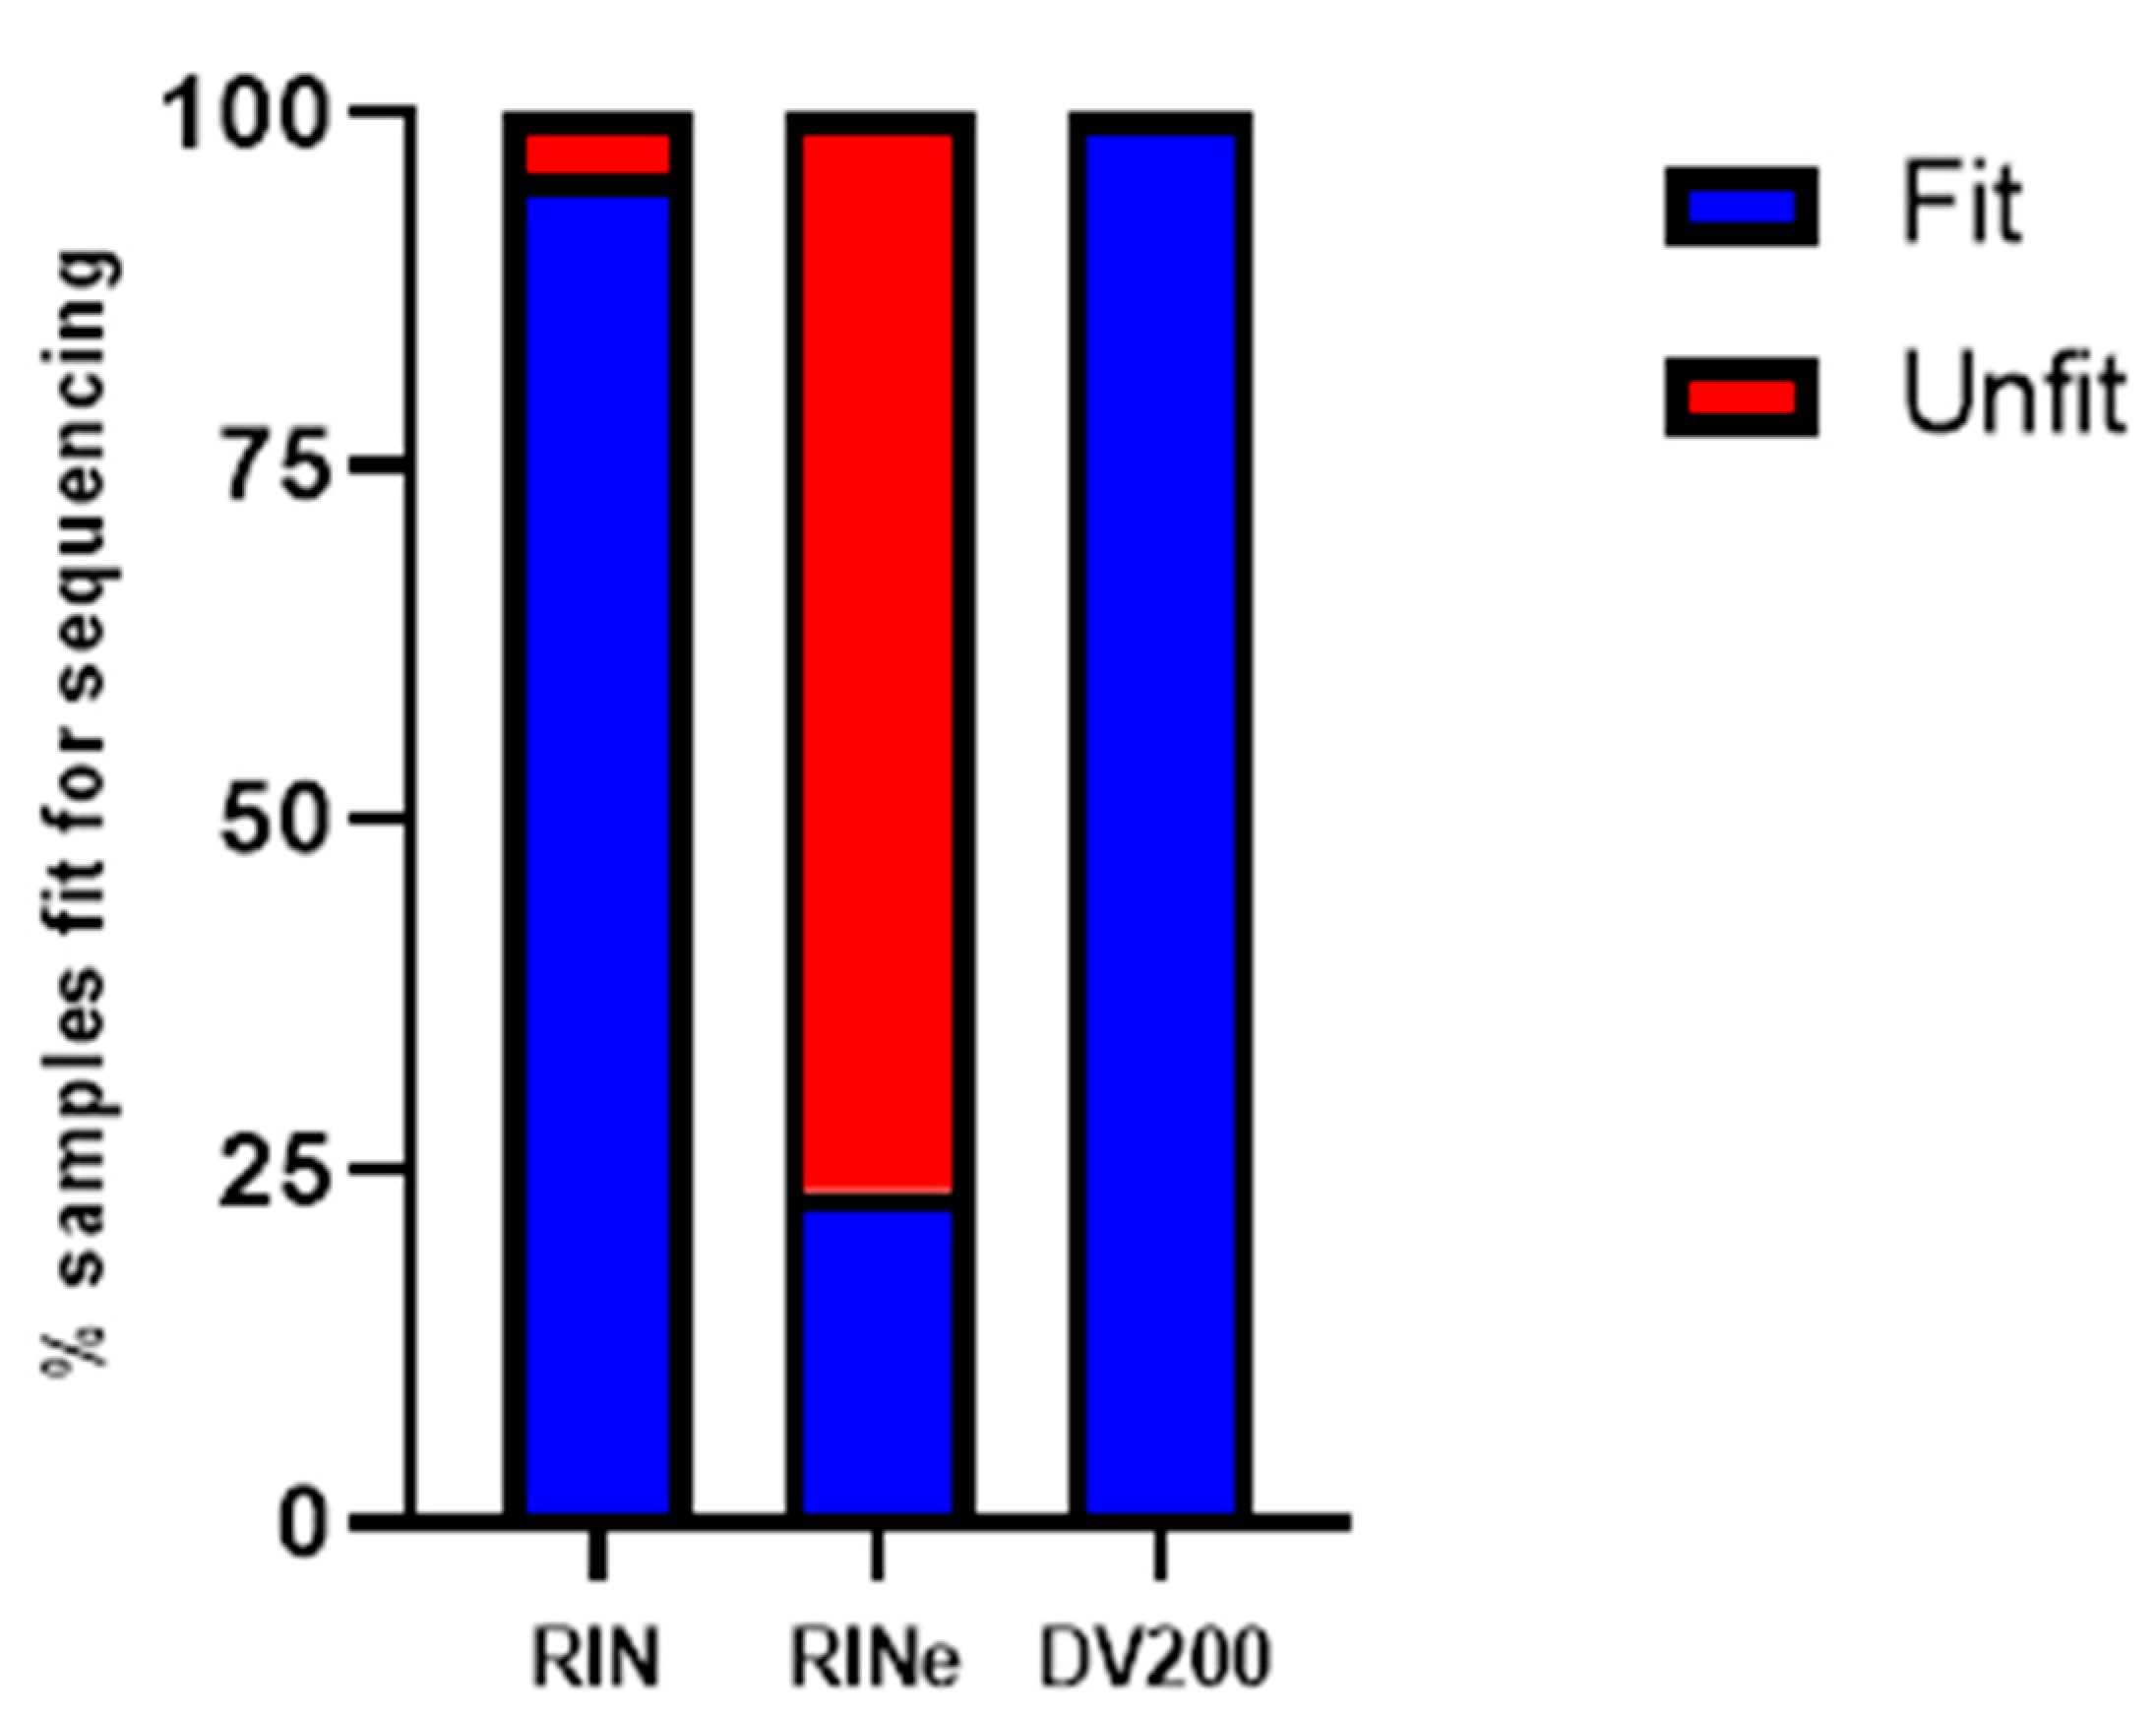
2. Results
3. Discussion
4. Materials and Methods
4.1. Sample Preparation
4.2. Instrument Analysis
Author Contributions
Funding
Institutional Review Board Statement
Informed Consent Statement
Data Availability Statement
Acknowledgments
Conflicts of Interest
References
- Schroeder, A.; Mueller, O.; Stocker, S.; Salowsky, R.; Leiber, M.; Gassmann, M.; Lightfoot, S.; Menzel, W.; Granzow, M.; Ragg, T. The RIN: An RNA integrity number for assigning integrity values to RNA measurements. BMC Mol. Biol. 2006, 7, 3. [Google Scholar] [CrossRef] [PubMed]
- Imbeaud, S. Towards standardization of RNA quality assessment using user-independent classifiers of microcapillary electrophoresis traces. Nucleic Acids Res. 2005, 33, e56. [Google Scholar] [CrossRef] [PubMed]
- Kap, M.; Oomen, M.; Arshad, S.; de Jong, B.; Riegman, P. Fit for Purpose Frozen Tissue Collections by RNA Integrity Number-Based Quality Control Assurance at the Erasmus MC Tissue Bank. Biopreserv. Biobank. 2014, 12, 81–90. [Google Scholar] [CrossRef] [PubMed]
- Romero, I.G.; Pai, A.A.; Tung, J.; Gilad, Y. RNA-seq: Impact of RNA degradation on transcript quantification. BMC Biol. 2014, 12, 42. [Google Scholar]
- Reiman, M.; Laan, M.; Rull, K.; Sõber, S. Effects of RNA integrity on transcript quantification by total RNA sequencing of clinically collected human placental samples. FASEB J. 2017, 31, 3298–3308. [Google Scholar] [CrossRef] [PubMed]
- Lostao, A.; Lim, K.; Pallarés, M.C.; Ptak, A.; Marcuello, C. Recent advances in sensing the inter-biomolecular interactions at the nanoscale—A comprehensive review of AFM-based force spectroscopy. Int. J. Biol. Macromol. 2023, 238, 124089. [Google Scholar] [CrossRef] [PubMed]
- Botti, V.; Cannistraro, S.; Bizzarri, A.R. Interaction of miR-155 with Human Serum Albumin: An Atomic Force Spectroscopy, Fluorescence, FRET, and Computational Modelling Evidence. Int. J. Mol. Sci. 2022, 23, 10728. [Google Scholar] [CrossRef] [PubMed]
- Schon, P. Atomic force microscopy of RNA: State of the art and recent advancements. Semin. Cell Dev. Biol. 2018, 73, 209–219. [Google Scholar] [CrossRef] [PubMed]
- Matsubara, T.; Soh, J.; Morita, M.; Uwabo, T.; Tomida, S.; Fujiwara, T.; Kanazawa, S.; Toyooka, S.; Hirasawa, A. DV200 Index for Assessing RNA Integrity in Next-Generation Sequencing. BioMed Res. Int. 2020, 2020, 9349132. [Google Scholar] [CrossRef] [PubMed]
- Beach, T.G.; Adler, C.H.; Sue, L.I.; Serrano, G.; Shill, H.A.; Walker, D.G.; Lue, L.; Roher, A.E.; Dugger, B.N.; Maarouf, C.; et al. Arizona Study of Aging and Neurodegenerative Disorders and Brain and Body Donation Program. Neuropathology 2015, 35, 354–389. [Google Scholar] [CrossRef] [PubMed]
- Beach, T.G.; Sue, L.I.; Walker, D.G.; Roher, A.E.; Lue, L.; Vedders, L.; Connor, D.J.; Sabbagh, M.N.; Rogers, J. The Sun Health Research Institute Brain Donation Program: Description and experience, 1987–2007. Cell Tissue Bank. 2008, 9, 229–245. [Google Scholar] [CrossRef] [PubMed]
- Birdsill, A.C.; Walker, D.G.; Lue, L.; Sue, L.I.; Beach, T.G. Postmortem interval effect on RNA and gene expression in human brain tissue. Cell Tissue Bank. 2011, 12, 311–318. [Google Scholar] [CrossRef]
- Walker, D.G.; Whetzel, A.M.; Serrano, G.; Sue, L.I.; Lue, L.-F.; Beach, T.G. Characterization of RNA isolated from eighteen different human tissues: Results from a rapid human autopsy program. Cell Tissue Bank. 2016, 17, 361–375. [Google Scholar] [CrossRef] [PubMed]

Disclaimer/Publisher’s Note: The statements, opinions and data contained in all publications are solely those of the individual author(s) and contributor(s) and not of MDPI and/or the editor(s). MDPI and/or the editor(s) disclaim responsibility for any injury to people or property resulting from any ideas, methods, instructions or products referred to in the content. |
© 2023 by the authors. Licensee MDPI, Basel, Switzerland. This article is an open access article distributed under the terms and conditions of the Creative Commons Attribution (CC BY) license (https://creativecommons.org/licenses/by/4.0/).
Share and Cite
Walker, J.E.; Oliver, J.C.; Stewart, A.M.; Beh, S.T.; Arce, R.A.; Glass, M.J.; Vargas, D.E.; Qiji, S.H.; Intorcia, A.J.; Borja, C.I.; et al. Measuring Up: A Comparison of TapeStation 4200 and Bioanalyzer 2100 as Measurement Tools for RNA Quality in Postmortem Human Brain Samples. Int. J. Mol. Sci. 2023, 24, 13795. https://doi.org/10.3390/ijms241813795
Walker JE, Oliver JC, Stewart AM, Beh ST, Arce RA, Glass MJ, Vargas DE, Qiji SH, Intorcia AJ, Borja CI, et al. Measuring Up: A Comparison of TapeStation 4200 and Bioanalyzer 2100 as Measurement Tools for RNA Quality in Postmortem Human Brain Samples. International Journal of Molecular Sciences. 2023; 24(18):13795. https://doi.org/10.3390/ijms241813795
Chicago/Turabian StyleWalker, Jessica E., Javon C. Oliver, Analisa M. Stewart, Suet Theng Beh, Richard A. Arce, Michael J. Glass, Daisy E. Vargas, Sanaria H. Qiji, Anthony J. Intorcia, Claryssa I. Borja, and et al. 2023. "Measuring Up: A Comparison of TapeStation 4200 and Bioanalyzer 2100 as Measurement Tools for RNA Quality in Postmortem Human Brain Samples" International Journal of Molecular Sciences 24, no. 18: 13795. https://doi.org/10.3390/ijms241813795
APA StyleWalker, J. E., Oliver, J. C., Stewart, A. M., Beh, S. T., Arce, R. A., Glass, M. J., Vargas, D. E., Qiji, S. H., Intorcia, A. J., Borja, C. I., Cline, M. P., Hemmingsen, S. J., Krupp, A. N., McHattie, R. D., Mariner, M. R., Lorenzini, I., Aslam, S., Tremblay, C., Beach, T. G., & Serrano, G. E. (2023). Measuring Up: A Comparison of TapeStation 4200 and Bioanalyzer 2100 as Measurement Tools for RNA Quality in Postmortem Human Brain Samples. International Journal of Molecular Sciences, 24(18), 13795. https://doi.org/10.3390/ijms241813795