
In Silico Analysis Reveals the Modulation of Ion Transmembrane Transporters in the Cerebellum of Alzheimer’s Disease Patients

Abstract
:1. Introduction
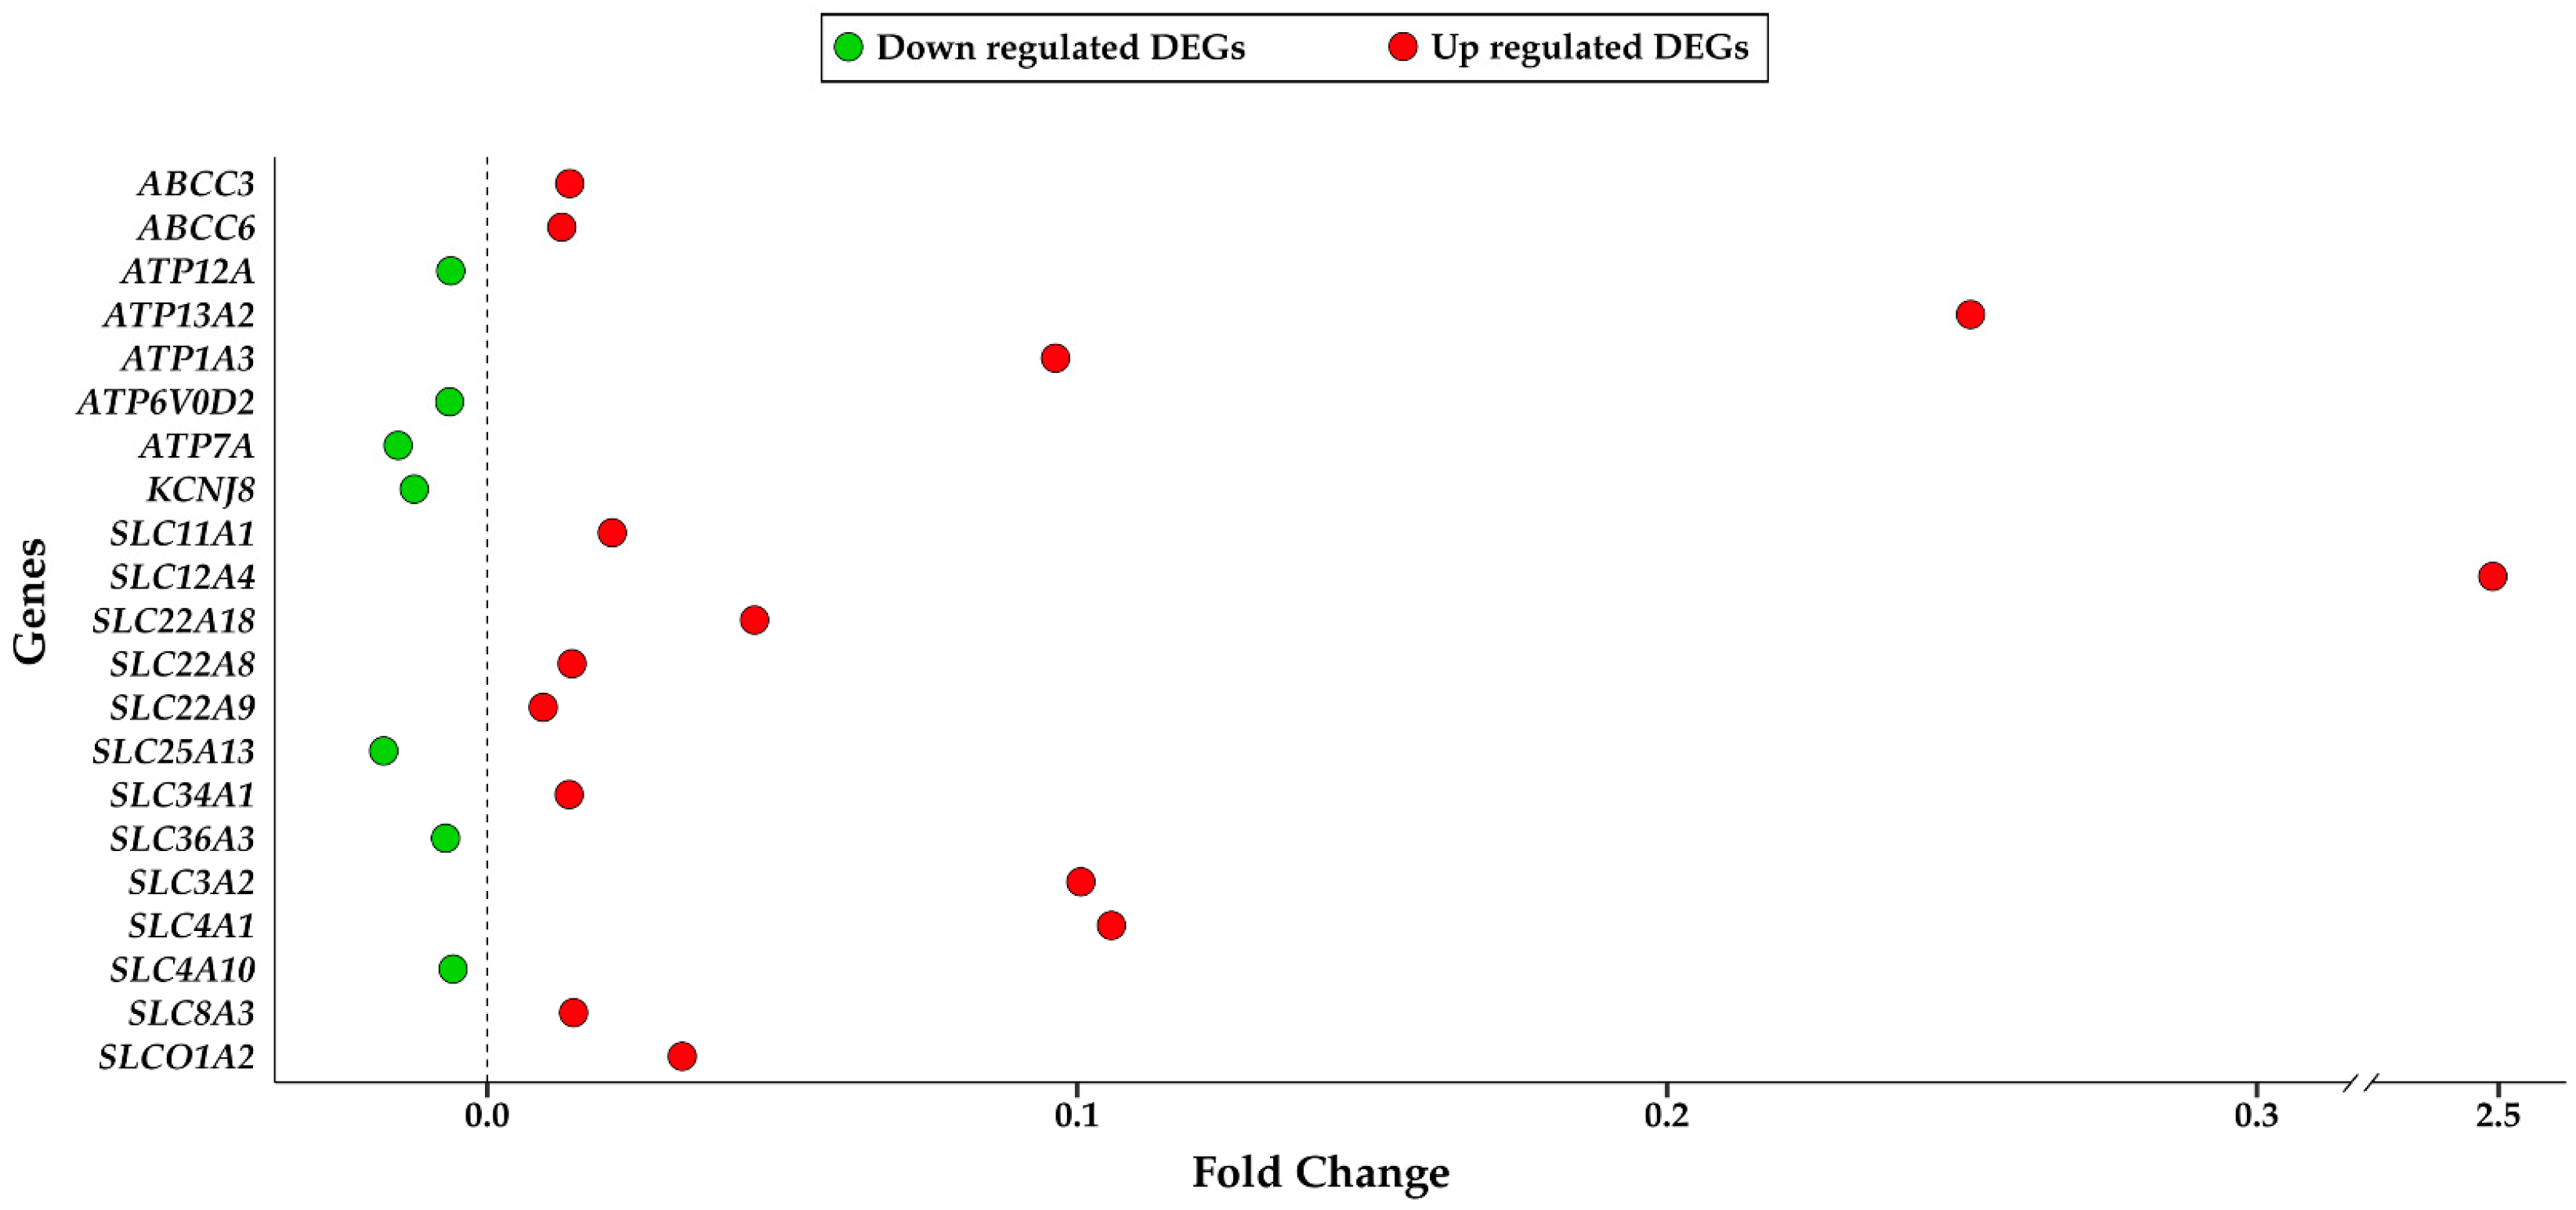
2. Results
3. Discussion
4. Materials and Methods
4.1. Microarray Dataset Selection
4.2. Cohort Information
4.3. Biological Sample Treatment
4.4. Bioinformatic Analysis
5. Conclusions
Supplementary Materials
Author Contributions
Funding
Institutional Review Board Statement
Informed Consent Statement
Data Availability Statement
Conflicts of Interest
References
- Migliore, L.; Coppede, F. Gene-environment interactions in Alzheimer disease: The emerging role of epigenetics. Nat. Rev. Neurol. 2022, 18, 643–660. [Google Scholar] [CrossRef]
- Wagner, J.M.; Sichler, M.E.; Schleicher, E.M.; Franke, T.N.; Irwin, C.; Low, M.J.; Beindorff, N.; Bouter, C.; Bayer, T.A.; Bouter, Y. Analysis of Motor Function in the Tg4-42 Mouse Model of Alzheimer’s Disease. Front. Behav. Neurosci. 2019, 13, 107. [Google Scholar] [CrossRef] [PubMed]
- Efthymiou, A.G.; Goate, A.M. Late onset Alzheimer’s disease genetics implicates microglial pathways in disease risk. Mol. Neurodegener. 2017, 12, 43. [Google Scholar] [CrossRef] [PubMed]
- Van Cauwenberghe, C.; Van Broeckhoven, C.; Sleegers, K. The genetic landscape of Alzheimer disease: Clinical implications and perspectives. Genet. Med. Off. J. Am. Coll. Med. Genet. 2016, 18, 421–430. [Google Scholar] [CrossRef]
- Petit, D.; Fernandez, S.G.; Zoltowska, K.M.; Enzlein, T.; Ryan, N.S.; O’Connor, A.; Szaruga, M.; Hill, E.; Vandenberghe, R.; Fox, N.C.; et al. Abeta profiles generated by Alzheimer’s disease causing PSEN1 variants determine the pathogenicity of the mutation and predict age at disease onset. Mol. Psychiatry 2022, 27, 2821–2832. [Google Scholar] [CrossRef]
- Bettens, K.; Sleegers, K.; Van Broeckhoven, C. Genetic insights in Alzheimer’s disease. Lancet Neurol. 2013, 12, 92–104. [Google Scholar] [CrossRef] [PubMed]
- Basile, M.S.; Bramanti, P.; Mazzon, E. Inosine in Neurodegenerative Diseases: From the Bench to the Bedside. Molecules 2022, 27, 4644. [Google Scholar] [CrossRef]
- Yu, M.; Sporns, O.; Saykin, A.J. The human connectome in Alzheimer disease—Relationship to biomarkers and genetics. Nat. Rev. Neurol. 2021, 17, 545–563. [Google Scholar] [CrossRef]
- Mol, M.O.; van der Lee, S.J.; Hulsman, M.; Pijnenburg, Y.A.L.; Scheltens, P.; Netherlands Brain, B.; Seelaar, H.; van Swieten, J.C.; Kaat, L.D.; Holstege, H.; et al. Mapping the genetic landscape of early-onset Alzheimer’s disease in a cohort of 36 families. Alzheimer’s Res. Ther. 2022, 14, 77. [Google Scholar] [CrossRef]
- Zhang, B.; Gaiteri, C.; Bodea, L.G.; Wang, Z.; McElwee, J.; Podtelezhnikov, A.A.; Zhang, C.; Xie, T.; Tran, L.; Dobrin, R.; et al. Integrated systems approach identifies genetic nodes and networks in late-onset Alzheimer’s disease. Cell 2013, 153, 707–720. [Google Scholar] [CrossRef]
- Chang, C.H.; Lin, C.H.; Lane, H.Y. Machine Learning and Novel Biomarkers for the Diagnosis of Alzheimer’s Disease. Int. J. Mol. Sci. 2021, 22, 2761. [Google Scholar] [CrossRef]
- Pardo-Moreno, T.; Gonzalez-Acedo, A.; Rivas-Dominguez, A.; Garcia-Morales, V.; Garcia-Cozar, F.J.; Ramos-Rodriguez, J.J.; Melguizo-Rodriguez, L. Therapeutic Approach to Alzheimer’s Disease: Current Treatments and New Perspectives. Pharmaceutics 2022, 14, 1117. [Google Scholar] [CrossRef] [PubMed]
- Cascella, R.; Cecchi, C. Calcium Dyshomeostasis in Alzheimer’s Disease Pathogenesis. Int. J. Mol. Sci. 2021, 22, 4914. [Google Scholar] [CrossRef] [PubMed]
- Reardon, S. FDA approves Alzheimer’s drug lecanemab amid safety concerns. Nature 2023, 613, 227–228. [Google Scholar] [CrossRef]
- Yeo-Teh, N.S.L.; Tang, B.L. A Review of Scientific Ethics Issues Associated with the Recently Approved Drugs for Alzheimer’s Disease. Sci. Eng. Ethics 2023, 29, 2. [Google Scholar] [CrossRef]
- Soderberg, L.; Johannesson, M.; Nygren, P.; Laudon, H.; Eriksson, F.; Osswald, G.; Moller, C.; Lannfelt, L. Lecanemab, Aducanumab, and Gantenerumab—Binding Profiles to Different Forms of Amyloid-Beta Might Explain Efficacy and Side Effects in Clinical Trials for Alzheimer’s Disease. Neurother. J. Am. Soc. Exp. NeuroTherapeutics 2022, 20, 195–206. [Google Scholar] [CrossRef]
- Dou, K.X.; Tan, M.S.; Tan, C.C.; Cao, X.P.; Hou, X.H.; Guo, Q.H.; Tan, L.; Mok, V.; Yu, J.T. Comparative safety and effectiveness of cholinesterase inhibitors and memantine for Alzheimer’s disease: A network meta-analysis of 41 randomized controlled trials. Alzheimer’s Res. Ther. 2018, 10, 126. [Google Scholar] [CrossRef] [PubMed]
- Long, J.M.; Holtzman, D.M. Alzheimer Disease: An Update on Pathobiology and Treatment Strategies. Cell 2019, 179, 312–339. [Google Scholar] [CrossRef] [PubMed]
- Nikolac Perkovic, M.; Pivac, N. Genetic Markers of Alzheimer’s Disease. Adv. Exp. Med. Biol. 2019, 1192, 27–52. [Google Scholar] [CrossRef]
- Tzioras, M.; McGeachan, R.I.; Durrant, C.S.; Spires-Jones, T.L. Synaptic degeneration in Alzheimer disease. Nat. Rev. Neurol. 2023, 19, 19–38. [Google Scholar] [CrossRef]
- Huang, P.; Yang, Y.H.; Chang, Y.H.; Chang, S.L.; Chou, M.C.; Lai, C.L.; Liu, C.K.; Chen, H.Y. Association of early-onset Alzheimer’s disease with germline-generated high affinity self-antigen load. Transl. Psychiatry 2020, 10, 146. [Google Scholar] [CrossRef]
- Knopman, D.S.; Amieva, H.; Petersen, R.C.; Chetelat, G.; Holtzman, D.M.; Hyman, B.T.; Nixon, R.A.; Jones, D.T. Alzheimer disease. Nat. Rev. Dis. Primers 2021, 7, 33. [Google Scholar] [CrossRef]
- Petralia, M.C.; Battaglia, G.; Bruno, V.; Pennisi, M.; Mangano, K.; Lombardo, S.D.; Fagone, P.; Cavalli, E.; Saraceno, A.; Nicoletti, F.; et al. The Role of Macrophage Migration Inhibitory Factor in Alzheimer’s Disease: Conventionally Pathogenetic or Unconventionally Protective? Molecules 2020, 25, 291. [Google Scholar] [CrossRef] [PubMed]
- Jacobs, H.I.L.; Hopkins, D.A.; Mayrhofer, H.C.; Bruner, E.; van Leeuwen, F.W.; Raaijmakers, W.; Schmahmann, J.D. The cerebellum in Alzheimer’s disease: Evaluating its role in cognitive decline. Brain A J. Neurol. 2018, 141, 37–47. [Google Scholar] [CrossRef]
- Pons, V.; Rivest, S. Targeting Systemic Innate Immune Cells as a Therapeutic Avenue for Alzheimer Disease. Pharmacol. Rev. 2022, 74, 1–17. [Google Scholar] [CrossRef]
- Yao, Q.; Tang, F.; Wang, Y.; Yan, Y.; Dong, L.; Wang, T.; Zhu, D.; Tian, M.; Lin, X.; Shi, J. Effect of cerebellum stimulation on cognitive recovery in patients with Alzheimer disease: A randomized clinical trial. Brain Stimul. 2022, 15, 910–920. [Google Scholar] [CrossRef] [PubMed]
- Singh-Bains, M.K.; Linke, V.; Austria, M.D.R.; Tan, A.Y.S.; Scotter, E.L.; Mehrabi, N.F.; Faull, R.L.M.; Dragunow, M. Altered microglia and neurovasculature in the Alzheimer’s disease cerebellum. Neurobiol. Dis. 2019, 132, 104589. [Google Scholar] [CrossRef]
- Hoxha, E.; Lippiello, P.; Zurlo, F.; Balbo, I.; Santamaria, R.; Tempia, F.; Miniaci, M.C. The Emerging Role of Altered Cerebellar Synaptic Processing in Alzheimer’s Disease. Front. Aging Neurosci. 2018, 10, 396. [Google Scholar] [CrossRef]
- Vitvitsky, V.M.; Garg, S.K.; Keep, R.F.; Albin, R.L.; Banerjee, R. Na+ and K+ ion imbalances in Alzheimer’s disease. Biochim. Et Biophys. Acta 2012, 1822, 1671–1681. [Google Scholar] [CrossRef] [PubMed]
- Pannaccione, A.; Piccialli, I.; Secondo, A.; Ciccone, R.; Molinaro, P.; Boscia, F.; Annunziato, L. The Na+/Ca2+ exchanger in Alzheimer’s disease. Cell Calcium 2020, 87, 102190. [Google Scholar] [CrossRef] [PubMed]
- Lombardo, S.D.; Mazzon, E.; Basile, M.S.; Campo, G.; Corsico, F.; Presti, M.; Bramanti, P.; Mangano, K.; Petralia, M.C.; Nicoletti, F.; et al. Modulation of Tetraspanin 32 (TSPAN32) Expression in T Cell-Mediated Immune Responses and in Multiple Sclerosis. Int. J. Mol. Sci. 2019, 20, 4323. [Google Scholar] [CrossRef] [PubMed]
- Cavalli, E.; Battaglia, G.; Basile, M.S.; Bruno, V.; Petralia, M.C.; Lombardo, S.D.; Pennisi, M.; Kalfin, R.; Tancheva, L.; Fagone, P.; et al. Exploratory Analysis of iPSCS-Derived Neuronal Cells as Predictors of Diagnosis and Treatment of Alzheimer Disease. Brain Sci. 2020, 10, 166. [Google Scholar] [CrossRef] [PubMed]
- Ridge, P.G.; Mukherjee, S.; Crane, P.K.; Kauwe, J.S.; Alzheimer’s Disease Genetics, C. Alzheimer’s disease: Analyzing the missing heritability. PLoS ONE 2013, 8, e79771. [Google Scholar] [CrossRef]
- Piccialli, I.; Ciccone, R.; Secondo, A.; Boscia, F.; Tedeschi, V.; de Rosa, V.; Cepparulo, P.; Annunziato, L.; Pannaccione, A. The Na+/Ca2+ Exchanger 3 Is Functionally Coupled With the NaV1.6 Voltage-Gated Channel and Promotes an Endoplasmic Reticulum Ca2+ Refilling in a Transgenic Model of Alzheimer’s Disease. Front. Pharmacol. 2021, 12, 775271. [Google Scholar] [CrossRef]
- Wang, L.; Yin, Y.L.; Liu, X.Z.; Shen, P.; Zheng, Y.G.; Lan, X.R.; Lu, C.B.; Wang, J.Z. Current understanding of metal ions in the pathogenesis of Alzheimer’s disease. Transl. Neurodegener. 2020, 9, 10. [Google Scholar] [CrossRef]
- Martins, A.C., Jr.; Morcillo, P.; Ijomone, O.M.; Venkataramani, V.; Harrison, F.E.; Lee, E.; Bowman, A.B.; Aschner, M. New Insights on the Role of Manganese in Alzheimer’s Disease and Parkinson’s Disease. Int. J. Environ. Res. Public Health 2019, 16, 3546. [Google Scholar] [CrossRef] [PubMed]
- Smith, M.A.; Zhu, X.; Tabaton, M.; Liu, G.; McKeel, D.W., Jr.; Cohen, M.L.; Wang, X.; Siedlak, S.L.; Dwyer, B.E.; Hayashi, T.; et al. Increased iron and free radical generation in preclinical Alzheimer disease and mild cognitive impairment. J. Alzheimer’s Dis. JAD 2010, 19, 363–372. [Google Scholar] [CrossRef]
- Vasiliou, V.; Vasiliou, K.; Nebert, D.W. Human ATP-binding cassette (ABC) transporter family. Hum. Genom. 2009, 3, 281–290. [Google Scholar] [CrossRef]
- Gil-Martins, E.; Barbosa, D.J.; Silva, V.; Remiao, F.; Silva, R. Dysfunction of ABC transporters at the blood-brain barrier: Role in neurological disorders. Pharmacol. Ther. 2020, 213, 107554. [Google Scholar] [CrossRef]
- Wang, L.; Yu, C.; Tao, Y.; Yang, X.; Jiang, Q.; Yu, H.; Zhang, J. Transcriptome analysis reveals potential marker genes for diagnosis of Alzheimer’s disease and vascular dementia. Front. Genet. 2022, 13, 1038585. [Google Scholar] [CrossRef]
- Zhang, L.N.; Sun, Y.J.; Pan, S.; Li, J.X.; Qu, Y.E.; Li, Y.; Wang, Y.L.; Gao, Z.B. Na+-K+-ATPase, a potent neuroprotective modulator against Alzheimer disease. Fundam. Clin. Pharmacol. 2013, 27, 96–103. [Google Scholar] [CrossRef] [PubMed]
- Ohnishi, T.; Yanazawa, M.; Sasahara, T.; Kitamura, Y.; Hiroaki, H.; Fukazawa, Y.; Kii, I.; Nishiyama, T.; Kakita, A.; Takeda, H.; et al. Na, K-ATPase alpha3 is a death target of Alzheimer patient amyloid-beta assembly. Proc. Natl. Acad. Sci. USA 2015, 112, E4465–E4474. [Google Scholar] [CrossRef] [PubMed]
- Shrivastava, A.N.; Redeker, V.; Pieri, L.; Bousset, L.; Renner, M.; Madiona, K.; Mailhes-Hamon, C.; Coens, A.; Buee, L.; Hantraye, P.; et al. Clustering of Tau fibrils impairs the synaptic composition of alpha3-Na+/K+-ATPase and AMPA receptors. EMBO J. 2019, 38, e99871. [Google Scholar] [CrossRef]
- Macreadie, I.G. Copper transport and Alzheimer’s disease. Eur. Biophys. J. EBJ 2008, 37, 295–300. [Google Scholar] [CrossRef]
- Bellingham, S.A.; Lahiri, D.K.; Maloney, B.; La Fontaine, S.; Multhaup, G.; Camakaris, J. Copper depletion down-regulates expression of the Alzheimer’s disease amyloid-beta precursor protein gene. J. Biol. Chem. 2004, 279, 20378–20386. [Google Scholar] [CrossRef] [PubMed]
- Zheng, Z.; White, C.; Lee, J.; Peterson, T.S.; Bush, A.I.; Sun, G.Y.; Weisman, G.A.; Petris, M.J. Altered microglial copper homeostasis in a mouse model of Alzheimer’s disease. J. Neurochem. 2010, 114, 1630–1638. [Google Scholar] [CrossRef]
- Davies, K.M.; Hare, D.J.; Cottam, V.; Chen, N.; Hilgers, L.; Halliday, G.; Mercer, J.F.; Double, K.L. Localization of copper and copper transporters in the human brain. Met. Integr. Biometal Sci. 2013, 5, 43–51. [Google Scholar] [CrossRef]
- Ramirez, A.; Heimbach, A.; Grundemann, J.; Stiller, B.; Hampshire, D.; Cid, L.P.; Goebel, I.; Mubaidin, A.F.; Wriekat, A.L.; Roeper, J.; et al. Hereditary parkinsonism with dementia is caused by mutations in ATP13A2, encoding a lysosomal type 5 P-type ATPase. Nat. Genet. 2006, 38, 1184–1191. [Google Scholar] [CrossRef]
- Puris, E.; Saveleva, L.; de Sousa Maciel, I.; Kanninen, K.M.; Auriola, S.; Fricker, G. Protein Expression of Amino Acid Transporters Is Altered in Isolated Cerebral Microvessels of 5xFAD Mouse Model of Alzheimer’s Disease. Mol. Neurobiol. 2023, 60, 732–748. [Google Scholar] [CrossRef]
- Puris, E.; Auriola, S.; Petralla, S.; Hartman, R.; Gynther, M.; de Lange, E.C.M.; Fricker, G. Altered protein expression of membrane transporters in isolated cerebral microvessels and brain cortex of a rat Alzheimer’s disease model. Neurobiol. Dis. 2022, 169, 105741. [Google Scholar] [CrossRef]
- Wostyn, P.; van Dam, D.; Audenaert, K.; de Deyn, P.P. Genes involved in cerebrospinal fluid production as candidate genes for late-onset Alzheimer’s disease: A hypothesis. J. Neurogenet. 2011, 25, 195–200. [Google Scholar] [CrossRef]
- Wostyn, P.; Audenaert, K.; De Deyn, P.P. Choroidal Proteins Involved in Cerebrospinal Fluid Production may be Potential Drug Targets for Alzheimer’s Disease Therapy. Perspect. Med. Chem. 2011, 5, 11–17. [Google Scholar] [CrossRef] [PubMed]
- Saad, M.; Brkanac, Z.; Wijsman, E.M. Family-based genome scan for age at onset of late-onset Alzheimer’s disease in whole exome sequencing data. Genes Brain Behav. 2015, 14, 607–617. [Google Scholar] [CrossRef] [PubMed]
- Moriguchi, S.; Kita, S.; Fukaya, M.; Osanai, M.; Inagaki, R.; Sasaki, Y.; Izumi, H.; Horie, K.; Takeda, J.; Saito, T.; et al. Reduced expression of Na+/Ca2+ exchangers is associated with cognitive deficits seen in Alzheimer’s disease model mice. Neuropharmacology 2018, 131, 291–303. [Google Scholar] [CrossRef] [PubMed]
- Moriguchi, S.; Kita, S.; Iwamoto, T.; Fukunaga, K. Dysfunction of Na+/Ca2+ exchangers is associated with cognitive decline in Alzheimer’s disease. Nihon Yakurigaku Zasshi. Folia Pharmacol. Jpn. 2018, 152, 299–305. [Google Scholar] [CrossRef]
- Afewerky, H.K.; Li, H.; Zhang, T.; Li, X.; Mahaman, Y.A.R.; Duan, L.; Qin, P.; Zheng, J.; Pei, L.; Lu, Y. Sodium-calcium exchanger isoform-3 targeted Withania somnifera (L.) Dunal therapeutic intervention ameliorates cognition in the 5xFAD mouse model of Alzheimer’s disease. Sci. Rep. 2022, 12, 1537. [Google Scholar] [CrossRef]
- Atherton, J.; Kurbatskaya, K.; Bondulich, M.; Croft, C.L.; Garwood, C.J.; Chhabra, R.; Wray, S.; Jeromin, A.; Hanger, D.P.; Noble, W. Calpain cleavage and inactivation of the sodium calcium exchanger-3 occur downstream of Abeta in Alzheimer’s disease. Aging Cell 2014, 13, 49–59. [Google Scholar] [CrossRef] [PubMed]
- Annunziato, L.; Secondo, A.; Pignataro, G.; Scorziello, A.; Molinaro, P. New perspectives for selective NCX activators in neurodegenerative diseases. Cell Calcium 2020, 87, 102170. [Google Scholar] [CrossRef] [PubMed]
- Sokolow, S.; Luu, S.H.; Headley, A.J.; Hanson, A.Y.; Kim, T.; Miller, C.A.; Vinters, H.V.; Gylys, K.H. High levels of synaptosomal Na+-Ca2+ exchangers (NCX1, NCX2, NCX3) co-localized with amyloid-beta in human cerebral cortex affected by Alzheimer’s disease. Cell Calcium 2011, 49, 208–216. [Google Scholar] [CrossRef]
- Pannaccione, A.; Secondo, A.; Molinaro, P.; D’Avanzo, C.; Cantile, M.; Esposito, A.; Boscia, F.; Scorziello, A.; Sirabella, R.; Sokolow, S.; et al. A new concept: Abeta1-42 generates a hyperfunctional proteolytic NCX3 fragment that delays caspase-12 activation and neuronal death. J. Neurosci. Off. J. Soc. Neurosci. 2012, 32, 10609–10617. [Google Scholar] [CrossRef]
- Aso, Y.; Kimura, N.; Matsubara, E. Novel Serum Biomarkers of Neurovascular Unit Associated with Cortical Amyloid Deposition. J. Alzheimer’s Dis. JAD 2021, 84, 905–914. [Google Scholar] [CrossRef] [PubMed]
- Chappell, S.; Patel, T.; Guetta-Baranes, T.; Sang, F.; Francis, P.T.; Morgan, K.; Brookes, K.J. Observations of extensive gene expression differences in the cerebellum and potential relevance to Alzheimer’s disease. BMC Res. Notes 2018, 11, 646. [Google Scholar] [CrossRef]
- Mielke, M.M.; Vemuri, P.; Rocca, W.A. Clinical epidemiology of Alzheimer’s disease: Assessing sex and gender differences. Clin. Epidemiol. 2014, 6, 37–48. [Google Scholar] [CrossRef] [PubMed]
- Barrett, T.; Wilhite, S.E.; Ledoux, P.; Evangelista, C.; Kim, I.F.; Tomashevsky, M.; Marshall, K.A.; Phillippy, K.H.; Sherman, P.M.; Holko, M.; et al. NCBI GEO: Archive for functional genomics data sets—Update. Nucleic Acids Res. 2013, 41, D991–D995. [Google Scholar] [CrossRef]
- Barrett, T.; Troup, D.B.; Wilhite, S.E.; Ledoux, P.; Evangelista, C.; Kim, I.F.; Tomashevsky, M.; Marshall, K.A.; Phillippy, K.H.; Sherman, P.M.; et al. NCBI GEO: Archive for functional genomics data sets—10 years on. Nucleic Acids Res. 2011, 39, D1005–D1010. [Google Scholar] [CrossRef]
- Clough, E.; Barrett, T. The Gene Expression Omnibus Database. Methods Mol. Biol. 2016, 1418, 93–110. [Google Scholar] [CrossRef] [PubMed]
- Sealfon, S.C.; Chu, T.T. RNA and DNA microarrays. Methods Mol. Biol. 2011, 671, 3–34. [Google Scholar] [CrossRef] [PubMed]
- Ritchie, M.E.; Phipson, B.; Wu, D.; Hu, Y.; Law, C.W.; Shi, W.; Smyth, G.K. limma powers differential expression analyses for RNA-sequencing and microarray studies. Nucleic Acids Res. 2015, 43, e47. [Google Scholar] [CrossRef]
- Gentleman, R.C.; Carey, V.J.; Bates, D.M.; Bolstad, B.; Dettling, M.; Dudoit, S.; Ellis, B.; Gautier, L.; Ge, Y.; Gentry, J.; et al. Bioconductor: Open software development for computational biology and bioinformatics. Genome Biol. 2004, 5, R80. [Google Scholar] [CrossRef]
- Yu, G.; Wang, L.G.; Han, Y.; He, Q.Y. clusterProfiler: An R package for comparing biological themes among gene clusters. Omics A J. Integr. Biol. 2012, 16, 284–287. [Google Scholar] [CrossRef]

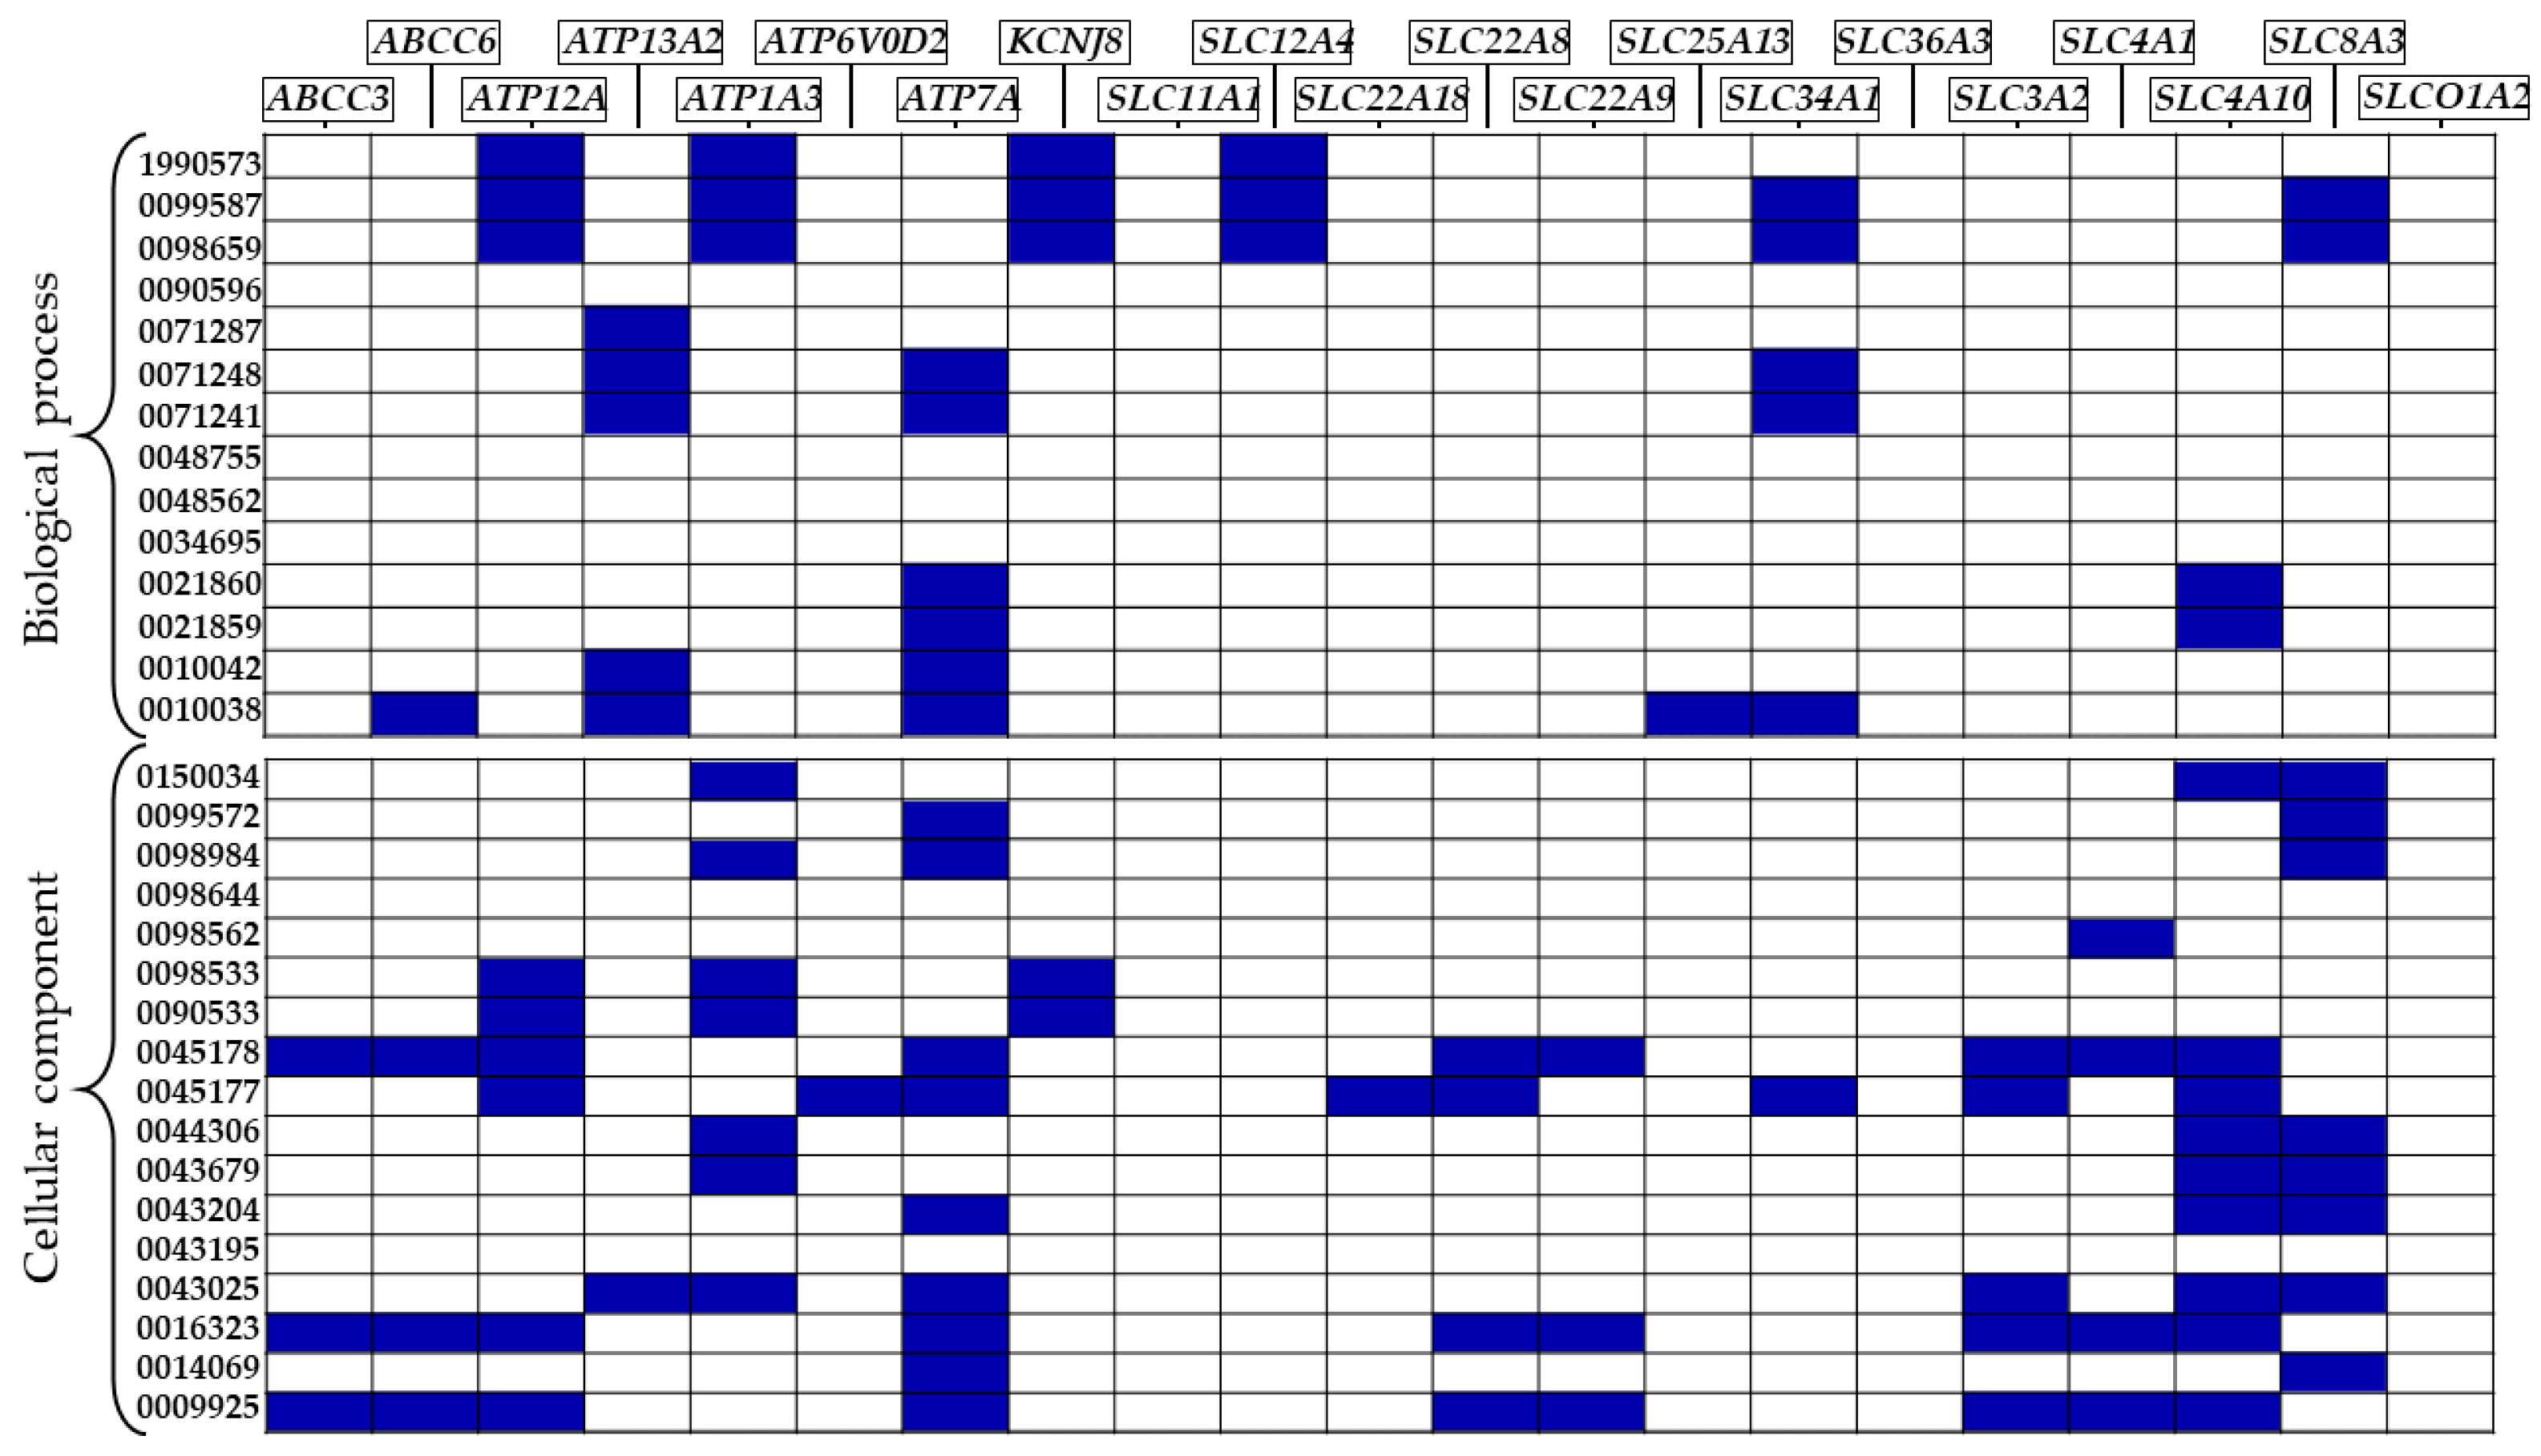
| GO | ID | Description | DEGs |
|---|---|---|---|
| BP | GO:0021860 | pyramidal neuron development | ATP7A, SLC4A10 |
| GO:0021859 | pyramidal neuron differentiation | ATP7A, SLC4A10 | |
| GO:0071287 | cellular response to manganese ion | ATP13A2 | |
| GO:0010042 | response to manganese ion | ATP13A2, ATP7A | |
| GO:1990573 | potassium ion import across plasma membra | ATP12A, ATP1A3, KCNJ8, SLC12A4 | |
| GO:0098659 | inorganic cation import across plasma membrane | ATP12A, ATP1A3, KCNJ8, SLC12A4, SLC34A1, SLC8A3 | |
| GO:0099587 | inorganic ion import across plasma membrane | ATP12A, ATP1A3, KCNJ8, SLC12A4, SLC34A1, SLC8A3 | |
| GO:0071248 | cellular response to metal ion | ATP13A2, ATP7A, SLC34A1 | |
| GO:0071241 | cellular response to inorganic substance | ATP13A2, ATP7A, SLC34A1 | |
| GO:0010038 | response to metal ion | ABCC6, ATP13A2, ATP7A, SLC25A13, SLC34A1 | |
| CC | GO:0090533 | cation-transporting ATPase complex | ATP12A, ATP1A3, KCNJ8 |
| GO:0098533 | ATPase dependent transmembrane transport complex | ATP12A, ATP1A3, KCNJ8 | |
| GO:0043679 | axon terminus | ATP1A3, SLC4A10, SLC8A3 | |
| GO:0044306 | neuron projection terminus | ATP1A3, SLC4A10, SLC8A3 | |
| GO:0043204 | perikaryon | ATP7A, SLC4A10, SLC8A3 | |
| GO:0016323 | basolateral plasma membrane | ABCC3, ABCC6, ATP12A, ATP7A, SLC22A8, SLC22A9, SLC3A2, SLC4A1, SLC4A10 | |
| GO:0098562 | cytoplasmic side of membrane | SLC4A1 | |
| GO:0009925 | basal plasma membrane | ABCC3, ABCC6, ATP12A, ATP7A, SLC22A8, SLC22A9, SLC3A2, SLC4A1, SLC4A10 | |
| GO:0045178 | basal part of cell | ABCC3, ABCC6, ATP12A, ATP7A, SLC22A8, SLC22A9, SLC3A2, SLC4A1, SLC4A10 | |
| GO:0150034 | distal axon | ATP1A3, SLC4A10, SLC8A3 | |
| GO:0043025 | neuronal cell body | ATP13A2, ATP1A3, ATP7A, SLC3A2, SLC4A10, SLC8A3 | |
| GO:0098984 | neuron to neuron synapse | ATP1A3, ATP7A, SLC8A3 | |
| GO:0014069 | postsynaptic density | ATP7A, SLC8A3 | |
| GO:0099572 | postsynaptic specialization | ATP7A, SLC8A3 | |
| GO:0045177 | apical part of cell | ATP12A, ATP6V0D2, ATP7A, SLC22A18, SLC22A8, SLC34A1, SLC3A2, SLC4A10 |
| Condition | Sex | Age | PMI | |
|---|---|---|---|---|
| F | M | |||
| AD | 67 (51.9%) | 62 (48.1%) | 80.1 ± 9.3 | 13.7 ± 7.6 |
| non-AD | 19 (18.8%) | 82 (81.2%) | 62.1 ± 10.8 | 22.4 ± 5.8 |
| Brain Area | Condition | pH | RIN |
|---|---|---|---|
| Cerebellum | AD | 6.4 ± 0.3 | 6.7 ± 0.5 |
| non-AD | 6.6 ± 0.2 | 6.7 ± 0.4 | |
| Prefrontal cortex | AD | 6.3 ± 0.3 | 7.1 ± 0.6 |
| non-AD | 6.6 ± 0.3 | 7.3 ± 0.5 | |
| Visual cortex | AD | 6.3 ± 0.3 | 6.7 ± 0.6 |
| non-AD | 6.5 ± 0.3 | 7.1 ± 0.5 |
Disclaimer/Publisher’s Note: The statements, opinions and data contained in all publications are solely those of the individual author(s) and contributor(s) and not of MDPI and/or the editor(s). MDPI and/or the editor(s) disclaim responsibility for any injury to people or property resulting from any ideas, methods, instructions or products referred to in the content. |
© 2023 by the authors. Licensee MDPI, Basel, Switzerland. This article is an open access article distributed under the terms and conditions of the Creative Commons Attribution (CC BY) license (https://creativecommons.org/licenses/by/4.0/).
Share and Cite
D’Angiolini, S.; Basile, M.S.; Mazzon, E.; Gugliandolo, A. In Silico Analysis Reveals the Modulation of Ion Transmembrane Transporters in the Cerebellum of Alzheimer’s Disease Patients. Int. J. Mol. Sci. 2023, 24, 13924. https://doi.org/10.3390/ijms241813924
D’Angiolini S, Basile MS, Mazzon E, Gugliandolo A. In Silico Analysis Reveals the Modulation of Ion Transmembrane Transporters in the Cerebellum of Alzheimer’s Disease Patients. International Journal of Molecular Sciences. 2023; 24(18):13924. https://doi.org/10.3390/ijms241813924
Chicago/Turabian StyleD’Angiolini, Simone, Maria Sofia Basile, Emanuela Mazzon, and Agnese Gugliandolo. 2023. "In Silico Analysis Reveals the Modulation of Ion Transmembrane Transporters in the Cerebellum of Alzheimer’s Disease Patients" International Journal of Molecular Sciences 24, no. 18: 13924. https://doi.org/10.3390/ijms241813924