Article

Binding of YY1/CREB to an Enhancer Region Triggers Claudin 6 Expression in H. pylori LPS-Stimulated AGS Cells

by
Jorge H. Romero-Estrada
,
Luis F. Montaño
* and
Erika P. Rendón-Huerta
*
Laboratorio de Inmunobiología, Departamento de Biología Celular y Tisular, Facultad de Medicina, Ciudad Universitaria, Ciudad de México 04510, Mexico
*
Authors to whom correspondence should be addressed.
Int. J. Mol. Sci. 2023, 24(18), 13974; https://doi.org/10.3390/ijms241813974
Submission received: 22 August 2023 / Revised: 6 September 2023 / Accepted: 8 September 2023 / Published: 12 September 2023
(This article belongs to the Section Molecular Biology)

Abstract

:
Aberrant expression of the tight junction protein claudin 6 (CLDN6) is a hallmark of gastric cancer progression. Its expression is regulated by the cAMP response element-binding protein (CREB). In gastric cancer induced by Helicobacter pylori (H. pylori) there is no information regarding what transcription factors induce/upregulate the expression of CLDN6. We aimed to identify whether CREB and Yin Yang1 (YY1) regulate the expression of CLDN6 and the site where they bind to the promoter sequence. Bioinformatics analysis, H. pylori lipopolysaccharide (LPS), YY1 and CREB silencing, Western blot, luciferase assays, and chromatin immunoprecipitation experiments were performed using the stomach gastric adenocarcinoma cell line AGS. A gen reporter assay suggested that the initial 2000 bp contains the regulatory sequence associated with CLDN6 transcription; the luciferase assay demonstrated three different regions with transcriptional activity, but the −901 to −1421 bp region displayed the maximal transcriptional activity in response to LPS. Fragment 1279–1421 showed CREB and, surprisingly, YY1 occupancy. Sequential Chromatin Immunoprecipitation (ChIP) experiments confirmed that YY1 and CREB interact in the 1279–1421 region. Our results suggest that CLDN6 expression is regulated by the binding of YY1 and CREB in the 901–1421 enhancer, in which a non-described interaction of YY1 with CREB was established in the 1279–1421 region.

1. Introduction

Epithelial tight junctions are dynamic structures formed via the aggregation of several different transmembrane proteins (Zonula occludens-1, occludins, junctional adhesion molecules, Marvel3, and claudins) [1] that determine the barrier properties between the plasma membranes of adjacent cells [2]. Claudins are a family of 27 different proteins [3] whose homo- and heterodimeric interactions form tight junction strands in a tissue-specific combination and exert pore-forming activity [4,5]. CLDN6 expression is developmentally regulated in embryonic epithelia [6], mainly the fetal stomach, lung, and kidney [7], and rarely in healthy adult tissues [8]. Deregulation of CLDN6 expression and distribution has been associated with epithelial cancer progression [9] in non-small-cell lung, ovarian, cervical, and breast carcinomas [10,11,12,13], but in the latter, its function as a tumor-promoting or tumor suppressor gene has been recognized [14,15]. Similarly, abnormal expression of CLDN6 has been widely recognized in gastric cancer [16,17], in which its expression has been clearly associated with enhanced invasiveness and metastatic properties [18,19] via well-defined transcription factors [20]. Extended exposure to H. pylori LPS increases the expression of CLDN6 in AGS cells [21].
Mongolian gerbils infected with H. pylori show up-regulation and activation of CREB that correlate with early cellular inflammation and ulceration [22]. In silico studies reveal that CREB-mediated transcription regulates diverse cellular responses, such as cell proliferation and apoptosis [23], and that claudin 6 expression is regulated by CREB, amongst other transcription factors [24]. Interestingly, chronic inflammation-associated IL1b signaling regulates the expression and activation of CREB through an extracellular signal-regulated kinase 1, 2 (ERK 1/2) dependent mechanisms [25], a pathway closely related to CLDN6 expression [21].
Diverse nuclear processes, including enhancer–promoter interactions, are regulated, among others, by CCCTC-binding factor (CTCF) [26]. YY1 contributes to enhancer–promoter structural interactions; it possesses one activation and two repression domains [27]. It binds to the CGCCATNTT sequence located in many different promoters and acts as a regulator of enhancer–promoter loops analogous to DNA interactions mediated by CTCF [28]. Monomeric YY1 bound to DNA is capable of dimerizing, forming DNA loops interacting directly with DNA sequences or through other proteins [29]. YY1 is a sequence-specific DNA multi-domain binding transcription factor that activates or represses genes during cell growth and differentiation [30,31], and it has a role in the control of epithelial mesenchymal transition (EMT) [32]. It interacts with CREB-binding protein [33] and histone deacetylase-1, -2, and -3 [27]. YY1 plays a vital biological role in the remodeling and regulation of angiogenesis, tumor metabolism, and immunity in the microenvironment of a great variety of tumors, including gastric cancer [34].
The interaction between YY1 and CREB has been established in viral infections [33,35] and gastric tumors [36]. But for H. pylori-induced gastric cancer, there is no information regarding what transcription factors induce/upregulate the expression of CLDN6. The aim of this paper is to identify whether CREB and YY1 transcription factors regulate the expression of CLDN6 and to identify the site where they bind to the promoter sequence.

2. Results

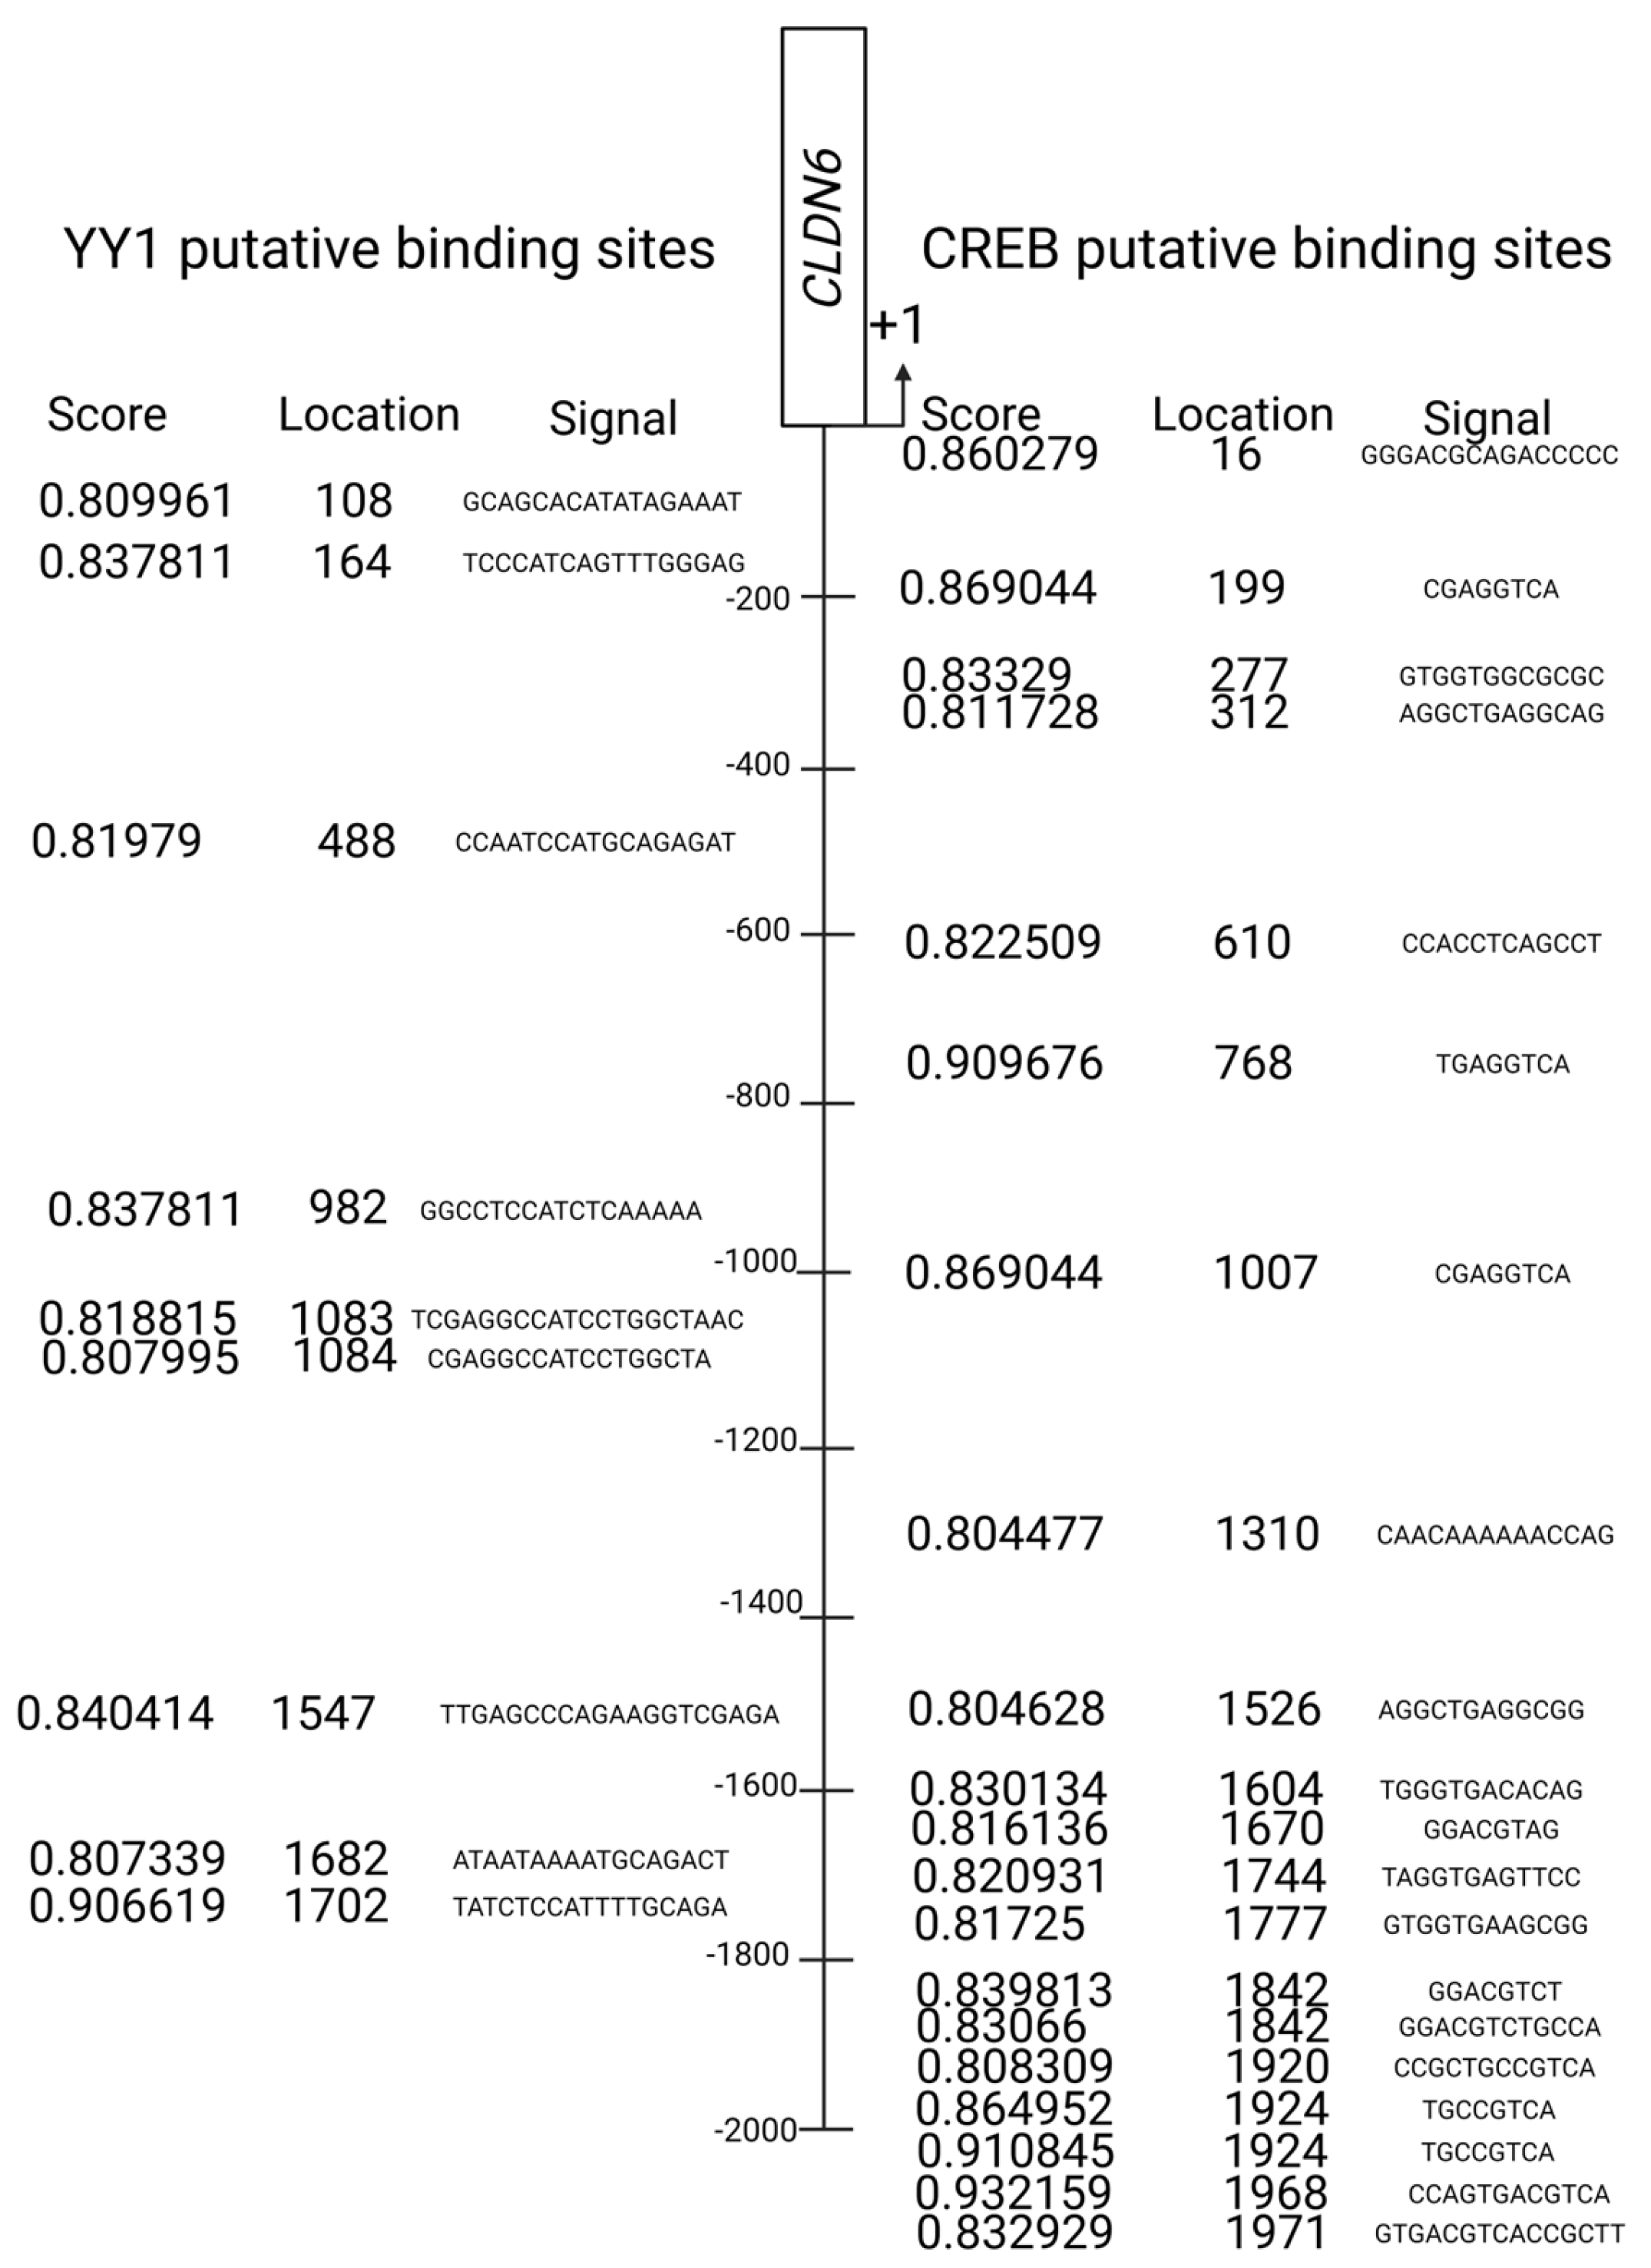
2.1. Bioinformatic Analysis

As YY1 interacts with CREB, a Transcription Factor Binding (TFBind) analysis was performed to determine all the possible YY1 and CREB binding sites in a promoter region close to the location where CLDN6 transcription is initiated; because the number of possible binding sites was extensive, we selected sites with a minimal similitude value of 0.8 for YY1 and CREB. Nine YY1 binding sites were found, but one with a similitude value of 0.9 was in a site very close to where transcription is initiated. Concerning CREB, 17 binding sites with a similitude value between 0.80 and 0.89, and three with a similitude value greater than 0.9, were selected. Interestingly, a luciferase assay determined that none of the 0.9-value YY1 or CREB participated in the transcriptional activity after LPS stimulation (Figure 1—YY1 and CREB binding sites in CLDN6 promoter).

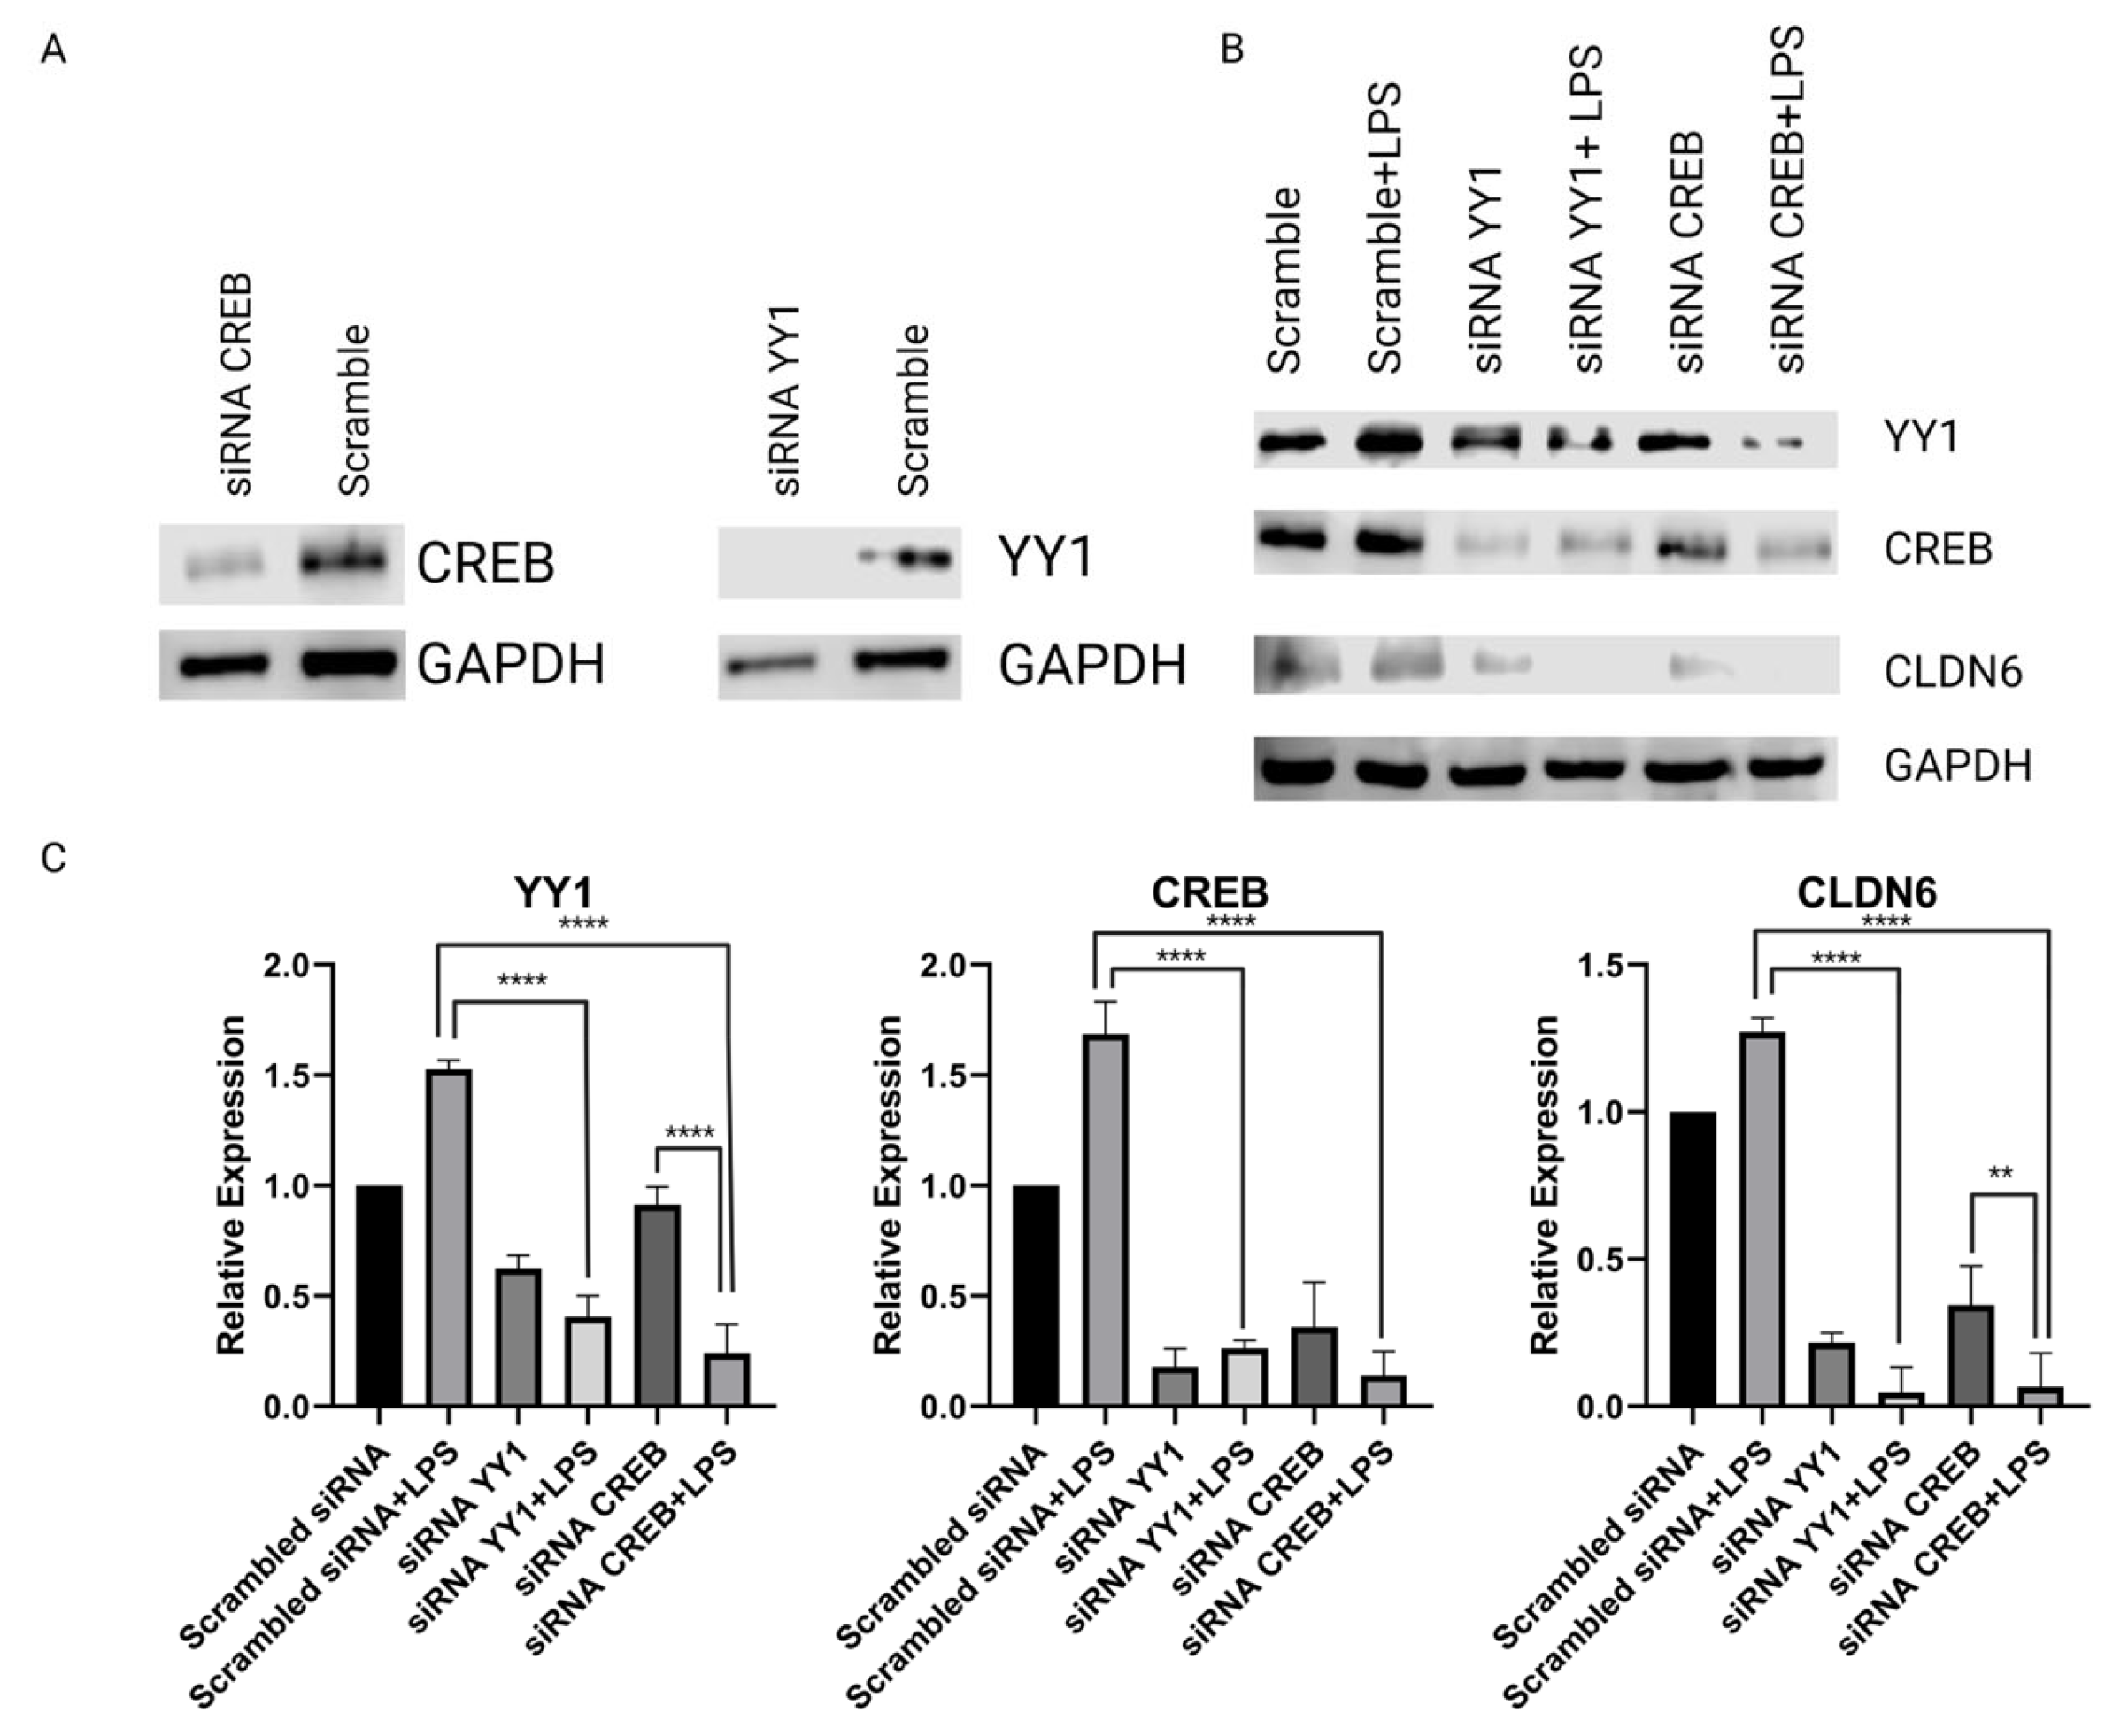
2.2. H. pylori LPS and YY1/CREB Expression

CLDN6 expression is enhanced by H. pylori LPS [21]; nevertheless, the effect of LPS upon the expression of YY1 and CREB has not been studied. Our results confirmed that LPS exposure initiated CLDN6 expression after 12 h, reaching its peak value after 48 h (p < 0.05). Interestingly, this increase was apparently subordinated to a significant up-regulation (p < 0.01) of YY1 and CREB transcription factors that initiated 4 h after LPS exposure and reached its maximum value after 12 and 24 h (Figure 2A,B), respectively.
To determine the region that regulates CLDN6 expression, we performed a gen reporter assay using the results of the bioinformatics analysis, which suggested that the initial 2000 bp contained the regulatory sequence associated with CLDN6 transcription.

2.3. Cloning of CLDN6 Promoter

To evaluate the transcriptional activity of the CLDN6 promoter, three different regions were cloned in the pMetLuc2 (−2000, −1421, −901 bp) (Figure 3A). Transfected AGS cells showed, as determined via the luciferase assay, that the three different regions displayed transcriptional activity that was independent of LPS presence (Figure 3B). The apparent difference in activation with and without LPS in the results of the −901 region did not reach a statistically significant difference. It is worth noticing the enhanced activation of the −1421 region in 48 h LPS-stimulated cells. To compare the responses of the different regions adequately, normalized data were used to demonstrate that the −901 to −1421 region displayed the maximal transcriptional activity in response to LPS (Figure 3C). The difference started to be significant from 12 h and reached a peak after 24 h that maintained a plateau behavior after 48 h. Not surprisingly, the complete −2000 bp region behaved almost identically to the −1421 region from 24 h, thus suggesting that the transcriptional activity of the −901 region is not dependent on LPS stimulation.

2.4. Regulation of CLDN6 Expression

To determine the role of YY1 and CREB in CLDN6 transcription regulation, silencing experiments using specific siRNAs were done. Figure 4A represents the silencing control experiments where efficient silencing of both transcription factors was achieved. The results showed that knocking down YY1 or CREB diminished the expression of CLDN6, thus emphasizing the importance of YY1 transcription factor in the regulation of CLDN6 expression. The results also demonstrated that YY1 has a regulatory role in CREB expression, suggesting a highly relevant function for this protein in gastric cancer. CREB silencing in LPS-treated cells significantly diminished the expression of YY1 (Figure 4B,C), suggesting that LPS triggers the establishment of a loop constituted by the CREB and YY1 interaction. These results were independent of LPS stimulation, and the differences against control experiments were highly significant (p < 0.0001).

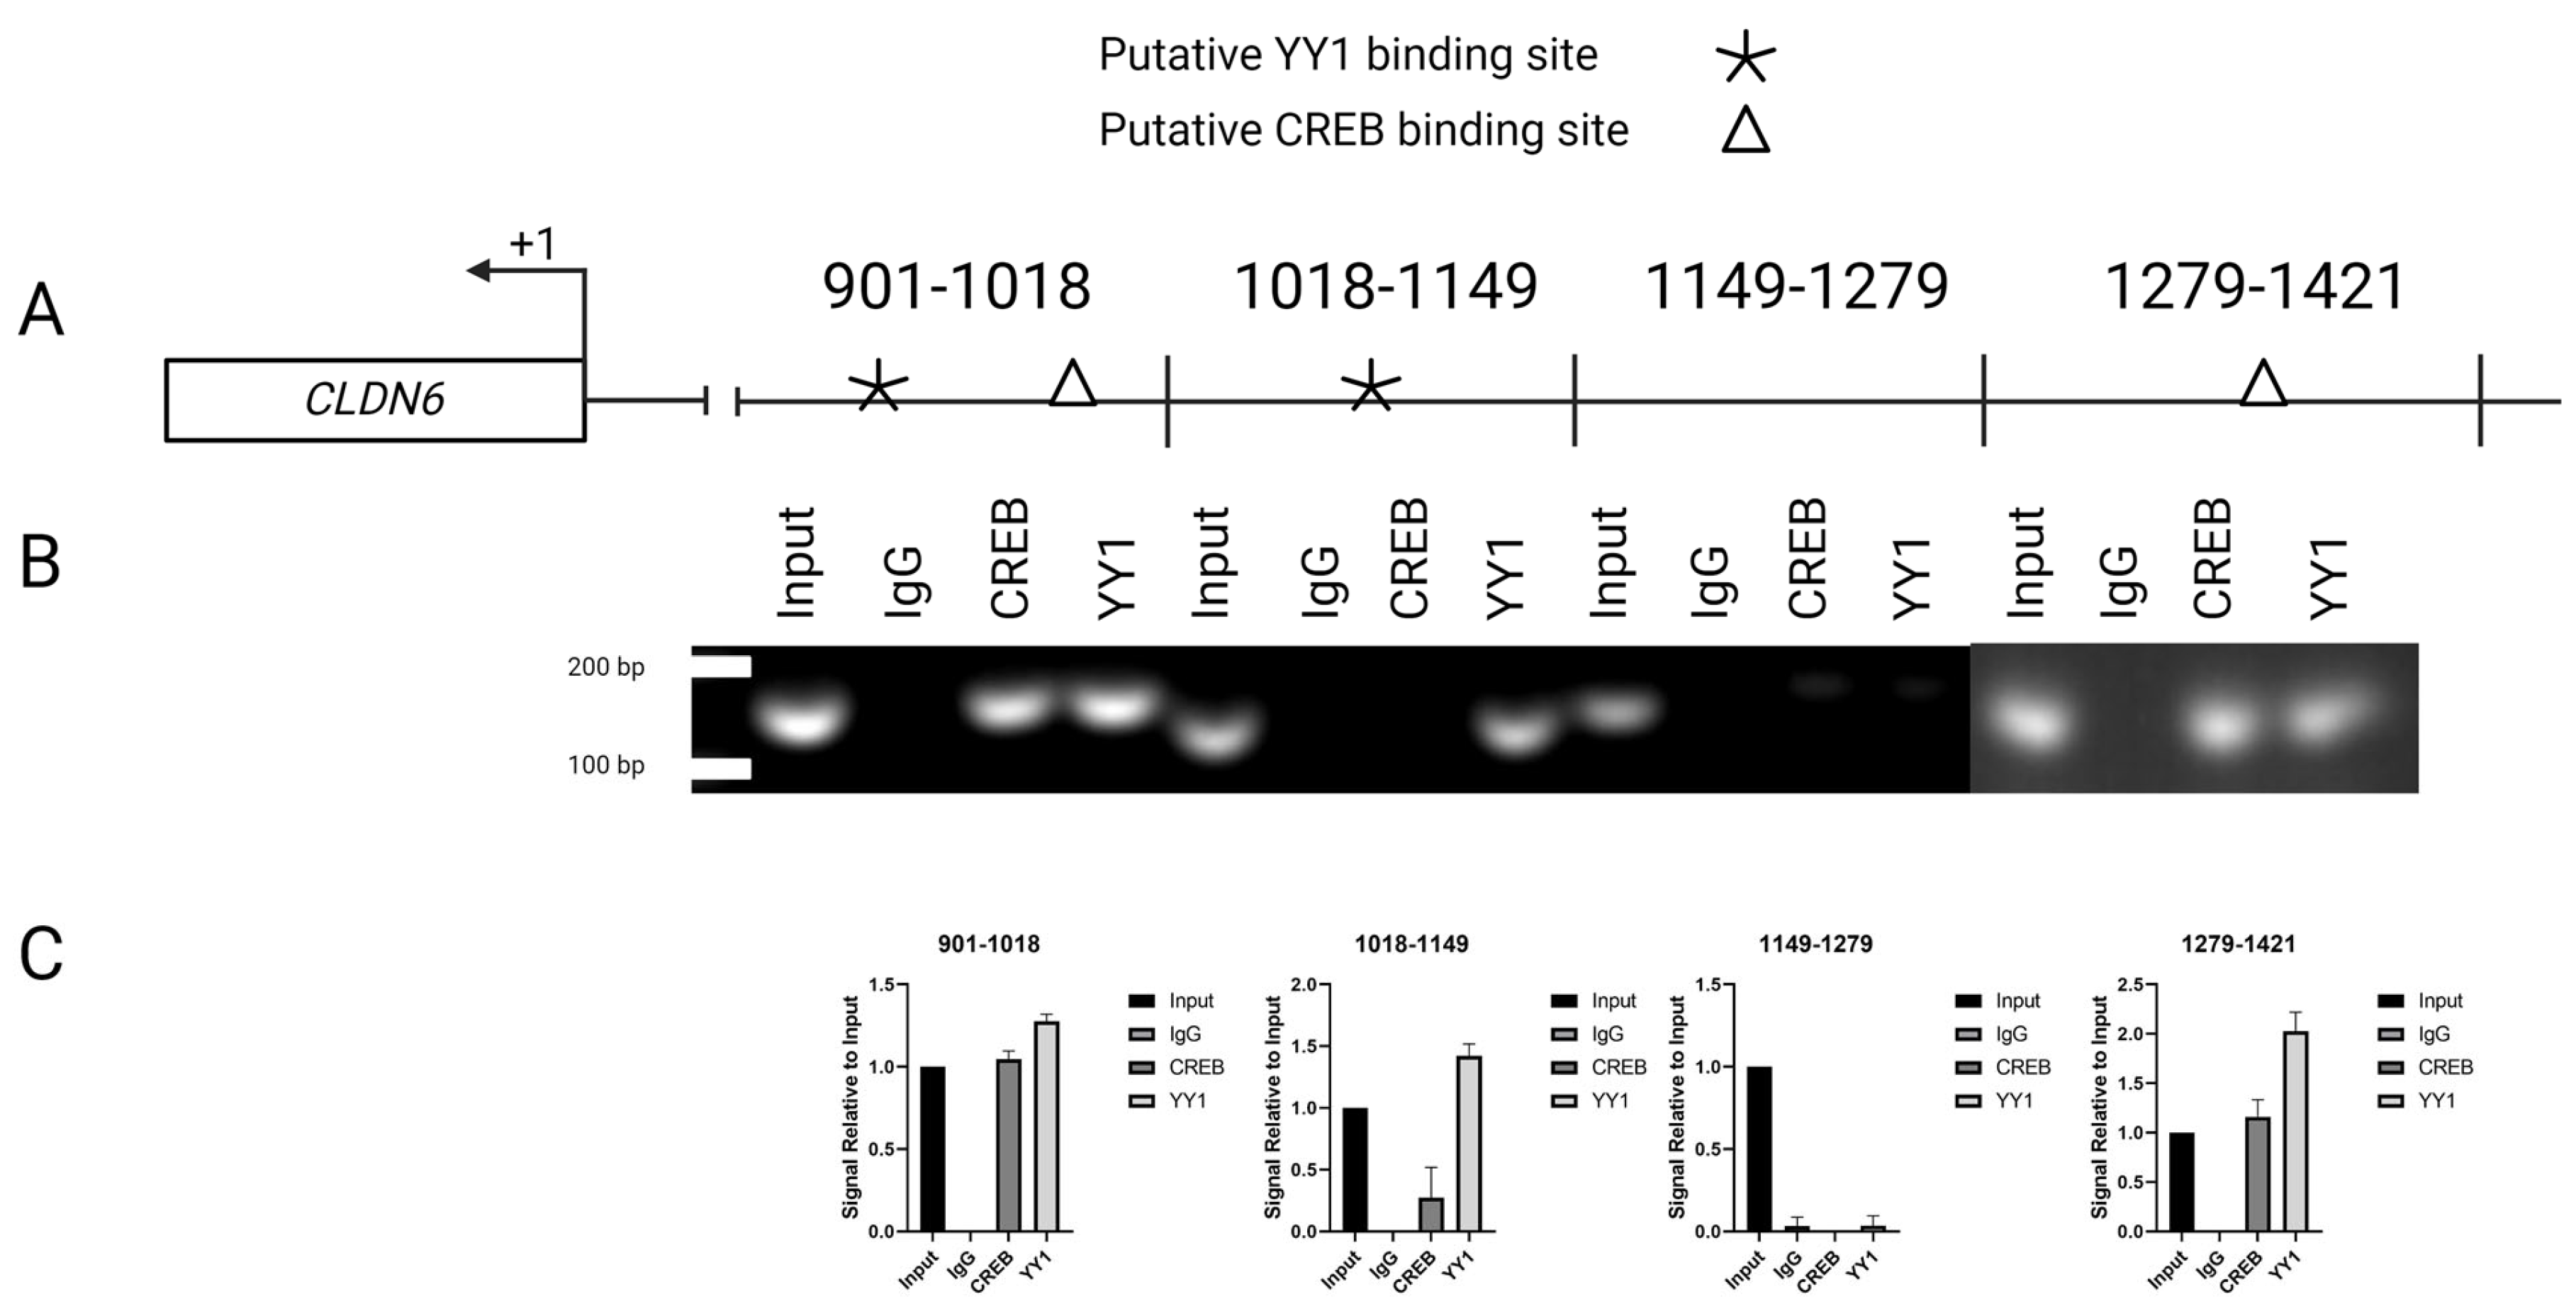
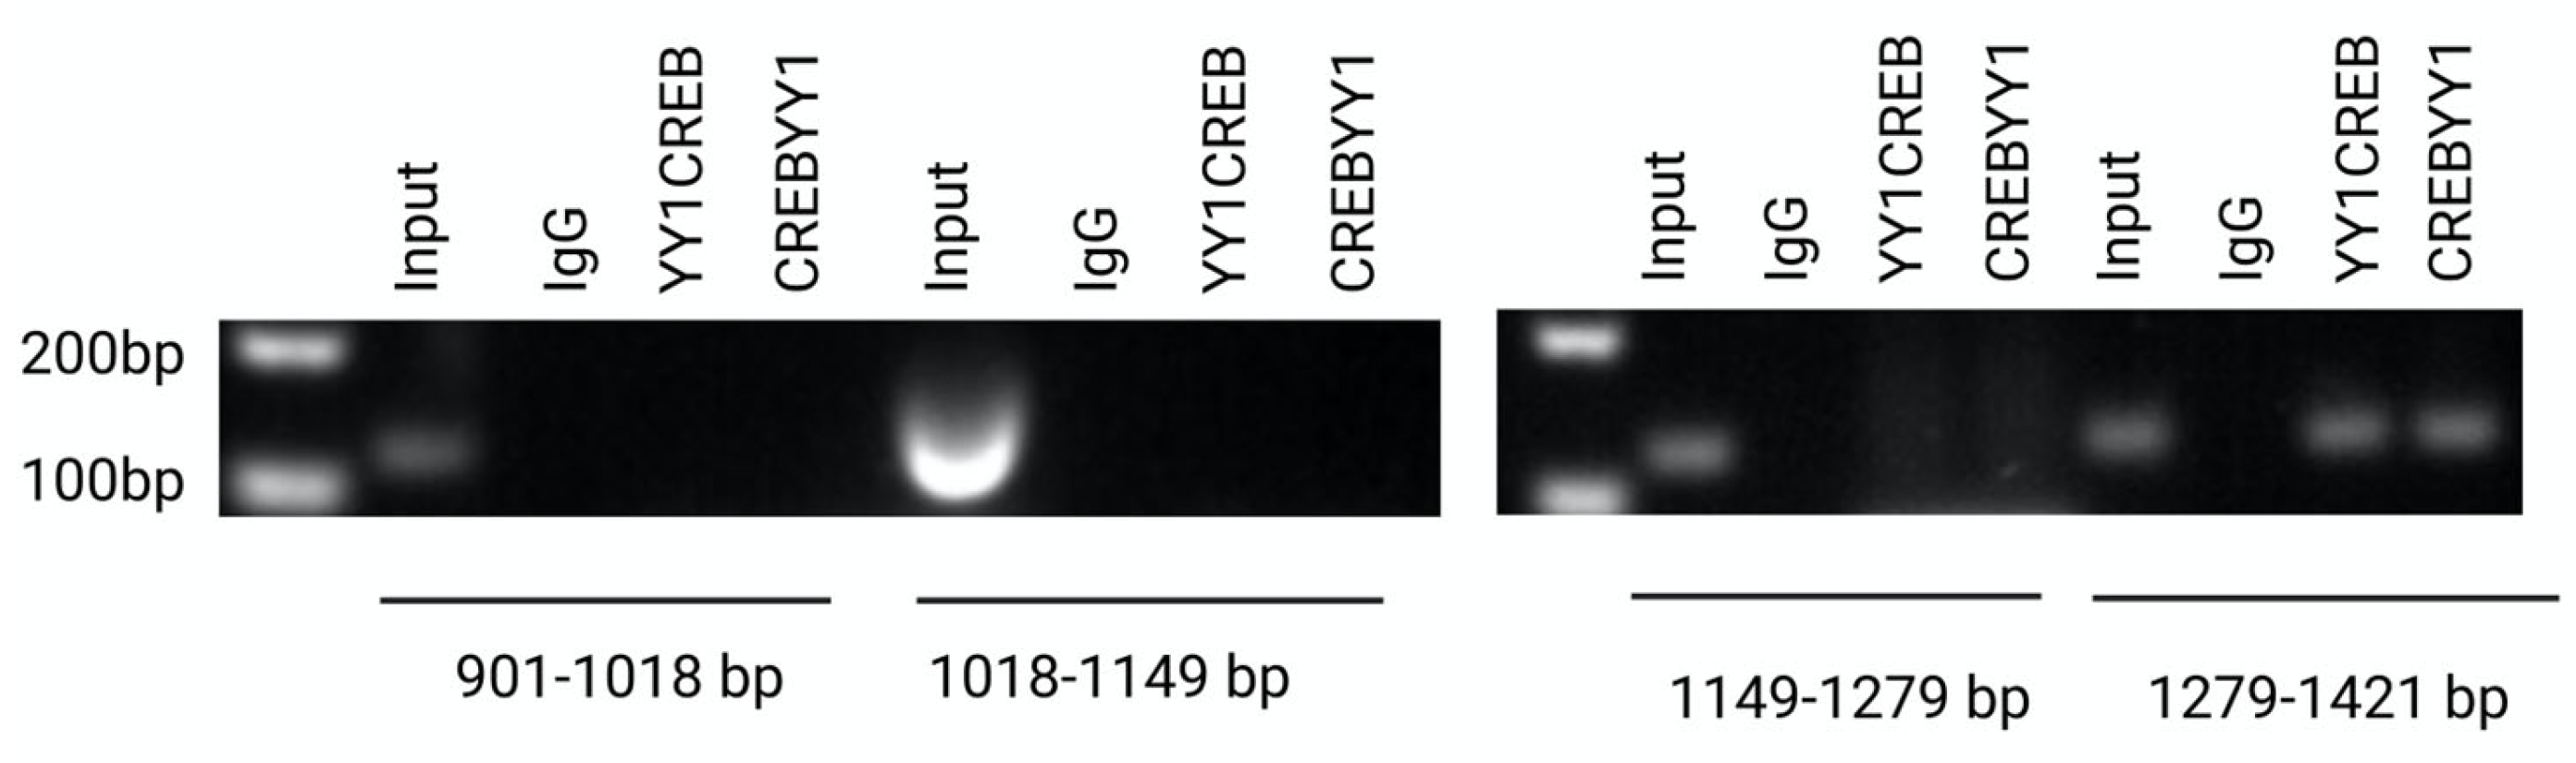
2.5. Interaction of YY1/CREB in CLDN6 Promoter

As the luciferase analysis had already shown, the 901–1421 region possessed the elements that control CLDN6 expression in LPS-treated cells. The chromatin immunoprecipitation assays showed YY1 and CREB occupancy sites in the 901–1018 bp fragment; the 1018–1149 fragment only had YY1 occupancy, and the 1149–1279 fragment did not show occupancy signals for either transcription factor; these sites corresponded to those predicted via the bioinformatic analysis. The 1279–1421 fragment showed CREB occupancy as predicted, but surprisingly, YY1 occupancy was also demonstrated despite not being predicted via the bioinformatic analysis (Figure 5).
Because of the surprising presence of a YY1 occupancy site in 1279–1421, we looked for possible YY1 binding sites with a minimal similitude value of 0.5 onwards in this region; the analysis did not show a putative binding site. Because ample bibliographic information validates the spatial interaction of both proteins, we performed sequential ChIP experiments in all three regions to determine whether the presence of YY1 in the 1279–1421 region is secondary to its interaction with CREB. The results confirmed, as expected, that YY1 and CREB interact in the 1279–1421 region, thus confirming our hypothesis (Figure 6).

3. Discussion

Claudins, a large family of transmembrane structural proteins, are fundamental to tight junction function and regulation linked to associated regulatory and scaffolding proteins [37]. They exhibit cell-type-specific and tissue-specific expression patterns [38]. Still, post-translational modifications can alter tight junction protein binding events and barrier function [39]. The fetal stomach tissue expresses CLDN6, which is developmentally regulated in mouse embryonic epithelia and is one of the earliest proteins expressed in embryonic stem cells committed to the epithelial fate [6,7]. CLDN6 expression in breast cancer is regulated by transcription factors such as HIF-1a, FoxA2, Gata6, and TTF-1 [40,41] at the claudin 6 promoter [42]. CLDN6 expression is significantly upregulated in different types of cancer, including gastric cancer [17,43,44]. CLDN6 overexpression in the gastric adenocarcinoma cell line AGS has proved to play a significant role in cell proliferation, migration, and invasion [18,19], but very little is known about the transcription factors that regulate CLDN6 expression.
A previous analysis of claudin expression in the AGS cell line suggested that the transcription factors CREB and YY1 could be regulators of CLDN6. The bioinformatics analysis results showed that CREB and YY1 have 17 and 9, respectively, probable binding sites 2000 bp upstream of the site where transcription of CLDN6 is initiated. Our results confirmed that H. pylori LPS induced, in the context of a chronic inflammatory process, the expression of CLDN6 in the AGS cell line [21]. Still, it also induced the expression of CREB and YY1 protein. The results of a Pearson correlation analysis between these transcription factors and CLDN6 expression suggested that both proteins, YY1 and CREB, could be associated with CLDN6 expression.
YY1 is a zinc finger protein that can activate or repress transcription, depending on its interactions with other transcription factors [45,46,47], such as the nuclear protein CBP, which is a coactivator for the transcription factor CREB [48]. CREB is strongly associated with inflammation and progression genes [49], and YY1, which is upregulated in the AGS cell line, is associated with gastric cancer progression [50]. Nevertheless, there is no information regarding the DNA region where these transcription factors bind.
Bacterial LPS regulates gene transcription by binding YY1 complexes to the CCAAT enhancer binding protein 1 (C/EBP1) or long non-coding RNA (lncRNA) via inflammatory cytokines [51,52]. Our results showed that the presence of CREB is indispensable for its interaction with YY1. The triggering mechanism in our model is highly likely to be mediated by pro-inflammatory cytokines induced by H. pylori LPS. lL-1b and TNFα regulate gene transcription via the C/EBP1, C/EBP2, and YY1 elements in epithelial cells [53]. YY1 function is regulated through the IL-4/STAT6 signaling pathway in tumor-associated immune cells [54]. LPS is not the only pathogenic factor in H. pylori capable of inducing gastric carcinogenesis; cytotoxin-associated gene A (CagA) protein, another major and substantial component of H. pylori, is known to provoke genomic hypermutations, DNA double strand breaks, subverted DNA damage responses that include the down-regulation of DNA repair genes, and transcriptomic and proteomic alterations that increase the chance of generating a “hit-and-run mechanism” for gastric carcinogenesis [55,56,57].
To identify the specific regulatory regions of the 2000 bp promoter regions where CREB and YY1 binding sites were found, the complete promoter region and two fragments were cloned in the pMetLuc2 vector and evaluated via a luciferase activity assay. The results suggested that two CREB sites and two YY1 sites in the DNA fragment corresponding to the 901 bp–1421 bp region are significantly important for regulating the CLDN6. The ChIP assays confirmed the results and revealed a YY1 binding site in the 1279–1421 bp region not predicted via the bioinformatics analysis. The distance between these CREB and YY1 sites was identified, suggesting that the 1279–1421 region is an enhancer [58]. Gene expression is a precisely controlled process where enhancers function in a tissue-specific manner [59]. Enhancers in higher eukaryotes are physically separated along the genome from the target gene promoters, and there are three possibilities for enhancer–promoter communication: tracking, linking, and looping [60]. YY1 is known to interact with DNA in a monomeric or a dimeric manner through not only its zinc fingers but also bridging with other transcription co-factors [28]. Our results strongly suggest that the binding of YY1 with CREB mediates the formation of a “loop” and, thus, initiates CLDN6 transcription, but the precise mechanism remains to be solved. YY1 has been recognized as a structural regulator of enhancer–promoter loops [28]. YY1 and CREB binding has been confirmed in the fourth exon of lymphotoxin-b in chromosome 6p21 in Jurkat T cells [61].
The mechanism through which YY1 functions both as a transcriptional activator and repressor depends in its acetylation/deacetylation [27]. Still, it is likely that the proteins and sequence-specific DNA-binding transcriptional activators and coregulatory molecules, such as CREB, with which YY1 interact determine its function [29,62]. Our results suggest that the interaction between YY1 with CREB in AGS cells stimulated with H. pylori LPS is involved in the transcriptional initiation and activation of CLDN6, a perfectly defined tight junction protein associated with enhanced gastric cancer progression and invasiveness [19].
Our results suggest that CLDN6 expression, a protein associated with gastric epithelial cancer progression, is regulated by the binding of YY1 and CREB in the 901–1421 enhancer in which a non-described interaction of YY1 with CREB was established in the 1279–1421 region.

4. Materials and Methods

4.1. Reagents

Dulbecco’s modified Eagle’s medium (DMEM), fetal bovine serum (FBS), L-glutamine, sodium pyruvate, insulin, Dulbecco’s phosphate-buffered saline (PBS), streptomycin–penicillin, bovine albumin, and total antibody compensation beads were from Invitrogen (Life Technologies Corp, Carlsbad, CA, USA). Monoclonal anti-claudin-6 (sc-393671), anti-YY1 (sc-7341), anti-GAPDH (sc-47724), anti-actin (sc-32251), and goat anti-mouse IgG were from Santa Cruz Biotechnology (Dallas, TX, USA). Monoclonal anti-CREB (MA1-083) and Lipofectamine 2000 (11668027) were from ThermoFisher Scientific (Waltham, MA, USA). The Molecular Biology Kit, EZ-10 Spin Column Plasmid DNA Miniprep Kit was from Southern Labware (Cumming, GA, USA). The ready-to-glow secreted luciferase reporter assay (Cat # 631727) and pMetLuc2 reporter vector (Cat # 631729) were from Takara Bio USA (San Jose, CA, USA). Primers were designed using TFBIND [63] and were synthetized by Integrated DNA Technologies (Coralville, IA, USA). T4 DNA ligase (cat #M0202S) was from New England BioLabs (Ipswich, MA, USA). The chromatin immunoprecipitation EZ-ChIP (cat #17-371) was from Merck KGaA (Darmstadt, Germany). Ruby Hot Start Master (2×) (cat # PCR-165L) was from Jena Bioscience GmbH (Jena, Germany).

4.2. Cell Culture

Human gastric adenocarcinoma (AGS) (CRL-1739, American Type Culture Collection Manassas, Manassas, VA, USA) cells (1 × 10⁶) were cultured in sterile P-100 Petri dishes with DMEM supplemented with 5% FBS, 0.1 U/mL of insulin, a 1% streptomycin–penicillin solution, 2 mmol/L of L-glutamine, and a 2 mmol sodium pyruvate solution at 37 °C in a humid environment containing 5% CO2, until reaching >90% confluence. Luciferase experiments were performed with 8 × 10⁵ cells/well seeded in 6 well Tissue Culture Plates (Biocompare, San Francisco, CA, USA) for 48 h until they reached 90% confluence, which represents 1 × 10⁶ cells/well. The LPS treatment of AGS cells was performed in p-100 culture dishes once they reached 80–90% confluence. All the experiments were immediately performed with these confluent AGS cell cultures in their third passage.

4.3. Bioinformatic Analysis

The search for sequences with potential transcriptional relevance in the present study was performed using TFBIND (https://tfbind.hgc.jp/, accessed on October 2019). We used a 0.8 cut-off instead of the 0.5 value for both transcription factors.

4.4. YY1 and CREB Silencing

Specific YY1 and CREB small interfering RNAs (Santa Cruz Biotechnology, siRNAYY1 sc-36864, siRNACREB sc-35111) were used to transfect AGS cells. 3 × 10⁵ cells were seeded in 6 well culture plates with 10% SFB supplemented antibiotic-free DMEM for 40 h at 37 °C in a 5% CO2 atmosphere until an 80% confluence was reached. Cells were transfected with the YY1 or CREB siRNA, following the manufacturer’s protocol, and cultured in transfection media for a 6 h period at 37 °C in a 5% CO2 atmosphere, followed by 20 h incubation in DMEM. At the end, culture media were eliminated from the wells, and 2 mL of 1% streptomycin–penicillin solution and 10% FBS supplemented DMEM were added per well to the transfected cells, which were incubated for 24 h at 37 °C in a humid 5% CO2 atmosphere before extracting total cell protein. A Western blot analysis was performed to corroborate the silencing of YY1 and CREB at the protein level.

4.5. Preparation of LPS Helicobacter pylori and Exposure to AGS Cells

Helicobacter pylori (strain J99) LPS were kindly donated by Dr. Victor R. Coria, Instituto Nacional de Pediatría, México. AGS cells were treated with 10 ng/mL of LPS H. pylori for 4 h, 8 h, 12 h, 24 h, and 48 h.

4.6. Protein Extraction

Control, LPS-treated, and transcription factors silenced AGS cells were washed twice with PBS and scraped with 1 mL of an ice-cold lysis buffer (150 mM NaCl/50 mM Tris/1 mM EGTA/1 mM EDTA/1% IGEPAL/0.1% Sodium deoxycholate/0.1% SDS + protease and phosphatases inhibitors). Cell suspensions were sonicated for 1 min at 25% amplitude, followed by centrifugation for 30 min at 17,000× g (4 °C). The supernatants were recovered, and a Bio-Rad Protein Assay determined the total protein concentration (Cat. # 500-0009, Bio-Rad, Hercules, CA, USA).

4.7. Western Blot

For Western blot analysis, 20 µg of protein was resolved on 13% SDS/PAGE and transferred to nitrocellulose membranes in a Bio-Rad semi-dry blotting system for 1 h at 120 mA. Membranes were blocked with 5% non-fat dry milk in Tris-buffered saline (TBS) for 1 h, washed twice with TBS, and incubated with the relevant primary antibody diluted in Tween 20/TBS (TTBS) overnight at 4 °C (anti claudin-6 (1:200), anti-YY1 (1:400), anti-CREB (1:500), anti-GAPDH (1:5000), and anti α-actin (1:500)). Membranes were washed with TTBS and incubated with horseradish peroxidase-labeled secondary goat anti-mouse IgG (1:4000) diluted in TTBS for 1 h at room temperature. Afterward, membranes were washed thrice with TTBS and once with TBS before antibody binding was detected via chemiluminescence using the Supersignal West Dura Extended Duration Substrate (Thermo Fisher Scientific, Waltham, MA, USA) as a substrate. Equal protein loading was confirmed in all the experiments by determining β-actin as a loading control. All experiments were done in triplicate. The quantitative analysis of the Western blot bands was performed using ImageJ v 1.53 software, which calculates the intensity of the gel band, measuring the amount of pixels/sq.in. The values were determined for each band. The results are expressed as dots per point (DPP) and intensity.

4.8. Plasmid Construction and Luciferase Assay

The −2000, −1421, and −901 regions of the claudin 6 promoter were amplified from AGS genomic DNA using the following primers: −2000 forward: 5′CCAGCCGGTGATCTAGTCC3′; −1421 forward: 5′GCCACTACAGCTTTGTTAAGGG3′; and 901 forward: 5′CGGGCACCTGTAGTAGTCC3′. We used the same reverse primer: 5′AATTCCTAGGCCGAGTGTCG3′. The amplified DNA was cloned in pMetLuc2 plasmid using DNA ligase T4. The result of this ligation was used to transform competent E. coli DH5α to get transformed colonies. Plasmid DNA was extracted using the Southern Labware EZ-10 Molecular Biology Kit, according to the manufacturer´s instructions. The purified DNA was used to transfect AGS cells using lipofectamine 2000; these transfected AGS cells were treated with H. pylori LPS 10 ng/mL for 4, 8, 12, 24, and 48 h. Luciferase activity was measured using the Ready-to-Glow secreted luciferase reporter assay (Clontech Lab, Mountain View, CA, USA) in a Perkin Elmer Wallac 1420 Victor Spectrophotometer. The values obtained from these experiments were normalized according to Schagat T. of Promega Corporation (Cell Notes Issue 17, 2007).

4.9. Chromatin Immunoprecipitation

A ChIP assay was performed using Millipore EZ-ChIP kit (Merck KGaA, Darmstadt, Germany) according to the manufacturer’s instructions. In brief, AGS cells were treated with H. pylori LPS 10 ng/mL for 24 h before being fixed with 3.7% formaldehyde, lysed, and sonicated, as previously mentioned. Immunoprecipitation was then performed with CREB and YY1 antibodies, and purified DNA fragments were analyzed via qPCR, using Ruby Hot Start Master (2×) according to the manufacturer’s instructions. The following primers were used: 901–1018 forward: 5′GCACTACAGCTTTGTTAAGGG3′; reverse: 5′CACTACCACGCCCGGCTAAC3′; 1018–1149 forward: GTTAGCCGGGCGTGGTAGTGGGC; reverse: CGCCCAGTCTGGAGTGCAATGG; 1149–1279 forward: CCATTGCACTCCAGACTGGGCG; reverse: TTTCCTGACCTCGTGATCTGCCC; and 1279–1421 forward: GGGCAGATCACGAGGTCAGGAAA; reverse: GGGACTACTACAGGTGCCCG. The results of these assays were analyzed in a 3.5% agarose gel, and the quantitative analysis of the bands’ images was performed using ImageJ v 1.53 software, which calculates the intensity of the gel band, measuring the amount of pixels/sq.in. The values were determined for each band. The results are expressed as dots per point (DPP) and intensity.

4.10. Statistical Analysis

Statistical analyses were performed using the GraphPad Prism software, version 4 (GraphPad Software, Boston, MA, USA). All values are expressed as means ± standard deviations (SDs). Statistical significance in a one-way analysis of variance (ANOVA), followed by a post hoc Dunett’s test and selected pairs comparison test, was set to p < 0.05 (*), p < 0.01 (**), p < 0.001 (***) or p < 0.0001 (****) versus the control condition, and “n” represents the number of independent experiments.

Author Contributions

Study conception and design: J.H.R.-E. and E.P.R.-H.; material preparation and data collection: J.H.R.-E.; analysis and interpretation of results: J.H.R.-E. and E.P.R.-H.; draft manuscript preparation: all authors. All authors have read and agreed to the published version of the manuscript.

Funding

This research was funded by the Programa de Apoyo a Proyectos de Investigación e Innovación Tecnológica (PAPITT), Universidad Nacional Autónoma de México, Mexico, grant number IN218019, to Dr. Erika P. Rendón-Huerta.

Institutional Review Board Statement

Not applicable.

Informed Consent Statement

Not applicable.

Data Availability Statement

Data are available upon reasonable request.

Conflicts of Interest

The authors declare no conflict of interest.

References

  1. Moonwiriyakit, A.; Pathomthongtaweechai, N.; Steinhagen, P.R.; Chantawichitwong, P.; Satianrapapong, W.; Pongkorpsakol, P. Tight junctions: From molecules to gastrointestinal diseases. Tissue Barriers 2023, 11, 2077620. [Google Scholar] [CrossRef]
  2. Morita, K.; Furuse, M.; Fujimoto, K.; Tsukita, S. Claudin multigene family encoding four-transmembrane domain protein components of tight junction strands. Proc. Natl. Acad. Sci. USA 1999, 96, 511–516. [Google Scholar] [CrossRef] [PubMed]
  3. Van Itallie, C.M.; Anderson, J.M. Claudins and epithelial paracellular transport. Annu. Rev. Physiol. 2006, 68, 403–429. [Google Scholar] [CrossRef] [PubMed]
  4. Krause, G.; Winkler, L.; Mueller, S.L.; Haseloff, R.F.; Piontek, J.; Blasig, I.E. Structure and function of claudins. Biochim. Biophys. Acta 2008, 1778, 631–645. [Google Scholar] [CrossRef] [PubMed]
  5. Colegio, O.R.; Van Itallie, C.; Rahner, C.; Anderson, J.M. Claudin extracellular domains determine paracellular charge selectivity and resistance but not tight junction fibril architecture. Am. J. Physiol. Cell Physiol. 2003, 284, C1346–C1354. [Google Scholar] [CrossRef]
  6. Turksen, K.; Troy, T.C. Claudin-6: A novel tight junction molecule is developmentally regulated in mouse embryonic epithelium. Dev. Dyn. 2001, 222, 292–300. [Google Scholar] [CrossRef]
  7. Ben-David, U.; Nudel, N.; Benvenisty, N. Immunologic and chemical targeting of the tight-junction protein Claudin-6 eliminates tumorigenic human pluripotent stem cells. Nat. Commun. 2013, 4, 1992. [Google Scholar] [CrossRef]
  8. Du, H.; Yang, X.; Fan, J.; Du, X. Claudin 6: Therapeutic prospects for tumours, and mechanisms of expression and regulation (Review). Mol. Med. Rep. 2021, 24, 677. [Google Scholar] [CrossRef]
  9. Bhat, A.A.; Uppada, S.; Achkar, I.W.; Hashem, S.; Yadav, S.K.; Shanmugakonar, M.; Al-Naemi, H.A.; Haris, M.; Uddin, S. Tight Junction Proteins and Signaling Pathways in Cancer and Inflammation: A Functional Crosstalk. Front. Physiol. 2018, 9, 1942. [Google Scholar] [CrossRef]
  10. Wang, Q.; Zhang, Y.; Zhang, T.; Han, Z.G.; Shan, L. Low claudin-6 expression correlates with poor prognosis in patients with non-small cell lung cancer. Onco. Targets Ther. 2015, 8, 1971–1977. [Google Scholar] [CrossRef]
  11. Ito, Y.; Takasawa, A.; Takasawa, K.; Murakami, T.; Akimoto, T.; Kyuno, D.; Kawata, Y.; Shano, K.; Kirisawa, K.; Ota, M.; et al. Aberrant expression of claudin-6 contributes to malignant potentials and drug resistance of cervical adenocarcinoma. Cancer Sci. 2022, 113, 1519–1530. [Google Scholar] [CrossRef]
  12. Wang, L.; Jin, X.; Lin, D.; Liu, Z.; Zhang, X.; Lu, Y.; Liu, Y.; Wang, M.; Yang, M.; Li, J.; et al. Clinicopathologic significance of claudin-6, occludin, and matrix metalloproteinases-2 expression in ovarian carcinoma. Diagn. Pathol. 2013, 8, 190. [Google Scholar] [CrossRef] [PubMed]
  13. Guo, Y.; Xu, X.; Liu, Z.; Zhang, T.; Zhang, X.; Wang, L.; Wang, M.; Liu, Y.; Lu, Y.; Liu, Y.; et al. Apoptosis signal-regulating kinase 1 is associated with the effect of claudin-6 in breast cancer. Diagn. Pathol. 2012, 7, 111. [Google Scholar] [CrossRef]
  14. Liu, Y.; Jin, X.; Li, Y.; Ruan, Y.; Lu, Y.; Yang, M.; Lin, D.; Song, P.; Guo, Y.; Zhao, S.; et al. DNA methylation of claudin-6 promotes breast cancer cell migration and invasion by recruiting MeCP2 and deacetylating H3Ac and H4Ac. J. Exp. Clin. Cancer Res. 2016, 35, 120. [Google Scholar] [CrossRef] [PubMed]
  15. Yang, M.; Li, Y.; Shen, X.; Ruan, Y.; Lu, Y.; Jin, X.; Song, P.; Guo, Y.; Zhang, X.; Qu, H.; et al. CLDN6 promotes chemoresistance through GSTP1 in human breast cancer. J. Exp. Clin. Cancer Res. 2017, 36, 157. [Google Scholar] [CrossRef]
  16. Lin, Z.; Zhang, X.; Liu, Z.; Liu, Q.; Wang, L.; Lu, Y.; Liu, Y.; Wang, M.; Yang, M.; Jin, X.; et al. The distinct expression patterns of claudin-2, -6, and -11 between human gastric neoplasms and adjacent non-neoplastic tissues. Diagn. Pathol. 2013, 8, 133. [Google Scholar] [CrossRef] [PubMed]
  17. Kohmoto, T.; Masuda, K.; Shoda, K.; Takahashi, R.; Ujiro, S.; Tange, S.; Ichikawa, D.; Otsuji, E.; Imoto, I. Claudin-6 is a single prognostic marker and functions as a tumor-promoting gene in a subgroup of intestinal type gastric cancer. Gastric Cancer 2020, 23, 403–417. [Google Scholar] [CrossRef]
  18. Zavala-Zendejas, V.E.; Torres-Martinez, A.C.; Salas-Morales, B.; Fortoul, T.I.; Montano, L.F.; Rendon-Huerta, E.P. Claudin-6, 7, or 9 overexpression in the human gastric adenocarcinoma cell line AGS increases its invasiveness, migration, and proliferation rate. Cancer Investig. 2011, 29, 1–11. [Google Scholar] [CrossRef]
  19. Torres-Martinez, A.C.; Gallardo-Vera, J.F.; Lara-Holguin, A.N.; Montano, L.F.; Rendon-Huerta, E.P. Claudin-6 enhances cell invasiveness through claudin-1 in AGS human adenocarcinoma gastric cancer cells. Exp. Cell Res. 2017, 350, 226–235. [Google Scholar] [CrossRef]
  20. Medrano-Gonzalezl, P.A.; Cruz-Villegas, F.; Alarcon Del Carmen, A.; Montano, L.F.; Rendon-Huerta, E.P. Claudin-6 increases SNAI1, NANOG and SOX2 gene expression in human gastric adenocarcinoma AGS cells. Mol. Biol. Rep. 2022, 49, 11663–11674. [Google Scholar] [CrossRef]
  21. Chavarria-Velazquez, C.O.; Torres-Martinez, A.C.; Montano, L.F.; Rendon-Huerta, E.P. TLR2 activation induced by H. pylori LPS promotes the differential expression of claudin-4, -6, -7 and -9 via either STAT3 and ERK1/2 in AGS cells. Immunobiology 2018, 223, 38–48. [Google Scholar] [CrossRef]
  22. Kudo, T.; Lu, H.; Wu, J.Y.; Ohno, T.; Wu, M.J.; Genta, R.M.; Graham, D.Y.; Yamaoka, Y. Pattern of transcription factor activation in Helicobacter pylori-infected Mongolian gerbils. Gastroenterology 2007, 132, 1024–1038. [Google Scholar] [CrossRef] [PubMed]
  23. Andrisani, O.M. CREB-mediated transcriptional control. Crit. Rev. Eukaryot. Gene Expr. 1999, 9, 19–32. [Google Scholar] [CrossRef] [PubMed]
  24. Lin, D.; Guo, Y.; Li, Y.; Ruan, Y.; Zhang, M.; Jin, X.; Yang, M.; Lu, Y.; Song, P.; Zhao, S.; et al. Bioinformatic analysis reveals potential properties of human Claudin-6 regulation and functions. Oncol. Rep. 2017, 38, 875–885. [Google Scholar] [CrossRef]
  25. Resende, C.; Regalo, G.; Duraes, C.; Pinto, M.T.; Wen, X.; Figueiredo, C.; Carneiro, F.; Machado, J.C. Interleukin-1B signalling leads to increased survival of gastric carcinoma cells through a CREB-C/EBPbeta-associated mechanism. Gastric Cancer 2016, 19, 74–84. [Google Scholar] [CrossRef]
  26. Kim, S.; Yu, N.K.; Kaang, B.K. CTCF as a multifunctional protein in genome regulation and gene expression. Exp. Mol. Med. 2015, 47, e166. [Google Scholar] [CrossRef] [PubMed]
  27. Yao, Y.L.; Yang, W.M.; Seto, E. Regulation of transcription factor YY1 by acetylation and deacetylation. Mol. Cell Biol. 2001, 21, 5979–5991. [Google Scholar] [CrossRef]
  28. Weintraub, A.S.; Li, C.H.; Zamudio, A.V.; Sigova, A.A.; Hannett, N.M.; Day, D.S.; Abraham, B.J.; Cohen, M.A.; Nabet, B.; Buckley, D.L.; et al. YY1 Is a Structural Regulator of Enhancer-Promoter Loops. Cell 2017, 171, 1573–1588.e1528. [Google Scholar] [CrossRef]
  29. Sarvagalla, S.; Kolapalli, S.P.; Vallabhapurapu, S. The Two Sides of YY1 in Cancer: A Friend and a Foe. Front. Oncol. 2019, 9, 1230. [Google Scholar] [CrossRef]
  30. Deng, Z.; Cao, P.; Wan, M.M.; Sui, G. Yin Yang 1: A multifaceted protein beyond a transcription factor. Transcription 2010, 1, 81–84. [Google Scholar] [CrossRef]
  31. Chen, F.; Sun, H.; Zhao, Y.; Wang, H. YY1 in Cell Differentiation and Tissue Development. Crit. Rev. Oncog. 2017, 22, 131–141. [Google Scholar] [CrossRef] [PubMed]
  32. Bonavida, B.; Baritaki, S. The novel role of Yin Yang 1 in the regulation of epithelial to mesenchymal transition in cancer via the dysregulated NF-kappaB/Snail/YY1/RKIP/PTEN Circuitry. Crit. Rev. Oncog. 2011, 16, 211–226. [Google Scholar] [CrossRef] [PubMed]
  33. Zhou, Q.; Engel, D.A. Adenovirus E1A243 disrupts the ATF/CREB-YY1 complex at the mouse c-fos promoter. J. Virol. 1995, 69, 7402–7409. [Google Scholar] [CrossRef]
  34. Li, M.; Wei, J.; Xue, C.; Zhou, X.; Chen, S.; Zheng, L.; Duan, Y.; Deng, H.; Xiong, W.; Tang, F.; et al. Dissecting the roles and clinical potential of YY1 in the tumor microenvironment. Front. Oncol. 2023, 13, 1122110. [Google Scholar] [CrossRef]
  35. Huang, W.H.; Mai, R.T.; Lee, Y.H. Transcription factor YY1 and its associated acetyltransferases CBP and p300 interact with hepatitis delta antigens and modulate hepatitis delta virus RNA replication. J. Virol. 2008, 82, 7313–7324. [Google Scholar] [CrossRef] [PubMed]
  36. Bhaskar Rao, D.; Panneerpandian, P.; Balakrishnan, K.; Ganesan, K. YY1 regulated transcription-based stratification of gastric tumors and identification of potential therapeutic candidates. J. Cell Commun. Signal 2021, 15, 251–267. [Google Scholar] [CrossRef]
  37. Gunzel, D.; Fromm, M. Claudins and other tight junction proteins. Compr. Physiol. 2012, 2, 1819–1852. [Google Scholar] [CrossRef]
  38. Tsukita, S.; Tanaka, H.; Tamura, A. The Claudins: From Tight Junctions to Biological Systems. Trends Biochem. Sci. 2019, 44, 141–152. [Google Scholar] [CrossRef]
  39. Van Itallie, C.M.; Anderson, J.M. Phosphorylation of tight junction transmembrane proteins: Many sites, much to do. Tissue Barriers 2018, 6, e1382671. [Google Scholar] [CrossRef]
  40. Jimenez, F.R.; Lewis, J.B.; Belgique, S.T.; Wood, T.T.; Reynolds, P.R. Developmental lung expression and transcriptional regulation of claudin-6 by TTF-1, Gata-6, and FoxA2. Respir. Res. 2014, 15, 70. [Google Scholar] [CrossRef] [PubMed]
  41. Jia, Y.; Guo, Y.; Jin, Q.; Qu, H.; Qi, D.; Song, P.; Zhang, X.; Wang, X.; Xu, W.; Dong, Y.; et al. A SUMOylation-dependent HIF-1alpha/CLDN6 negative feedback mitigates hypoxia-induced breast cancer metastasis. J. Exp. Clin. Cancer Res. 2020, 39, 42. [Google Scholar] [CrossRef] [PubMed]
  42. Jimenez, F.R.; Lewis, J.B.; Belgique, S.T.; Milner, D.C.; Lewis, A.L.; Dunaway, T.M.; Egbert, K.M.; Winden, D.R.; Arroyo, J.A.; Reynolds, P.R. Cigarette smoke and decreased oxygen tension inhibit pulmonary claudin-6 expression. Exp. Lung Res. 2016, 42, 440–452. [Google Scholar] [CrossRef] [PubMed]
  43. Qu, H.; Jin, Q.; Quan, C. CLDN6: From Traditional Barrier Function to Emerging Roles in Cancers. Int. J. Mol. Sci. 2021, 22, 13416. [Google Scholar] [CrossRef]
  44. Gao, F.; Li, M.; Xiang, R.; Zhou, X.; Zhu, L.; Zhai, Y. Expression of CLDN6 in tissues of gastric cancer patients: Association with clinical pathology and prognosis. Oncol. Lett. 2019, 17, 4621–4625. [Google Scholar] [CrossRef]
  45. Shi, Y.; Seto, E.; Chang, L.S.; Shenk, T. Transcriptional repression by YY1, a human GLI-Kruppel-related protein, and relief of repression by adenovirus E1A protein. Cell 1991, 67, 377–388. [Google Scholar] [CrossRef] [PubMed]
  46. Seto, E.; Shi, Y.; Shenk, T. YY1 is an initiator sequence-binding protein that directs and activates transcription in vitro. Nature 1991, 354, 241–245. [Google Scholar] [CrossRef]
  47. Khachigian, L.M. The Yin and Yang of YY1 in tumor growth and suppression. Int. J. Cancer 2018, 143, 460–465. [Google Scholar] [CrossRef]
  48. Kwok, R.P.; Lundblad, J.R.; Chrivia, J.C.; Richards, J.P.; Bachinger, H.P.; Brennan, R.G.; Roberts, S.G.; Green, M.R.; Goodman, R.H. Nuclear protein CBP is a coactivator for the transcription factor CREB. Nature 1994, 370, 223–226. [Google Scholar] [CrossRef]
  49. Steven, A.; Seliger, B. Control of CREB expression in tumors: From molecular mechanisms and signal transduction pathways to therapeutic target. Oncotarget 2016, 7, 35454–35465. [Google Scholar] [CrossRef] [PubMed]
  50. Kang, W.; Tong, J.H.; Chan, A.W.; Zhao, J.; Dong, Y.; Wang, S.; Yang, W.; Sin, F.M.; Ng, S.S.; Yu, J.; et al. Yin Yang 1 contributes to gastric carcinogenesis and its nuclear expression correlates with shorter survival in patients with early stage gastric adenocarcinoma. J. Transl. Med. 2014, 12, 80. [Google Scholar] [CrossRef] [PubMed]
  51. Nakayama, Y.; Kobayashi, R.; Iwai, Y.; Noda, K.; Yamazaki, M.; Kurita-Ochiai, T.; Yoshimura, A.; Ganss, B.; Ogata, Y. C/EBPbeta and YY1 bind and interact with Smad3 to modulate lipopolysaccharide-induced amelotin gene transcription in mouse gingival epithelial cells. FEBS Open Bio 2019, 9, 276–290. [Google Scholar] [CrossRef] [PubMed]
  52. Wang, J.; Liu, Z.; Xu, Y.; Wang, Y.; Wang, F.; Zhang, Q.; Ni, C.; Zhen, Y.; Xu, R.; Liu, Q.; et al. Enterobacterial LPS-inducible LINC00152 is regulated by histone lactylation and promotes cancer cells invasion and migration. Front. Cell Infect. Microbiol. 2022, 12, 913815. [Google Scholar] [CrossRef] [PubMed]
  53. Noda, K.; Yamazaki, M.; Iwai, Y.; Matsui, S.; Kato, A.; Takai, H.; Nakayama, Y.; Ogata, Y. IL-1beta and TNF-alpha regulate mouse amelotin gene transcription in gingival epithelial cells. J. Oral. Sci. 2018, 60, 388–398. [Google Scholar] [CrossRef] [PubMed]
  54. Chen, S.; Lu, K.; Hou, Y.; You, Z.; Shu, C.; Wei, X.; Wu, T.; Shi, N.; Zhang, G.; Wu, J.; et al. YY1 complex in M2 macrophage promotes prostate cancer progression by upregulating IL-6. J. Immunother. Cancer 2023, 11, e006020. [Google Scholar] [CrossRef]
  55. Murata-Kamiya, N.; Hatakeyama, M. Helicobacter pylori-induced DNA double-stranded break in the development of gastric cancer. Cancer Sci. 2022, 113, 1909–1918. [Google Scholar] [CrossRef]
  56. Kolinjivadi, A.M.; Sankar, H.; Choudhary, R.; Tay, L.S.; Tan, T.Z.; Murata-Kamiya, N.; Voon, D.C.; Kappei, D.; Hatakeyama, M.; Krishnan, V.; et al. The H. pylori CagA Oncoprotein Induces DNA Double Strand Breaks through Fanconi Anemia Pathway Downregulation and Replication Fork Collapse. Int. J. Mol. Sci. 2022, 23, 1661. [Google Scholar] [CrossRef]
  57. Imai, S.; Ooki, T.; Murata-Kamiya, N.; Komura, D.; Tahmina, K.; Wu, W.; Takahashi-Kanemitsu, A.; Knight, C.T.; Kunita, A.; Suzuki, N.; et al. Helicobacter pylori CagA elicits BRCAness to induce genome instability that may underlie bacterial gastric carcinogenesis. Cell Host Microbe 2021, 29, 941–958.e910. [Google Scholar] [CrossRef]
  58. Spitz, F.; Furlong, E.E. Transcription factors: From enhancer binding to developmental control. Nat. Rev. Genet. 2012, 13, 613–626. [Google Scholar] [CrossRef]
  59. Mercola, M.; Wang, X.F.; Olsen, J.; Calame, K. Transcriptional enhancer elements in the mouse immunoglobulin heavy chain locus. Science 1983, 221, 663–665. [Google Scholar] [CrossRef]
  60. Panigrahi, A.; O’Malley, B.W. Mechanisms of enhancer action: The known and the unknown. Genome Biol. 2021, 22, 108. [Google Scholar] [CrossRef]
  61. Wicks, K.; Knight, J.C. Transcriptional repression and DNA looping associated with a novel regulatory element in the final exon of the lymphotoxin-beta gene. Genes. Immun. 2011, 12, 126–135. [Google Scholar] [CrossRef] [PubMed]
  62. Lee, J.S.; Galvin, K.M.; See, R.H.; Eckner, R.; Livingston, D.; Moran, E.; Shi, Y. Relief of YY1 transcriptional repression by adenovirus E1A is mediated by E1A-associated protein p300. Genes. Dev. 1995, 9, 1188–1198. [Google Scholar] [CrossRef] [PubMed]
  63. Tsunoda, T.; Takagi, T. Estimating transcription factor bindability on DNA. Bioinformatics 1999, 15, 622–630. [Google Scholar] [CrossRef] [PubMed]
Figure 1. TFBind software (https://tfbind.hgc.jp/) was used to select putative binding sites for YY1 and CREB transcription factors based on a minimal similitude score of 0.8. Location refers to the position of the initial nucleotide in the identified sequence. Signal lists the sequence in the CLDN6 promoter where there is a high probability that the transcription factors bind.
Ijms 24 13974 g001
Figure 2. Expression of CLDN6, YY1, and CREB in H. pylori LPS-stimulated AGS cells. (A) AGS cells were exposed to 10 ng/mL of H. pylori LPS, and the expression of CLDN6, YY1, and CREB was evaluated at different time intervals, (B) Quantitative representation of the densitometric evaluation of the western blot shown in A. All the experiments were performed in triplicate. The difference in expression was determined using ANOVA and Dunnett’s test. *, **, and *** represent 0.05, 0.01, and 0.001 p-values, respectively.
Ijms 24 13974 g002
Figure 3. Transcriptional activity of different regions of the CLDN6 promoter. AGS cells were exposed to 10 ng/mL of H. pylori LPS, and the transcriptional activity of the CLDN6 promoter was determined in (A) different regions cloned in the pMetLuc2 vector and (B) transcriptional activity in relative units (RLU) in the cloned regions (the values did not reach statistical significance). (C) The normalized RLU data of the results showed a significant difference in transcriptional activity between the −901 and the −1421 region from 12 h of LPS exposure. All the experiments were performed in triplicate. The difference in expression was determined using ANOVA and Dunnett’s test. ** represent 0.01 p-value.
Ijms 24 13974 g003
Figure 4. YY1 and CREB silencing in H. pylori LPS-treated AGS cells. Specific siRNA for YY1 and CREB were used to silence their expression in H. pylori LPS-treated AGS cells. (A) CREB and YY1 silencing; scramble siRNA was used as a negative control. (B) Effect of YY1 and CREB silencing on CLDN6 expression. (C) Quantitative expression of the results shown as histograms. All the experiments were performed in triplicate. All the experiments were performed in triplicate. The difference in expression was determined using ANOVA and Dunnett’s test. ** and **** represent 0.01 and 0.0001 p-values, respectively.
Ijms 24 13974 g004
Figure 5. Interaction of YY1 and CREB in the CLDN6 promoter. (A) The putative binding sites of YY1 and CREB in the 901–1421 region; (B) CHIP assay corroborating the occupancy sites and the presence of a non-predicted YY1 site in the 1279–1421 region; (C) histograms presenting the relative signal quantification compared to the control (input). All the experiments were performed in triplicate.
Ijms 24 13974 g005
Figure 6. Sequential CHIP assays. Confirmation of YY1 and CREB interaction in the 1279–1421 region via sequential CHIP assays. All the experiments were performed in triplicate.
Ijms 24 13974 g006
Disclaimer/Publisher’s Note: The statements, opinions and data contained in all publications are solely those of the individual author(s) and contributor(s) and not of MDPI and/or the editor(s). MDPI and/or the editor(s) disclaim responsibility for any injury to people or property resulting from any ideas, methods, instructions or products referred to in the content.

