Abstract
Oxidative stress is a common phenomenon of many liver disorders; it both affects patient survival and directly influences the applicability, effectiveness, and toxicity of drugs. In the pursuit of reliable natural remedies for hepatoprotection, this study reports on the complete phytochemical characterization, antioxidant, and hepatoprotective activities of the Prenanthes purpurea methanol-aqueous extract in an in vitro model of diclofenac-induced liver injury (DILI). An ultra high-performance liquid chromatography–high-resolution mass spectrometry analysis (UHPLC-HRMS) was conducted, delineating more than 100 secondary metabolites for the first time in the species, including a series of phenolic acid-hexosides, acylquinic, acylhydroxyquinic and acyltartaric acids, and flavonoids. Quinic acid, chlorogenic, 3,5-dicaffeoylquinic and 5-feruloylhydroxyquinic acid, caffeoyltartaric and cichoric acids, eryodictiol-O-hexuronide, and luteolin O-hexuronide dominated the phytochemical profile and most likely contributed to the observed hepatoprotective activity of the studied P. purpurea leaf extract. The potency and molecular basis of cellular protection were investigated in parallel with pure caffeoylquinic acids in a series of pretreatment experiments that verified the antiapoptotic and antioxidant properties of the natural products.
1. Introduction
Hepatic injury and function have extensively been studied in numerous experimental and clinical settings. The toxicodynamic mechanisms of well-known liver-targeting noxious stimuli have successfully been recreated in various experimental models in the search for promising strategies to counteract them. Being the central detoxifying organ, the liver is exposed to the direct damaging action of virtually any xenobiotic; however, drug-induced hepatotoxicity is a hallmark side effect of a few pharmacological classes including non-steroidal anti-inflammatory drugs (NSAIDs), antibiotics, antituberculosis, and antiepileptic medications [1,2]. Furthermore, various infectious and other diseases or conditions (i.e., virus infections, obesity, alcohol abuse, hereditary and autoimmune disorders, etc.) have been implicated in liver failure, exacerbating the urgency for efficient therapeutic approaches for hepatoprotection.
Acute hepatitis is the most common form of drug-induced liver injury (DILI), which in 10% of cases, is linked to NSAID use [3,4]. On one hand, these are among the most commonly used medications available over the counter and by prescription; and on the other, they comprise a widely heterogenous group in terms of both structural and therapeutic properties [4,5]. Diclofenac, an acetic acid derivative, has been associated with a significantly higher incidence of hepatotoxicity than other NSAIDs, causing idiosyncratic DILI of a mostly hepatocellular (cytolytic) type [3,4,6,7]. The precise molecular mechanisms by which diclofenac impairs liver function are multifactorial and not thoroughly elucidated; however, several toxicological models have been proposed. A potential role in idiosyncratic hepatotoxicity is played by the generation of reactive quinone imine metabolites and ROS in the first phase of diclofenac’s metabolism and the subsequent impairment of mitochondrial function [8,9,10,11]. Undergoing drug glucuronidation in the conjugation phase facilitates the formation of glucuronide–protein adducts with neoantigenic properties, thus inducing an autoimmune response culminating in hepatocyte death [9,12,13]. In light of these findings, inducing the intrinsic antioxidant defense system of hepatocytes has been the most lucrative strategy for shielding the organ from oxidative stress damage, which is recognized as a primary pathogenetic factor in DILI, as well as other liver diseases.
In vitro models of diclofenac-induced toxicity on both isolated animal hepatocytes and immortalized hepatic cell lines have been extensively used to study the molecular basis of DILI and the possible mechanisms of liver protection and regeneration by pharmacological and natural remedies [7,14,15]. About 50% of the hepatoprotective products and additives used nowadays are of plant origin, many of which have undergone clinical trials targeting patient groups with different liver conditions, including silymarin, picroside, phyllanthin, glycyrrhizin, curcumin, and berberine, among others [14,16]. Many food and medicinal plants are evidenced to be abundant in polyphenolic phytochemicals with a prominent ROS scavenging capacity and other biologically active constituents with the ability to boost antioxidant enzyme activity and modulate gene expression and cell survival pathways [16,17].
Of the many classes of biologically active secondary metabolites, caffeic acid derivatives are receiving growing attention due to mounting evidence of their antioxidant and hepatoprotective activity [18,19]. Moreover, different sub-classes of these polyphenolic conjugates, such as caffeoyl quinic and caffeoyl tartaric acids, have been proven to be reliable chemophenetic markers within the plant species from the Cichorieae tribe of the Asteraceae family [20].
The genus Prenanthes L. within the subtribe Hypochaeridinae (Cichorieae tribe, Asteraceae family) is widely distributed in Asia, Africa, North America, and Central and Southern Europe and consists of around 30 species [21,22,23,24]. Regarding their chemical composition, the species of the subtribe are a rich source of various valued secondary metabolites, with the flavonoids and sesquiterpenoids being characteristic for the taxa [25,26,27]. The most widely and commonly researched metabolites have been caffeic acid derivatives isolated from economically important taxa, such as Cichorium intybus, Lactuca sativa, and Taraxacum officinale [28]. However, this is the first extensive study on the phytochemical profile and biological activity of the investigated Cichorieae species, namely Prenanthes purpurea. Previously, chlorogenic, 3,5-dicaffeoylquinic, caffeoyl tartaric, and cichoric acids were reported [24], and a new di-O-cinnamoyl-trisaccharide derivative was isolated from the methanolic extract of P. purpurea leaves (Austrian origin) [29]. From the polar fraction of the P. acerifolia water extract, a new guaiane-type sesquiterpene lactone, prenanthelide A, and three new guaiane-type sesquiterpene glycosides—prenanthesides A, B, and C—have been isolated together with three known guaiane-type sesquiterpene glycosides, ixerin D, 8-epidesacylcynaropicrin glucoside, and crepiside E [30]. As for their biological activity, the presence of antidiabetic, antibacterial, analgesic, and anti-inflammatory properties of oncocalyxone A isolated from P. sarmentosus leaves has been established [31].
Hence, as a part of our outgoing investigation on Asteraceae species, P. purpurea was subjected to a phytochemical and biological characterization. To the best of our knowledge and based on the above-mentioned literature survey, there are no profound inquiries on the in vitro antioxidant and hepatoprotective activity of the studied taxon. Additionally, in-depth studies on both the chemical composition and the biological activity of the species are missing and appear to be worth value.
The main objectives of this study were to provide a phytochemical profiling of the aerial parts of Prenanthes purpurea (PE) and to evaluate its hepatoprotective activity in a comparative manner to plant-derived polyphenols chlorogenic acid (CA) and 3,5-dicaffeoylquinic acid (3,5-DiCQA). The pharmacodynamic properties of PE and one of its major constituents, CA, were studied in the context of oxidative stress in a suitable in vitro model (HEP-G2 cells) of diclofenac-induced cytotoxicity, tracing expression changes in a cluster of related proteins. The antagonistic effect of PE, CA, and 3,5-DiCQA on NSAID drug toxicity was estimated in a detailed “dose-effect” analysis of each drug combination using Compusyn® 1.0 software based on the Chou-Talalay method [32].
2. Results and Discussion
2.1. A Secondary Metabolite Profiling of a P. purpurea Extract
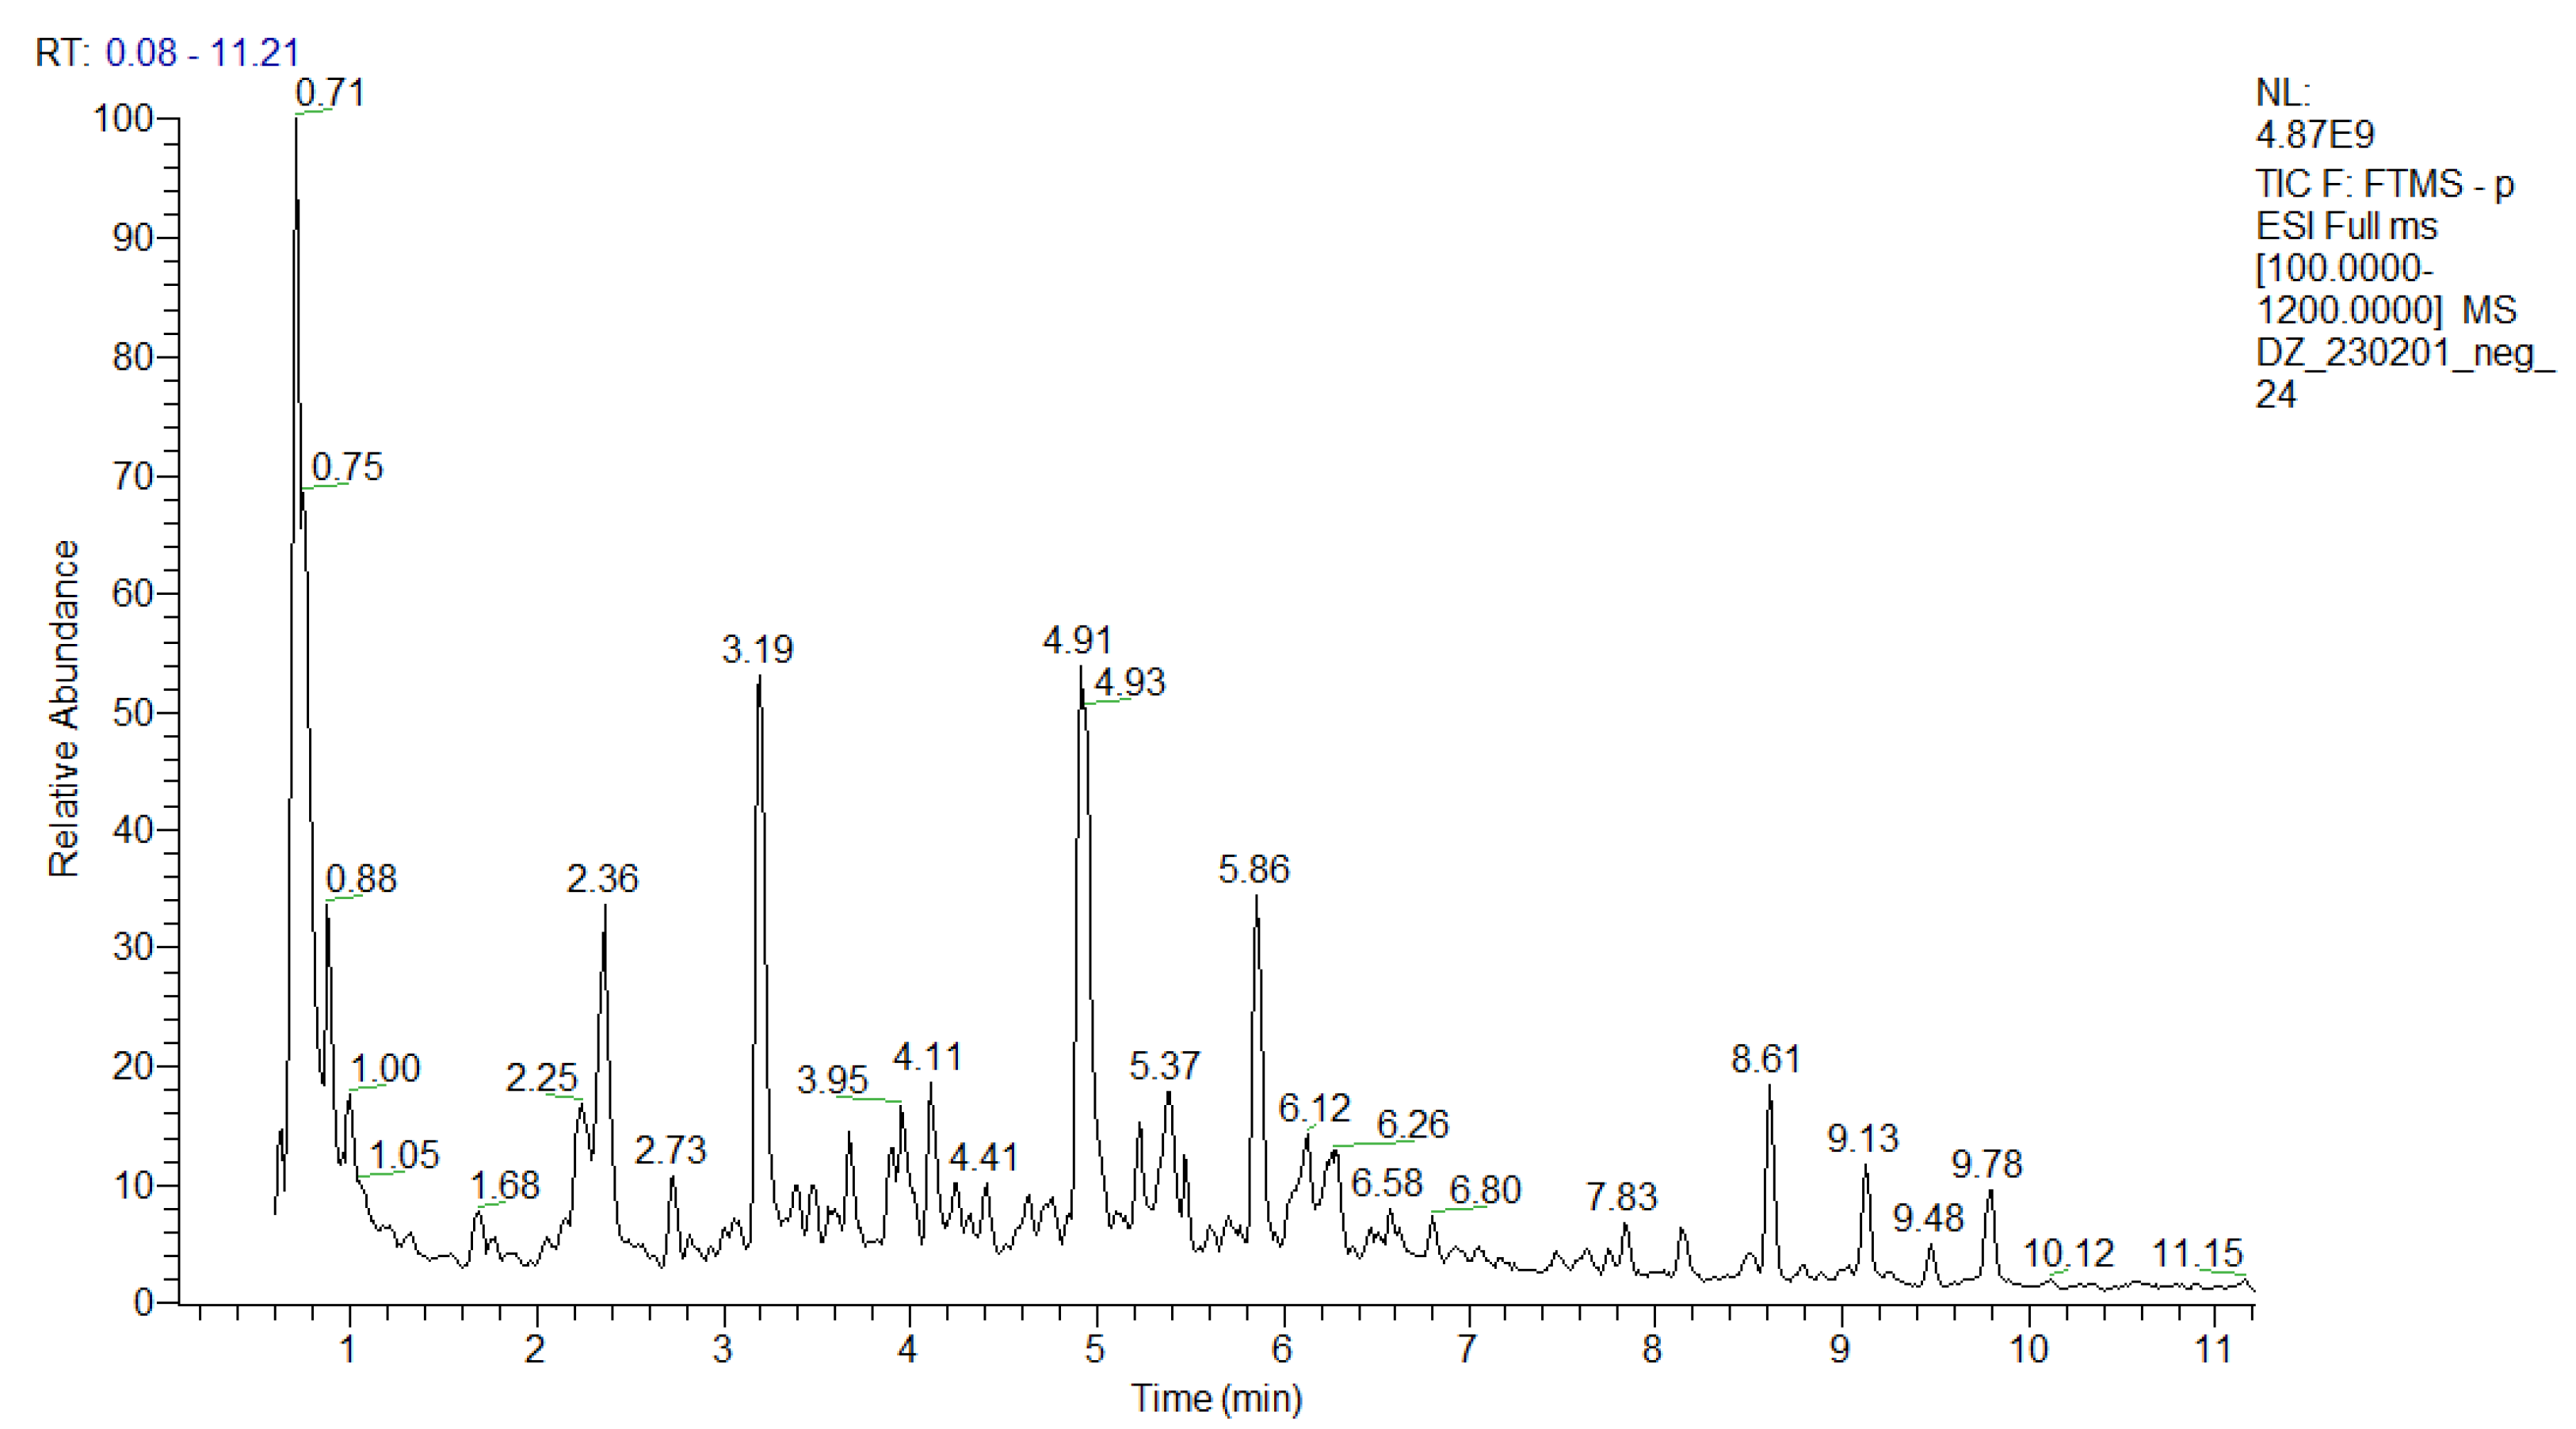
An in-depth UHPLC-HRMS analysis of a P. purpurea methanol-aqueous extract was performed, allowing for the identification/annotation of more than 100 secondary metabolites (Table 1 and Table S1). To the best of our knowledge, this study is the first attempt at a phytochemical profiling of the species. Herein, 39 compounds were assigned to phenolic acids and derivatives and simple coumarins including a series of hydroxybenzoic and hydroxicinnamic acids glycosides and 6 phenylethanoid glycosides. Thirty-one compounds were ascribed as acylquinic acids, among them 6 monoacylhydroxyquinic acids, 5 acylquinic acids hexosides, and 2 caffeoyl-hydroxydihydrocaffeoylquinic acid. Within a group of acyltartaric acids, p-coumaroyl-caffeoyltartaric, feruloyl-caffeoyltartaric, and dicaffeoyltartaric acids were tentatively identified. Among the flavonoids, it is worth noting the presence of hexuronides and the acetylhexosides of apigenin, luteolin, and naringenin. The total ion chromatogram (TIC) in negative ion mode of the studied extract was depicted in Figure 1.
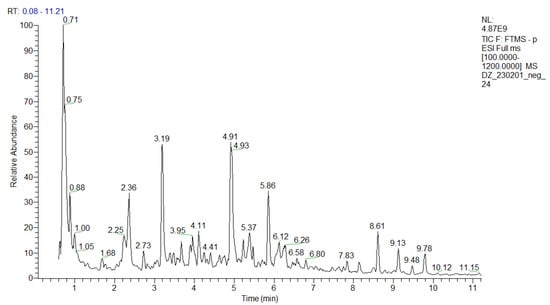
Figure 1.
TIC in negative ion mode of the P. purpurea extract.
This study is also the first attempt at an in-depth secondary metabolite annotation of the species from the subtribe Hypochaeridinae (Cichorieae tribe, Asteraceae family) using the hyphenated technique LC-MS, allowing for the identification of a series of acylquinic, acylhydroxyquinic, and acyltartaric acids and flavonoids not previously reported even in the subtribe taxa (Table 1 and Table S1, Figure 1 and Figures S1–S4).
2.1.1. Hydroxybenzoic and Hydroxycinnamic Acids and Their Derivatives
Numerous hydroxybenzoic and hydroxycinnamic acid glycosides were annotated including hexosides (2–5, 8, 9, 11, 12, 14, 17, 18, 23 and 30) together with a hexosylpentoside of protocatechuic acid (10) and deoxyhexoside of vanillic (22), and syringic acid (28) (Table 1). Compounds 35, 36, and 38 shared the same deprotonated molecules [M-H]− at m/z 477.104 (calc. for C22H21O12). The presence of caffeoyl and protocatechuyl residue was deduced from the transitions 477.104→315.072 [M-H-C9H6O3]− and 315.072→153.0181 [M-H- (C9H6O3 + C6H10O5]−, supported by the prominent fragment ions at m/z 161.023 [caffeic acid-H-H2O]− and 153.018 [protocatechuic acid-H-H2O]−. Accordingly, 35, 36, and 38 were assigned to protocatechuic acid-(caffeoyl)-hexosides (Figure 2). In the same way, syringic acid at m/z 197.045, gallic acid at m/z 169.013, and hydroxybenzoic acid at m/z 137.023 was dedicated in 24, 34, and 39, respectively. Thus, they were ascribed as syringic acid (caffeoyl)-hexoside, gallic acid-(caffeoyl)-hexoside, and caffeic acid-(hydroxybensoyl)-hexoside. The MS/MS spectra of sugar esters hydroxybensoyl-hexose (7) and caffeoyl-hexose (13) were acquired. The precursor ions provided fragment ions resulting from the hexose cross ring cleavages as 0,4Hex (−60 Da), 0,3Hex (−90Da), and 0,2Hex (−120 Da) [33]. Based on the comparison with the retention times and fragmentation patterns of reference standards, 5 hydroxybenzoic acids (1, 6, 16, 33 and 37) and 4 hydroxycinnamic acids (19, 25, 27 and 31) together with umbelliferone (20) and quinic acid (21) were identified in the extracts (Table S1, Figure S1).
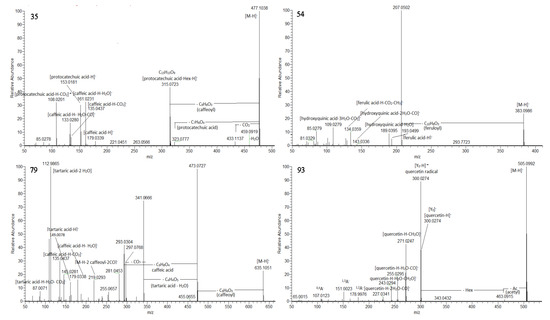
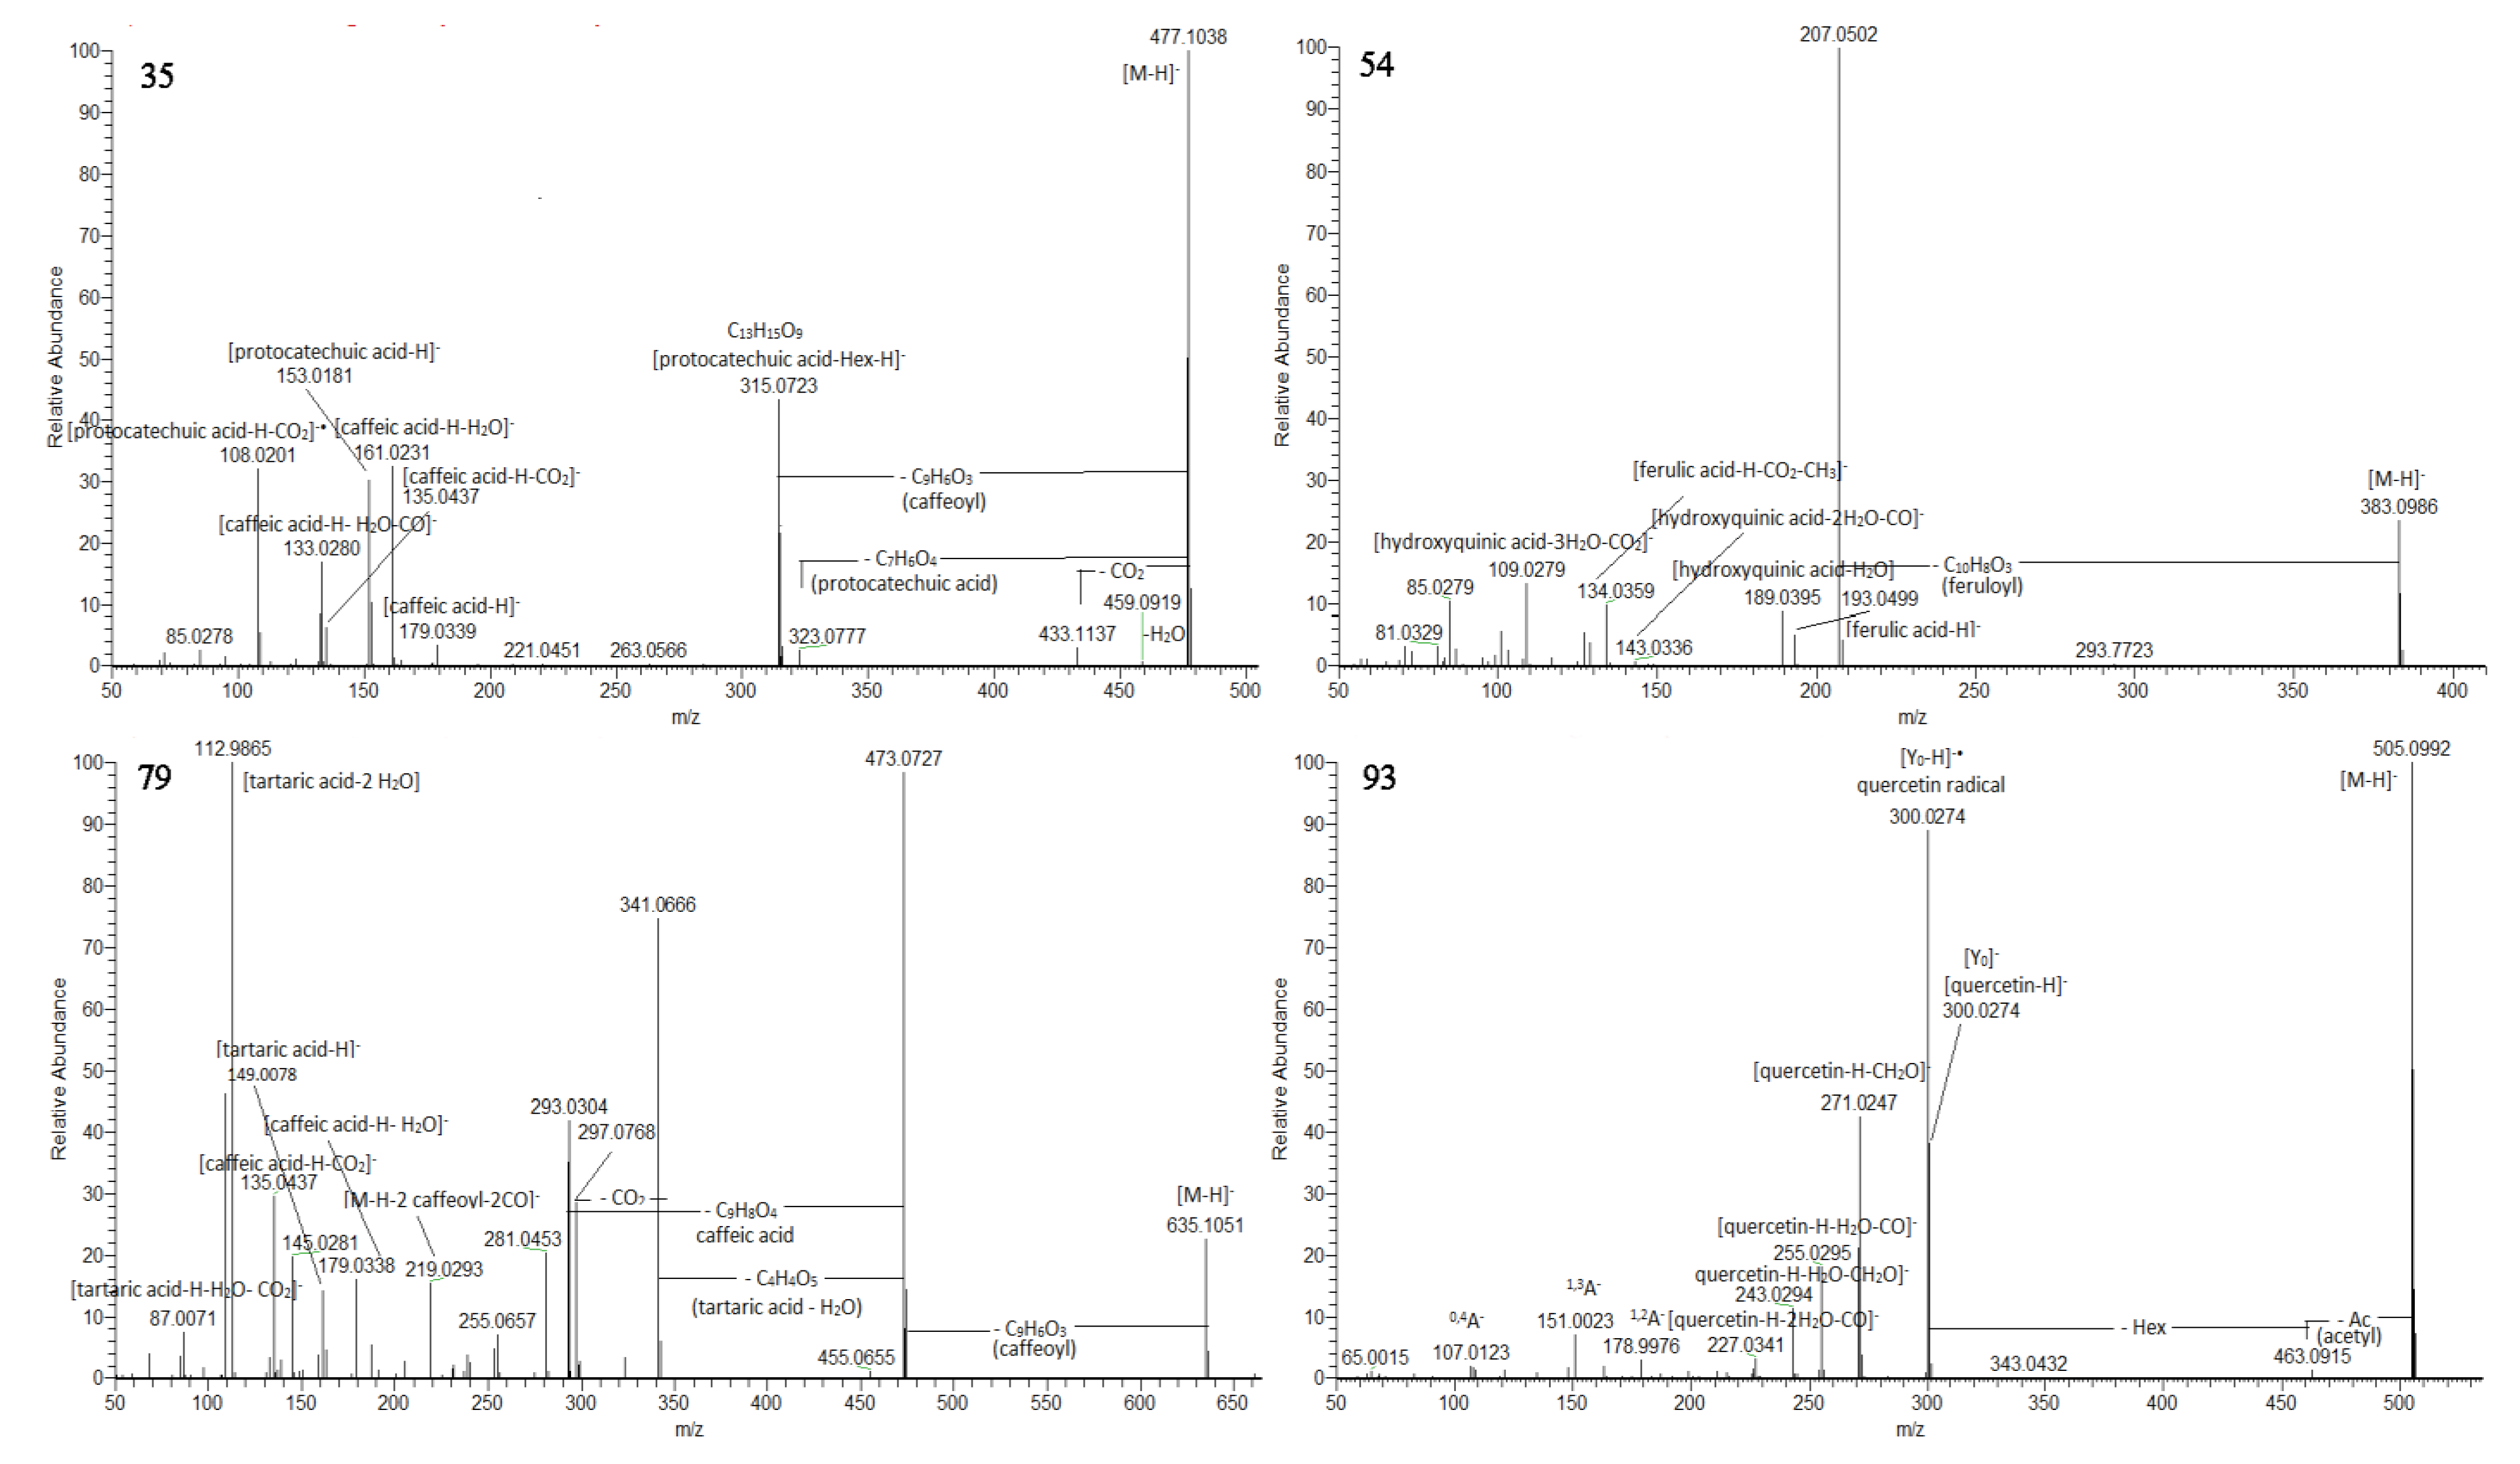
Figure 2.
MS/MS spectra of protocatechuic acid –(caffeoyl)-hexoside 1 (35), 5-feruloyl-2-hydroxyquinic acid (54), tricaffeoyltartaric acid (79), and quercetin-acetylhexoside (93).
Within this group, 21 (quinic acid) (7.76%) was the main compound in the studied extract, together with 4 (6.07%), 7 (6.04%), 8 (6.01%), and 15 (5.20%) (Figure S1). Although hydroxybenzoic and hydroxycinnamic acids were present in their free forms, a large number of phenolic acids hexosides were evidenced herein in P. purpurea for the first time.
2.1.2. Acylquinic Acids (AQAs)
Overall, 8 monoAQA and 10 diAQA acids together with 6 monoacylhydroxyquinic acids and 4 feruloylquinic acid glycosides and 1 dicaffeoylquinic acid hexoside were dereplicated or annotated in the P. purpureum extract (Table 1 and Table S1, Figure S2). The AQAs annotation was based on diagnostic ions and their relative abundances corresponding to each subclass AQAs [34,35,36]. Thus, the base peaks at m/z 191.055 indicated substitution at C-5 of the quinic acid skeleton. Accordingly, 43/51, 47/56, and 52/60 were ascribed as 5-caffeoyl-, 5-feruloyl-, and 5-p-coumaroylquinic acid and their isomers, respectively.
The assignment of feruloylquinic acid-hexoside/pentoside (41/46 and 48/59) was suggested by the transitions 529.157→367.103 and 499.146→367.103, respectively, resulting from the losses of hexosyl (162.053 Da) and pentosyl units (132.043 Da) (Table S1).
Compounds 42/49 ([M-H]− at m/z 369.083), 45/58 ([M-H]− at m/z 353.088), and 54/61 ([M-H]− at m/z 383.099) provided a base peak at m/z 207.050 (calc. for C7H11O7), indicating hydroxyquinic acid (HQA) and losses of caffeoyl, p-coumaroyl and feruloyl residue, respectively (Table S1). Additionally, the presence of hydroxyquinic acid was supported by the series of prominent fragment ions at m/z 189.040 [HQA-H-H2O]−, 143.034 [HQA-H-2H2O-CO]−, 127.039 [HQA-H-2H2O-CO2]−, 109.028 [HQA-H-3H2O-CO2]−, and 85.028 [HQA-H-C3H6O5]−. Via analogy with monoAQAs, 42/49 were related to 5-caffeoylHQA, 45/58—to 5-p-coumaroylHQA, while 5-feruloylHQA were deduced for 54/61 (Figure 2).
Compounds 50 and 55 shared the same [M-H]− at m/z 677.194 (calc. for C28H37O19 (Table 1 and Table S1). They afforded indicative fragment ions at m/z 383.099 [M-H-C11H18O9]−, resulting from the concomitant losses of pentose and hexose unit. Hydroxyquinnic and feruloyl acid were evidenced by the prominent ions at m/z 207.050 [M-H-Pent-Hex-C10H8O3]− and 193.050 [M-H-Pent-Hex-Ferulic acid]−, supported by the corresponding series of neutral and radical (from feruloyl residue) losses. Accordingly, 50 and 55 were annotated as isomeric 5-feruloyl-HQA- hexosylpentoside.

Table 1.
Secondary metabolites in P. purpurea methanol-aqueous extracts.
Table 1.
Secondary metabolites in P. purpurea methanol-aqueous extracts.
| No. | Identified/Tentatively Annotated Compound | Molecular Formula | Exact Mass [M-H]− | tR (min) | Δppm | Level of Confidence [37] |
|---|---|---|---|---|---|---|
| Hydroxybenzoic and hydroxycinnamic acids, and phenylethanoid glycosides | ||||||
| 1 | gallic acid a | C7H6O5 | 169.0142 | 1.15 | −7.198 | 1 |
| 2 | gallic acid-hexoside | C13H15O10 | 331.0678 | 1.22 | 0.212 | 2 |
| 3 | hydroxybenzoic acid-O-hexoside | C13H16O8 | 299.0778 | 1.29 | 3.074 | 2 |
| 4 | protocatechuic acid-O-hexoside | C13H16O9 | 315.0727 | 1.67 | 0.269 | 2 |
| 5 | vanillic acid-O-hexoside | C14H18O9 | 329.0875 | 1.76 | 2.111 | 2 |
| 6 | protocatechuic acid a | C7H6O4 | 153.0181 | 2.04 | −9.358 | 1 |
| 7 | O-hydroxybenzoyl-hexose | C13H16O8 | 299.0778 | 2.06 | −0.002 | 2 |
| 8 | protocatechuic acid-O-hexoside | C13H16O9 | 315.0727 | 2.11 | 0.459 | 2 |
| 9 | syringic acid-O-hexoside | C15H20O10 | 359.0985 | 2.27 | 0.808 | 2 |
| 10 | protocatechuic acid-hexosylpentoside | C18H24O13 | 447.1144 | 2.37 | 0.394 | 2 |
| 11 | caffeic acid O- hexoside | C15H18O9 | 341.0871 | 2.42 | −4.677 | 2 |
| 12 | hydroxybenzoic acid-O-hexoside | C13H16O8 | 299.0778 | 2.45 | 0.600 | 2 |
| 13 | O-caffeoyl hexose | C15H18O9 | 341.0871 | 2.50 | −2.537 | 2 |
| 14 | gentisic acid-O-hexoside | C13H16O9 | 315.0727 | 2.58 | 1.316 | 2 |
| 15 | aesculetin-O-hexoside | C15H15O9 | 339.0724 | 2.73 | 0.515 | 2 |
| 16 | 4-hydroxybenzoic acid | C7H6O3 | 137.0230 | 2.85 | −10.709 | 2 |
| 17 | hydroxybenzoic acid-O-hexoside | C13H16O8 | 299.0778 | 3.01 | 2.539 | 2 |
| 18 | caffeic acid O-hexoside | C15H18O9 | 341.0871 | 3.08 | −0.367 | 2 |
| 19 | p-coumaric acida | C9H8O3 | 163.0389 | 3.10 | −7.835 | 1 |
| 20 | umbelliferone | C9H6O3 | 161.0244 | 3.16 | −8.057 | 2 |
| 21 | quinic acid | C7H12O6 | 191.0549 | 3.19 | −5.921 | 2 |
| 22 | vanillic acid O-deoxyhexoside | C14H18O8 | 313.0929 | 3.26 | 0.509 | 2 |
| 23 | coumaric acid-O-hexoside | C15H18O8 | 325.0930 | 3.33 | −1.386 | 2 |
| 24 | syringic acid-(caffeoyl)-pentoside | C22H20O13 | 491.0831 | 3.34 | −0.028 | 2 |
| 25 | m-coumaric acid a | C9H8O3 | 163.0389 | 3.35 | −8.203 | 1 |
| 26 | aesculetin | C9H6O4 | 177.0193 | 3.46 | −6.790 | 2 |
| 27 | caffeic acid a | C9H8O4 | 179.0339 | 3.55 | −5.810 | 1 |
| 28 | syringic acid O-deoxyhexoside | C15H20O9 | 343.1035 | 3.65 | 0.363 | 2 |
| 29 | caffeoylmalic acid | C13H12O8 | 295.0459 | 4.18 | 0.676 | 2 |
| 30 | coumaric acid-O-hexoside | C15H18O8 | 325.0930 | 4.46 | 0.490 | 2 |
| 31 | o-coumaric acid a | C9H8O3 | 163.0389 | 4.58 | −8.326 | 1 |
| 32 | caffeoylcitramalic acid | C14H14O8 | 309.0616 | 4.76 | 1.745 | 2 |
| 33 | vanillic acida | C8H8O4 | 167.0338 | 4.79 | −7.376 | 1 |
| 34 | gallic acid-(caffeoyl)-hexoside | C22H22O13 | 493.0988 | 5.18 | 0.661 | 2 |
| 35 | protocatechuic acid-(caffeoyl)-hexoside 1 | C22H22O12 | 477.1038 | 5.67 | −0.124 | 2 |
| 36 | protocatechuic acid-(caffeoyl)-hexoside 2 | C22H22O12 | 477.1038 | 5.81 | −0.900 | 2 |
| 37 | salicylic acid a | C7H6O3 | 137.0230 | 6.27 | −10.928 | 1 |
| 38 | protocatechuic acid-(caffeoyl)-hexoside | C22H22O12 | 477.1038 | 6.54 | 0.002 | 2 |
| 39 | caffeic acid-(hydroxybensoyl)-hexoside | C22H22O11 | 461.1089 | 6.60 | 1.226 | 2 |
| Mono- and diacylquinic acids, and derivatives | ||||||
| 40 | neochlorogenic (3-caffeoylquinic) acid a | C16H18O9 | 353.0867 | 2.36 | 0.410 | 1 |
| 41 | 4-feruloylquinic acid-hexoside | C23H30O14 | 529.1563 | 2.64 | 0.872 | 2 |
| 42 | 5-caffeoyl-2-hydroxyquinic acid | C16H18O10 | 369.0827 | 2.82 | −0.379 | 2 |
| 43 | chlorogenic (5-caffeoylquinic) acid a | C16H18O9 | 353.0874 | 3.18 | −1.403 | 1 |
| 44 | 4-caffeoylquinic acid | C16H18O9 | 353.0878 | 3.37 | 0.495 | 2 |
| 45 | 5-p-coumaroyl-2-hydroxyquinic acid 2 | C16H18O9 | 353.0878 | 3.59 | −0.581 | 2 |
| 46 | 5-feruloylquinic acid-hexoside | C23H30O14 | 529.1563 | 3.61 | 0.872 | 2 |
| 47 | 3-feruloylquinic acid | C17H20O9 | 367.1034 | 3.71 | 4.954 | 2 |
| 48 | 5-feruloylquinic acid-pentoside | C22H28O13 | 499.1457 | 3.73 | 1.414 | 2 |
| 49 | 5-caffeoyl-2-hydroxyquinic acid 2 | C16H18O10 | 369.0827 | 2.82 | −0.379 | 2 |
| 50 | 5-feruloyl-hydroxyquinic acid-hexosylpentoside | C28H38O19 | 677.1929 | 3.19 | 1.119 | 2 |
| 51 | 5-caffeoylquinic acid isomer | C16H18O9 | 353.0874 | 3.90 | 0.155 | 2 |
| 52 | 5-p-coumaroylquinic acid | C16H18O8 | 337.0928 | 3.98 | 0.473 | 2 |
| 53 | 3-caffeoyl-5-hydroxy-dihydrocaffeoylquinic acid | C25H26O13 | 533.1288 | 4.03 | 0.574 | 2 |
| 54 | 5-feruloyl-2-hydroxyquinic acid | C17H20O10 | 383.0986 | 4.11 | 0.600 | 2 |
| 55 | 5-feruloyl-hydroxyquinic acid- hexosylpentoside | C28H38O19 | 677.1929 | 4.14 | 3.11 | 2 |
| 56 | 5-feruloylquinic acid | C17H20O9 | 367.1034 | 4.41 | −0.260 | 2 |
| 57 | 1-caffeoyl-3-hydroxy-dihydrocaffeoylquinic acid | C25H26O13 | 533.1288 | 4.45 | 0.540 | 2 |
| 58 | 5-p-coumaroyl-2-hydroxyquinic acid 2 | C16H18O9 | 353.0878 | 4.50 | −0.723 | 2 |
| 59 | 5-feruloylquinic acid-pentoside | C22H28O13 | 499.1457 | 4.51 | 0.573 | 2 |
| 60 | 5-p-coumaroylquinic acid isomer | C16H18O8 | 337.0928 | 4.63 | −0.180 | 2 |
| 61 | 5-feruloyl-2-hydroxyquinic acid | C17H20O10 | 383.0985 | 4.76 | 0.600 | 2 |
| 62 | 1, 3-dicaffeoylquinic acid-hexoside | C31H34O17 | 677.1723 | 5.16 | 1.325 | 2 |
| 63 | 3,4-dicaffeoylquinic acid a | C25H24O12 | 515.1190 | 5.70 | 0.254 | 1 |
| 64 | 3,5-dicaffeoylquinic acid a | C25H24O12 | 515.1189 | 5.85 | −1.416 | 1 |
| 65 | 1,5-dicaffeoylquinic acid a | C25H24O12 | 515.1190 | 6.02 | 0.720 | 1 |
| 66 | 4,5-dicaffeoylquinic acid | C25H24O12 | 515.1190 | 6.23 | 0.196 | 2 |
| 67 | 3-p-coumaroyl-5-caffeoylquinic acid | C25H24O11 | 499.1251 | 6.52 | −0.210 | 2 |
| 68 | 3-caffeoyl-5-p-coumaroylquinic acid | C25H24O11 | 499.1251 | 6.58 | −0.150 | 2 |
| 69 | 1-p-coumaroyl-5-caffeoylquinic acid | C25H24O11 | 499.1251 | 6.79 | −0.751 | 2 |
| 70 | 4-caffeoyl-5-p-coumaroylquinic acid | C25H24O11 | 499.1252 | 6.98 | −0.210 | 2 |
| Acyltartaric acids and derivatives | ||||||
| 71 | caffeoyltartaric acid 1 | C13H12O9 | 311.0409 | 2.16 | 1.495 | 2 |
| 72 | caffeoyltartaric acid 2 | C13H12O9 | 311.0409 | 2.36 | 1.495 | 2 |
| 73 | p-coumaroyltartaric caid | C13H12O8 | 295.0459 | 3.10 | 0.676 | 2 |
| 74 | dicaffeoyltartaric acid-hexoside | C28H28O17 | 635.1254 | 4.32 | −2.318 | 2 |
| 75 | caffeoyl-dihydrocaffeoyltartaric acid | C22H20O12 | 475.0882 | 4.83 | 2.359 | 2 |
| 76 | cichoric acid 1 | C22H18O12 | 473.0725 | 4.91 | −0.949 | 2 |
| 77 | cichoric acid 2 | C22H18O12 | 473.0725 | 5.22 | −0.590 | 2 |
| 78 | p-coumaroyl-caffeoltartaric acid 1 | C22H18O11 | 457.0776 | 5.72 | 2.069 | 2 |
| 79 | tricaffeoyltartaric acid | C31H24O15 | 635.1042 | 5.99 | 1.349 | 2 |
| 80 | caffeoyl-feruloyltartaric acid 1 | C23H20O12 | 487.0882 | 6.05 | −2.647 | 2 |
| 81 | p-coumaroyl-caffeoltartaric acid 2 | C22H18O11 | 457.0776 | 6.10 | −3.007 | 2 |
| 82 | p-coumaroyl-caffeoltartaric acid 3 | C22H18O11 | 457.0776 | 6.65 | −17.034 | 2 |
| 83 | caffeoyl-feruloyltartaric acid 2 | C23H20O12 | 487.0882 | 7.87 | 0.926 | 2 |
| Flavonoids | ||||||
| 84 | luteolin O-hexosyl-(1→6)-hexoside(gentiobioside) | C27H30O16 | 609.1464 | 4.71 | 0.414 | 2 |
| 85 | luteolin O-hexosyl-O-hexuronide | C27H28O17 | 623.1254 | 4.84 | 0.766 | 2 |
| 86 | luteolin O-pentosyl-(1→2)-hexoside | C26H28O15 | 579.1355 | 5.15 | 0.547 | 2 |
| 87 | isorhamnetin O-pentosyl-(1→2)-hexoside | C27H30O16 | 609.1464 | 5.16 | 0.414 | 2 |
| 88 | luteolin 7-O-rutinoside a | C27H30O15 | 593.1512 | 5.22 | 0.399 | 1 |
| 89 | apigenin O-hexosyl-(1→6)-hexoside(gentiobioside) | C27H30O15 | 593.1512 | 5.30 | 0.500 | 2 |
| 90 | eryodictiol O-hexuronide | C21H20O12 | 463.0882 | 5.34 | 0.218 | 2 |
| 91 | luteolin-O-hexuronide | C21H18O12 | 461.0736 | 5.37 | 0.306 | 2 |
| 92 | luteolin 7-O-glucoside a | C21H19O11 | 447.0934 | 5.41 | 0.079 | 1 |
| 93 | quercetin O-acetylhexoside | C23H22O13 | 505.0988 | 5.62 | 0.824 | 2 |
| 94 | isorhamnetin 3-O-glucoside a | C22H21O12 | 477.1044 | 6.02 | 2.056 | 1 |
| 95 | apigenin 7-O-glucoside a | C21H19O10 | 431.0980 | 6.08 | −0.881 | 1 |
| 96 | apigenin-O-hexuronide | C21H18O11 | 445.0774 | 6.12 | −0.617 | 2 |
| 97 | naringenin O-hexuronide | C21H20O11 | 447.0933 | 6.16 | −1.755 | 2 |
| 98 | luteolin O-malonylhexoside | C24H22O14 | 533.0939 | 6.18 | 0.472 | 2 |
| 99 | luteolin O-acetylhexoside | C23H22O12 | 489.1038 | 6.19 | 0.101 | 2 |
| 100 | kaempferol O-acetylhexoside | C23H22O12 | 489.1038 | 6.28 | 0.370 | 2 |
| 101 | luteolin O-hexoside | C21H19O11 | 447.0934 | 6.41 | 0.079 | 2 |
| 102 | naringenin O-acetylhexoside | C23H24O11 | 475.1246 | 6.89 | 3.505 | 2 |
| 103 | luteolin a | C15H9O7 | 285.0406 | 7.58 | 0.346 | 1 |
a—identified by comparison with an authentic standard; level of confidence: 1—compound identified by comparison to the reference standard; 2—putatively annotated compound.
DiAQA belong to a wide spread of Asteraceae subclasses: dicaffeoylquinic acids (diCQA) (63–66), p-coumaroyl-caffeoylquinic acids (p-CoCQA) (67–70), and hydroxydihydrocaffeoyl-caffeolylquinic acids (HC-CQA) (53 and 57).
Compounds 53 and 68 provided diagnostic ions at m/z 353.088, indicating a loss of hydroxydihydrocaffeoyl (53) and p-coumaroyl (68) residue before caffeoyl moiety. Moreover, both compounds provided base peaks at m/z 191.055 accompanied by the abundant ion at m/z 179.034 [caffeic acid-H]−, as was observed in 3-CQA (Table 1 and Table S1). Thus, 53 and 68 were assigned to 3C-5HCQA and 3C-5-p-CoQA, respectively.
Vicinal diCQA 3, 4-diCQA (63), 4,5-diCQA (66), and 4C-5-p-CoQA (70) were evidenced by the distinctive “dehydrated” ion of the quinic acid at m/z 173.045 (Table S1).
3, 5-diCQA (64) and 3-p-Co-5CQA (67) were deduced from the abundant fragment ions at m/z 353.088 [M-H-caffeoyl]− and 337.093, respectively. Prominent ions at m/z 191.055 (79.6%) (64) and 163.039 (100%) (67) were produced as was seen in 3-CQA and 3-p-CoQA, respectively (Table 1 and Table S1).
Peak 62 yielded a precursor ion at m/z 677.173 (calc. for C31H33O17), along with the transitions at m/z 677.173→515.141→353.088→191.055 resulting from the losses of two caffeoyl residues and hexose unit, respectively (Table 1 and Table S1). A 1,3-disubstituted quinic acid skeleton was deduced from the fragment ions at m/z 191.055 (76%), 179.034 (95%), and 135.044 (100%). Thus, 62 was assigned to 1,3-dicaffeoylquinic acid-hexoside. Based on the comparison of retention times and fragmentation patterns of reference standards, compounds 40, 43, 63–65 were identified as neochlorogenic, chlorogenic, 3, 4-, 3, 5- and 1, 5-dicaffeoylquinic acid. The extracted ion chromatograms of acylquinic acids and derivatives showed that the P. purpurea profile was dominated by chlorogenic acid (43) (15.44%), 3,4-dicaffeoylquinic acid (63) (14.74%), 3,5-dicaffeoylquinic acid (64) (14.37%), and 1,5-dicaffeoylquinic acid (65) (13.00%), and 5-feruloyl-2-hydroxyquinic acid (54) (7.13%) (Figure S2).
2.1.3. Acyltartaric Acids
A variety of acyltartaric acids (ATA) was annotated, including 2 monoATA, 8 diATA, 1 diATA-hexoside, and 1 triATA (Table 1 and Table S1, Figure 2 and Figure S3). Based on the distinctive fragment ion at m/z 149.008 [TA-H]− (tartaric acid, TA) supported by the fragments at m/z 112.986 [TA-H-2H2O]− and 103.002 [TA-H-H2O-CO]−, isomeric caffeoyltartaric acids 71 and 72, and p-coumaroyltartaric acid (73) were annotated. Compounds 76 and 77 refer to dicaffeyltartaric (cichoric) acids yielding prominent fragment ions at m/z 311.041 (up to 84.2%) and 149.008 (100%). The assignment of three isobars of p-coumaroyl-caffeoyltartaric acid 78, 81, and 82 (at m/z 457.078, calc. for C22H17O11) was confirmed by the fragments at m/z 295.046 [M-H-caffeoyl]− and 219.029 [M-H-coumaric acid-2CO]− together with the abundant ions at m/z 179.033 [caffeic acid-H]− and 163.034 [p-coumaric acid-H]− (Table 1 and Table S1). In the same way, isobaric caffeoyl-feruloyltartaric acids 80 and 83 were deduced from the fragment ions at m/z 325.057 [M-H-caffeoyl]− and 193.050 [ferulic acid-H]− along with 134.036 [ferulic acid-H-CO2-CH3]−. ATAs show a high degree of stereoisomerism [38], as was observed in the Cicerbita alpina metabolite profiling [39]. Among acyltartaric acids, the predominant compounds in the P. purpurea extract were caffeoyl-dihydrocaffeoyltartaric acid (75) (32.92%), cichoric acid 1 (76) (32.83%), followed by caffeoyltartaric acid 2 (72) (14.86%), and cichoric acid 2 (77) (10.49%) (Figure S3).
2.1.4. Flavonoids
In general, 12 flavone-, 4-flavonol-, and 3 flavanone-glycosides were assigned to flavonoids. The flavonoid annotation/dereplication was based on the diagnostic ions and their relative abundances corresponding to flavonols, flavones, and flavanones [34,35,36].
The sugar chain of 86 and 87 was consistent with pentosylhexoside (294 Da, C16H18O9) (Table S1). As an example, in (−) ESI-MS/MS the precursor ions at m/z 609.146 (87) yielded the deprotonated molecule of isorhamnetin (Y0−) at m/z 315.050 together with an abundant radical aglycone [Y0-H]−• at m/z 314.043 (78.7%), thus suggesting a 3-O-glycosidic bond [40].
The aglycone was discernible by a prominent fragment at m/z 299.1097 [Y0-H-CH3]−• and RDA ions at m/z 178.998 (1,2A−), 151.002 (1,3A−), and 107.012 (0,4A−). In (+) ESI, [M + H]+ at m/z 611.156 exhibited consecutive losses of a pentosyl moiety at m/z 479.118 (12.6%) and a hexosyl one at m/z 317.065 (100%). The assignment of the disaccharide was based on the fragmentation rules of Cuyckens and al., 2004 [40], where the abundances of both agycone and terminal monosaccharide favored pentosyl (1→2)-hexosyl interglycosidic linkage (Table S1). Concerning 84 ([M + H]+ at m/z 611.159) and 89 ([M + H]+ at m/z 595.165), hexosyl-(1→6)-hexoside was deuced from the dihexoside breakdown fragments at m/z 449.107 (25.2%) [M + H-Hex]+ and 433.112 (23.7%), respectively. Luteolin (84) and apigenin (89) were evidenced by the base peaks and RDA ions at m/z 151.002 (1,3A−) and 107.012 (0,4A−), 133.028 (1,3B−) (84), and 117.033 (1,3B−) (89).
A MS/MS spectra of 85 with [M-H]− at m/z 623.126 and [M + H]+ at m/z 625.139 were acquired (Table S1). Prominent fragment ions at m/z 461.073 [M-H-Hex]− and 449.106 [M + H-HexA]+ indicated both O-hexosyl and O-hexuronyl residue. Accordingly, 85 was ascribed as luteolin O-hexosyl-O-hexuronide.
Compounds 91, 96 and 97 showed similar fragmentation patterns affording the base peaks at m/z 285.040 (91), 269.046 (96) and 271.061 (97) [M-H-HexA]−, respectively, suggesting flavonoid hexuronides. The aforementioned were consistent with luteolin-, apigenin-, and naringenin-O-hexuronide, respectively.
Compounds 93, 99, 100, and 102 were closely associated with the same fragmentation pattern yielding fragment ions indicating losses of the acetyl (−42 Da) and acetylhexosyl moieties (−204 Da) (Table S1). Accordingly, the aforementioned compounds were assigned to quercetin-, luteolin-, kaempferol-, and naringenin-O-acetylhexoside (Figure 2).
One malonyl ester of luteolin-hexoside (98) was evidenced on the base of the loss of 86 Da (C3H2O3) at m/z 447.094 and 248 Da (C9H12O8) at m/z 285.040 (Table S1).
Luteolin 7-O-glucoside (92), isorhamnetin 3-O-glucoside (94), and apigenin 7-O-glucoside (95) were unambiguously identified by comparison with reference standards.
Despite the fact that scutellarein (6-hydroxyapigenin) was reported in the subtribe Hypochaeridinae (Hedypnois, Leontodon) [41], the flavone was not proved herein.
The extracted ion chromatograms of flavonoids showed that the P. purpurea profile was dominated by eryodictiol-O-hexuronide (90) (22.48%), luteolin-O-hexuronide (91) (15.74%), together with apigenin-O-hexuronide (96) (13.12%), and naringenin O-hexuronide (30) (13.29%) (Figure S4).
2.2. The Total Polyphenols, Flavonoid Contents, and Antioxidant Activity of the P. purpurea Extract
In this study, the contents of total polyphenols (TP) and total flavonoids (TF), as well as the antioxidant potential of the P. purpurea extract were evaluated using a variety of methods (Table 2). The P. purpurea extract demonstrated moderate levels of polyphenols and flavonoids. DPPH and ABTS+ were used to evaluate its radical scavenging capacity, while reduction abilities were calculated by the CUPRAC, FRAP, and phosphomolybdenum (PHMD) methods. The metal chelating method was based on the binding of transition metals by phytochemicals. Results are presented as trolox equivalents and ethylenediaminetetraacetic acid (EDTA), and the P. purpurea extract revealed the high activity of all of the used antioxidant methods.
Table 2.
The Total polyphenols, flavonoids content, and antioxidant activity of the P. purpurea extract.
In line with the identified compounds and the received data for the total polyphenols, flavonoids content, and antioxidant activity of P. purpurea extract, the results confirm the significant correlation between the total polyphenol content and the presence of dihydroxycinnamic derivatives and caffeic acid derivatives as caffeoylquinic and caffeoyl tartaric acid and the DPPH-scavenging ability of the medicinal plant [42].
Oxidative stress is a key pathophysiological mechanism in many forms of liver diseases. Nevertheless, the application of antioxidants from various natural sources reveals its important clinical potential. In line with the above-mentioned, some of the secondary metabolites identified/annotated in P. purpurea aerial parts are recognized in the literature for their various properties in oxidative stress prevention. Protocatechuic and syringic acid have been noted for their potential antioxidant activity [43,44]. Furthermore, a number of experiments have confirmed the efficacy of vanillic and protocatechuic acid in the prevention of diabetes and neurodegenerative diseases, including Alzheimer’s [45,46]. Moreover, p-coumaric acid is well-known for its antioxidant capacity, prevention, and enhancement of diabetes and neuroprotection [47].
The presence of 3,5- and 4,5-diCQA, and chlorogenic acid suggests a strong antioxidant effect [48]. Additionally, quinic acid, another major compound in P. purpurea aerial parts, revealed prominent antioxidant activity, e.g., in the cell model of H2O2-induced oxidative stress [49]. It is worth noting that the presence of complex compounds carrying caffeoyl residue, such as chicoric and other caffeoyltartaric acids, contributed to the observed antioxidant and hepatoprotective effects of the P. purpurea extract. Moreover, the occurrence of luteolin, apigenin, and their glycosides suggests that the studied plant demonstrates considerable potential as a natural adjuvant treatment for inflammatory and oxidative stress diseases [50].
2.3. In Vitro Evaluation of the Hepatoprotective Activity
2.3.1. Results from the Cell Viability Assays
The in vitro hepatoprotective activity of a methanolic extract from the aerial parts of P. purpurea extract and the natural polyphenolic compounds chlorogenic acid (CA) and 3,5-DiCQA was first assessed in an in vitro model of diclofenac-induced cytotoxicity and oxidative damage in HEP-G2 cells. The design of the study aimed to compare the damaging capacity of a 24 h exposure to six different concentrations of diclofenac in unprotected HEP-G2 cells over cell cultures preincubated for 24 h with either the extract or the isolated phytoconstituents at a fixed 4:1 ratio.
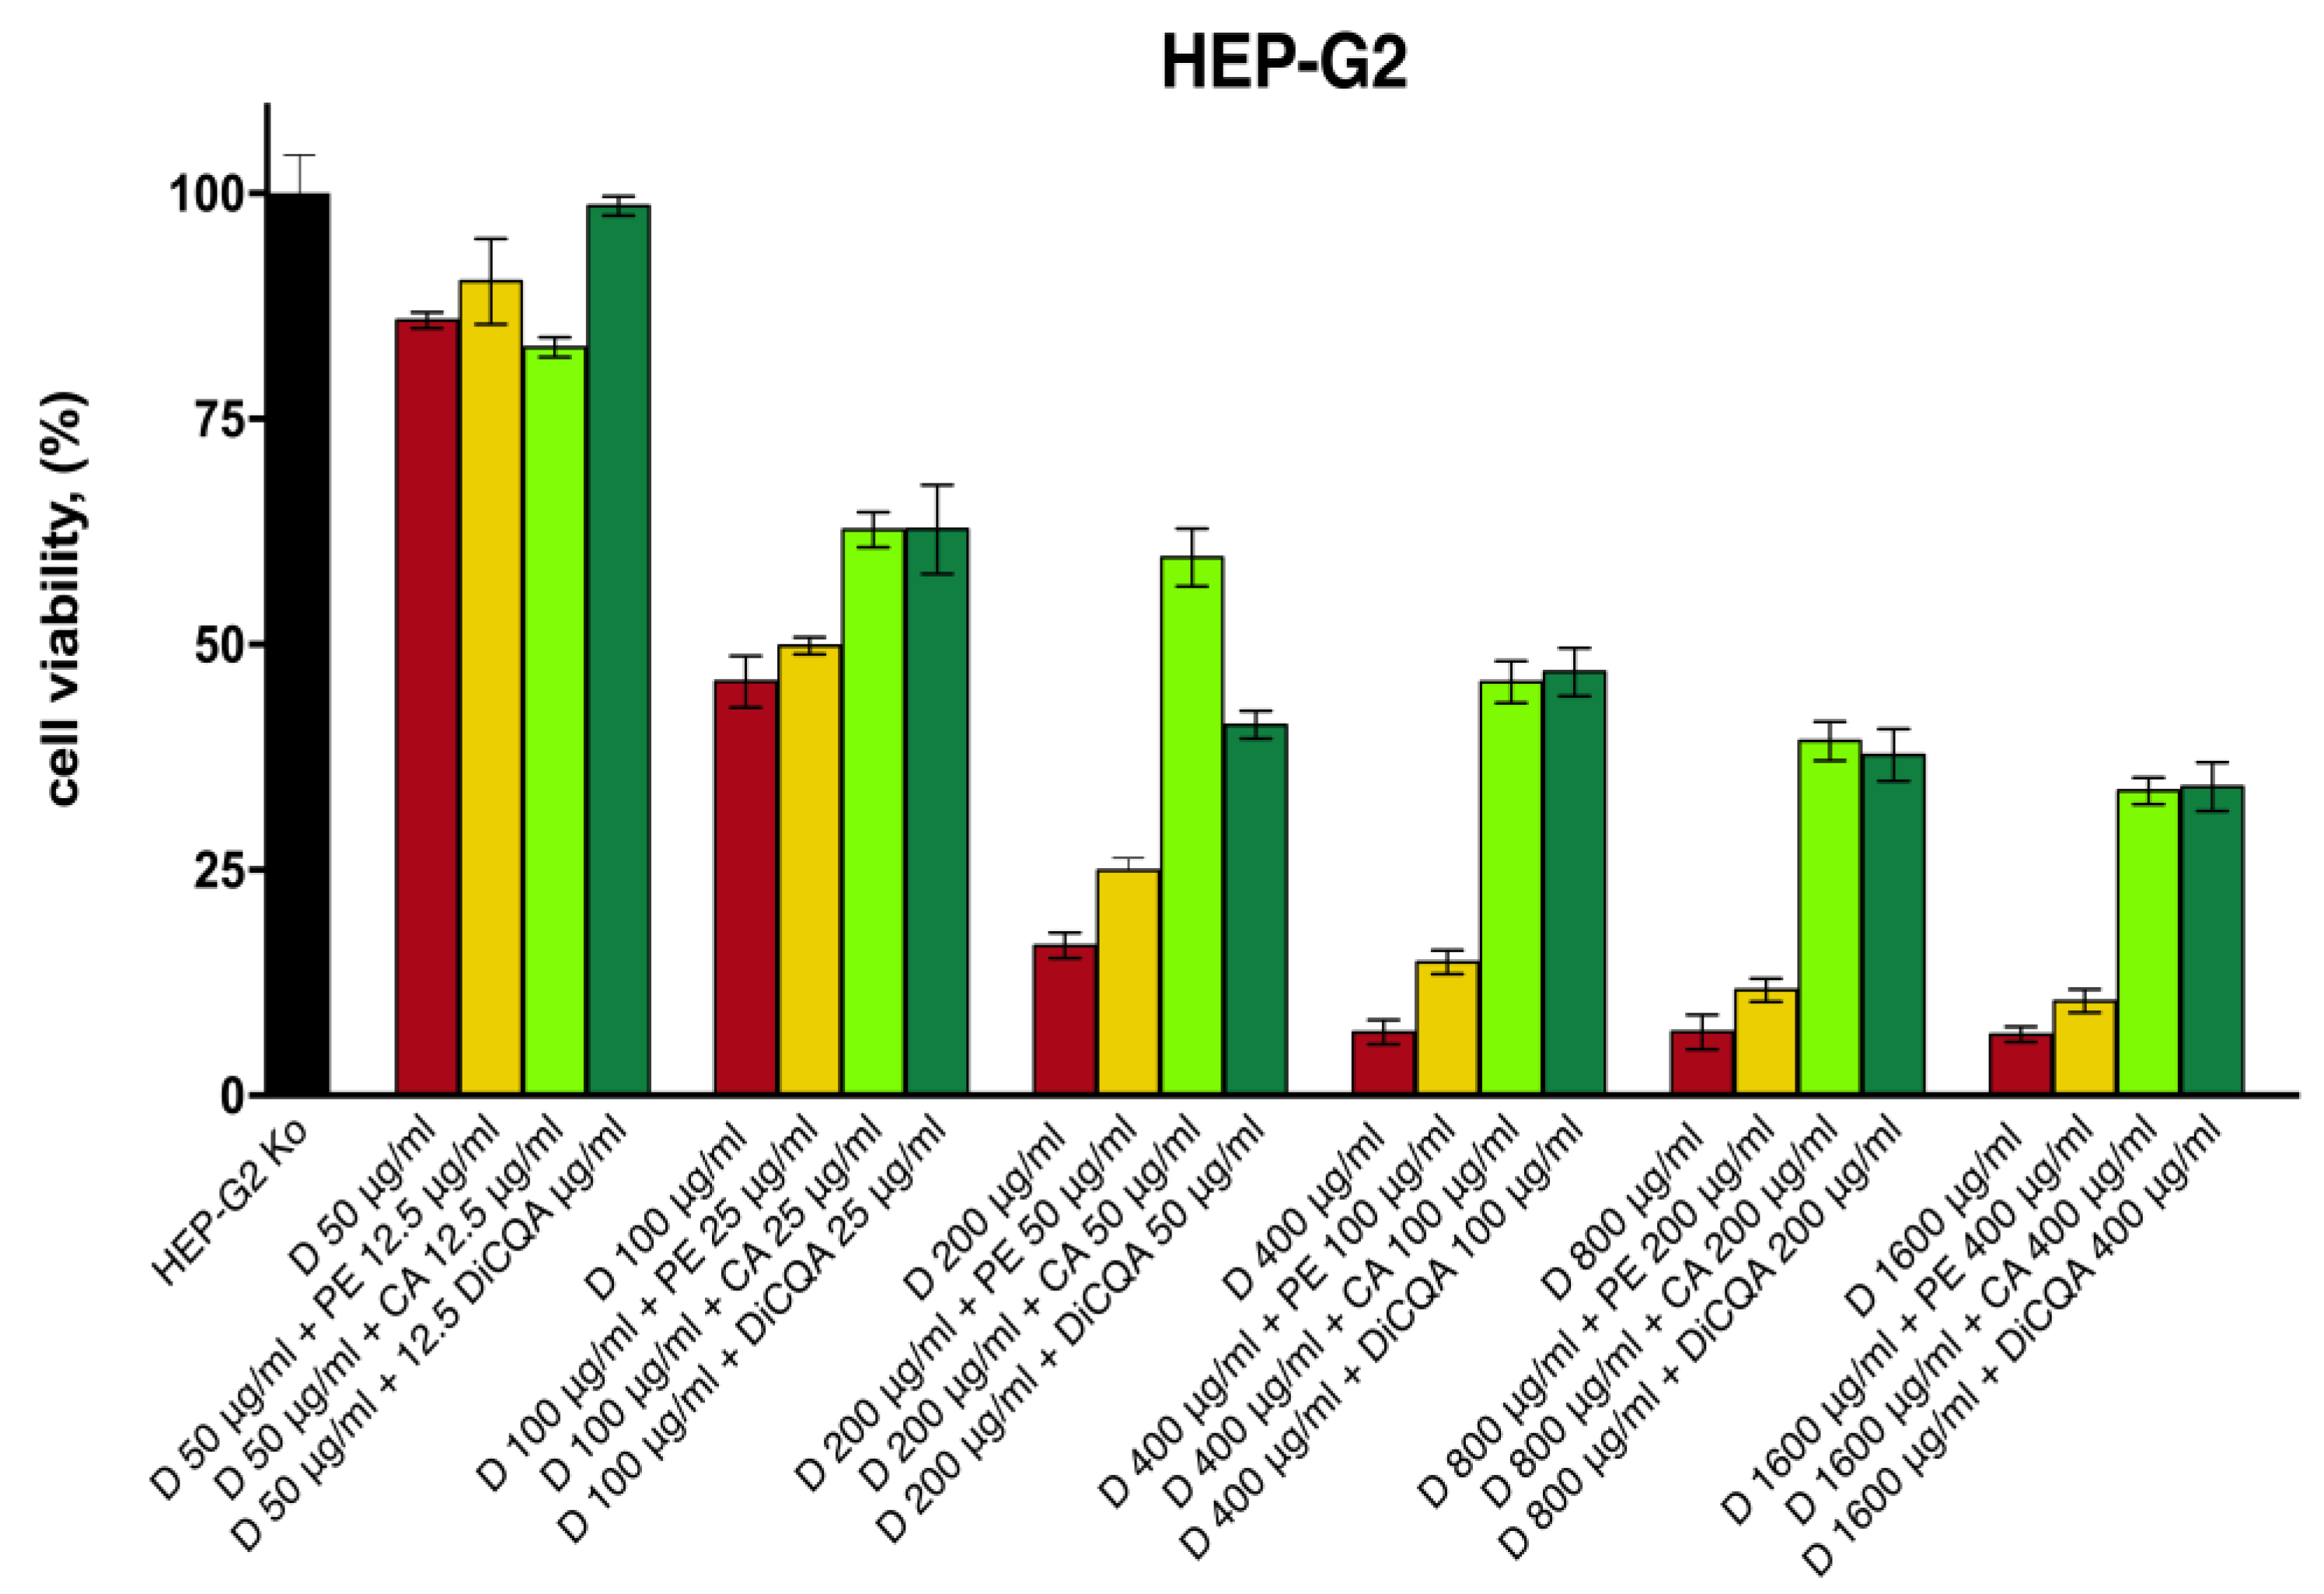
The results obtained in the cytotoxicity study indicate a positive modulating effect on diclofenac’s toxicity across all samples of the tested pretreatment combinations (Figure 3). As anticipated, the pure polyphenolic compounds CA and 3,5-DiCQA provided superior protection for hepatocyte survival, which was more pronounced in the intermediate and higher concentration data sets. Thereby, the percentage of viable cells was increased by several folds as compared with the unprotected diclofenac-treated groups, while the hepatoprotective activity of the isolated substances gradually weakened in the last two serial dilutions. The Prenanthes extract, on the other hand, exerted a more modest, yet consistent cell preserving effect that was less concentration dependent. The strongest hepatoprotective activity upon its 4:1 pretreatment combination was observed in the HEP-G2 samples exposed to 200 µg/mL and 400 µg/mL diclofenac, where cell survival was induced by ca. 50% and 100%, respectively.

Figure 3.
The cell viability of HEP-G2 cells following 24 h exposure to various concentrations of diclofenac: unprotected control group (red), pretreated for 24 h with serial dilutions of the P. purpurea extract (yellow), chlorogenic acid (light green), and DiCQA (dark green) in a fixed 4:1 dose ratio.
The counter aspect of the cell viability studies was to assess the effect of pretreatment on the cytotoxic potential of diclofenac against the HEP-G2 cell line (Table 3). A 24 h preincubation of hepatocyte cultures with the polyphenolic derivatives CA and 3,5-DiCQA resulted in a dramatic nearly two-fold increase in the half-inhibitory concentration of the NSAID (IC50 = 90.0 µg/mL estimated in the monotreatment regimen of diclofenac, as opposed to 174.1 and 160.3 µg/mL in its CA and DiCQA combinations, respectively). On the other hand, the PE pre-exposition had a milder mitigating effect on diclofenac’s cytotoxicity, escalating its equi-effective concentration by only ca. 10%.
Table 3.
The in vitro cytotoxicity of diclofenac [µg/mL ± SD] against HEP-G2 cells when used alone or in a pretreatment regimen with PE, CA, and DiCQA.
2.3.2. Results from the Compusyn® Analysis
The Chou-Talalay methodology is a gold standard approach used to perform interaction analysis in drug combination studies, normally seeking to establish and quantitatively evaluate their synergistic behavior. It is, however, equally appropriate to use the same algorithm in characterizing combined drug effects with an opposite antagonistic pattern, as is essentially the case with all protective experimental studies [32].
In view of this, we subjected the MTT derived cytotoxicity data to an automated analysis in the Compusyn® software, which estimated two major parameters CI (combination index) and DRI (drug reduction index) for the actual experimental as well as simulated data points of the “dose-response” curves. Thereby, the CI values provide a quantitative determination of synergistic (CI < 1), additive (CI = 1), and antagonistic (CI > 1) drug behavior in the fixed 4:1 (diclofenac: pretreatment agent) ratio combinations. Complementarily, DRIs (dose reduction indices) are plotted against the different fractions affected (Fa, % of unviable cells) and indicate the fold-change in the equi-effective concentrations of the single NSAID drug when used in combination for each dataset of the “dose-response” curves. When studying the combined effect of two drugs with an opposite in their nature action (i.e., cytotoxicity, cytoprotection), the stronger the antagonism, the higher the CI values for the inhibitory drug and the closer to 0 its DRI indices.
In our study, the generated Compusyn® reports yielded a full quantitative evaluation on the PE, CA, and DiCQA preconditioning effect on diclofenac’s toxicity all along the simulated “dose-response” curves. However, for the sake of simplicity and comprehensibility, we focused on interpreting the values of the two CI and DRI parameters calculated at the six experimental points (actual treatment concentrations).
Effect of PE pretreatment on diclofenac’s toxicity.
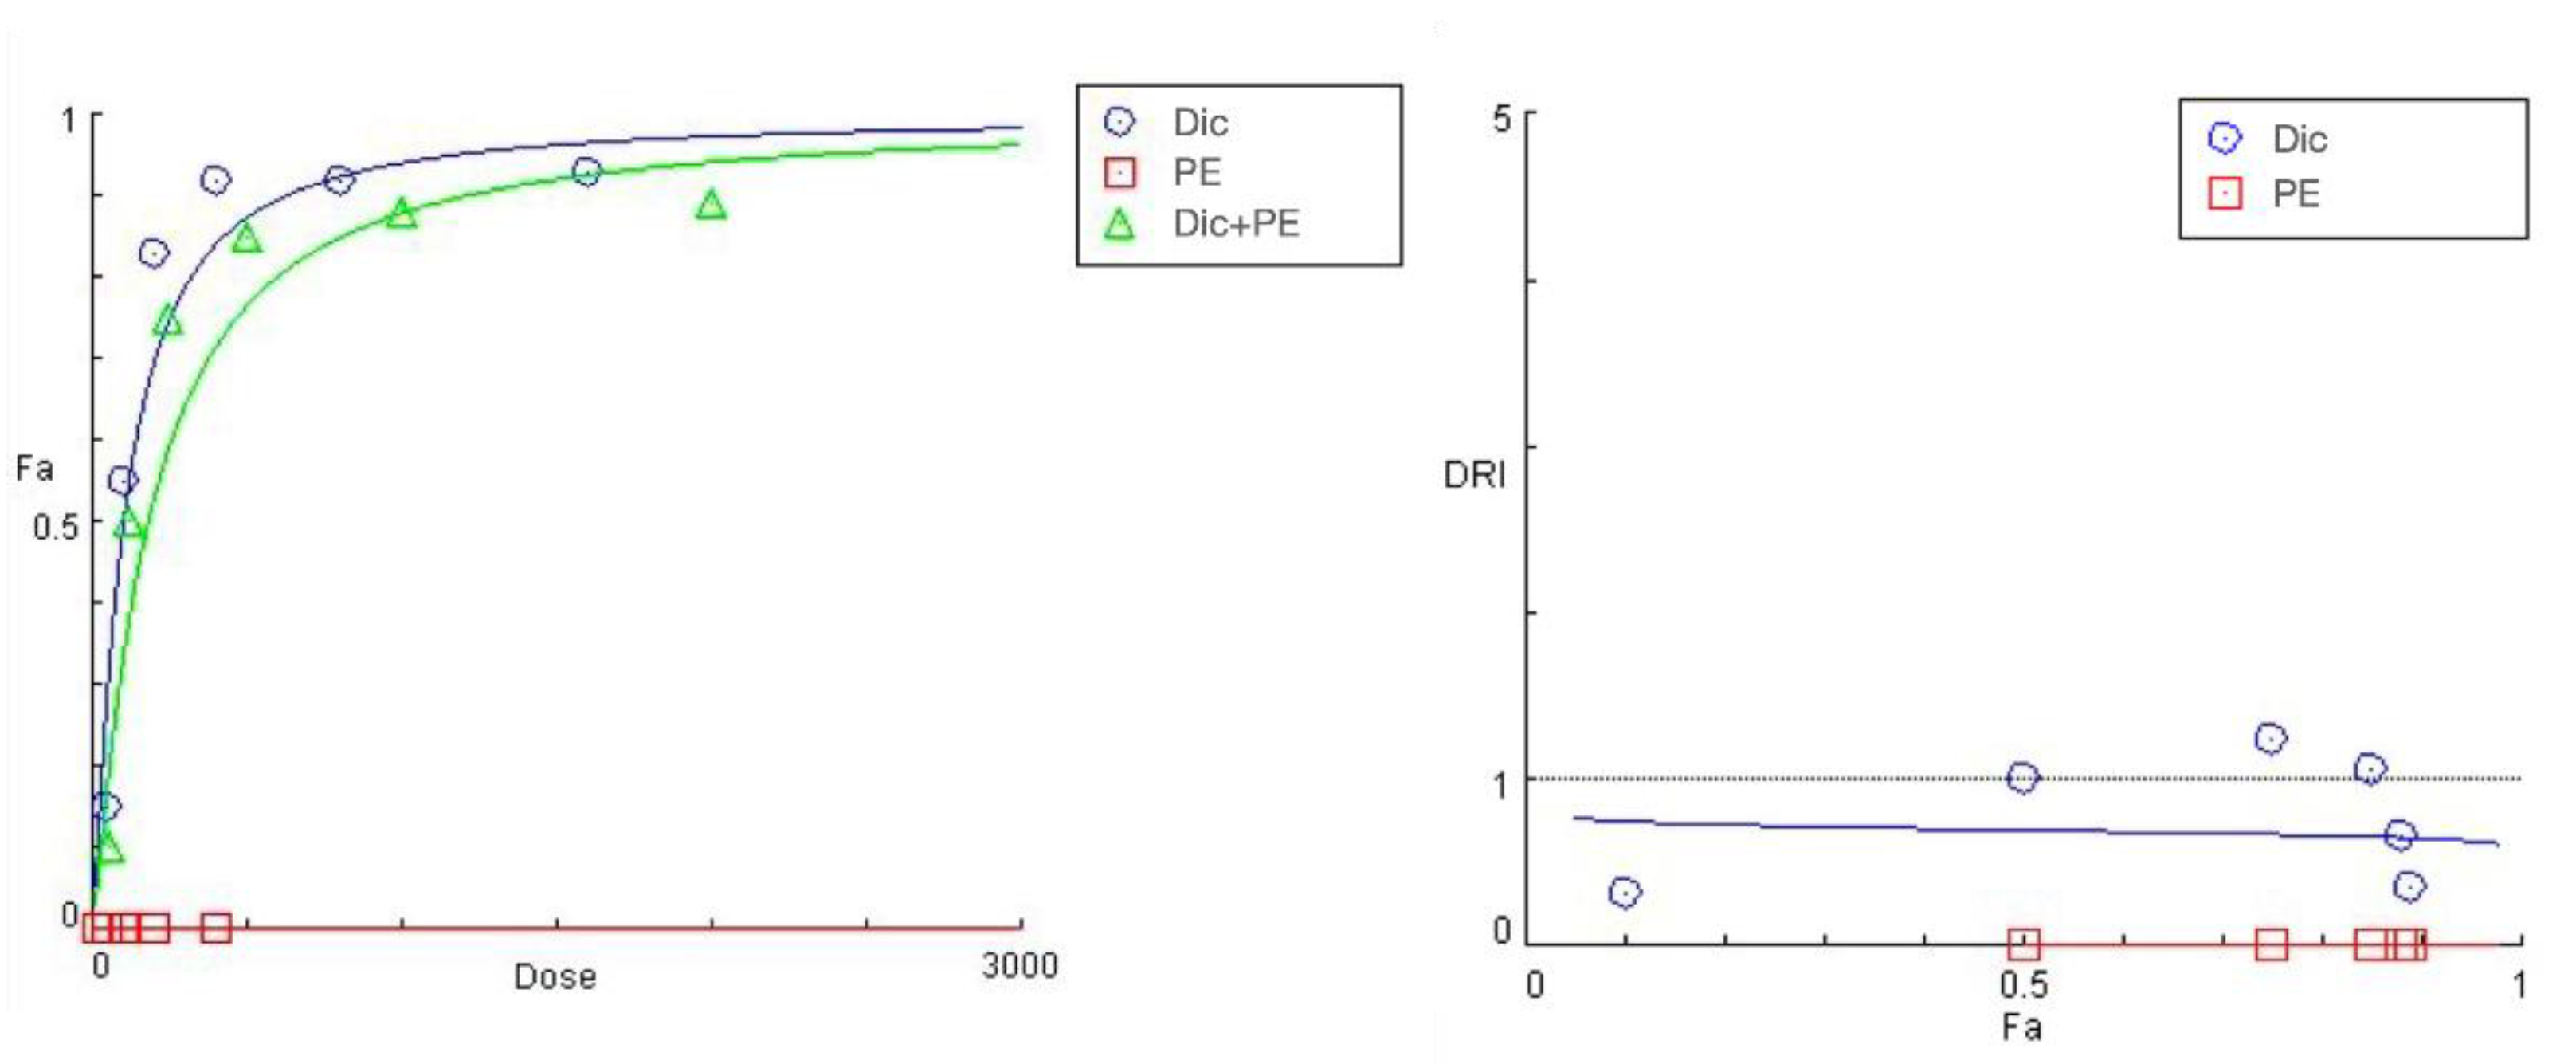
The summarized data of the studied PE + diclofenac combination are presented in Figure 4 and Table 4. A 24 h pretreatment of HEP-G2 cells with the Prenanthes extract caused a right shift in diclofenac’s “dose-response” curve towards higher concentrations needed to produce the same effect on cell growth inhibition (Fa). According to the DRI-Fa plot, three out of the six DRI values fall in the 0–1 interval (implying antagonism and shown in bold in Table 3), covering both ends of the concentration range. The strongest modulating effect on diclofenac’s cytotoxicity was namely observed at the highest (1600:400) and lowest (50:12.5) exposure concentrations, where the DRI indices (0.35442 and 0.32125, respectively) indicated an approximately three-fold increase in the equi-inhibitory concentrations of the NSAID drug. The corresponding combination indices of CI at each experimental data set are infinitely high.
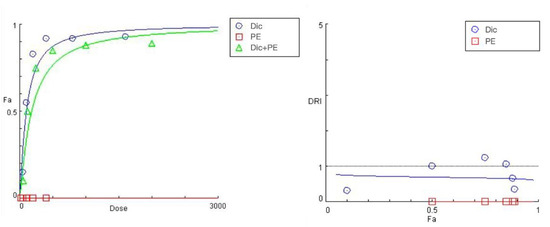
Figure 4.
“Dose-response” curves (left) and DRI Fa plot (right) for the experimental data points of the studied combination PE + diclofenac.
Table 4.
DRI and CI estimates for the experimental data points of the studied combination PE + diclofenac.
Effect of CA and 3,5-DiCQA pretreatment on Diclofenac’s toxicity.
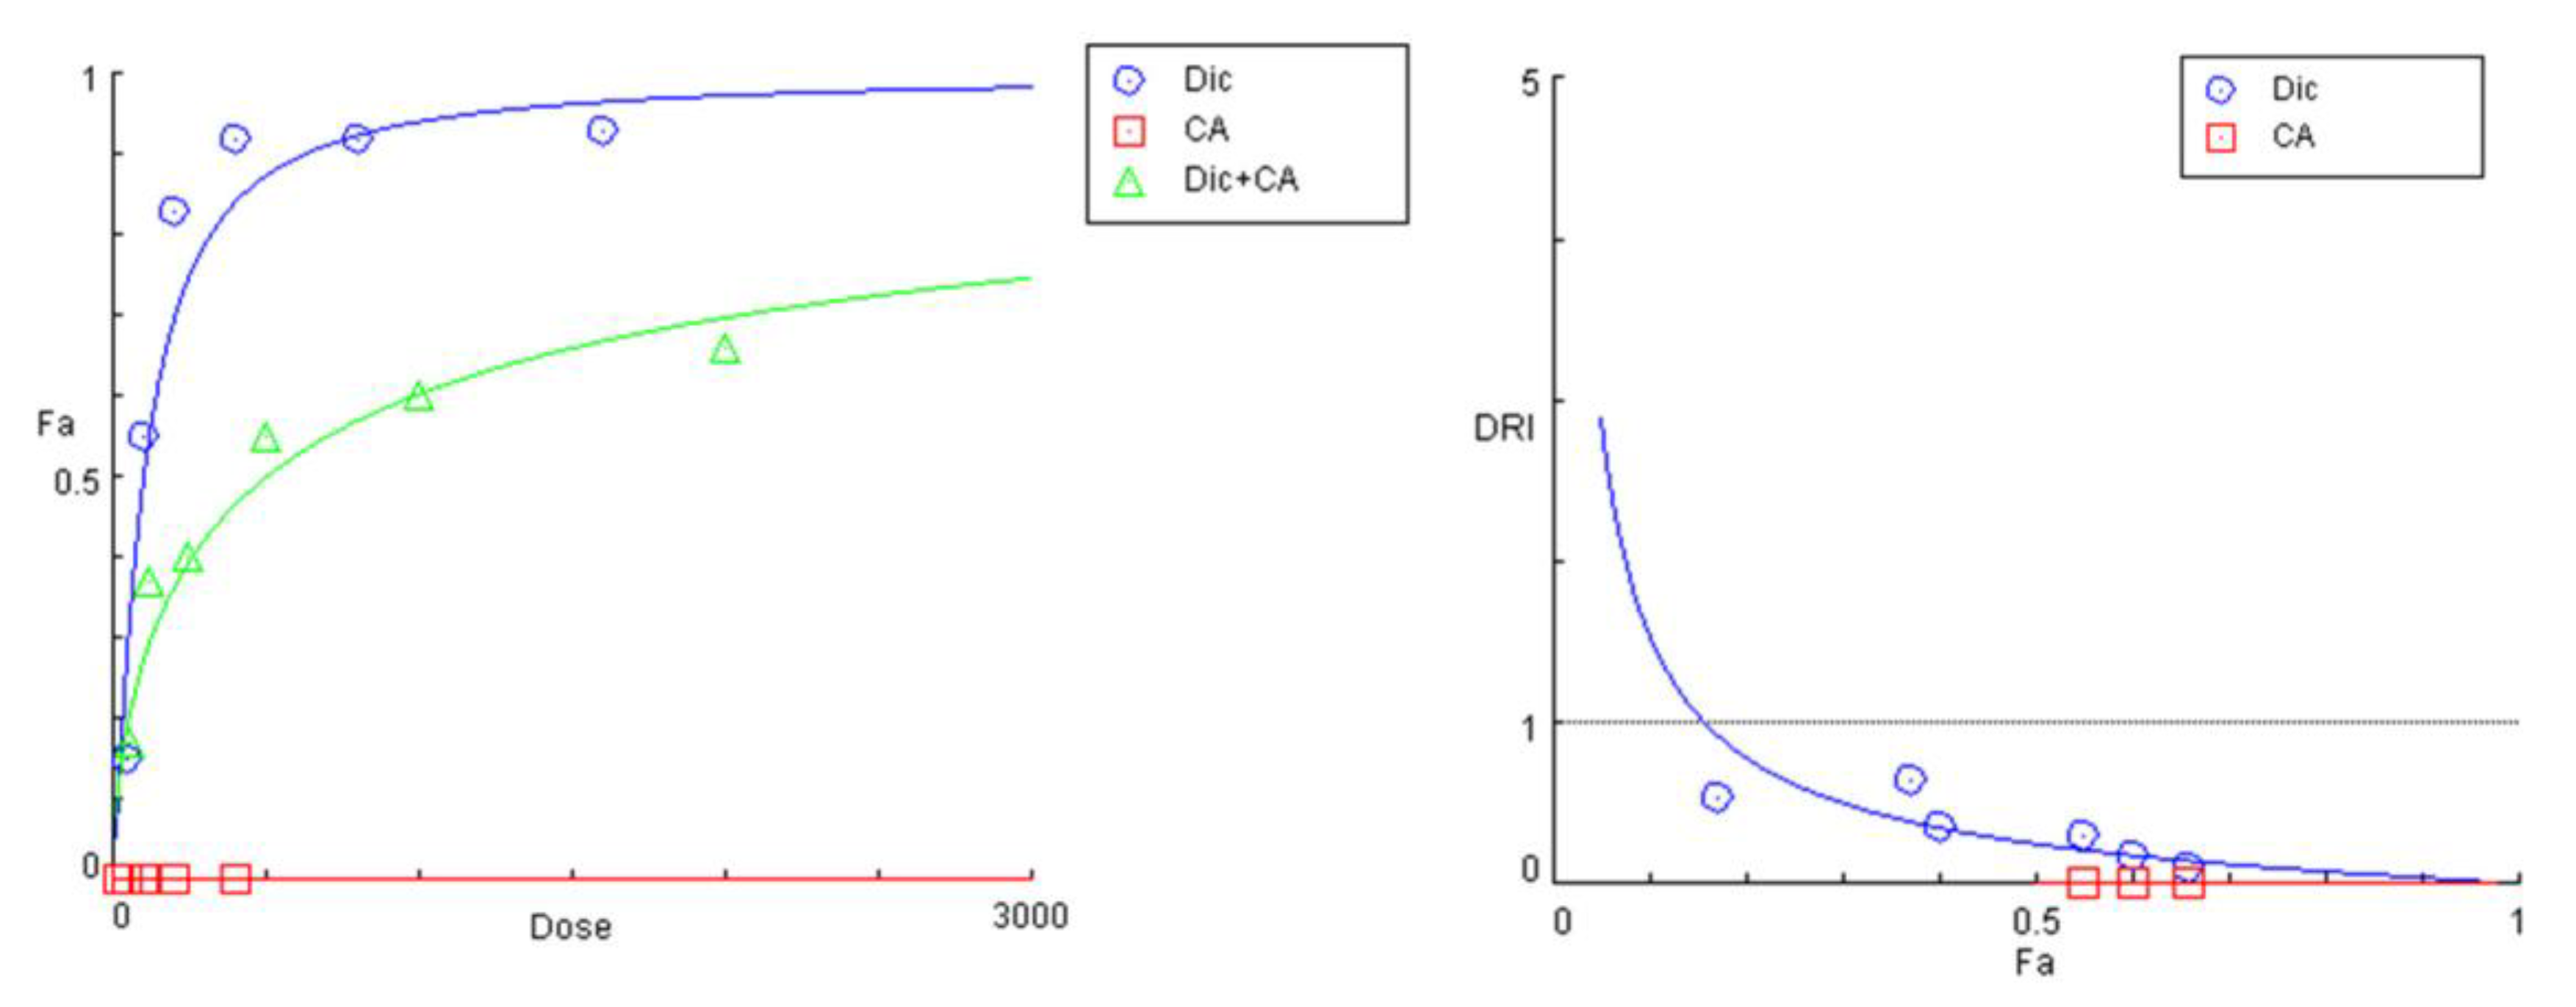
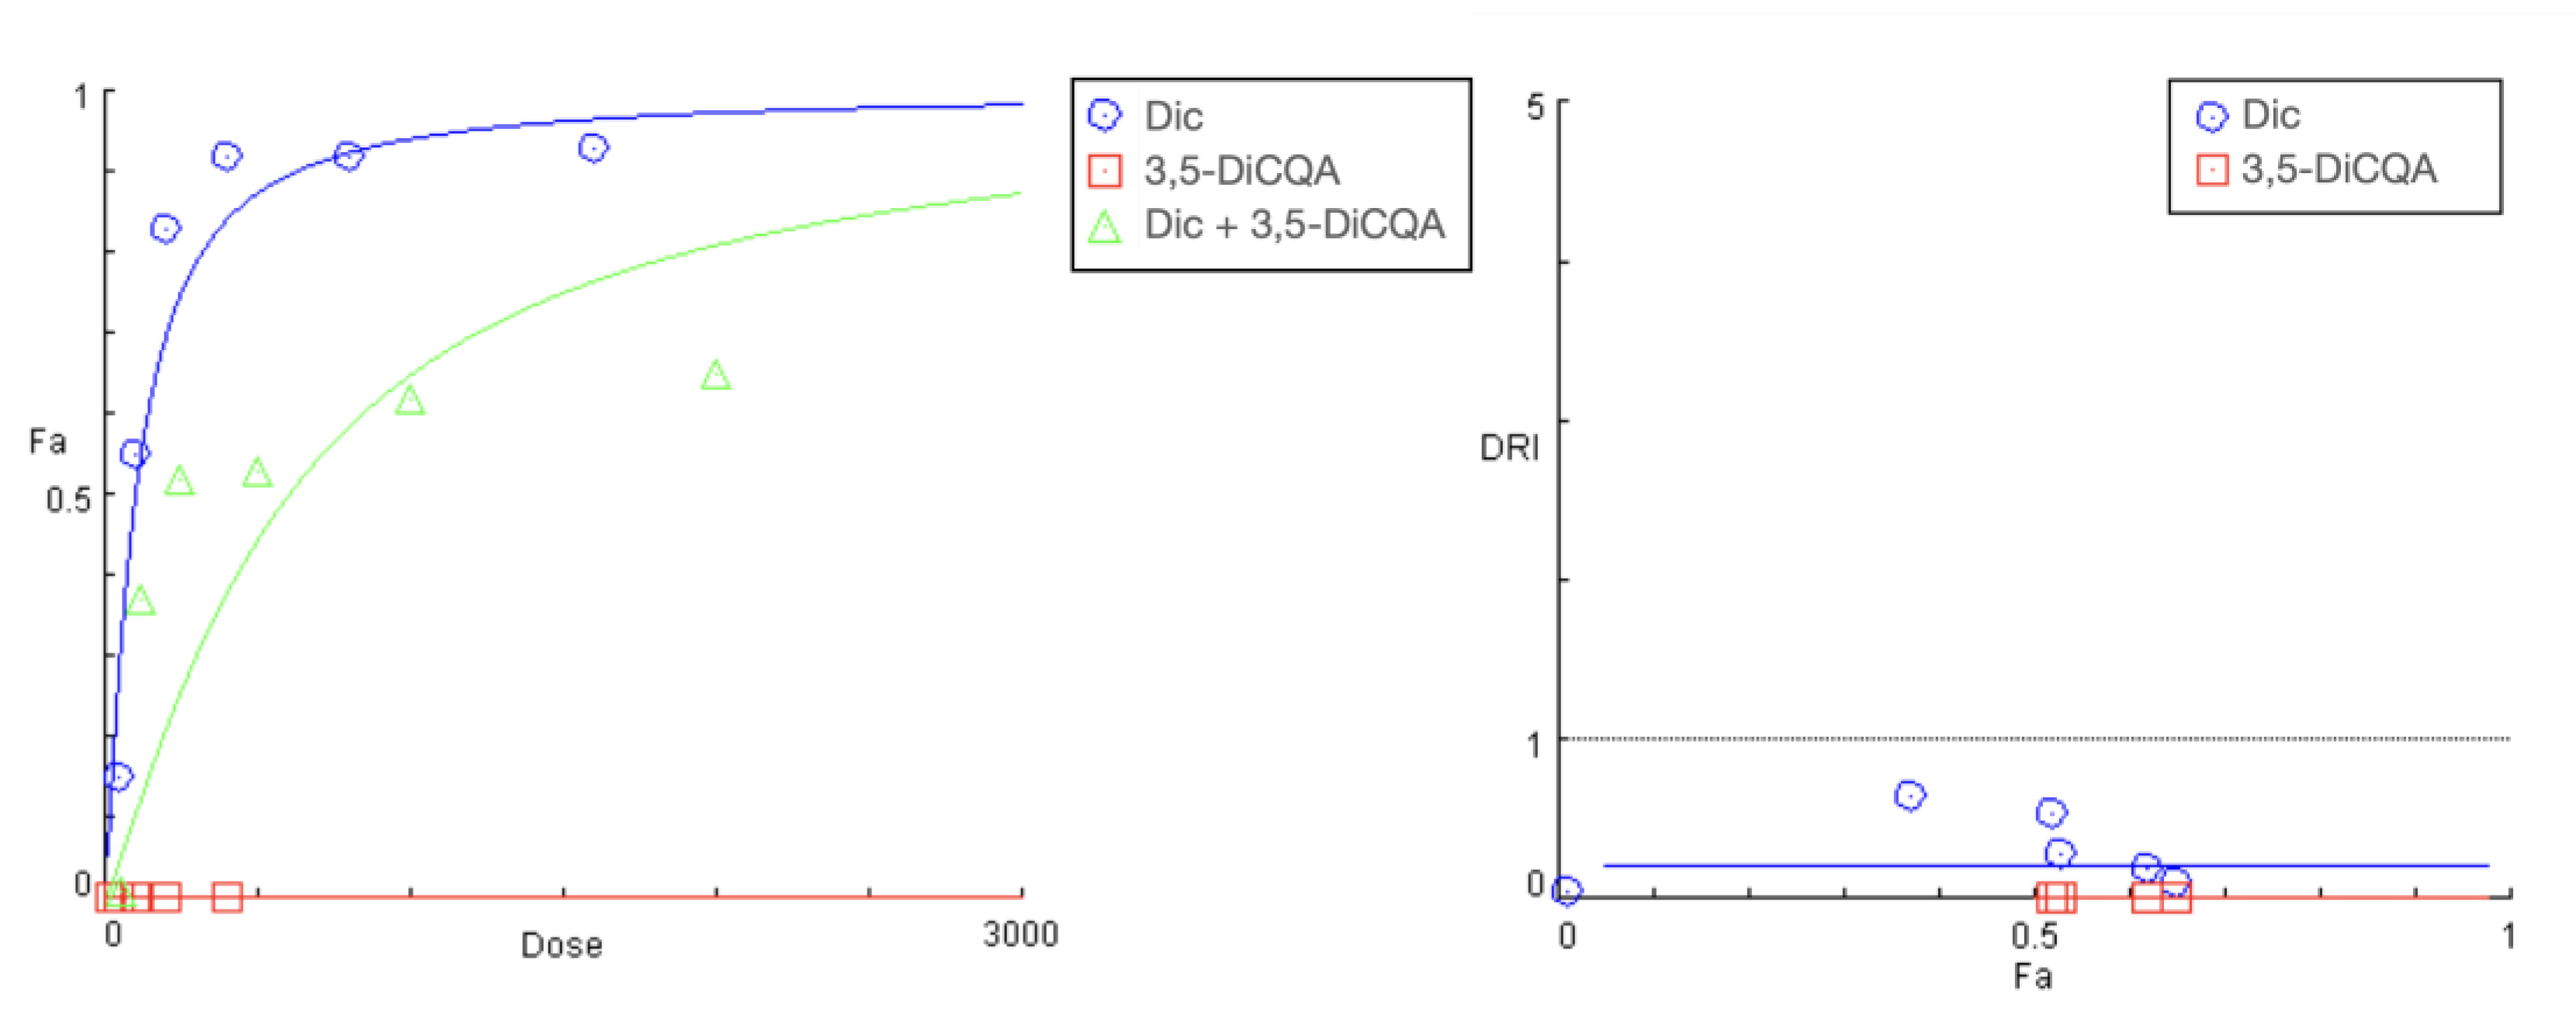
The preincubation of cell cultures with the two polyphenolic compounds CA and 3,5-DiCQA resulted in a similar outcome. However, there was a more pronounced rightward shift and a significant decrease in the slope of the “dose-response” curves of diclofenac in the tested combinations (Figure 5 and Figure 6). Both phytochemicals showed nearly matching profiles of hepatoprotection, which appears to be most pronounced under extreme hepatic cell injury (highest exposure doses to diclofenac) and gradually decreases with the lowering of the treatment concentrations (Table 5 and Table 6). The strongest antagonistic effect was established at the peak concentration pairs (1600:400 and 800:200 µg/mL), where estimated DRI indices point to, respectively, a nearly 10- and 5-fold reduction in the cytotoxic capacity of diclofenac. Similar to the PE combination study, the CI values at all actual data points were infinitely high.
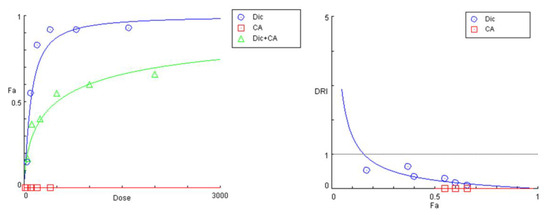
Figure 5.
“Dose-response” curves and DRI-Fa plot for the experimental data points of the studied combination CA + diclofenac.
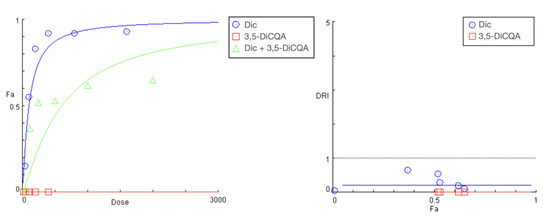
Figure 6.
“Dose-response” curves and DRI-Fa plot for the experimental data points of the studied combination 3,5-DiCQA + diclofenac.
Table 5.
DRI and CI estimates for the experimental data points of the studied combination CA + diclofenac.
Table 6.
DRI and CI estimates for the experimental data points of the studied combination 3,5-DiCQA + diclofenac.
2.3.3. Results from the Proteome Profiling
The oxidative stress and antioxidant status are important aspects of any hepatic injury, including DILI. Considering this, we deemed it relevant to track and compare changes in cellular stress responses to diclofenac-induced damage in HEP-G2 cells and their coping mechanisms when pretreated with either PE (80% methanolic extract of the aerial parts of Prenanthes purpurea) or one of its major constituents, the polyphenolic compound chlorogenic acid (CA). Changes in the expression levels of multiple target proteins related to oxidative stress were monitored using proteome profiling in a series of immunoassays (Figure 7).
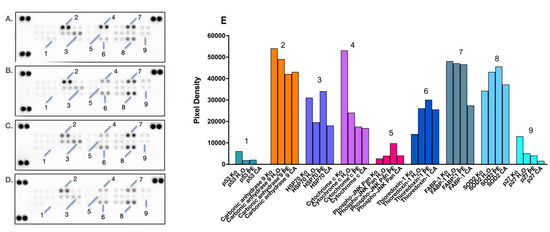
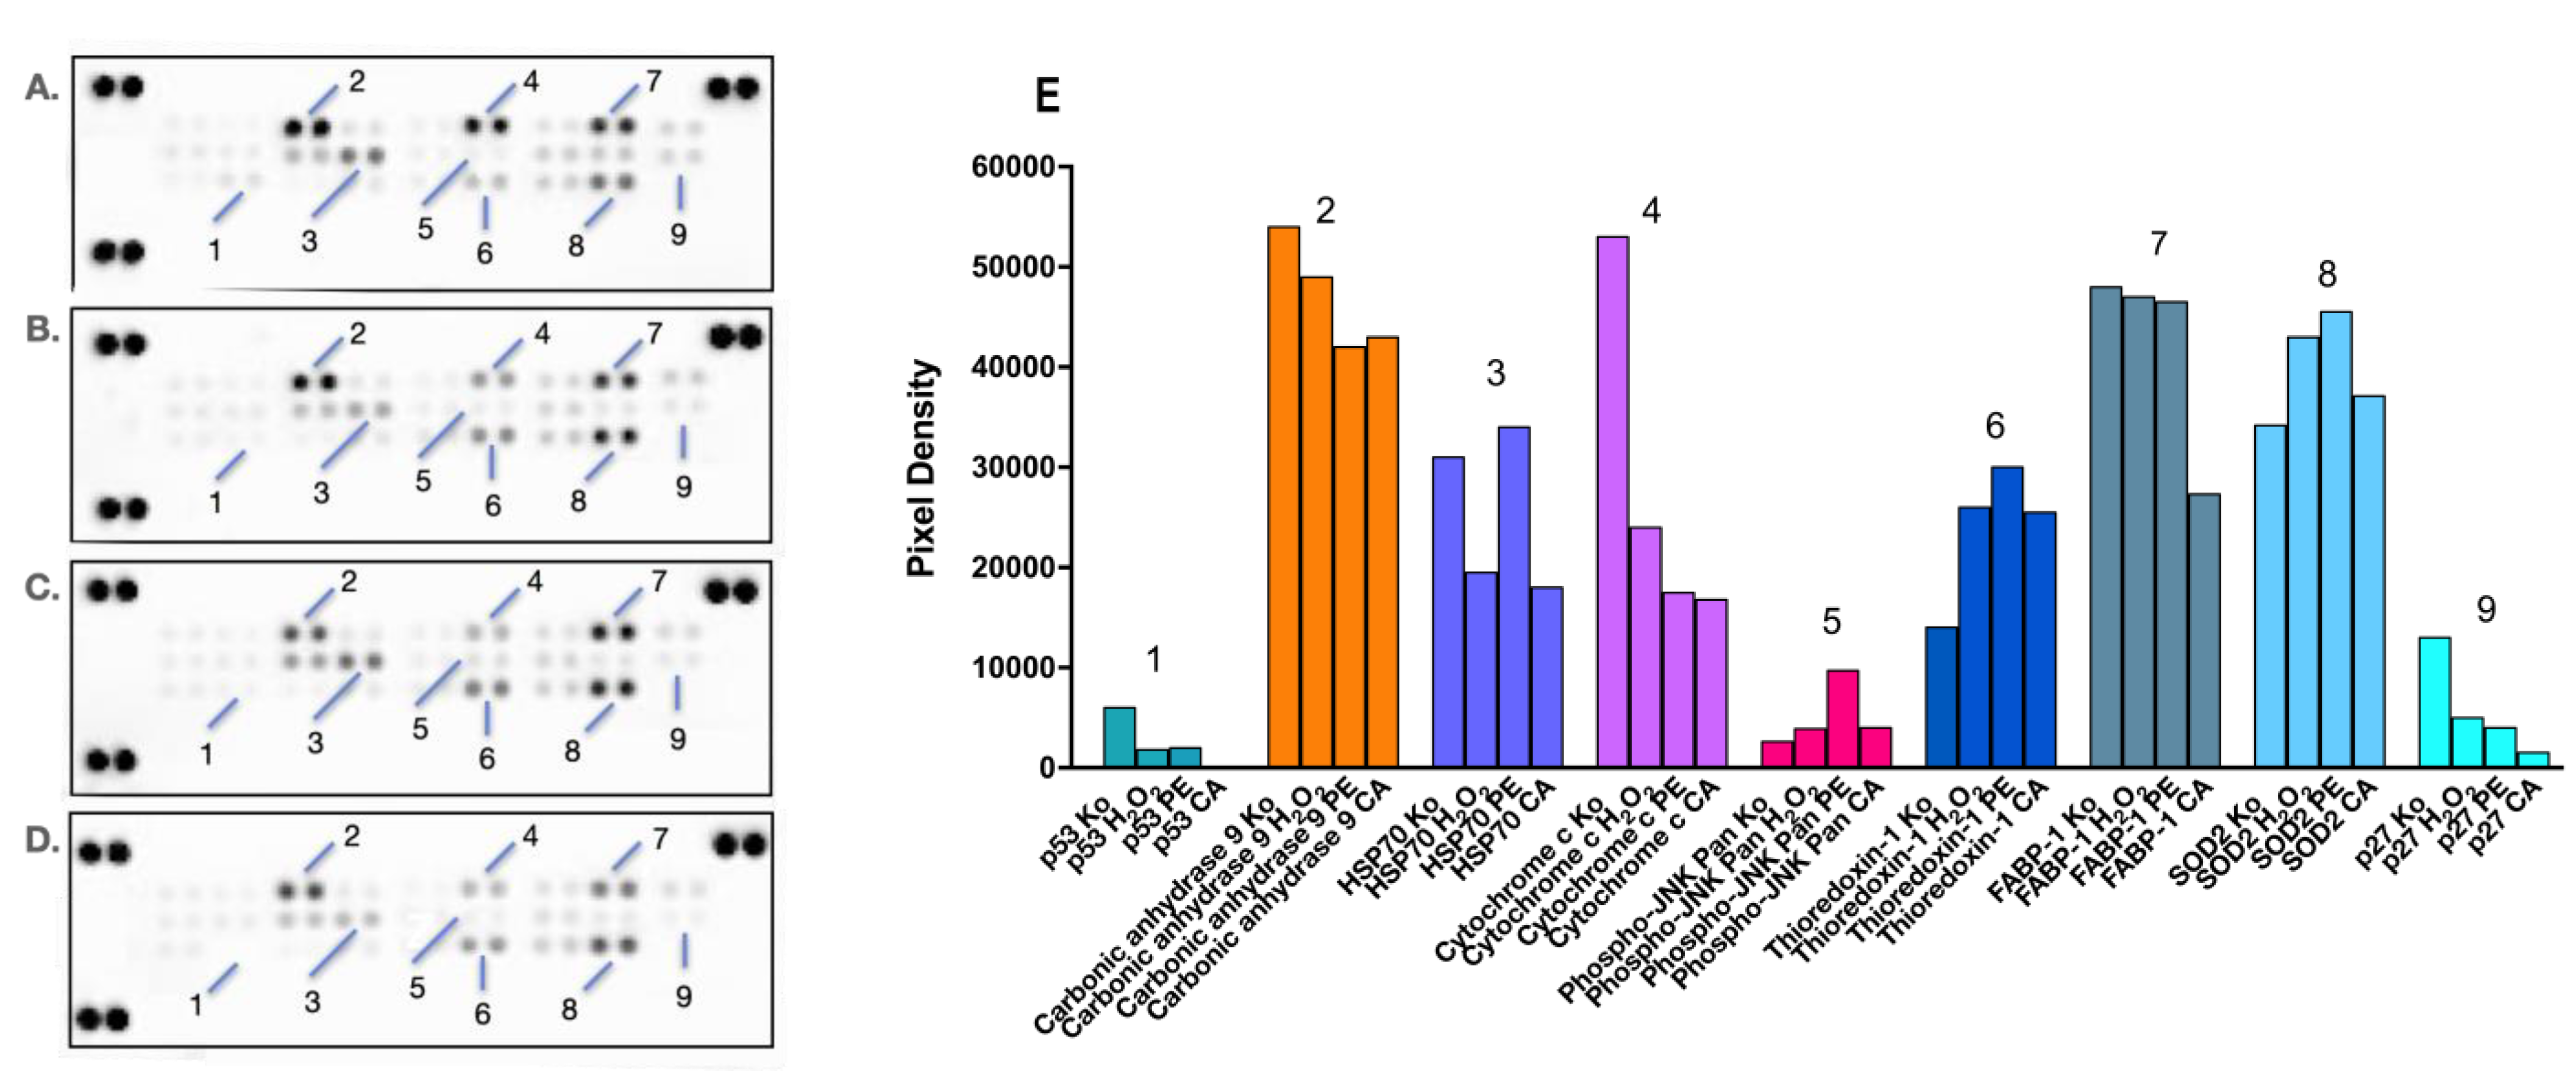
Figure 7.
Changes in the expression levels of oxidative cell stress-related proteins in HEP-G2 cells exposed for 24 h to diclofenac in an unprotected control sample (B), PA (С), and CA (D) pretreatment regimens, as compared to the untreated control sample (A). Combination treatments were conducted in the same 4:1 dose ratio (400 diclofenac:100 µg/mL phytoprotectant), with the phytoprotection preceding the noxious stimuli by 24 h. After a total 48h incubation, a human proteome profiler immunoassay was performed according to the manufacturer’s instructions. Further densitometric analysis of the array spots was conducted using ImageJ software 1.8.0, and the most prominent changes in the proteome were expressed graphically (E). Legend: 1—p53; 2—Carbonic anhydrase 9; 3—HSP70; 4—Cytochrome c; 5—Phospho-JNK Pan; 6—Thioredoxin-1; 7—FABP-1; 8—SOD2; 9—p27.
An important facet of cellular protection is the reversal of proapoptotic signaling of programmed cell death that occurred in both monotreated and pretreated samples, as evidenced by the decreased levels of the major tumor suppressors p53 (1) and p27 (9). The inhibition of these key cell cycle regulators is slightly more pronounced in the PE and CA pretreated group, where the 24 h CA preincubation resulted in the complete disappearance of their signaling spots. Furthermore, both the Prenanthes extract and CA prompted a nearly 3-fold reduction in the cytosolic levels of cytochrome C (4), which is a major recruiter and activator of procaspase-9 in the intrinsic mitochondrial pathway of apoptosis. Both pretreated cellular models also responded with a moderate downregulation of Carbonic anhydrase 9 (2), a major component in the HIF-mediated response and a cellular biomarker of hypoxia, which is almost exclusively expressed in solid tumors due to hypoxic conditions.
Changes in the expression levels of several factors with dual importance for both cell survival and redox homeostasis were also observed. For example, the preincubation of HEP-G2 cells with PE prior to diclofenac treatment produced a ca. 3-fold increase in the phosphorylated active form of all Janus kinases (Phospho-JNK Pan, (2)). JNK signaling has been recognized as central not only in cell survival and proliferation but also in promoting tolerance to oxidative stress and preventing ROS accumulation. Furthermore, the JAK/STAT pathway may promote the expression of another key survival factor, chaperone 70 (HSP70, (3)), which is also involved in cellular adaptation to oxidative stress. The observed expression profile of the latter protein was in good correlation with these findings, whereas its upregulation was favored only in the PE pretreated group. Significant reduction in the endogenous cytoprotectant liver-type fatty acid binding protein (FABP-1, (7)) was particularly seen in the CA pretreated sample, possibly due to its partial depletion in the course of antioxidative defense reactions, given its role in neutralizing free radicals.
Finally, and most importantly, favorable changes were also observed in the availability of two pivotal factors directly involved in cellular detoxification, namely thioredoxin-1 (6) and superoxide dismutase 2 (SOD2, (8)). Thioredoxin is a highly conserved and ubiquitously expressed disulphide reductase and a major component of the redox system, functioning as an active scavenger of free radicals. SOD2, a member of the iron/manganese superoxide dismutase family, also played a central role in mitigating cellular stress by converting toxic superoxides to hydrogen peroxide. A marked induction in the expression levels of these proteins was established in all treatment groups; however, the strongest signals of their spots were detected in PE pretreated hepatocytes.
Based on the conducted analysis of the proteomic imprints in both pretreated HEP-G2 groups, a general trend in their cellular responses can be derived, where CA is slightly more efficient in abrogating proapoptotic signaling, whereas the Prenanthes extract more directly affects cellular antioxidant machinery.
3. Materials and Methods
3.1. Plant Material
P. purpurea plant material (aerial parts) was collected at the Zlatnite Mostove locality, Vitosha Mt., Bulgaria at 1404 m a.s.l. (42.41° N 23.23° E) at full flowering stage, July 2022. The plant was identified by one of us (R.G) according to Stojanov et al. (1967) [23]. A voucher specimen was deposited at the Herbarium Academiae Scientiarum Bulgariae (SOM 177 803). The plant material was dried at room temperature.
3.2. Sample Extraction
Air-dried aerial parts (100 g) were extracted twice with 80% MeOH (1:20 w/v) by sonication (80 kHz, ultra-sound bath Biobase UC-20C) for 15 min at room temperature. The extracts were concentrated in vacuo and subsequently lyophilized (lyophilizеr Biobase BK-FD10P) to yield crude extracts of 8.125 g.
3.3. Chemicals
Acetonitrile (hypergrade for LC–MS), formic acid (for LC–MS) and methanol (an-alytical grade) were purchased from Merck (Merck, Bulgaria). The reference standards used for compound identification were obtained from Extrasynthese (Genay, France) for gallic, protocatechuic, p-coumaric, m-coumaric, o-coumaric, vanillic, and salicylic acid, as well as luteolin 7-O-rutinoside, luteolin 7-O-glucoside, isorhamnetin 3-O-glucoside, apigenin 7-O-glucoside, and luteolin. Neochlorogenic, chlorogenic, caffeic, 3,4-dicaffeoylquinic, 3,5-dicaffeylquinic and 1,5-dicaffeoylquinic acids were supplied from Phytolab (Vesten-bergsgreuth, Bavaria, Germany).
3.4. UHPLC-HRMS
The UHPLC-HRMS analyses were carried out on a Q Exactive Plus mass spectrometer (ThermoFisher Scientific, Inc., Waltham, MA, USA) equipped with a heated electrospray ionization (HESI-II) probe (ThermoScientific). The equipment was operated in negative and positive ion modes within the m/z range from 100 to 1000. The mass spectrometer parameters were as follows: spray voltage 3.5 kV (+) and 2.5 kV (−); sheath gas flow rate 38; auxiliary gas flow rate 12; spare gas flow rate 0; capillary temperature 320 °C; probe heater temperature 320 °C; S-lens RF level 50; scan mode: full MS (resolution 70,000), and MS/MS (17,500). Chromatographic separation was achieved on a reversed phase column Kromasil EternityXT C18 (1.8 µm, 2.1 × 100 mm) at 40 °C. UHPLC analyses were run with a mobile phase consisting of 0.1% formic acid in water (A) and 0.1% formic acid in acetonitrile (B). The run time was 33 min. The flow rate was 0.3 mL/min. The gradient elution program was used as follows: 0–1 min, 0–5% B; 1–20 min, 5–30% B; 20–25 min, 30–50% B; 25–30 min, 50–70% B; 30–33 min, 70–95%; 33–34 min, 95–5% B. Equilibration time was 4 min [22]. Data were processed by Xcalibur 4.2 (ThermoScientific, Waltham, MA, USA) instrument control/data handling software. MZmine 2.53 software was applied to the UHPLC–HRMS raw files of the P. purpurea extract for the semi-quantitative analysis. Results are expressed as the % peak area of the compound to the total peak areas of the corresponding group secondary metabolites and all metabolites.
3.5. The Determination of Total Polyphenols, Flavonoid Contents, and Antioxidant Activity
The evaluation of the total polyphenols and flavonoid contents of the extract was performed as previously described via colorimetric testing using Folin–Ciocalteu and AlCl3, respectively [51]. To evaluate the antioxidant potential of the extract, a set of six complementary in vitro spectrophotometric tests were performed. They included free radical scavenging activity assays DPPH and ABTS, FRAP and CUPRAC tests, which evaluated the extract’s reduction capabilities, as well as metal chelating ability (MCA) and phosphomolybdenum (PBD) assays. All methods, except for MCA, were evaluated using the Trolox standard. The comparison for MCA was made in terms of equivalent EDTA equivalent per gram of extract [51].
3.6. In Vitro Cytotoxicity Assays
3.6.1. Cell Lines and Culture Conditions
The hepatoprotective activity of the Prenanthes extract and the phytocompounds CA and DiCQA was assessed against diclofenac-induced cell stress in the human hepatocellular carcinoma cell line (HEP-G2), purchased from the German Collection of Microorganisms and Cell Cultures (DSMZ GmbH, Braunschweig, Germany). Cell cultures were cultivated in a growth medium RPMI 1640 supplemented with 10% fetal bovine serum (FBS) and 5% L-glutamine and incubated under standard conditions of 37 °C and 5% humidified CO2 atmospheres.
3.6.2. MTT Cell Viability Assay
The cell viability of HEP-G2 cells following 24 h exposure to the hepatotoxic xenobiotic diclofenac was evaluated in several treatment groups subjected to a prior 24 h pretreatment with the phytoprotective substances and estimated both against untreated and unprotected control samples. The cytotoxicity was estimated with respect to diclofenac (fold-changes in the qui-effective half-inhibitory IC50 concentrations among treatment groups) using a validated methodology for assessing cell viability known as the Mosmann MTT assay. Exponential-phased cells were harvested and seeded (100 μL/well) in 96-well plates at the appropriate density (1.5 × 10⁵). On the following day, a pretreatment for 24 h was conducted with the Prenanthes extract, Chlorogenic acid, and 3,5-Dicaffeoylquinic acid in the concentration range 400–12.5 µg/mL. Both protected and unprotected treatment groups were exposed to six-fold serial dilutions of the hepatotoxin diclofenac (1600–50 µg/mL) and incubated for further 24 h. Filter sterilized MTT substrate solution (5 mg/mL in PBS) was added to each well of the culture plate. A further 2–4 h incubation allowed for the formation of purple insoluble formazan crystals. The latter were dissolved in an isopropyl alcohol solution containing 5% formic acid prior to absorbance measurement at 550 nm. The collected absorbance values were blanked against an MTT-and isopropanol solution and normalized to the mean value of untreated control (100% cell viability).
3.6.3. Chou Talalay Method
The establishment and quantitative evaluation of any hepatoprotective effects by the natural products against diclofenac-induced liver cell damage were conducted using the Chou-Talalay method and its respective Compusyn® software. The “dose-response” relationships were derived in advance via the standard MTT assay, according to the protocol described in the previous section. The antagonistic activity of the Prenanthes extract and the tested phytocompounds against the hepatotoxic agent was measured in a fixed 1:4 ratio combination, whereby preservative treatments preceded the noxious stimuli by 24 h. Promoting cellular tolerance and its degree was evaluated at each experimental data point (actual treatment concentrations), as well as at each dataset alongside the simulated “dose-response” curves. Тhe nature of the studied drug interactions was determined based on automated analysis in the Compusyn® software, which generated combination (CI) and drug-reduction (DRI) indices. The CI provided a quantitative determination of a synergistic (CI < 1), additive (CI = 1), and antagonistic (CI > 1) drug behavior in fixed- or varying-ratio combinations. Similarly, a DRI (dose reduction index)-Fa plot indicated the fold-change in the equi-effective concentrations of a single drug when used in combination (DRI > 1 for synergistic interactions and 0 > DRI < 1 for antagonistic behavior). Corresponding isobolograms were also constructed and could be used as an accessory tool in evaluating drug performance.
3.7. Proteomic Analysis
A series of immunoassay experiments were performed to monitor proteomic changes in the expression profile of diclofenac-exposed hepatic cells subjected or not subjected to a phytoprotective pretreatment with the Prenanthes extract and one of its major constituents, chlorogenic acid. Changes in oxidative stress-related proteins in response to diclofenac treatment (133.3 µg/mL) were tracked and analyzed in a comparative manner to untreated control and pretreated samples (33.3 µg/mL) in membrane-based sandwich immunoassays conducted according to the manufacturer’s instructions (Proteome Profiler Human Cell Stress Array Kit, R&D Systems). The treatment doses in the fixed ratio design were selected according to the cytotoxicity data obtained from the MTT test (mean IC50 value of diclofenac when used alone and in combination). The proteins were visualized using a digital imaging system (Azure Biosystems C600) and densitometric analysis of the array spots was conducted using ImageJ® software. The most prominent changes in spot signals were expressed graphically, relative to untreated control, and interpreted in a comparative manner to pretreated samples.
4. Conclusions
As a part of subtribe Hypochaeridinae, tribe Cichorieae, this is the first extensive study on the secondary metabolites of the P. purpurea species, further combined with a thorough evaluation of its biological activity against two caffeoylquinic acids that are relevant to its content, CA and 3,5-DiQCA, and anticipated to possess antioxidant properties. For the first time, more than 100 secondary metabolites were reported for P. purpurea, with polyphenolic derivatives dominating the phytochemical profile (i.e., quinic acid, chlorogenic, 3,5-dicaffeoylquinic, 5-feruloylhydroxyquinic acid, caffeoyltartaric, cichoric acids, eryodictiol-O-hexuronide, and luteolin O-hexuronide). In line with the identified compounds and the received data for the total content of polyphenols and flavonoids, the results indicate significant correlation between the presence of dihydroxycinnamic and caffeic acid derivatives (caffeoylquinic and caffeoyl tartaric acid) and the DPPH-scavenging and antioxidant capacity of the P. purpurea leaf extract. According to the conducted cytotoxicity studies, a 24 h incubation of hepatocyte cultures with the PE prior to diclofenac exposure exerted a positive modulating effect on the NSAID’s toxicity in a predominantly dose-dependent manner. In the highest treatment dose, the estimated DRI index for diclofenac points to a ca. three-fold increase in its equi-inhibitory concentration, implying the occurrence of moderate hepatoprotection. The protective effect of the pure polyphenolic compounds CA and 3,5-DiQCA in the combination studies was fairly more pronounced with an up to 10-fold reduction in diclofenac’s toxicity—a reasonable trend given their higher molar content in the treatment doses compared to the plant extract. According to the conducted immunoassays, cell stress response was also favorably altered in our in vitro DILI model, where CA was slightly more efficient in abrogating proapoptotic signaling, whereas the Prenanthes extract mainly adjusted the cellular antioxidant defense system.
Supplementary Materials
The supporting information can be downloaded at: https://www.mdpi.com/article/10.3390/ijms241814148/s1.
Author Contributions
Conceptualization, R.M., R.G., R.S. and G.M.; methodology, R.M., R.G., V.B., A.S. and G.Z.; software, R.M. and D.Z.-D.; validation, D.Z.-D. and R.S.; formal analysis, R.G. and D.Z.-D.; investigation, R.M., A.S. and G.Z.; resources, V.B., R.G. and D.Z.-D.; data curation, R.M. and R.G.; writing—original draft preparation, R.M., R.G. and V.B.; writing—review and editing, R.M. and D.Z.-D.; visualization, R.M., R.G. and D.Z.-D.; supervision, G.M.; project administration, G.M.; funding acquisition, G.M. All authors have read and agreed to the published version of the manuscript.
Funding
This research was funded by the European Union’s NextGenerationEU economic recovery package via the National Recovery and Resilience Plan of the Republic of Bulgaria, project No. BG-RRP-2.004-0004-C01.
Institutional Review Board Statement
Not applicable
Data Availability Statement
The data presented in this study are available in the article and the Supplementary Materials.
Conflicts of Interest
The authors declare no conflict of interest.
References
- Chang, C.Y.; Schiano, T.D. Review article: Drug hepatotoxicity: Aliment. Pharmacol. Ther. 2007, 25, 1135–1151. [Google Scholar]
- Björnsson, E. Hepatotoxicity by Drugs: The Most Common Implicated Agents. Int. J. Mol. Sci. 2016, 17, 224. [Google Scholar] [CrossRef] [PubMed]
- Aithal, G.P. Diclofenac-induced liver injury: A paradigm of idiosyncratic drug toxicity. Expert Opin. Drug Saf. 2004, 3, 519–523. [Google Scholar] [CrossRef] [PubMed]
- Meunier, L.; Larrey, D. Recent Advances in Hepatotoxicity of Non Steroidal Anti-Inflammatory Drugs. Ann. Hepatol. 2018, 17, 187–191. [Google Scholar] [CrossRef] [PubMed]
- Bessone, F. Non-steroidal anti-inflammatory drugs: What is the actual risk of liver damage? World J. Gastroenterol. 2010, 16, 5651. [Google Scholar] [CrossRef]
- Daly, A.K. Drug-Induced Liver Disease. In Comprehensive Medicinal Chemistry III; Elsevier: Amsterdam, The Netherlands, 2017; pp. 204–216. [Google Scholar]
- O’Connor, N.; Dargan, P.I.; Jones, A.L. Hepatocellular Damage from Non-Steroidal Anti-Inflammatory Drugs. QJM Int. J. Med. 2003, 96, 787–791. [Google Scholar] [CrossRef]
- Tateishi, Y.; Ohe, T.; Ogawa, M.; Takahashi, K.; Nakamura, S.; Mashino, T. Development of Novel Diclofenac Analogs Designed to Avoid Metabolic Activation and Hepatocyte Toxicity. ACS Omega 2020, 5, 32608–32616. [Google Scholar] [CrossRef]
- Hacker, M. Adverse Drug Reactions. In Pharmacology; Elsevier: Amsterdam, The Netherlands, 2009; pp. 327–352. [Google Scholar]
- Ramesh, M.; Bharatam, P.V. Formation of a Toxic Quinoneimine Metabolite from Diclofenac: A Quantum Chemical Study. Drug Metab. Lett. 2019, 13, 64–76. [Google Scholar] [CrossRef]
- Jung, S.-H.; Lee, W.; Park, S.H.; Lee, K.Y.; Choi, Y.J.; Choi, S.; Kang, D.; Kim, S.; Chang, T.S.; Hong, S.S.; et al. Diclofenac impairs autophagic flux via oxidative stress and lysosomal dysfunction: Implications for hepatotoxicity. Redox Biol. 2020, 37, 101751. [Google Scholar] [CrossRef]
- Delungahawatta, T.; Pokharel, A.; Paz, R.; Haas, C.J. Topical Diclofenac-Induced Hepatotoxicity. J. Community Hosp. Intern. Med. Perspect. 2023, 13, 21. [Google Scholar] [CrossRef]
- Selvaraj, S.; Oh, J.-H.; Spanel, R.; Länger, F.; Han, H.-Y.; Lee, E.-H.; Yoon, S.; Borlak, J. The pathogenesis of diclofenac induced immunoallergic hepatitis in a canine model of liver injury. Oncotarget 2017, 8, 107763–107824. [Google Scholar] [CrossRef] [PubMed]
- Pandey, B.; Baral, R.; Kaundinnyayana, A.; Panta, S. Promising hepatoprotective agents from the natural sources: A study of scientific evidence. Egypt. Liver J. 2023, 13, 14. [Google Scholar] [CrossRef]
- Meunier, L.; Larrey, D. Drug-Induced Liver Injury: Biomarkers, Requirements, Candidates, and Validation. Front. Pharmacol. 2019, 10, 1482. [Google Scholar] [CrossRef] [PubMed]
- Khan, M.A.; Ahmad, W.; Ahmad, M.; Nisar, M. Hepatoprotective effect of the solvent extracts of Viola canescens Wall. ex. Roxb. against CCl4 induced toxicity through antioxidant and membrane stabilizing activity. BMC Complement. Altern. Med. 2017, 17, 10. [Google Scholar]
- Machado, I.F.; Miranda, R.G.; Dorta, D.J.; Rolo, A.P.; Palmeira, C.M. Targeting Oxidative Stress with Polyphenols to Fight Liver Diseases. Antioxidants 2023, 12, 1212. [Google Scholar] [CrossRef]
- Cheng, K.; Niu, J.; Zhang, J.; Qiao, Y.; Dong, G.; Guo, R.; Zheng, X.; Song, Z.; Huang, J.; Wang, J.; et al. Hepatoprotective effects of chlorogenic acid on mice exposed to aflatoxin B1: Modulation of oxidative stress and inflammation. Toxicon 2023, 231, 107–177. [Google Scholar] [CrossRef]
- Zheleva-Dimitrova, D.; Simeonova, R.; Kondeva-Burdina, M.; Savov, Y.; Balabanova, V.; Zengin, G.; Petrova, A.; Gevrenova, R. Antioxidant and Hepatoprotective Potential of Echinops ritro L. Extracts on Induced Oxidative Stress In Vitro/In Vivo. Int. J. Mol. Sci. 2023, 24, 9999. [Google Scholar] [CrossRef]
- Zidorn, C.; Gottschlich, G.; Stuppner, H. Chemosystematic investigations on phenolics from flowerheads of Central European taxa of Hieracium sensu lato (Asteraceae). Plant Syst. Evol. 2002, 231, 39–58. [Google Scholar] [CrossRef]
- Kirpicznikov, M.E. Compositae. In Flora of the USSR; Bobrov, E.G., Tzvelev, N.N., Eds.; Publishing House of the USSR Academy of Sciences: Moscow, Russia, 1964. [Google Scholar]
- POWO. Plants of the World Online. Facilitated by the Royal Botanic Gardens, Kew. Published on the Internet. 2023. Available online: http://www.plantsoftheworldonline.org/ (accessed on 16 August 2023).
- Stojanov, N.; Stefanov, B.; Kitanov, B. Prenanthes L. In Flora Republicae Bulgaricae, Part II; Nauka i Izkustvo: Sofia, Bulgaria, 1967; p. 1179. [Google Scholar]
- Enke, N.; Gemeinholzer, B.; Zidorn, C. Molecular and phytochemical systematics of the subtribe Hypochaeridinae (Asteraceae, Cichorieae). Org. Divers. Evol. 2012, 12, 1–16. [Google Scholar] [CrossRef]
- Zidorn, C.; Pschorr, S.; Ellmerer, E.P.; Stuppner, H. Occurrence of equisetumpyrone and other phenolics in Leontodon crispus. Biochem. Syst. Ecol. 2006, 34, 185–187. [Google Scholar] [CrossRef]
- Zidorn, C. Sesquiterpene lactones and their precursors as chemosystematic markers in the tribe Cichorieae of the Asteraceae. Phytochemistry 2008, 69, 2270–2296. [Google Scholar] [CrossRef] [PubMed]
- Sareedenchai, V.; Zidorn, C. Flavonoids as chemosystematic markers in the tribe Cichorieae of the Asteraceae. Biochem. Syst. Ecol. 2010, 38, 935–957. [Google Scholar] [CrossRef]
- Kilian, N.; Gemeinholzer, B.; Lack, H.W. Cichorieae. Chapter 24. In Systematics, Evolution and Biogeography of Compositae; Funk, V.A., Susanna, A., Stuessy, T., Bayer, R., Eds.; International Association for Plant Taxonomy (IAPT): Vienna, Austria, 2009; pp. 343–383. [Google Scholar]
- Posch, M.; Jöhrer, K.; Cicek, S.; Greil, R.; Ellmerer, E.; Zidorn, C. A new trisaccharide derivative from Prenanthes purpurea. J. Serbian Chem. Soc. 2011, 76, 841–845. [Google Scholar] [CrossRef]
- Myiase, T.; Yamada, M.; Fukushima, S. Studies on sesquiterpene glycosides from Prenanthes acerifolia. BENTH Chem. Pharm. Bull. 1987, 35, 1969–1974. [Google Scholar] [CrossRef]
- Ilayaraja, S.; Prabakaran, K.; Manivannan, R. Evaluation of Anti-Bacterial, Analgesic and Anti-Inflammatory activities of Oncocalyxone A isolated from Prenanthes sarmentosus. J. Appl. Pharm. Sci. 2014, 4, 88–91. [Google Scholar] [CrossRef]
- Chou, T.-C. Theoretical Basis, Experimental Design, and Computerized Simulation of Synergism and Antagonism in Drug Combination Studies. Pharmacol. Rev. 2006, 58, 621–681. [Google Scholar] [CrossRef]
- Ak, G.; Gevrenova, R.; Sinan, K.I.; Zengin, G.; Zheleva, D.; Mahomoodally, M.F.; Senkardes, I.; Brunetti, L.; Leone, S.; Di Simone, S.C.; et al. . Tanacetum vulgare L. (Tansy) as an effective bioresource with promising pharmacological effects from natural arsenal. Food Chem. Toxicol. 2021, 153, 112268. [Google Scholar] [CrossRef]
- Gevrenova, R.; Zheleva-Dimitrova, D.; Balabanova, V.; Voynikov, Y.; Sinan, K.I.; Mahomoodally, M.F.; Zengin, G. Integrated phytochemistry, bio-functional potential and multivariate analysis of Tanacetum macrophyllum (Waldst. & Kit.) Sch.Bip. and Telekia speciosa (Schreb.) Baumg. (Asteraceae). Ind. Crop. Prod. 2020, 155, 112817. [Google Scholar]
- Gevrenova, R.; Zengin, G.; Sinan, K.I.; Yıldıztugay, E.; Zheleva-Dimitrova, D.; Picot-Allain, C.; Mahomoodally, M.F.; Imran, M.; Dall’Acqua, S. UHPLC-MS Characterization and Biological Insights of Different Solvent Extracts of Two Achillea Species (A. aleppica and A. santolinoides) from Turkey. Antioxidants 2021, 10, 1180. [Google Scholar] [CrossRef]
- Gevrenova, R.; Zengin, G.; Sinan, K.I.; Zheleva-Dimitrova, D.; Balabanova, V.; Kolmayer, M.; Voynikov, Y.; Joubert, O. An In-Depth Study of Metabolite Profile and Biological Potential of Tanacetum balsamita L. (Costmary). Plants 2022, 12, 22. [Google Scholar] [CrossRef]
- Sumner, L.W.; Amberg, A.; Barrett, D.; Beale, M.H.; Beger, R.; Daykin, C.A.; Fan, T.W.M.; Fiehn, O.; Goodacre, R.; Griffin, J.L.; et al. Proposed minimum reporting standards for chemical analysis: Chemical Analysis Working Group (CAWG) Metabolomics Standards Initiative (MSI). Metabolomics 2007, 3, 211–221. [Google Scholar] [CrossRef]
- Nobela, O.; Renslow, R.S.; Thomas, D.G.; Colby, S.M.; Sitha, S.; Njobeh, P.B.; du Preez, L.; Tugizimana, F.; Madala, N.E. Efficient discrimination of natural stereoisomers of chicoric acid, an HIV-1 integrase inhibitor. J. Photochem. Photobiol. B 2018, 189, 258–266. [Google Scholar] [CrossRef] [PubMed]
- Zheleva-Dimitrova, D.; Petrova, A.; Zengin, G.; Sinan, K.I.; Balabanova, V.; Joubert, O.; Zidorn, C.; Voynikov, Y.; Simeonova, R.; Gevrenova, R. Metabolite profiling and bioactivity of Cicerbita alpina (L.) Wallr. (Asteraceae, Cichorieae). Plants 2023, 12, 1009. [Google Scholar] [CrossRef] [PubMed]
- Cuyckens, F.; Claeys, M. Mass spectrometry in the structural analysis of flavonoids. J. Mass Spectrom. 2004, 39, 1–15. [Google Scholar] [CrossRef] [PubMed]
- Bohm, B.A.; Stuessy, T.F. Flavonoids of the Sunflower Family (Asteraceae); Springer: Vienna, Austia, 2001. [Google Scholar] [CrossRef]
- Fraisse, D.; Felgines, C.; Texier, O.; Lamaison, J.-L. Caffeoyl Derivatives: Major Antioxidant Compounds of Some Wild Herbs of the Asteraceae Family. Food Nutr. Sci. 2011, 02, 181–192. [Google Scholar] [CrossRef]
- Kakkar, S.; Bais, S. A Review on Protocatechuic Acid and Its Pharmacological Potential. ISRN Pharmacol. 2014, 2014, 952943. [Google Scholar] [CrossRef]
- Srinivasulu, C.; Ramgopal, M.; Ramanjaneyulu, G.; Anuradha, C.M.; Suresh Kumar, C. Syringic acid (SA)—A Review of Its Occurrence, Biosynthesis, Pharmacological and Industrial Importance. Biomed. Pharmacother. 2018, 108, 547–557. [Google Scholar] [CrossRef]
- Krzysztoforska, K.; Mirowska-Guzel, D.; Widy-Tyszkiewicz, E. Pharmacological effects of protocatechuic acid and its therapeutic potential in neurodegenerative diseases: Review on the basis of in vitro and in vivo studies in rodents and humans. Nutr. Neurosci. 2019, 22, 72–82. [Google Scholar] [CrossRef]
- Ingole, A.; Kadam, M.P.; Dalu, A.P.; Kute, S.M.; Mange, P.R.; Theng, V.D.; Lahane, O.R.; Nikas, A.P.; Kawal, Y.V.; Nagrik, S.U.; et al. A Review of the Pharmacological Characteristics of Vanillic Acid. J. Drug Deliv. Ther. 2021, 11, 200–204. [Google Scholar] [CrossRef]
- Guan, X.-Q. Research progress on pharmacological effects of p-coumaric acid. Chin. Tradit. Herb. Drugs 2018, 24, 4162–4170. [Google Scholar]
- Rojas-González, A.; Figueroa-Hernández, C.Y.; González-Rios, O.; Suárez-Quiroz, M.L.; González-Amaro, R.M.; Hernández-Estrada, Z.J.; Rayas-Duarte, P. Coffee Chlorogenic Acids Incorporation for Bioactivity Enhancement of Foods: A Review. Molecules 2022, 27, 3400. [Google Scholar] [CrossRef] [PubMed]
- Kwon, Y.K.; Choi, S.J.; Kim, C.R.; Kim, J.K.; Kim, Y.-J.; Choi, J.H.; Song, S.-W.; Kim, C.-J.; Park, G.G.; Park, C.-S.; et al. Antioxidant and cognitive-enhancing activities of Arctium lappa L. roots in Aβ1-42-induced mouse model. Appl. Biol. Chem. 2016, 59, 553–565. [Google Scholar] [CrossRef]
- Tian, C.; Liu, X.; Chang, Y.; Wang, R.; Lv, T.; Cui, C.; Liu, M. Investigation of the anti-inflammatory and antioxidant activities of luteolin, kaempferol, apigenin and quercetin. S. Afr. J. Bot. 2021, 137, 257–264. [Google Scholar] [CrossRef]
- Zengin, G.; Aktumsek, A. Investigation of Antioxidant Potentials of Solvent Extracts from Different Anatomical Parts of Asphodeline Anatolica E. Tuzlaci: An Endemic Plant to Turkey. Afr. J. Tradit. Complement. Altern. Med. 2014, 11, 481. [Google Scholar] [CrossRef] [PubMed]
Disclaimer/Publisher’s Note: The statements, opinions and data contained in all publications are solely those of the individual author(s) and contributor(s) and not of MDPI and/or the editor(s). MDPI and/or the editor(s) disclaim responsibility for any injury to people or property resulting from any ideas, methods, instructions or products referred to in the content. |
© 2023 by the authors. Licensee MDPI, Basel, Switzerland. This article is an open access article distributed under the terms and conditions of the Creative Commons Attribution (CC BY) license (https://creativecommons.org/licenses/by/4.0/).