Review

The Effect of Plant-Derived Low-Ratio Linoleic Acid/α-Linolenic Acid on Markers of Glucose Controls: A Systematic Review and Meta-Analysis

State Key Laboratory of Food Science and Technology, Collaborative Innovation Center of Food Safety and Quality Control in Jiangsu Province, School of Food Science and Technology, Jiangnan University, Wuxi 214122, China
*
Author to whom correspondence should be addressed.
Int. J. Mol. Sci. 2023, 24(18), 14383; https://doi.org/10.3390/ijms241814383
Submission received: 24 August 2023 / Revised: 15 September 2023 / Accepted: 18 September 2023 / Published: 21 September 2023
(This article belongs to the Special Issue Fatty Acids and Metabolic Syndrome)

Abstract

:
The objective of this meta-analysis was to examine the impact of a low-ratio linoleic acid/α-linolenic acid (LA/ALA) diet on the glycemic profile of adults. A comprehensive search was performed across four databases (Web of Science, Scopus, Embase, and PubMed) to evaluate the influence of the low-ratio LA/ALA. Relevant references were screened up until February 2023. Intervention effects were analyzed by calculating change values as weighted mean differences (WMD) and 95% confidence intervals (CI) using fixed-effects models. Additionally, subgroup analysis and meta-regression were employed to investigate potential sources of heterogeneity. Twenty-one randomized controlled trials (RCTs) were included, and the low-ratio LA/ALA diet had no significant effect on fasting blood sugar (FBS, WMD: 0.00 mmol/L, 95% CI: −0.06, 0.06, p = 0.989, I2 = 0.0%), insulin levels (WMD: 0.20 μIU/mL, 95% CI: −0.23, 0.63, p = 0.360, I2 = 3.2%), homeostatic model assessment insulin resistance (HOMA-IR, WMD: 0.09, 95% CI: −0.06, 0.23, p = 0.243, I2 = 0.0%), and hemoglobin A1c (HbA1c, WMD: −0.01%, 95% CI: −0.07, 0.06, p = 0.836, I2 = 0.0%). Based on subgroup analyses, it was observed that the impact of a low-ratio LA/ALA diet on elevated plasma insulin (WMD: 1.31 μIU/mL, 95% CI: 0.08, 2.54, p = 0.037, I2 = 32.0%) and HOMA-IR (WMD: 0.47, 95% CI: 0.10, 0.84, p = 0.012, I2 = 0.0%) levels exhibited greater prominence in North America compared to Asian and European countries. Publication bias was not detected for FBS, insulin, HOMA-IR, and HbA1c levels according to the Begg and Egger tests. Furthermore, the conducted sensitivity analyses indicated stability, as the effects of the low-ratio LA/ALA diet on various glycemic and related metrics remained unchanged even after removing individual studies. Overall, based on the available studies, it can be concluded that the low-ratio LA/ALA diet has limited impact on blood glucose-related biomarker levels.

1. Introduction

Diabetes is a prevalent chronic disease characterized by abnormalities in glucose metabolism, and its global incidence is on the rise. According to the International Diabetes Federation (IDF), the global prevalence of diabetes was estimated to be 10.5% (537 million individuals) in 2021, with projections indicating a rise to 12.2% (783 million individuals) by 2045 [1]. This alarming trend is not only evident in high-income countries, but the largest increases are observed in middle-income countries [2]. As a significant non-communicable disease, diabetes poses a substantial burden on public health [3]. Diabetes, associated with elevated fasting blood sugar (FBS) and insulin levels, disrupts the normal biological functioning, and significantly increases the risk of conditions such as retinopathy, coronary heart disease, renal failure, neuropathy, and various types of cancer [4,5,6,7].
Strategies such as dietary patterns, individual nutrients and lifestyle are effective in the prevention and management of diabetes [8]. The quality of fats and carbohydrates in the diet is more important than the quantity of these macronutrients. Polyunsaturated fatty acids (PUFAs), specifically n-3 PUFAs, have a significant impact on alleviating hyperglycemia and its associated complications [9,10,11]. These N-3 PUFAs comprise eicosapentaenoic acid (EPA), docosapentaenoic acid (DPA), and docosahexaenoic acid (DHA) derived from animal sources, as well as α-linolenic acid (ALA) sourced from plants. N-6 PUFAs, such as linoleic acid (LA), are derived from plants. Both ALA and LA are essential fatty acids (EFAs) that the human body needs, with the differentiation being based on the position of the initial double bond counted starting from the methyl end of the fatty acid (FA) molecule. LA and ALA share the same desaturase enzyme and have a competitive inhibitory relationship [12]. On the one hand, arachidonic acid (AA), a downstream product of LA, increases the biosynthesis of pro-inflammatory eicosanoids [13]. On the other hand, LA competes with ALA, inhibiting the conversion of ALA to n-3 long-chain PUFA to exert its biological activity [14]. Thus, the accomplishment of a balanced ratio of LA/ALA can help restoring the physiological equilibrium influenced by both genetic and environmental factors. Over the past few years, animal and cell culture studies have demonstrated that increasing ALA has beneficial effects on the prevention of type 2 diabetes mellitus (T2DM) through a variety of mechanisms, including alteration of cell membrane function, anti-inflammatory and antioxidant effects, insulin signaling, and control of glucose metabolism gene expression [15,16,17,18,19]. Epidemiologic evidence suggests that increasing ALA or decreasing LA dietary intake has a controlling effect on glucose and insulin levels. Numerous human intervention studies have explored the impacts of diets with varying LA/ALA ratios on factors such as FBS and insulin levels. However, the findings from these studies have been inconsistent and inconclusive. Some conflicting research has indicated that a low ration of LA/ALA: (a) was significantly associated with decreased levels of FBS [20], insulin [21], and hemoglobin A1c (HbA1c) [22]; (b) was significantly correlated with increased levels of FBS [23] and insulin [24]; and (c) did not have any significant effect on the levels of FBS, insulin, homeostatic model assessment insulin resistance (HOMA-IR), and HbA1c [25,26]. These variations can be attributed to factors such as sample size, duration of the intervention, and the type of intervention employed, including aspects like total energy intake, dietary intake of LA and ALA.
Although LA and ALA are some of the most common forms of PUFA supplementation, the complete metadata on the relationship between LA/ALA ratio and glycemia are still lacking. Consequently, the objective of this study was to comprehensively assess and compare the impacts of the low-ratio LA/ALA diet on FBS, insulin, HbA1c, and HOMA-IR using randomized controlled trials (RCTs) as the basis.

2. Methods

2.1. Search Strategy

To ensure that the study was conducted and reported in a systematic manner, we adhered to the guidelines outlined in the Preferred Reporting Items for Systematic Reviews and Meta-Analyses (PRISMA) statement. A comprehensive search was performed on four electronic databases, namely Web of Science, Scopus, Embase, and PubMed, up until February 2023. The search strategy employed is elaborated upon in Supplementary Table S1.

2.2. Inclusion Criteria

In order to be included in this review, studies had to meet specific criteria. These criteria included (1) focusing on the impact of LA/ALA ratio (in the form of plant oil, fat, and nuts) on various biological markers related to blood glucose control, such as FBS, insulin, HOMA-IR, and HbA1c; (2) the study participants consisted of individuals aged 18 years or older; (3) the intervention duration lasted at least two weeks; (4) the primary outcomes of articles reported sufficient information on baseline and final study; (5) the LA/ALA ratio was explicitly reported in the article, or it could be obtained by proper calculation; (6) to isolate the specific impact of the LA/ALA ratio on glucose, the included studies differentiated it from the influence of other dietary sources or interventions, such as fish oil, and conjugated linoleic acid (CLA), and physical activity programs. This approach allowed for a more focused analysis of the independent effects of the LA/ALA ratio on blood glucose control, minimizing confounding factors that could potentially influence the results.

2.3. Data Extraction

Two researchers independently conducted the data extraction based on the predefined inclusion criteria. The Cochrane Risk of Bias tool was employed to assess the methodological quality of the included studies. In case of any disputes, the original literature was re-evaluated to ensure accuracy and consistency. If there were any disagreements or conflicts during the study selection, a third reviewer was consulted to establish a consensus and resolve any discrepancies. The following data were extracted from each eligible study: the first author’s name, publication year, country where the study was conducted, type and duration of the intervention, total number of participants, participants characteristics (including disease, age, BMI, smoking status, and gender), protein, carbohydrates, and fat (saturated and monounsaturated FA, PUFA, LA, ALA) as percentage of total energy, LA/ALA ratio, and the mean and standard deviation (SD) changes in blood-glucose-related biomarkers at pre-treatment and post-treatment. In cases where multiple articles reported the same outcomes, preference was given to the article with the largest number of participants and longest duration for inclusion in the review.

2.4. Statistical Methods

Endnote software (Endnote X9.1) was employed to process the article, eliminating any duplicate entries. Subsequently, the screening and full text review were conducted using Microsoft Excel software (Microsoft Excel 16.0). To conduct the primary analysis, sensitivity analyses, and assess publication bias, we utilized STATA software (version 14.0, Stata Corp., College Station, TX, USA). Mean (SD) were extracted to perform a combined effect size analysis. Conversion formulas were utilized to calculate SD in situations where they were not directly provided [27]. If the standard deviation (SD) of the change was not provided in the trials, it was calculated using the formula: SD change = square root [(SD pre-treatment)2 + (SD post-treatment)2 − (2R × SD pre-treatment × SD post-treatment)] (R = 0.5). Moreover, when data were solely presented graphically, the relevant information was digitally extracted and quantified using the GetData Graph Digitizer software (GetData 2.25). The statistical significance of net changes was assessed using the weighted mean difference (WMD) with a 95% confidence interval (CI). The level of heterogeneity was classified as low (I2 ≤ 50%) or high (50% < I2), accordingly. Sensitivity analysis was conducted to investigate potential sources of heterogeneity, where each study was individually excluded to assess the impact of any specific study on the overall validity of the effect size. We utilized Begg’s tests, Egger regression tests, and visual calculations using funnel plots to evaluate possible publication bias. Furthermore, predetermined subgroup analyses were conducted to examine association between different subgroups and glucose. A p value below 0.05 was used to assess the statistical significance.

3. Results and Discussion

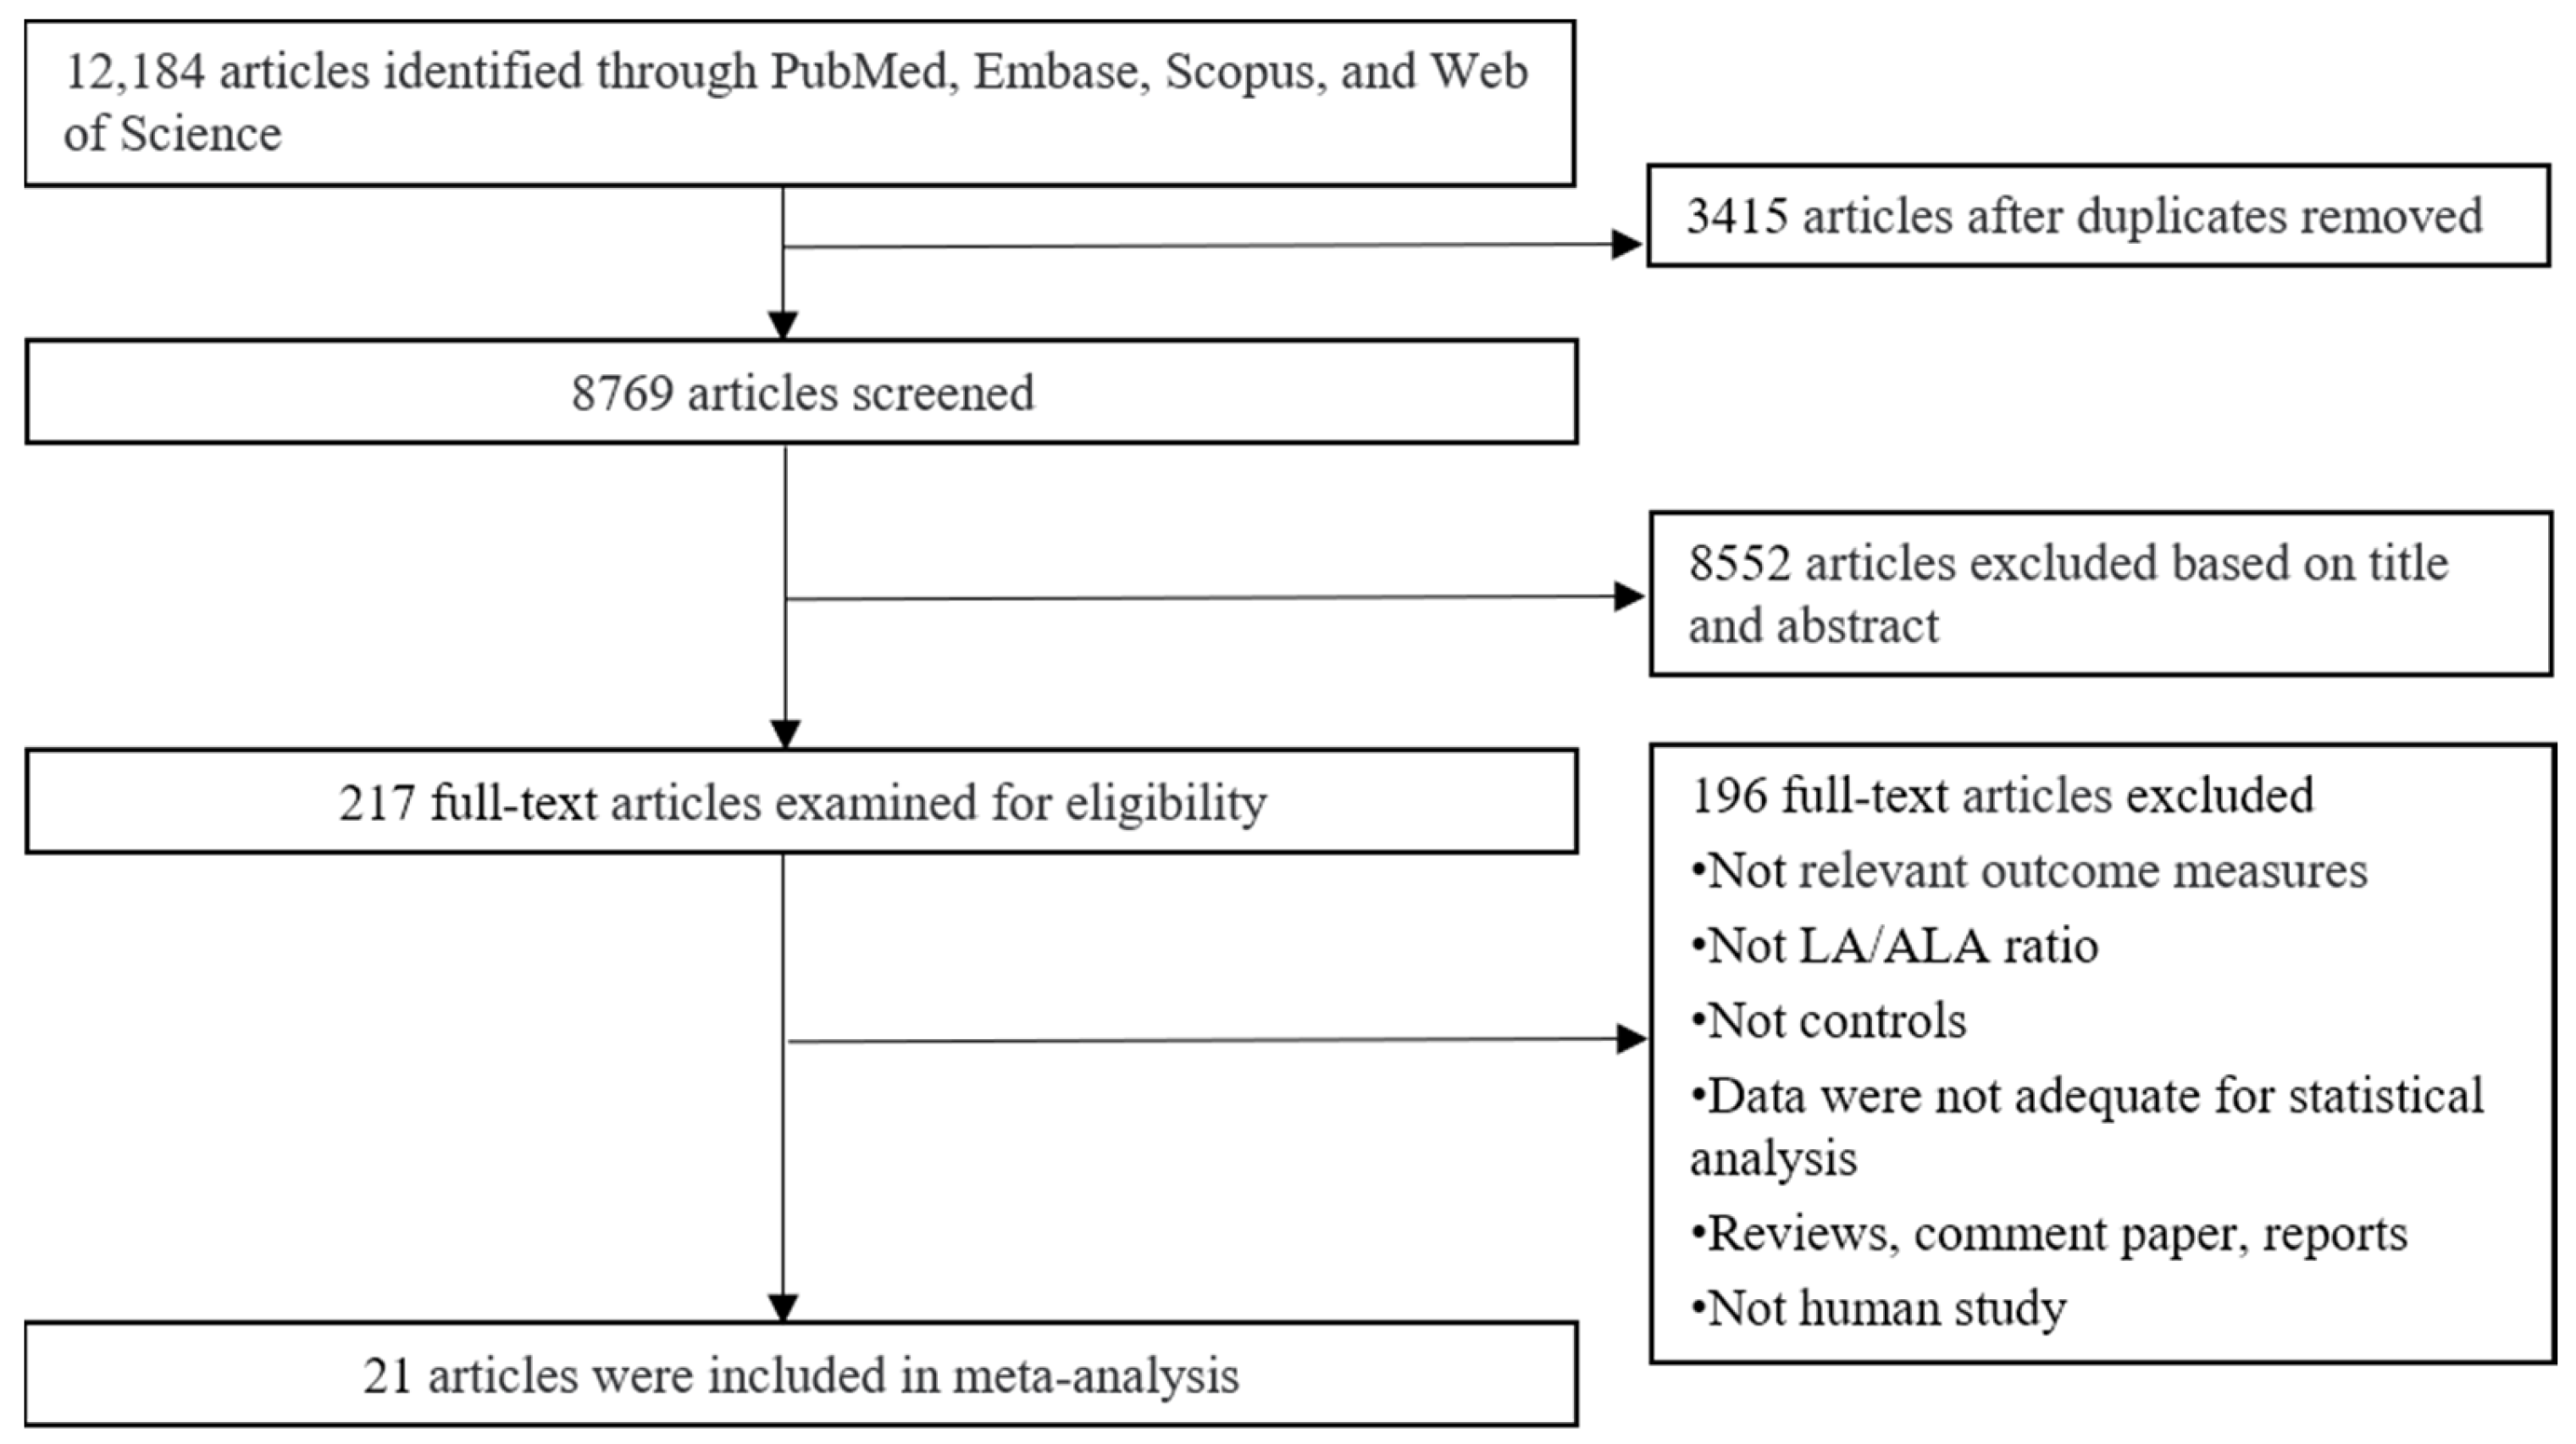
3.1. Study Selection and Description

A total of 12,184 publications were initially searched from four databases, and 8769 articles were retained after eliminating duplicates. Subsequently, 217 articles were selected for full-text examination based on the titles and abstracts. Ultimately, 21 articles were included in this meta-analysis [22,23,24,28,29,30,31,32,33,34,35,36,37,38,39,40,41,42,43,44,45]. The screening process is depicted in Figure 1. Among the 21 articles that met the eligibility criteria, the effects of LA/ALA ratio on FBS were investigated in all 21 studies. Insulin was assessed in 17 studies, HOMA-IR in 10 studies, and HbA1c in 7 studies.
A detailed summary of the characteristics of the eligible trials is provided in Table 1, presenting the relevant information. The articles spanned from 1996 to 2020 in terms of publication dates. The study was conducted in several countries, including Iran, Netherlands, China, Denmark, UK, USA, Japan, Greece, Germany, Canada, India, Poland, Finland, Sweden. Among these, 6 studies were carried out in North America, 13 studies in Europe, 8 studies in Asia. A total of 17 articles used a parallel design and 4 articles used a crossover design. Sample sizes in the included studies ranged from 11 [38] to 243 [30]. The intervention duration ranged from 3 [23] to 48 [30] weeks. The eligible studies included participants of various ages, with an average age range within 22.8 [36] to 61.8 [38] years. The BMI of the participants ranged from 21.9 [35] to 39.6 [23]. The publications that met the eligibility criteria included participants of both genders, with two studies involving only women [22,44] and two only men [31,34]. Among the included trials, 11 studies specifically enrolled non-smoking subjects, whereas 7 included a combination of smoking and non-smoking subjects. Eligible study participants suffered from dyslipidemia [30,32,43,45], obesity [23,40], type 2 diabetes [24,37,38,42], metabolic syndrome [28,29], polycystic ovary syndrome [22,44], and non-alcoholic fatty liver [41], while healthy individuals were also included [31,33,34,35,36,39].
Supplementary Table S2 provides comprehensive details on dietary energy intake. The total energy intake, fat, protein, and carbohydrate supplementation (as a percentage of total energy) remained consistent. There was a significant difference in the total energy consumed by subjects in one study [32], a significant difference in the macronutrients consumed as a percentage of total energy by subjects in one study [42], and a significant difference in the fat consumed as a percentage of total energy by subjects in two studies [22,37]. Among the 21 studies analyzed, significant differences in PUFA were observed in 6 studies [28,31,33,37,40,42], MUFA and PUFA in 3 studies [35,36,39], and SFA, MUFA and PUFA in 2 studies [22,43]. Supplementation with flaxseed, canola oil, caper oil, hemp seed oil, and walnut can decrease the LA/ALA ratio. The low-ratio LA/ALA varied from 0.14 [28] to 9 [39], and the high-ratio LA/ALA varied from 4.3 [42] to 228.2 [41]. The range of dietary intake of LA ranged between 2.1% [28] and 18.1% [36] of total energy per day, while the ALA intake ranged from 0.21% [30] and 15.2% [28] of total energy per day.
The Cochrane Collaboration Risk of Bias Tool was utilized for the quality assessment of the included studies (Supplementary Table S3). Ten articles described randomized controlled methods. Ten articles had detailed methods describing allocation concealment. Most studies used single-blind or double-blind studies and concealed supplement allocation, except for 2 articles. Observational bias was not identified in most studies. Selective bias reporting was not described in most trails. There were no additional sources of bias identified across all studies.

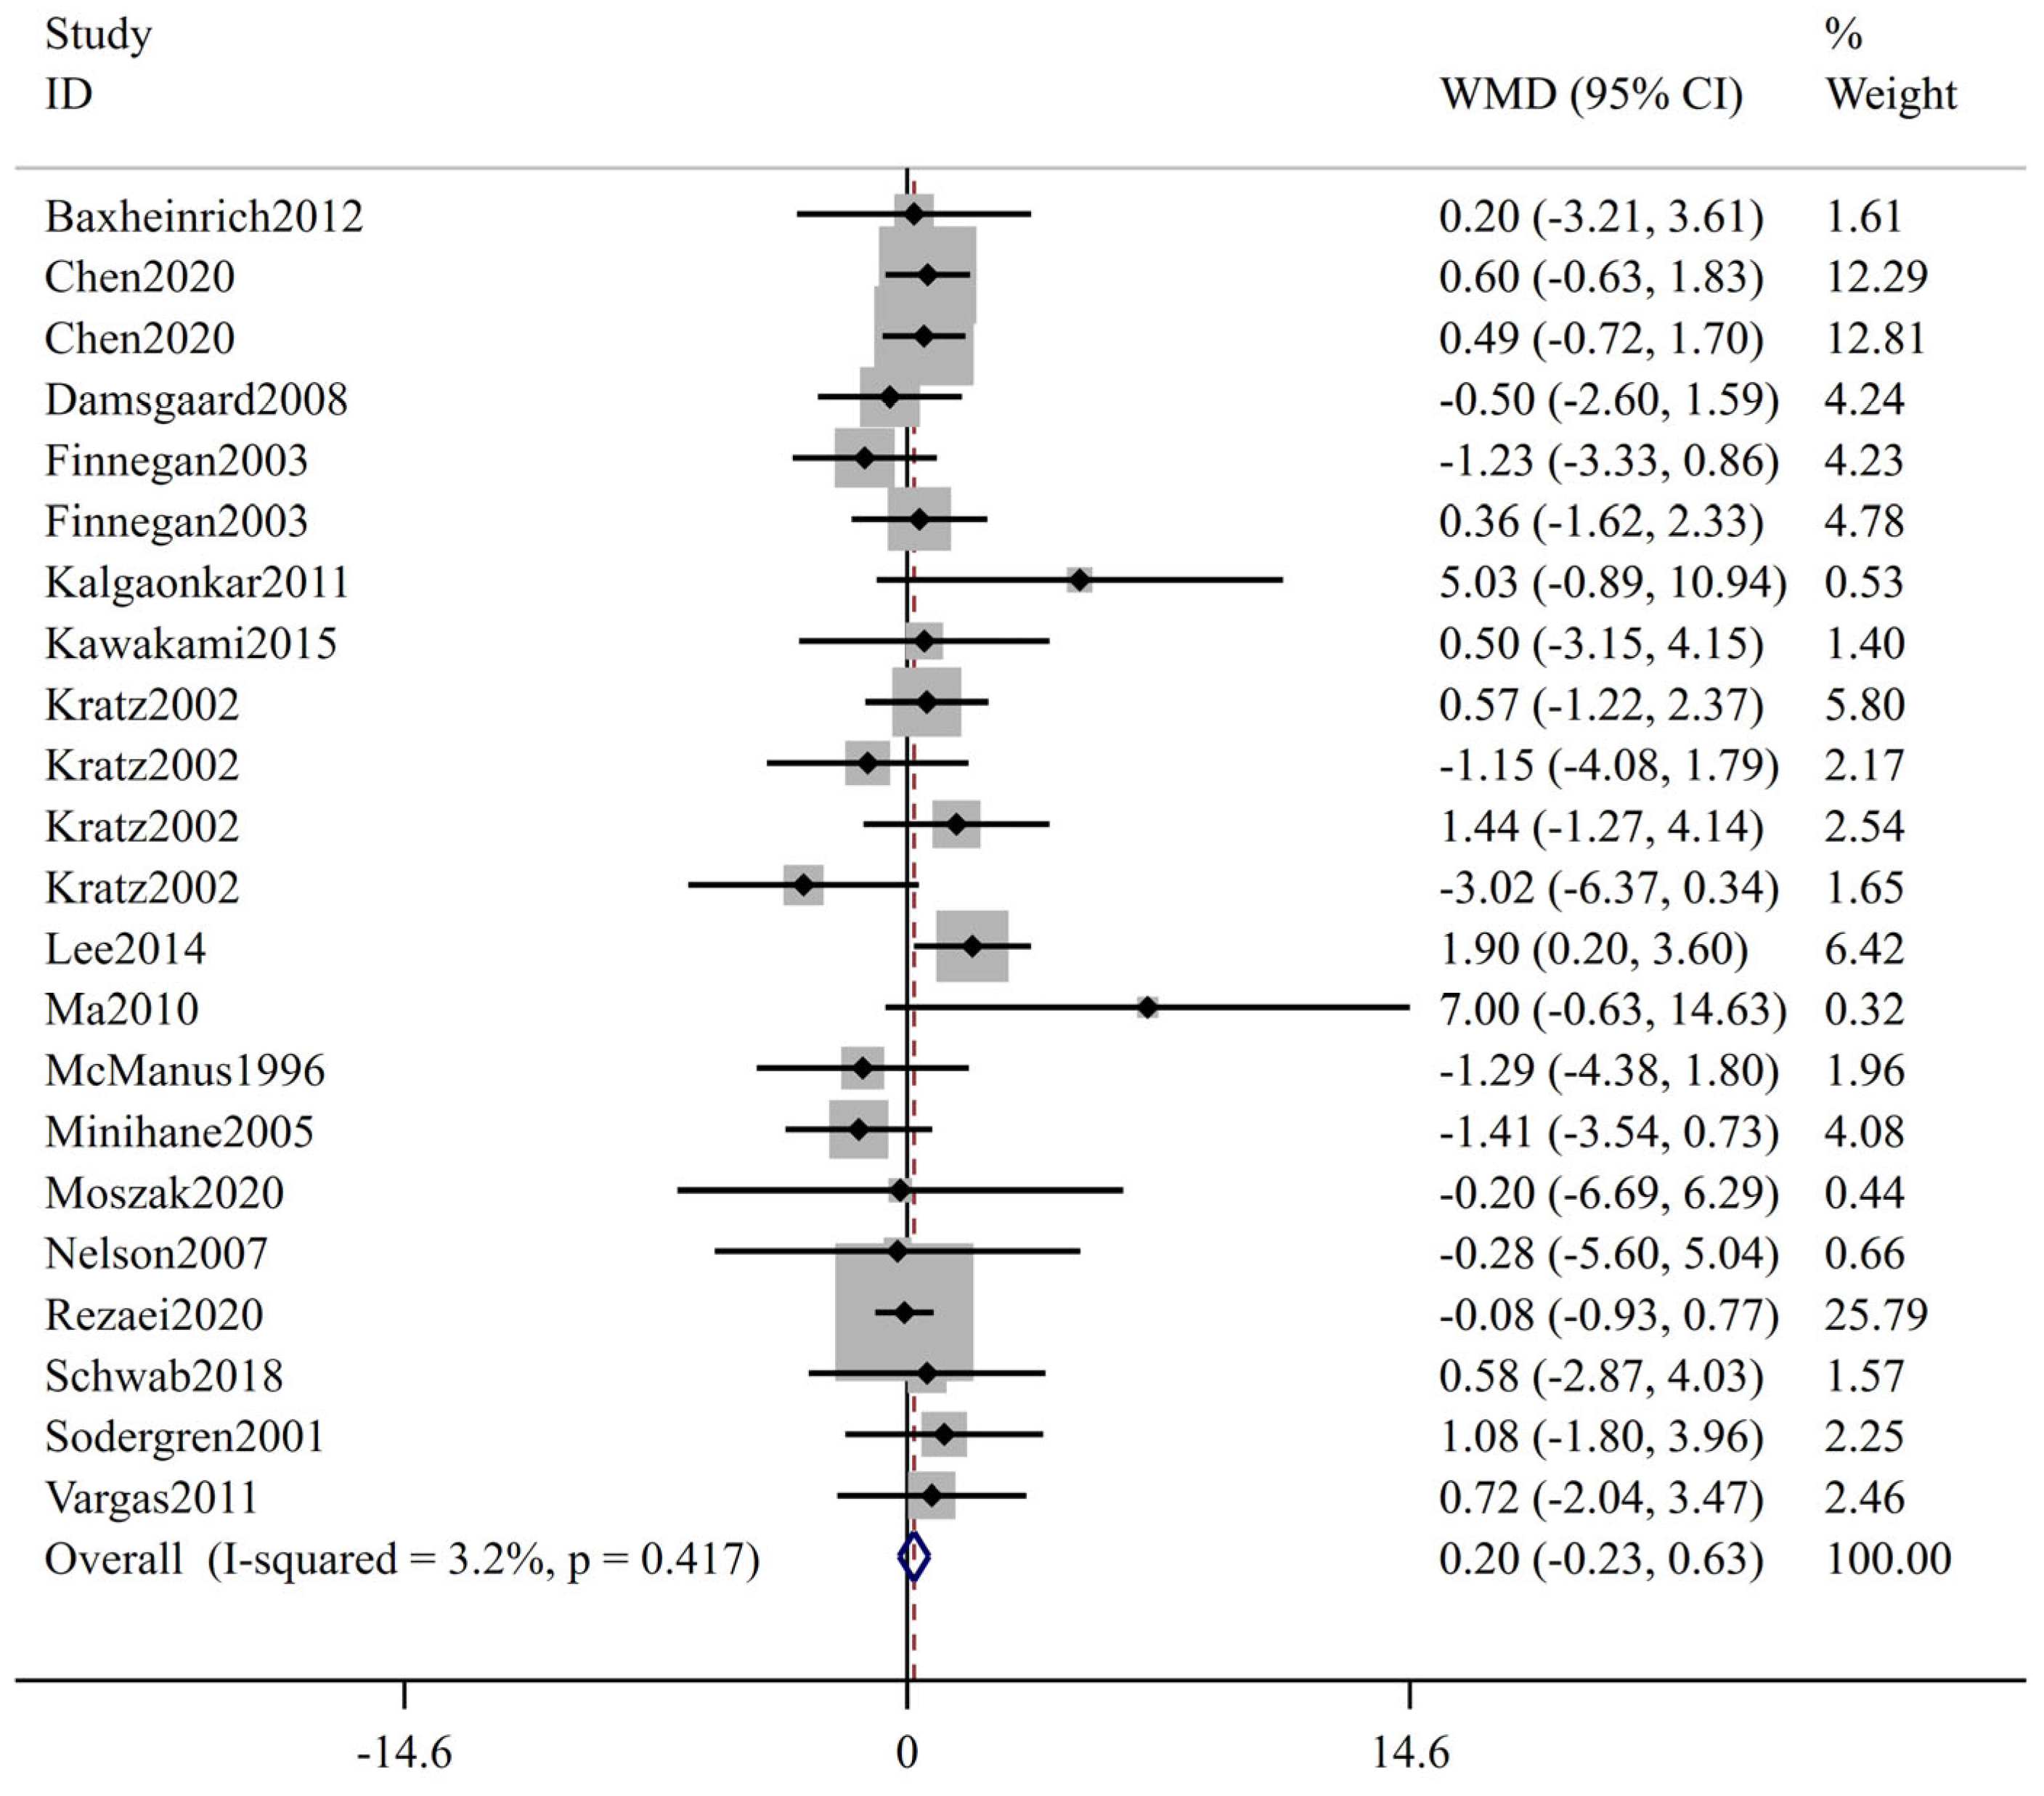
3.2. Meta-Analysis Results

The forest plot of FBS is shown in Figure 2; 27 trials including 1415 participants (cases = 714, controls = 701) reported FBS as an outcome measure. According to the overall analysis from the fixed-effects models, the low-ratio LA/ALA diet did not lead to significant change on FBS (WMD: 0.00 mmol/L, 95% CI: −0.06, 0.06, p = 0.989). The I2 test indicated no statistically significant heterogeneity among the included studies (I2 = 0.0%, p = 0.843). Figure 3 displays the results for insulin, involving 22 trials with a total of 1096 participants (549 cases and 547 controls). Based on the pooled results from fixed-effects models, there was no significant change in insulin level following interventions with low-ratio LA/ALA diet (WMD: 0.20 μIU/mL, 95% CI: −0.23, 0.63, p = 0.360). The included trials exhibited non-significant heterogeneity (I2 = 3.2%, p = 0.417). Figure 4 illustrates the effect of low-ratio LA/ALA diet on HOMA-IR, involving eleven trials with a total of 736 participants (373 cases and 363 controls). The pooled findings indicated no significant decrease in HOMA-IR after consuming low-ratio LA/ALA diet (WMD: 0.09, 95% CI: −0.06, 0.23, p = 0.243). Heterogeneity was not significant, as indicated by the I2 value (I2 = 0.0%, p = 0.480). The forest plot of HbA1c is shown in Figure 5, 11 trails including 257 participants (cases = 129, controls = 128) examined the impact of low-ratio LA/ALA diet on the HbA1c. Our findings show no significant reduction in HbA1c levels after the low-ratio LA/ALA dietary intervention (WMD: −0.01%, 95% CI: −0.07, 0.06, p = 0.836). Additionally, no substantial heterogeneity among the included trials was observed (I2 = 0.0%, p = 0.465).

3.3. Sensitivity Analysis, Subgroup Analysis and Meta-Regression

To assess the influence of individual studies on the overall effect size, we conducted sensitivity analyses by sequentially excluding each trial from the analysis. The pooled effect size for the remaining studies, excluding the current study, is indicated by the circles in Supplementary Figures S1–S4. Sensitivity analyses revealed that the effects of the low-ratio LA/ALA diet on FBS, insulin, HOMA-IR, and HbA1c levels remained consistent regardless of the exclusion of any individual study. Upon examining Supplementary Figures S5–S8, we were visually examined to detect potential publication bias. The Begg’s test indicated no publication bias for FBS (p = 0.058), insulin (p = 0.844), HOMA-IR (p = 0.815), and HbA1c (p = 0.371). Similarly, the Egger’s test showed no publication bias for FBS (p = 0.149), insulin (p = 0.669), HOMA-IR (p = 0.841), and HbA1c (p = 0.523).
Subsequently, we conducted subgroup analyses to stratify the studies based on LA/ALA ratio (≤1, 1–5, and ≥5), region, health status, age (≤25, 25–30, and ≥30), BMI (<12 and ≥12 weeks), smoking, and duration (<12 and ≥12 weeks), as indicated in Table 2. The subgroup analyses specifically focused on the impacts of low-ratio LA/ALA diet on lowering FBS, and no significant changes were observed. These analyses showed that low-ratio LA/ALA supplementation had a significant increase on the insulin level in North America (WMD: 1.31 μIU/mL, 95% CI: 0.08, 2.54, p = 0.037, I2 = 32.0%). However, low-ratio LA/ALA supplementation had no significant effect on insulin level in Asia (WMD: 0.12 μIU/mL, 95% CI: −0.46, 0.69, p = 0.693, I2 = 0.0%) and Europe (WMD: −0.08 μIU/mL, 95% CI: −0.85, 0.69, p = 0.835, I2 = 0.0%). Studies stratified by health status showed a combined effect, showing significantly lower HbA1c level in subjects with polycystic ovary syndrome (WMD: −0.12%, 95% CI: −0.23, −0.00, p = 0.046, I2 = 0.0%). When the trials were categorized by region, the comprehensive analysis revealed a significant increase on HOMA-IR among subjects in North America (WMD: 0.47, 95% CI: 0.10, 0.84, p = 0.012, I2 = 0.0%) and an increase, but not a significant one, among subjects in Europe (WMD: 0.00, 95% CI: −0.42, 0.42, p = 0.260, I2 = 25.8%) and Asia (WMD: 0.02, 95% CI: −0.15, 0.19, p = 0.658, I2 = 0.0%).
To evaluate possible linear associations between the combined effect and continuous confounding factors (intervention duration, LA/ALA ratio, age, and BMI), we conducted meta-regressions. Our analysis revealed no significant linear relationships between FBS and intervention duration, LA/ALA ratio, age, and BMI in the included studies (intervention duration: p = 0.386; LA/ALA ratio: p = 0.781; age: p = 0.214; BMI: p = 0.732). Similar findings were observed in the meta-regressions analyzing insulin and its continuous confounders (intervention duration: p = 0.534; LA/ALA ratio: p = 0.973; age: p = 0.233; BMI: p = 0.193), as well as in the meta-regressions examining HOMA-IR and its continuous confounders (intervention duration: p = 0.869; LA/ALA ratio: p = 0.683; age: p = 0.713; BMI: p = 0.338). However, due to the limited number of included studies (less than 10), a meta-regression for HbA1c was not conducted.

3.4. Discussion

Despite the compelling evidence indicating the association between ALA and reduced cardiovascular disease (CVD) risk [46], as well as the lipid-lowering effects of ALA intake in hyperglycemic patients [47], the findings from meta-analyses investigating the impact of dietary ALA intake on T2DM events and glycemic control markers are inconclusive [48,49,50]. LA and ALA have the same desaturase and compete for inhibition in metabolic pathways, making the LA/ALA ratio more important than the absolute intake of both. The present systematic review and meta-analysis incorporated data from 21 RCTs encompassing 1415 participants. Our findings revealed that the administration of low-ratio LA/ALA diet did not yield any significant impact on FBS, insulin, HbA1c, and HOMA-IR. The findings were robust across the different studies included and analyzed and were not affected by sensitivity analysis.
Several studies have reported that after dietary intake of low-ratio LA/ALA, FBS decreases [32,43,51,52] or remains unchanged [30,34], and plasma insulin increases [24,37] or remains unchanged [23,29]. When conducting subgroup analysis, it was observed that individuals following a low-ratio LA/ALA diet in North America exhibited significantly higher plasma insulin and HOMA-IR levels compared to their counterparts in Asia and Europe regions. There was a trend toward lower FBS in North America and Europe, while the opposite was observed in Asia. Due to the very low quality of evidence, the meta-analysis of the trials suggests that the impact of ALA on the diagnosis of diabetes is uncertain [49]. A meta-analysis of RCTs in diabetic patients showed little effect of dietary intake of ALA on the measurement of glucose-related biomarkers [53]. A meta-analysis of low evidence suggests that ALA elevates fasting insulin levels. Higher erythrocyte ALA levels were negatively associated with T2DM risk in participants with a low genetic risk for T2DM, whereas high genetic risk eliminated the association between ALA and T2DM [54]. The variation in the response to low-ratio LA/ALA observed between Asian and Western populations could be attributed to the strong influence of genetic factors and environmental factors, including dietary habits, on the development of diabetes [55].
In the subgroup with polycystic ovary syndrome (POS), the low-ratio LA/ALA supplementation had a significant effect on the reduction of HbA1c level. Kalgaonkar’s study showed that 31 patients with POS received a diet containing 31 g of total fat per day with walnuts or almonds for 6 weeks. The walnut group reduced the low-ratio LA/ALA in the ration and plasma phospholipids, increasing insulin by 36 pmol/l and reducing HbA1c by 0.2% [22]. Another study by Vargas did not show effects on HbA1c and FBS, among others [44]. Caution should be given in interpreting these findings as the limited literature and small sample size may limit generalizability. Within this subgroup, there were only two studies, and the findings from Kalgaonkar’s study had a notable impact on the overall reliability of the pooled results.
No significant differences were observed in the outcomes across the subgroups when grouping was based on the LA/ALA ratio. In the subgroups with low-ratio LA/ALA greater than 5, results were worse for all markers of glycemic control. In the range of LA/ALA ratio less than 1, levels of FBS and Insulin were decreased but not significantly. In the subgroups with the low-ratio LA/ALA greater than 1 less than 5, levels of FBS and HbA1c were decreased but not significantly. This suggests that the high-ratio LA/ALA may have a negative impact on diabetes. These findings align with a prior systematic review, which also found that the subgroup with a n−6/n−3 PUFA ratio of less than 5 exhibited tendencies towards improvements in FBS, insulin levels, and insulin resistance [56].
When the intervention duration extended beyond 12 weeks, there was a tendency for a decrease in FBS, albeit not statistically significant. Conversely, when the intervention duration <12 weeks, the results showed the opposite trend. Despite the lack of statistical significance, it appeared that the low-ratio LA/ALA diet had a tendency to improve FBS level as compared to the high-ratio LA/ALA. This suggests that long-term treatment may have a stronger positive effect. Dietary intake of 9.5 g ALA for 6 months improved glycemic and lipid-related markers [32]. Data from 25 hypercholesterolemic menopausal women subjects suggest that a sustained long-term intake of low-ratio LA/ALA improves mild menopausal symptoms, reduces FBS and insulin levels, and facilitates changes in markers associated with cardiovascular health [52]. Dietary intake of 40 g of flaxseed for 12 weeks reduced thiobarbituric acid reactive substances (TBARS) and HOMA-IR [57]. ALA has been found to exert effects on specific diseases, which could potentially be associated with its influence on the absorption and metabolism pathways of PUFA within the body. The low-ratio LA/ALA diet initiates a cascade of beneficial effects starting with the enhancement of lipid metabolism. This improvement in lipid metabolism subsequently leads to a reduction in insulin resistance. Over a prolonged period of intervention, the low-ratio LA/ALA diet gradually contributes to the amelioration of blood glucose levels. However, given the limited amount of literature and small sample size, these findings should be interpreted with caution. Further studies in the form of large-scale, high-quality, and long-term RCTs are required to validate these results.
Most of the existing meta-analyses are mostly limited to analyzing the effect of ALA on diabetes risk and blood glucose. The current study represents a novel contribution by systematically investigating the correlation between plant-derived LA/ALA ratio and various glucose-related biomarkers. Notably, this study included high-quality summary statistics derived from a substantial sample size of 1415 subjects enrolled in 21 independent RCTs across 13 different countries. Furthermore, the robustness of the findings was supported by sensitivity analyses, and the absence of significant publication bias was demonstrated by Begg’s test and Egger’s test. However, it is important to acknowledge the limitations and shortcomings of our meta-analysis. Firstly, all the trials included in our analysis were conducted for relatively short durations, generally not exceeding 6 months. Therefore, the long-term impacts of dietary fat of the low-ratio LA/ALA on blood glucose level remain a topic that warrants further exploration in future research. Additionally, it should be noted that energy expenditure and the proportions of different types of FA were not constant across all the intervention periods in the included trials. These factors could potentially introduce variability and influence the outcomes of our analysis. It is worth noting that the FA compositions and other bioactive components can vary among different sources of LA and ALA. Thus, it remains necessary to investigate whether these factors mentioned above have an influence on the impacts of the LA/ALA ratio. Additionally, a significant proportion of the studies considered in our analysis consisted of limited sample sizes, frequently comprising less than 100 participants. Furthermore, the use of crossover (CO) designs in certain trials to bolster the effective sample size may have introduced certain complexities that could have impacted the overall outcomes. Insufficient data and imprecise categorization in certain studies might have compromised the subgroup analyses.

4. Conclusions

The types of FA in the diet are complex, and rarely are LA or ALA ingested singly. This systematic review and meta-analysis pooled 21 RCTs of low-ratio LA/ALA diet, encompassing 1415 subjects in 13 countries. The results found no effect of low-ratio LA/ALA diet on FBS, insulin, HOMA-IR, and HbA1c. Plasma insulin and HOMA-IR levels were significantly higher in North American patients on a low-ratio LA/ALA diet, compared to Asian and European regions. To comprehensively assess the prolonged impacts of low-ratio LA/ALA diet, it is imperative to incorporate additional RCTs encompassing diverse geographical regions and ethnicities.

Supplementary Materials

The supporting information can be downloaded at https://www.mdpi.com/article/10.3390/ijms241814383/s1.

Author Contributions

Conceptualization, Q.W. and X.W.; methodology, X.W.; software, X.W.; validation, Q.W. and X.W.; formal analysis, Q.W.; investigation, Q.W.; resources, Q.W.; data curation, Q.W.; writing—original draft preparation, Q.W.; writing—review and editing, Q.W.; visualization, X.W.; supervision, X.W.; project administration, X.W.; funding acquisition, X.W. All authors have read and agreed to the published version of the manuscript.

Funding

This research received no external funding.

Institutional Review Board Statement

This systematic review and meta-analyses were conducted following Cochrane’s PRISMA (Preferred Reporting Items for Systematic Reviews and Meta-Analyses) guidelines.

Informed Consent Statement

Not applicable.

Data Availability Statement

Data are contained within the article and Supplementary Material.

Acknowledgments

This study was supported by the program “Collaborative Innovation Center of Food Safety and Quality Control in Jiangsu Province” and the help of the staff.

Conflicts of Interest

The authors declare no conflict of interest.

Abbreviations

LALinoleic acid
ALAAlpha-linolenic acid
RCTsRandomized controlled trials
WMDWeighted mean difference
CIConfidence interval
FBSFasting blood sugar
HOMA-IRHomeostatic model assessment insulin resistance
HbA1cHemoglobin A1c
IDFInternational Diabetes Federation
T2DMType 2 diabetes mellitus
CVDCardiovascular disease
POSPolycystic ovary syndrome
EFAEssential fatty acids
FAFatty acids
PUFAPolyunsaturated fatty acid
AAArachidonic acid
EPAEicosapentaenoic acid
DHADocosahexaenoic acid
CLAConjugated linoleic acid
BMIBody mass index
SDStandard deviations

References

  1. Sun, H.; Saeedi, P.; Karuranga, S.; Pinkepank, M.; Ogurtsova, K.; Duncan, B.B.; Stein, C.; Basit, A.; Chan, J.C.N.; Mbanya, J.C.; et al. IDF Diabetes Atlas: Global, regional and country-level diabetes prevalence estimates for 2021 and projections for 2045. Diabetes Res. Clin. Pract. 2022, 183, 109119. [Google Scholar] [CrossRef]
  2. Safiri, S.; Karamzad, N.; Kaufman, J.S.; Bell, A.W.; Nejadghaderi, S.A.; Sullman, M.J.M.; Moradi-Lakeh, M.; Collins, G.; Kolahi, A.A. Prevalence, Deaths and Disability-Adjusted-Life-Years (DALYs) Due to Type 2 Diabetes and Its Attributable Risk Factors in 204 Countries and Territories, 1990-2019: Results from the Global Burden of Disease Study 2019. Front. Endocrinol. 2022, 13, 838027. [Google Scholar] [CrossRef]
  3. Saeedi, P.; Petersohn, I.; Salpea, P.; Malanda, B.; Karuranga, S.; Unwin, N.; Colagiuri, S.; Guariguata, L.; Motala, A.A.; Ogurtsova, K.; et al. Global and regional diabetes prevalence estimates for 2019 and projections for 2030 and 2045: Results from the International Diabetes Federation Diabetes Atlas, 9th edition. Diabetes Res. Clin. Pract. 2019, 157, 107843. [Google Scholar] [CrossRef]
  4. Bhupathiraju, S.N.; Hu, F.B. Epidemiology of Obesity and Diabetes and Their Cardiovascular Complications. Circ. Res. 2016, 118, 1723–1735. [Google Scholar] [CrossRef]
  5. Faselis, C.; Katsimardou, A.; Imprialos, K.; Deligkaris, P.; Kallistratos, M.; Dimitriadis, K. Microvascular Complications of Type 2 Diabetes Mellitus. Curr. Vasc. Pharmacol. 2020, 18, 117–124. [Google Scholar] [CrossRef]
  6. Martin, C.L.; Albers, J.W.; Pop-Busui, R.; Grp, D.E.R. Neuropathy and Related Findings in the Diabetes Control and Complications Trial/Epidemiology of Diabetes Interventions and Complications Study. Diabetes Care 2014, 37, 31–38. [Google Scholar] [CrossRef]
  7. Tomic, D.; Shaw, J.E.; Magliano, D.J. The burden and risks of emerging complications of diabetes mellitus. Nat. Rev. Endocrinol. 2022, 18, 525–539. [Google Scholar] [CrossRef]
  8. Ley, S.H.; Hamdy, O.; Mohan, V.; Hu, F.B. Prevention and management of type 2 diabetes: Dietary components and nutritional strategies. Lancet 2014, 383, 1999–2007. [Google Scholar] [CrossRef]
  9. Duran, A.M.; Salto, L.M.; Camara, J.; Basu, A.; Paquien, I.; Beeson, W.L.; Firek, A.; Cordero-MacIntyre, Z.; De Leon, M. Effects of omega-3 polyunsaturated fatty-acid supplementation on neuropathic pain symptoms and sphingosine levels in Mexican-Americans with type 2 diabetes. Diabetes Metab. Syndr. Obes.Targets Ther. 2019, 12, 109–120. [Google Scholar] [CrossRef]
  10. Huang, L.L.; Zhang, F.J.; Xu, P.; Zhou, Y.J.; Liu, Y.J.; Zhang, H.D.; Tan, X.Z.; Ge, X.X.; Xu, Y.; Guo, M.; et al. Effect of Omega-3 Polyunsaturated Fatty Acids on Cardiovascular Outcomes in Patients with Diabetes: A Meta-analysis of Randomized Controlled Trials. Adv. Nutr. 2023, 14, 629–636. [Google Scholar] [CrossRef]
  11. Jiang, H.; Wang, L.N.; Wang, D.L.; Yan, N.; Li, C.; Wu, M.; Wang, F.; Mi, B.B.; Chen, F.Y.; Jia, W.R.; et al. Omega-3 polyunsaturated fatty acid biomarkers and risk of type 2 diabetes, cardiovascular disease, cancer, and mortality. Clin. Nutr. 2022, 41, 1798–1807. [Google Scholar] [CrossRef]
  12. Simopoulos, A.P.; DiNicolantonio, J.J. The importance of a balanced omega-6 to omega-3 ratio in the prevention and management of obesity. Open Heart 2016, 3, e000385. [Google Scholar] [CrossRef]
  13. Schmitz, G.; Ecker, J. The opposing effects of n-3 and n-6 fatty acids. Prog. Lipid Res. 2008, 47, 147–155. [Google Scholar] [CrossRef]
  14. Barcelo-Coblijn, G.; Murphy, E.J. Alpha-linolenic acid and its conversion to longer chain n-3 fatty acids: Benefits for human health and a role in maintaining tissue n-3 fatty acid levels. Prog. Lipid Res. 2009, 48, 355–374. [Google Scholar] [CrossRef]
  15. Canetti, L.; Werner, H.; Leikin-Frenkel, A. Linoleic and alpha linolenic acids ameliorate streptozotocin-induced diabetes in mice. Arch. Physiol. Biochem. 2014, 120, 34–39. [Google Scholar] [CrossRef]
  16. Gomes, P.M.; Hollanda-Miranda, W.R.; Beraldo, R.A.; Castro, A.V.B.; Geloneze, B.; Foss, M.C.; Foss-Freitas, M.C. Supplementation of alpha-linolenic acid improves serum adiponectin levels and insulin sensitivity in patients with type 2 diabetes. Nutrition 2015, 31, 853–857. [Google Scholar] [CrossRef]
  17. Russell, J.S.; Griffith, T.A.; Peart, J.N.; Headrick, J.P. Cardiomyoblast caveolin expression: Effects of simulated diabetes, alpha-linolenic acid, and cell signaling pathways. Am. J. Physiol. Cell Physiol. 2020, 319, C11–C20. [Google Scholar] [CrossRef]
  18. Wang, M.; Zhang, X.J.; Feng, K.; He, C.; Li, P.; Hu, Y.J.; Su, H.; Wan, J.B. Dietary alpha-linolenic acid-rich flaxseed oil prevents against alcoholic hepatic steatosis via ameliorating lipid homeostasis at adipose tissue-liver axis in mice. Sci. Rep. 2016, 6, 26826. [Google Scholar] [CrossRef]
  19. Liu, Y.Y.; Guo, M.X.; Li, Y.W.; Wang, T.; Ren, Y.; Wang, R.; Jiang, X.; Zhang, X.X.; Tian, J.Y.; Wang, H. alpha-Linolenic acid regulates macrophages via GPR120-NLRP3 inflammasome pathway to ameliorate diabetic rats. J. Funct. Foods 2022, 99, 105348. [Google Scholar] [CrossRef]
  20. Thakur, G.; Mitra, A.; Pal, K.; Rousseau, D. Effect of flaxseed gum on reduction of blood glucose and cholesterol in type 2 diabetic patients. Int. J. Food Sci. Nutr. 2009, 60, 126–136. [Google Scholar] [CrossRef]
  21. Morshedzadeh, N.; Rahimlou, M.; Shahrokh, S.; Karimi, S.; Mirmiran, P.; Zali, M.R. The effects of flaxseed supplementation on metabolic syndrome parameters, insulin resistance and inflammation in ulcerative colitis patients: An open-labeled randomized controlled trial. Phytother. Res. 2021, 35, 3781–3791. [Google Scholar] [CrossRef]
  22. Kalgaonkar, S.; Almario, R.U.; Gurusinghe, D.; Garamendi, E.M.; Buchan, W.; Kim, K.; Karakas, S.E. Differential effects of walnuts vs almonds on improving metabolic and endocrine parameters in PCOS. Eur. J. Clin. Nutr. 2011, 65, 386–393. [Google Scholar] [CrossRef]
  23. Moszak, M.; Zawada, A.; Juchacz, A.; Grzymislawski, M.; Bogdanski, P. Comparison of the effect of rapeseed oil or amaranth seed oil supplementation on weight loss, body composition, and changes in the metabolic profile of obese patients following 3-week body mass reduction program: A randomized clinical trial. Lipids Health Dis. 2020, 19, 143. [Google Scholar] [CrossRef]
  24. Lee, T.C.; Ivester, P.; Hester, A.G.; Sergeant, S.; Case, L.D.; Morgan, T.; Kouba, E.O.; Chilton, F.H. The impact of polyunsaturated fatty acid-based dietary supplements on disease biomarkers in a metabolic syndrome/diabetes population. Lipids Health Dis. 2014, 13, 196. [Google Scholar] [CrossRef]
  25. Javidi, A.; Mozaffari-Khosravi, H.; Nadjarzadeh, A.; Dehghani, A.; Eftekhari, M.H. The effect of flaxseed powder on insulin resistance indices and blood pressure in prediabetic individuals: A randomized controlled clinical trial. J. Res. Med. Sci. 2016, 21, 70. [Google Scholar] [CrossRef]
  26. Au, M.M.C.; Goff, H.D.; Kisch, J.A.; Coulson, A.; Wright, A.J. Effects of Soy-Soluble Fiber and Flaxseed Gum on the Glycemic and Insulinemic Responses to Glucose Solutions and Dairy Products in Healthy Adult Males. J. Am. Coll. Nutr. 2013, 32, 98–110. [Google Scholar] [CrossRef]
  27. Cumpston, M.; Li, T.J.; Page, M.J.; Chandler, J.; Welch, V.A.; Higgins, J.P.T.; Thomas, J. Updated guidance for trusted systematic reviews: A new edition of the Cochrane Handbook for Systematic Reviews of Interventions. Cochrane Database Syst. Rev. 2019, 10, ED000142. [Google Scholar] [CrossRef]
  28. Akrami, A.; Nikaein, F.; Babajafari, S.; Faghih, S.; Yarmohammadi, H. Comparison of the effects of flaxseed oil and sunflower seed oil consumption on serum glucose, lipid profile, blood pressure, and lipid peroxidation in patients with metabolic syndrome. J. Clin. Lipidol. 2018, 12, 70–77. [Google Scholar] [CrossRef]
  29. Baxheinrich, A.; Stratmann, B.; Lee-Barkey, Y.H.; Tschoepe, D.; Wahrburg, U. Effects of a rapeseed oil-enriched hypoenergetic diet with a high content of α-linolenic acid on body weight and cardiovascular risk profile in patients with the metabolic syndrome. Br. J. Nutr. 2012, 108, 682–691. [Google Scholar] [CrossRef]
  30. Chen, C.G.; Wang, P.; Zhang, Z.Q.; Ye, Y.B.; Zhuo, S.Y.; Zhou, Q.; Chen, Y.M.; Su, Y.X.; Zhang, B. Effects of plant oils with different fatty acid composition on cardiovascular risk factors in moderately hypercholesteremic Chinese adults: A randomized, double-blinded, parallel-designed trial. Food Funct. 2020, 11, 7164–7174. [Google Scholar] [CrossRef]
  31. Damsgaard, C.T.; Frøkiær, H.; Andersen, A.D.; Lauritzen, L.J.J.o.N. Fish oil in combination with high or low intakes of linoleic acid lowers plasma triacylglycerols but does not affect other cardiovascular risk markers in healthy men. J. Nutr. 2008, 138, 1061–1066. [Google Scholar] [CrossRef]
  32. Finnegan, Y.E.; Minihane, A.M.; Leigh-Firbank, E.C.; Kew, K.; Meijer, G.W.; Muggli, R.; Calder, P.C.; Williams, C.M. Plant- and marine-derived n-3 polyunsaturated fatty acids have differential effects on fasting and postprandial blood lipid concentrations and on the susceptibility of LDL to oxidative modification in moderately hyperlipidemic subjects. Am. J. Clin. Nutr. 2003, 77, 783–795. [Google Scholar] [CrossRef]
  33. Griffin, M.D.; Sanders, T.A.; Davies, I.G.; Morgan, L.M.; Millward, D.J.; Lewis, F.; Slaughter, S.; Cooper, J.A.; Miller, G.J.; Griffin, B.A. Effects of altering the ratio of dietary n-6 to n-3 fatty acids on insulin sensitivity, lipoprotein size, and postprandial lipemia in men and postmenopausal women aged 45–70 y: The OPTILIP Study. Am. J. Clin. Nutr. 2006, 84, 1290–1298. [Google Scholar] [CrossRef]
  34. Kawakami, Y.; Yamanaka-Okumura, H.; Naniwa-Kuroki, Y.; Sakuma, M.; Taketani, Y.; Takeda, E. Flaxseed oil intake reduces serum small dense low-density lipoprotein concentrations in Japanese men: A randomized, double blind, crossover study. Nutr. J. 2015, 14, 39. [Google Scholar] [CrossRef]
  35. Kontogianni, M.D.; Vlassopoulos, A.; Gatzieva, A.; Farmaki, A.E.; Katsiougiannis, S.; Panagiotakos, D.B.; Kalogeropoulos, N.; Skopouli, F.N. Flaxseed oil does not affect inflammatory markers and lipid profile compared to olive oil, in young, healthy, normal weight adults. Metab. Clin. Exp. 2013, 62, 686–693. [Google Scholar] [CrossRef]
  36. Kratz, M.; von Eckardstein, A.; Fobker, M.; Buyken, A.; Posny, N.; Schulte, H.; Assmann, G.; Wahrburg, U. The impact of dietary fat composition on serum leptin concentrations in healthy nonobese men and women. J. Clin. Endocrinol. Metab. 2002, 87, 5008–5014. [Google Scholar] [CrossRef]
  37. Ma, Y.; Njike, V.Y.; Millet, J.; Dutta, S.; Doughty, K.; Treu, J.A.; Katz, D.L. Effects of walnut consumption on endothelial function in type 2 diabetic subjects: A randomized controlled crossover trial. Diabetes Care 2010, 33, 227–232. [Google Scholar] [CrossRef]
  38. McManus, R.M.; Jumpson, J.; Finegood, D.T.; Clandinin, M.T.; Ryan, E.A. A comparison of the effects of n-3 fatty acids from linseed oil and fish oil in well-controlled type II diabetes. Diabetes Care 1996, 19, 463–467. [Google Scholar] [CrossRef]
  39. Minihane, A.M.; Brady, L.M.; Lovegrove, S.S.; Lesauvage, S.V.; Williams, C.M.; Lovegrove, J.A. Lack of effect of dietary n-6: n-3 PUFA ratio on plasma lipids and markers of insulin responses in Indian Asians living in the UK. Eur. J. Nutr. 2005, 44, 26–32. [Google Scholar] [CrossRef]
  40. Nelson, T.L.; Stevens, J.R.; Hickey, M.S. Adiponectin levels are reduced, independent of polymorphisms in the adiponectin gene, after supplementation with alpha-linolenic acid among healthy adults. Metab. Clin. Exp. 2007, 56, 1209–1215. [Google Scholar] [CrossRef]
  41. Rezaei, S.; Reza Sasani, M.; Akhlaghi, M.; Kohanmoo, A. Flaxseed oil in the context of a weight loss programme ameliorates fatty liver grade in patients with non-alcoholic fatty liver disease: A randomised double-blind controlled trial. Br. J. Nutr. 2020, 123, 994–1002. [Google Scholar] [CrossRef]
  42. Schwab, U.S.; Lankinen, M.A.; de Mello, V.D.; Manninen, S.M.; Kurl, S.; Pulkki, K.J.; Laaksonen, D.E.; Erkkila, A.T. Camelina sativa oil, but not fatty fish or lean fish, improves serum lipid profile in subjects with impaired glucose metabolism—A randomized controlled trial. Mol. Nutr. Food Res. 2018, 62, 1700503. [Google Scholar] [CrossRef]
  43. Sodergren, E.; Gustafsson, I.B.; Basu, S.; Nourooz-Zadeh, J.; Nalsen, C.; Turpeinen, A.; Berglund, L.; Vessby, B. A diet containing rapeseed oil-based fats does not increase lipid peroxidation in humans when compared to a diet rich in saturated fatty acids. Eur. J. Clin. Nutr. 2001, 55, 922–931. [Google Scholar] [CrossRef]
  44. Vargas, M.L.; Almario, R.U.; Buchan, W.; Kim, K.; Karakas, S.E. Metabolic and endocrine effects of long-chain versus essential omega-3 polyunsaturated fatty acids in polycystic ovary syndrome. Metab. Clin. Exp. 2011, 60, 1711–1718. [Google Scholar] [CrossRef]
  45. Zhou, Q.; Zhang, Z.; Wang, P.; Zhang, B.; Chen, C.; Zhang, C.; Su, Y. EPA plus DHA, but not ALA, Improved Lipids and Inflammation Status in Hypercholesterolemic Adults: A Randomized, Double-Blind, Placebo-Controlled Trial. Mol. Nutr. Food Res. 2019, 63, 1801157, Correction in Mol. Nutr. Food Res. 2020, 64, e2070012. [Google Scholar] [CrossRef]
  46. Naghshi, S.; Aune, D.; Beyene, J.; Mobarak, S.; Asadi, M.; Sadeghi, O. Dietary intake and biomarkers of alpha linolenic acid and risk of all cause, cardiovascular, and cancer mortality: Systematic review and dose-response meta-analysis of cohort studies. BMJ Br. Med. J. 2021, 375, n2213. [Google Scholar] [CrossRef]
  47. Yue, H.; Qiu, B.; Jia, M.; Liu, W.; Guo, X.-f.; Li, N.; Xu, Z.-x.; Du, F.-l.; Xu, T.; Li, D. Effects of alpha-linolenic acid intake on blood lipid profiles:a systematic review and meta-analysis of randomized controlled trials. Crit. Rev. Food Sci. Nutr. 2020, 61, 2894–2910. [Google Scholar] [CrossRef]
  48. Chen, C.; Yang, Y.; Yu, X.; Hu, S.; Shao, S. Association between omega-3 fatty acids consumption and the risk of type 2 diabetes: A meta-analysis of cohort studies. J. Diabetes Investig. 2017, 8, 480–488. [Google Scholar] [CrossRef]
  49. Brown, T.J.; Brainard, J.; Song, F.; Wang, X.; Abdelhamid, A.; Hooper, L.; Ajabnoor, S.; Alabdulghafoor, F.; Brainard, J.; Brown, T.J.; et al. Omega-3, omega-6, and total dietary polyunsaturated fat for prevention and treatment of type 2 diabetes mellitus: Systematic review and meta-analysis of randomised controlled trials. BMJ Br. Med. J. 2019, 366, l4697. [Google Scholar] [CrossRef]
  50. Hu, M.Y.; Fang, Z.M.; Zhang, T.; Chen, Y. Polyunsaturated fatty acid intake and incidence of type 2 diabetes in adults: A dose response meta-analysis of cohort studies. Diabetol. Metab. Syndr. 2022, 14, 34. [Google Scholar] [CrossRef]
  51. Taylor, C.G.; Noto, A.D.; Stringer, D.M.; Froese, S.; Malcolmson, L. Dietary milled flaxseed and flaxseed oil improve N-3 fatty acid status and do not affect glycemic control in individuals with well-controlled type 2 diabetes. J. Am. Coll. Nutr. 2010, 29, 72–80. [Google Scholar] [CrossRef]
  52. Lemay, A.; Dodin, S.; Kadri, N.; Jacques, H.; Forest, J.C. Flaxseed dietary supplement versus hormone replacement therapy in hypercholesterolemic menopausal women. Obstet. Gynecol. 2002, 100, 495–504. [Google Scholar] [CrossRef]
  53. Jovanovski, E.; Li, D.D.; Ho, H.V.T.; Djedovic, V.; Marques, A.D.R.; Shishtar, E.; Mejia, S.B.; Sievenpiper, J.L.; de Souza, R.J.; Duvnjak, L.; et al. The effect of alpha-linolenic acid on glycemic control in individuals with type 2 diabetes A systematic review and meta-analysis of randomized controlled clinical trials. Medicine 2017, 96, e6531. [Google Scholar] [CrossRef]
  54. Zheng, J.S.; Li, K.; Huang, T.; Chen, Y.Q.; Xie, H.; Xu, D.F.; Sun, J.Q.; Li, D. Genetic Risk Score of Nine Type 2 Diabetes Risk Variants that Interact with Erythrocyte Phospholipid Alpha-Linolenic Acid for Type 2 Diabetes in Chinese Hans: A Case-Control Study. Nutrients 2017, 9, 376. [Google Scholar] [CrossRef]
  55. Cho, Y.S.; Go, M.J.; Han, H.R.; Cha, S.H.; Kim, H.T.; Min, H.; Shin, H.D.; Park, C.; Han, B.G.; Cho, N.H.; et al. Association of lipoprotein lipase (LPL) single nucleotide polymorphisms with type 2 diabetes mellitus. Exp. Mol. Med. 2008, 40, 523–532. [Google Scholar] [CrossRef]
  56. Li, N.; Yue, H.; Jia, M.; Liu, W.; Qiu, B.; Hou, H.; Huang, F.; Xu, T. Effect of low-ratio n-6/n-3 PUFA on blood glucose: A meta-analysis. Food Funct. 2019, 10, 4557–4565. [Google Scholar] [CrossRef]
  57. Rhee, Y.; Brunt, A. Flaxseed supplementation improved insulin resistance in obese glucose intolerant people: A randomized crossover design. Nutr. J. 2011, 10, 44. [Google Scholar] [CrossRef]
Figure 1. Screening flowchart of this study.
Ijms 24 14383 g001
Figure 2. The effect of low-ratio LA/ALA on FBS. Refs. [22,23,24,28,29,30,31,32,33,34,35,36,37,38,39,40,41,42,43,44,45].
Ijms 24 14383 g002
Figure 3. The effect of low-ratio LA/ALA on insulin. Refs. [22,23,24,29,30,31,32,34,36,37,38,39,40,41,42,43,44].
Ijms 24 14383 g003
Figure 4. The effect of low-ratio LA/ALA on HOMA-IR. Refs. [22,23,24,30,33,37,39,41,42,44].
Ijms 24 14383 g004
Figure 5. The effect of low-ratio LA/ALA on HbA1c. Refs. [22,24,34,36,37,38,44].
Ijms 24 14383 g005
Table 1. Characteristics of the included studies.
ReferenceCountryParticipant InformationAgeBMISmokingNo.M/FDurationDesignLow LA/ALAHigh LA/ALA
Akrami 2018 [28]IranMetabolic syndrome48.6NRNon-smoker5233/197 WP0.1419.1
Baxheinrich 2012 [29]NetherlandsMetabolic syndrome54.129.8Mixed16379/84104 WP4.729.1
Chen 2020 [30]ChinaDyslipidaemia54.523.2Mixed24392/15148 WP7.130, 20
Damsgaard 2008 [31]DenmarkHealthy2523.2Mixed3333/08 WP4.77.72
Finnegan 2003 [32]UKDyslipidaemia53.726.1Non-smoker6035/2524 WP3.615.5
54.526.2 5935/24 1.415.5
Griffin 2006 [33]UKHealthy5926.3Mixed9762/3524 WP4.6414
Kalgaonkar 2011 [22]USAPolycystic ovary syndrome33.535.2Non-smoker310/316 WP4.6222.06
Kawakami 2015 [34]JapanHealthy44.525.1Mixed1515/012 WCO1.349.8
Kontogianni 2013 [35]GreeceHealthy2621.9NR378/296 WCO1.48.3
Kratz 2002 [36]GermanyHealthy28.923.8Non-smoker3030/04 WP7.560
22.822.1 250/25 7.560
28.923.8 3030/0 2.5660
22.822.1 250/25 2.5660
Lee 2014 [24]USAType 2 diabetes58.634.5Non-smoker4318/258 WP0.9566
Ma 2010 [37]USAType 2 diabetes58.132.5Non-smoker2410/148 WP4.487.75
McManus 1996 [38]CanadaType 2 diabetes61.827.8NR118/312 WCO0.2514.45
Minihane 2005 [39]IndiaHealthy4826Non-smoker29NR6 WP916
Moszak 2020 [23]PolandOverweight or obese48.739.6Non-smoker5220/323 WP1.8841.5
Nelson 2007 [40]USAOverweight or obese subjects38.530.3Non-smoker5711/468 WP1.310.2
Rezaei 2020 [41]IranNon-alcoholic fatty liver43.229.9Mixed6833/3512 WP0.36 228.2
Schwab 2018 [42]FinlandType 2 diabetes58.929.2NR7940/3912 WP1.14.3
Sodergren 2001 [43]SwedenDyslipidaemia5024.5Mixed1913/64 WCO310
Vargas 2011 [44]USAPolycystic ovary syndrome29.234.1Non-smoker340/346 WP1.389
Zhou 2019 [45]ChinaDyslipidaemia52.726Mixed7539/3612 WP3.8, 2.0516.04
Abbreviations: BMI, body mass index; NR, not reported; No., number of included participants; M, male; F, female; W, weeks; P, parallel; CO, crossover; LA/ALA, linoleic acid/alpha-linolenic acid.
Table 2. Subgroup analysis of low-ratio LA/ALA on FBS, Insulin, HbA1c, and HOMA-IR.
FBS Insulin HbA1c HOMA-IR
SubgroupNWMD (95% CI)I2%NWMD (95% CI)I2%NWMD (95% CI)I2%NWMD (95% CI)I2%
Low-ratio LA/ALA
≤13−0.06 (−0.45, 0.33)21.92−0.17 (−0.99, 0.65)0.0
1–519−0.00 (−0.08, 0.07)0.0150.46 (−0.27, 1.18)13.37−0.03 (−0.11, 0.05)19.670.27 (−0.01, 0.54)0.0
≥550.01 (−0.11, 0.13)0.040.24 (−0.47, 0.94)0.020.02 (−0.15, 0.19)0.030.04 (−0.15, 0.23)0.0
Region
North America6−0.05 (−0.14, 0.02)0.061.31 (0.08, 2.54)32.05−0.01 (−0.08, 0.07)52.340.47 (0.10, 0.84)0.0
Europe13−0.01 (−0.09, 0.07)0.011−0.08 (−0.85, 0.69)0.04−0.01 (−0.13, 0.12)0.030.00 (−0.42, 0.42)25.8
Asia80.00 (−0.12, 0.12)0.050.12 (−0.46, 0.69)0.0 40.02 (−0.15, 0.19)0.0
Health status
Health90.05 (−0.04, 0.15)0.013−0.35 (−1.28, 0.57)8.65−0.01 (−0.12, 0.11)0.020.02 (−0.37, 0.41)35.6
Dyslipidaemia7−0.08 (−0.18, 0.03)7.4170.35 (−0.37, 1.06)0.0 20.07 (−0.12, 0.27)0.0
Type 2 diabetes4−0.04 (−0.26, 0.18)0.241.25 (−0.01, 2.60)45.330.07 (−0.02, 0.17)0.030.31 (−0.10, 0.71)55.4
Overweight or obese20.27 (−0.10, 0.64)0.02−0.25 (−4.36, 3.87)0.0
Metabolic syndrome3−0.18 (−0.52, 0.17)0.0 −0.06 (−0.89, 0.76)40.2
Polycystic ovary syndrome20.09 (−0.20, 0.38)0.041.49 (−1.01, 3.98)3.22−0.12 (−0.23, −0.00)0.020.42 (−0.26, 1.10)0.0
Age
≤45110.05 (−0.04, 0.14)0.0100.01 (−0.62, 0.63)0.06−0.06 (−0.14, 0.02)0.030.04 (−0.28, 0.36)0.0
>4515−0.05 (−0.14, 0.04)0.0110.4 (−0.17, 1.05)11.520.11 (−0.04, 0.26)13.270.10 (−0.06, 0.26)10.4
BMI
≤259−0.01 (−0.09, 0.07)0.080.31 (−0.35, 0.96)0.04−0.01 (−0.13, 0.12)0.020.07 (−0.12, 0.27)0.0
25–3080.03 (−0.12, 0.18)2.14−0.34 (−1.62, 0.95)41.130.02 (−0.07, 0.14)0.020.26 (−0.13, 0.65)0.0
≥3090.02 (−0.13, 0.16)0.010−0.23 (−0.41, 0.88)2.33−0.04 (−0.14, 0.06)72.370.03 (−0.22, 0.28)27.6
Smoking
Non-smoker140.01 (−0.10, 0.11)0.0130.19 (−0.52, 0.89)24.37−0.03 (−0.11, 0.05)21.950.22 (−0.14, 0.59)21.0
Mixed9−0.02 (−0.12, 0.08)0.060.21 (−0.35, 0.78)0.0 40.06 (−0.10, 0.22)0.0
NR40.05 (−0.11, 0.20)0.030.16 (−2.04, 2.37)49.920.04 (−0.08, 0.15)0.020.07 (−0.48, 0.63)67.1
Duration
<12 W150.01 (−0.07, 0.09)0.0130.38 (−0.37, 1.12)32.07−0.03 (−0.10, 0.05)9.460.26 (−0.06, 0.59)5.2
≥12 W12−0.02 (−0.12, 0.08)0.090.11 (−0.42, 0.64)0.020.04 (−0.08, 0.15)0.050.04 (−0.12, 0.20)0.0
Abbreviations: CI, confidential interval; N, number of included studies; LA/ALA, linoleic acid/alpha-linolenic acid; BMI, body mass index; NR, not reported; W, weeks.
Disclaimer/Publisher’s Note: The statements, opinions and data contained in all publications are solely those of the individual author(s) and contributor(s) and not of MDPI and/or the editor(s). MDPI and/or the editor(s) disclaim responsibility for any injury to people or property resulting from any ideas, methods, instructions or products referred to in the content.

