Article

Comparative Transcriptomic and Metabolomic Analyses of Differences in Trunk Spiral Grain in Pinus yunnanensis

1
Key Laboratory for Forest Genetics and Tree Improvement and Propagation in Universities of Yunnan Province, Southwest Forestry University, Kunming 650224, China
2
Key Laboratory for Forest Resources Conservation and Utilization in the Southwest Mountains of China, Ministry of Education, Southwest Forestry University, Kunming 650224, China
3
Key Laboratory of Biodiversity Conservation in Southwest China, State Forestry Administration, Southwest Forestry University, Kunming 650224, China
*
Authors to whom correspondence should be addressed.
These authors contributed equally to this work.
Int. J. Mol. Sci. 2023, 24(19), 14658; https://doi.org/10.3390/ijms241914658
Submission received: 13 August 2023 / Revised: 15 September 2023 / Accepted: 19 September 2023 / Published: 28 September 2023
(This article belongs to the Section Molecular Plant Sciences)

Abstract

:
Having a spiral grain is considered to be one of the most important wood properties influencing wood quality. Here, transcriptome profiles and metabolome data were analyzed in the straight grain and twist grain of Pinus yunnanensis. A total of 6644 differential expression genes were found between the straight type and the twist type. A total of 126 differentially accumulated metabolites were detected. There were 24 common differential pathways identified from the transcriptome and metabolome, and these pathways were mainly annotated in ABC transporters, arginine and proline metabolism, flavonoid biosynthesis, isoquinoline alkaloid biosynthesis, linoleic acid metabolism, phenylpropanoid, tryptophan metabolism, etc. A weighted gene coexpression network analysis showed that the lightblue4 module was significantly correlated with 2′-deoxyuridine and that transcription factors (basic leucine zipper (bZIP), homeodomain leucine zipper (HD-ZIP), basic helix–loop–helix (bHLH), p-coumarate 3-hydroxylase (C3H), and N-acetylcysteine (NAC)) play important roles in regulating 2′-deoxyuridine, which may be involved in the formation of spiral grains. Meanwhile, the signal transduction of hormones may be related to spiral grain, as previously reported. ARF7 and MKK4_5, as indoleacetic acid (IAA)- and ethylene (ET)-related receptors, may explain the contribution of plant hormones in spiral grain. This study provided useful information on spiral grain in P. yunnanensis by transcriptome and metabolome analyses and could lay the foundation for future molecular breeding.

1. Introduction

Spiral grain (as shown in Figure 1), a helical orientation around the axis of longitudinal tree trunks, is a common and negative wood property [1]. It occurs when tracheids deviate from the longitudinal axis of the trunk [2,3,4]. Spiral grain is mainly related to twisted types of wood, and spiral grain directly leads to twisting or warping, which reduces the strength of wood and limits wood products [5,6,7,8,9,10,11,12]. Trees with spiral grain have been reported in many pine species, including Larix kaempferi [13], Pinus taeda [14], Pinus contorta [15], Pinus radiata [16,17,18], Picea abies [3], Picea sitchensis [3], Abies balsamea [19,20], and Pinus sylvestris [20,21]. Most studies have suggested that spirality is highly heritable and that some environmental factors, such as wind [22], soil nutrient status [9], rainfall, slope, exposure [23,24], and altitude [25], have been proposed as possible causes of spiral grain.
The fibers in trees are normally thought of as directed along the axis of the tree. In reality, the fibers tend to be inclined in the tangential direction, thus forming a helix and spiral grain around the trunk axis [26]. This is a possible mechanism available for trees to improve environmental adaptation. The study showed that planting on sites exposed to strong prevailing winds [4] at wider spacing or undertaking heavy thinning can significantly increase the spiral grain angle and degree of twist. Furthermore, the plant hormone ethylene may function in the spiral grain growth of trees, although these suggestions have not been conclusively validated [20,27]. These studies were focused on environmental control, and few revealed the mechanisms based on molecular regulation.
Secondary metabolites are a class of compounds produced by organisms during growth and development and are closely related to their physiological functions and adaptations to the environment [28,29,30]. There is a close relationship between secondary metabolites and phenotype, and the type and content of secondary metabolites can directly affect the phenotypic characteristics of organisms [31]. For example, the secondary metabolites of some plants have biological activities such as antibacterial and antipest activities, which can protect plants from the external environment, thus affecting the growth and morphological characteristics of plants [31,32]. In addition, secondary metabolites can also affect the external manifestations of organisms, such as color [33], taste [34], and aroma [35], which, in turn, affect the reproduction [31] and adaptability [30] of organisms. The production and regulation of secondary metabolites are closely related to the phenotypic plasticity of organisms [36]. In the process of adapting to environmental changes, organisms produce different types of secondary metabolites in response to different stresses and challenges [30]; for instance, there are significant changes in the levels of antioxidant enzymes (such as superoxide dismutase (SOD), catalase (CAT), ascorbate peroxidase (APX), and guaiacol peroxidase (GPX)) in Pisum sativum seeds under salicylic acid and ultraviolet-B stresses [37]. The levels of phenolic pigments, carotenoids, and antioxidant enzymes differ in Solanum lycopersicum seeds following UV-B radiation and benzoic acid (BA) treatment, and all of the metabolites affect plant growth [38]. Some plants produce more antioxidants in response to oxidative damage when they are subjected to external environmental stresses, thereby altering their growth and morphological characteristics [30,39], such as P. sativum [37] and S. lycopersicum [40]. By modulating the production and regulation of secondary metabolites, organisms can adapt to environmental changes and alter their phenotypic characteristics, thereby enhancing their ability to survive and reproduce [41]. Thus, it is necessary to understand the metabolome of plant phenotypes.
Pinus yunnanensis is an important coniferous species in Southwest China and plays a critical role for the economy, society, and environment of Yunnan Province [42]. In nature forests, a number of P. yunnanensis trees are obviously characterized by spiral grain and withstand the negative impacts on timber performance and value. The characteristics of and differences in the transcriptome and metabolome between the straight- and twisted-trunk types of P. yunnanensis have not been investigated. In this study, integrated transcriptomic and metabolomic techniques were used to analyze and compare the differences in different spiral types of P. yunnanensis. This study aimed to determine the following: (1) that differential genes, metabolites, and pathways may be involved in different spiral types of P. yunnanensis; and (2) that metabolite characteristics are involved in the two trunk types of P. yunnanensis. The results of the present study add information on the molecular differential level in two different trunk types of P. yunnanensis and could lay the foundation for studies targeting the formation of spiral grain and further improving the wood quality of P. yunnanensis.

2. Results

2.1. De Novo Assembly

A total of 20 sample cDNA libraries generated an average of 46,789,947 raw reads (40,426,26~50,110,974) and 45,370,079 clean reads (39,685,518~48,414,246). With Q20 > 97.56% and Q30 > 93.91%, more than 7000 unigenes per sample were assembled, and the mean value of the unigenes was 826.55 bp for length, ranging from 787~858 bp and 1680.5 for N50 and ranging from 1637~1724. These indicated high-quality RNA-seq data.

2.2. Functional Annotation

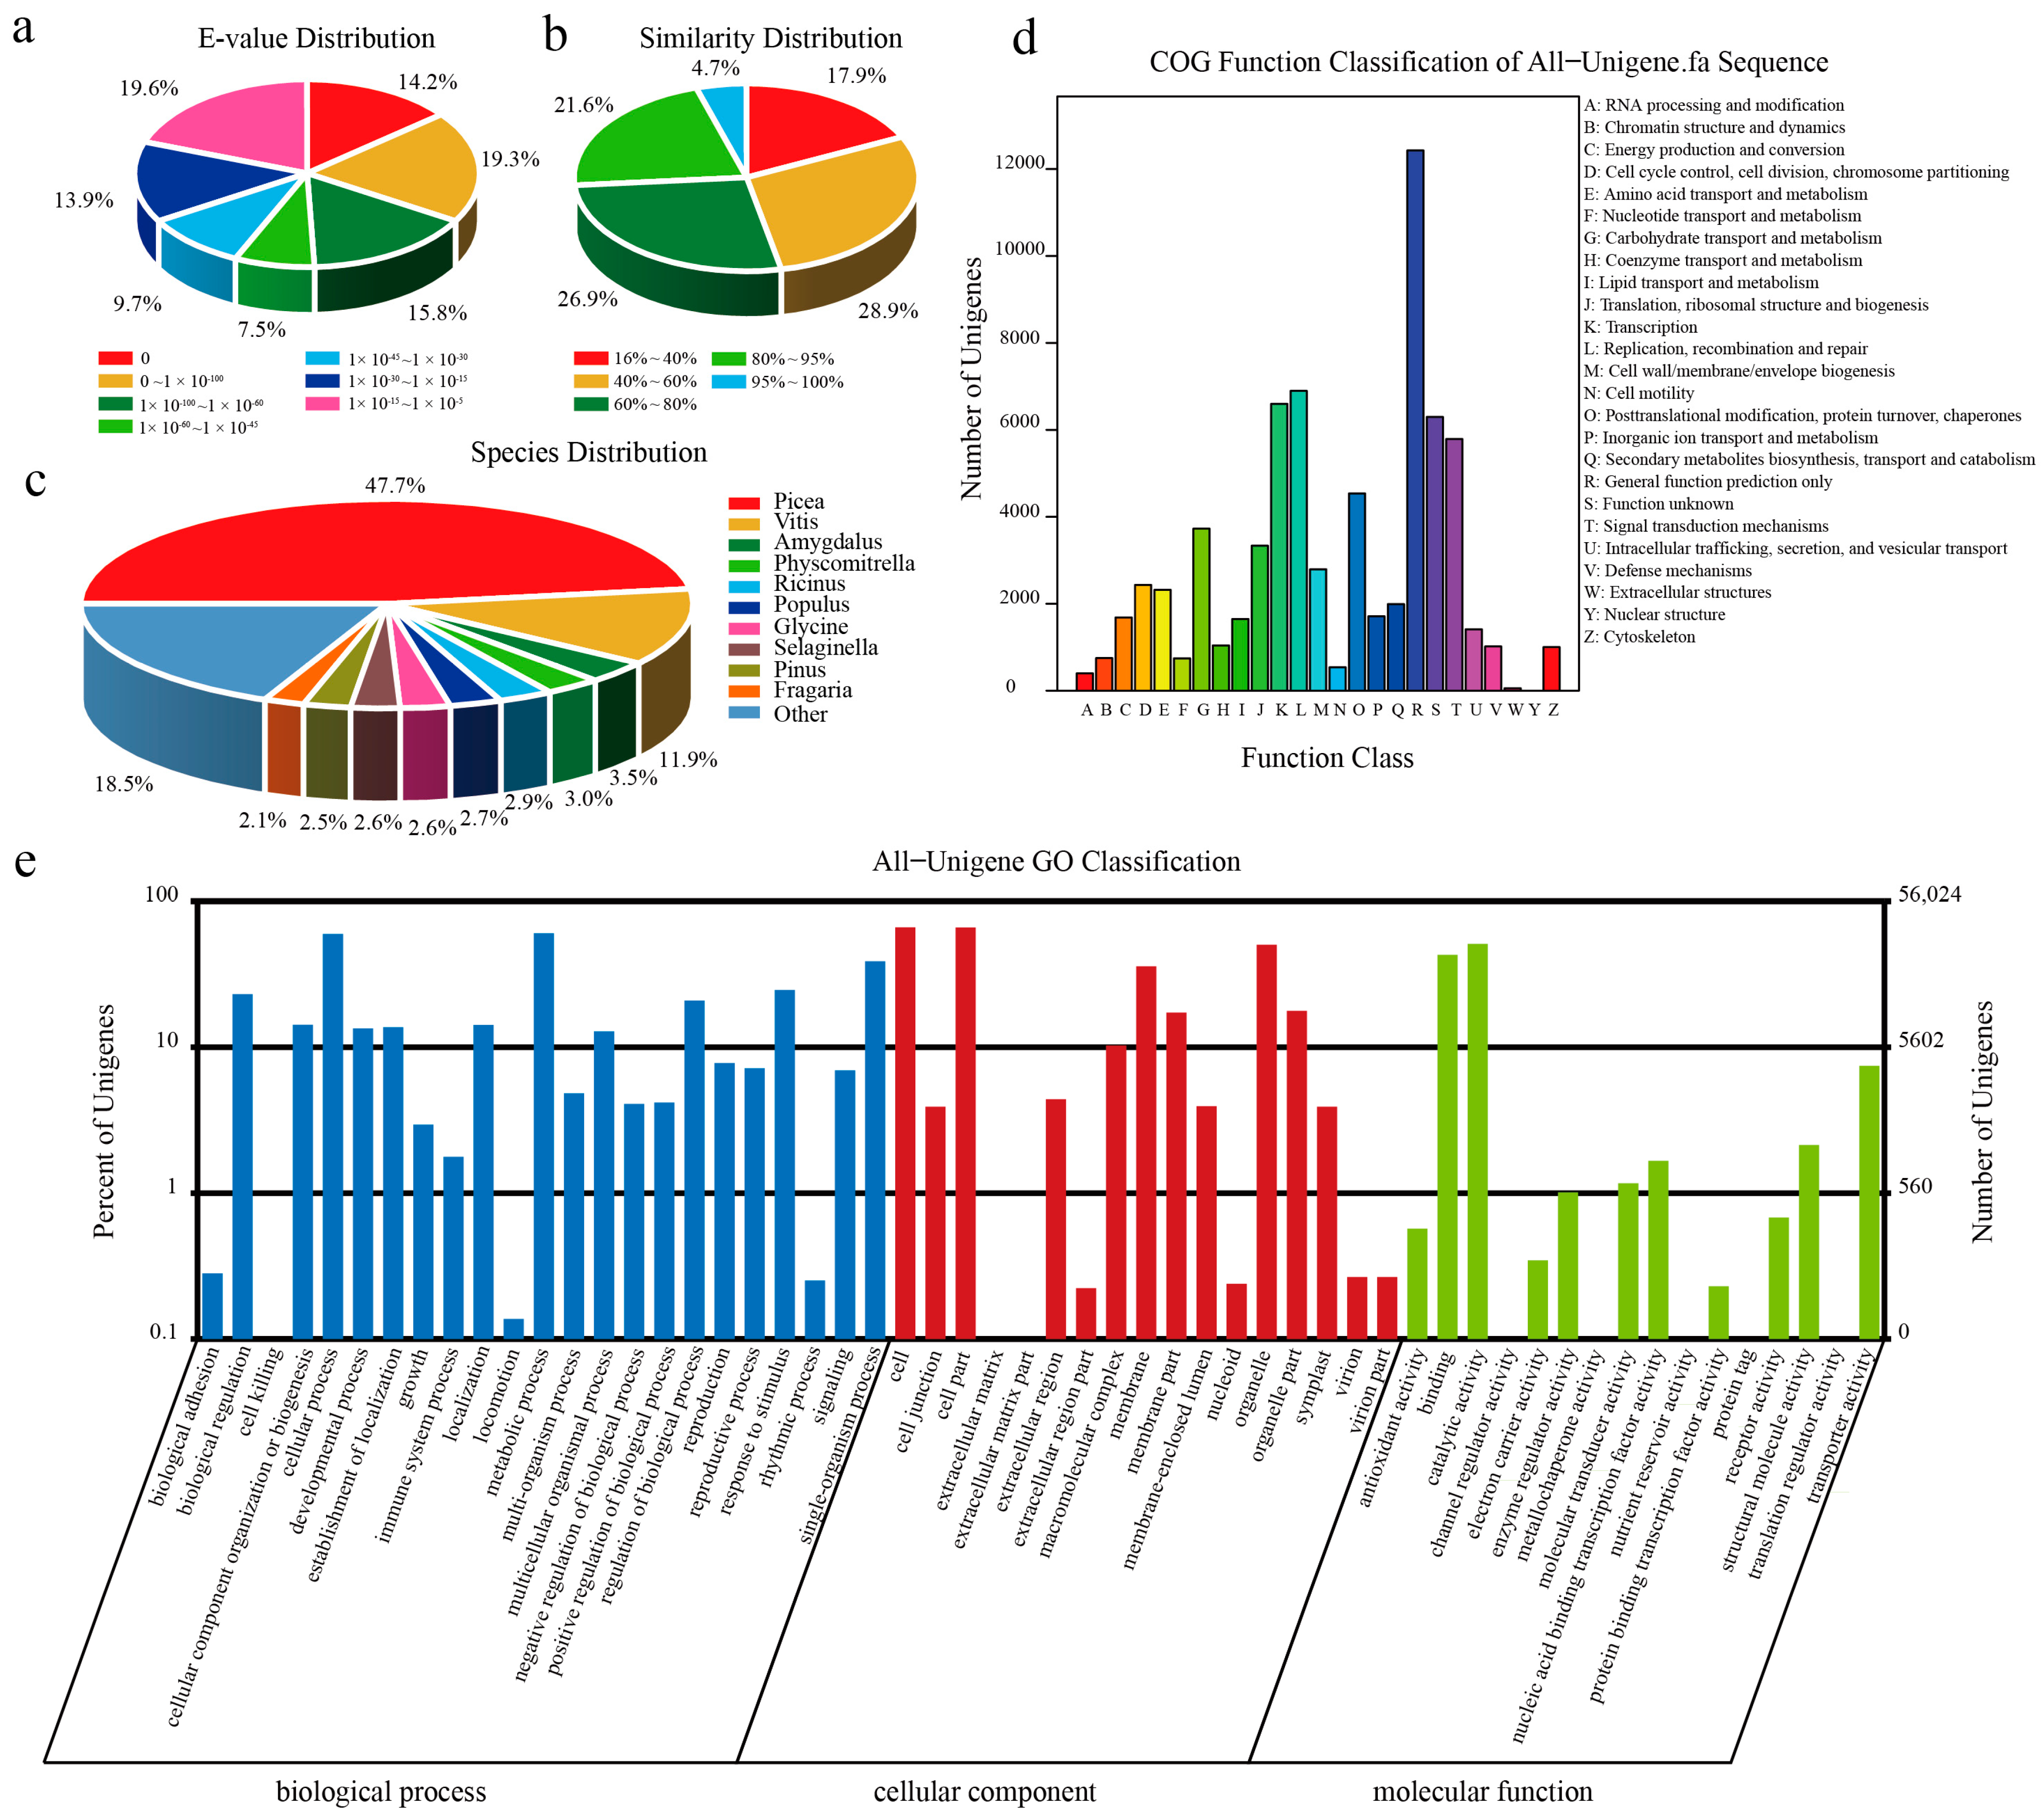
Of 143,249 unigenes, 105,904 unigenes were annotated by at least one database, showing a 73.93% annotation rate (Table S1). The abundance of unigenes was annotated by the non-redundant protein sequence (NR) (63.04%) and non-redundant nucleotide sequence (NT) (68.29%) databases. Over 70% of unigenes could be annotated with sequences from the top 7 hit species, of which 43,074 unigenes (47.7%) were assigned to Picea sitchensis. The E-value frequency distribution of hits (E-value ≤ 1.0 × 10−60) showed that 35.1% of the sequences shared strong homologies; the majority of matched sequences (64.9%) had E-values in the range of 1.0 × 10−60~1.0 × 10⁻⁵. The similarity values of most of the BLASTX hits (82.1%) were over 40% (Figure 2a–c).
The unigene sequences were searched against the Swiss-Prot protein databases using BLASTX. There were 62,994 unigenes annotated, of which 66.3% had E-values between 1.0 × 10−50 and 1.0 × 10⁻⁵, and 23.7% had strong homologies with E-values of ≤1.0 × 10−50.
In total, 56,932 unigenes were mapped to 127 Kyoto Encyclopedia of Genes and Genome (KEGG) pathways by the BLASTX server. Plant–pathogen interactions had the largest number of unigenes (12,059; 21.18%; ko01100), followed by plant hormone signal transduction (2918; 5.13%; ko04075), pyrimidine metabolism (2527; 4.44%; ko00240), purine metabolism (2449; 4.3%; ko00230), spliceosome (2136; 3.75%; ko03040), and RNA transport (2093; 3.68%; ko03013).
Clusters of orthologous groups of proteins (COGs) are an attempt to phylogenetically classify the complete complement of proteins (both predicted and characterized) encoded by complete genomes. Within the P. yunnanensis unigene set, 36,930 were categorized into 25 functional COG clusters (Figure 2d). The five largest categories, in order, are general function prediction, replication, recombination and repair, transcription, unknown function, and signal transduction mechanisms.
On the basis of the NR annotation, Blast2GO [43] was used to obtain a Gene Ontology (GO) annotation. Over 5000 unigenes were classified into the following three gene ontology categories: cellular component, biological process, and molecular function (Figure 2e). A large portion of unigenes consisted of the biological process category, in which most unigenes were assigned to the following five terms: cellular process, metabolic process, single-organism process, biological regulation, and response to stimulus. The terms in the cellular component category, including cell, cell part, organelle, and membrane part, presented large proportions. In the molecular function category, binding and catalytic activity were the top two terms annotated by most unigenes.

2.3. Differential Expression Gene Detection and Screening

Differences in gene expression between the straight and twisted trunk types were examined, and differentially expressed genes (DEGs) were identified by comparing the following unigene group pair expression changes: straight and twisted trunk types (S vs. T), secondary xylem and phloem (X vs. P), secondary xylem in straight and twisted trunk types (XS vs. XT), and phloem in straight and twisted trunk types (PS vs. PT). As shown in Figure 3a, a total of 6644 genes were significantly differentially expressed in the S vs. T pair, of which 3065 were up-regulated and 3579 were down-regulated. This indicated that a number of unigenes function in the straight trunk type. A total of 2115 unigenes were annotated by the KEGG database in the pair S vs. T. Moreover, there were obvious differences between X and P, and the DEG numbers were 13,418 (5797 up-regulated and 7620 down-regulated). Interestingly, 2066 DEGs (1026 up-regulated and 1040 down-regulated) and 1438 DEGs (555 up-regulated and 883 down-regulated) were found in the pair XS vs. XT and the pair PS vs. PT, respectively (Table S2). The above results indicate that the number of down-regulated genes was greater in the twist trunk type than in the straight trunk type, regardless of the phloem or xylem of P. yunnanensis. This means that during the growth and development process, the expression of certain genes in the twist trunk type may be inhibited compared to that in the straight trunk type in P. yunnanensis. In addition, 783 and 581 were annotated by the KEGG database in XS vs. XT and PS vs. PT pairs, respectively. A radar diagram comparing the database annotation of DEGs in focus pairs was established (Figure 3b), and a large number of unigenes were assigned KEGG and GO databases in the pairs S vs. T, XS vs. XT, and PS vs. PT.
The results of an enrichment analysis showed that the plant–pathogen interaction was the most enriched pathway for the most differentially expressed genes in the three pairs. The pathways with significant differences were tyrosine metabolism and amino sugar and nucleotide sugar metabolism in the XS vs. XT pair. Glutathione metabolism, phenylpropanoid biosynthesis, and zeatin biosynthesis were the pathways of significant enrichment in the PS vs. PT pair, and plant hormone signal transduction was the second most abundant pathway for gene enrichment in the PS vs. PT pair. Above all, plant–pathogen interactions were attributed to the occurrence and development of spiral grains in P. yunnanensis, and spiral grains can be affected by glutathione metabolism, phenylpropanoid biosynthesis, zeatin biosynthesis, plant hormone signal transduction, and other pathways (Figure 4).

2.4. Metabolite Characteristics of P. yunnanensis

This study only used phloem as the sample because phloem plays a more important role in plant growth and development than xylem. Metabolites were detected using an UHPLC-QTOF-MS analysis [44], and a total of 2447 metabolites were detected in P. yunnanensis. An orthogonal partial least-squares discrimination analysis (OPLS-DA) demonstrated a clear separation between the PT group and PS group (Figure S1). A total of 126 differentially accumulated metabolites (DAMs) were detected. Among them, 60 were from the positive mode and 69 were from the negative mode. Ent-epicatechin (4alpha->8) catechin, quercetin 3-(2″-p-hydroxybenzoyl-4″-p-coumarylrhamnoside, glycyl-aspartate, 1-heptadecanoyl-sn-glycero-3-phosphocholine, and PC (16:0/0:0) were the top five down-regulated DAMs in the positive mode, and 6-methyladenine, glucosaminic acid, gluconolactone, sodium gluconate, and 5-methylcytidine were the top five DAMs in the negative mode (Figure 5). Moreover, three metabolites (l-saccharopine, 5-methylcytidine, and 13-OxoODE) were common between the positive mode and the negative mode. Most of the metabolites accumulated more in the positive mode in the PS group, except for 3 metabolites (tremetone, 10-hydroxycamtothecin, and 4-acetamidobutanoate), and 44 metabolites accumulated more in the negative mode in the PT group, e.g., geldanamycin, novobiocin, and matairesinol (Figure S2). The DAMs were further annotated with class-specific terms from seven categories (Figure S3a) via a search on the human metabolome database (HMDB), including carboxylic acids and derivatives, fatty acyls, benzene and substituted derivatives, pyrimidine nucleosides, organooxygen compounds and indoles, and derivatives. These were assigned to five classes, including the following eight terms in the Lipid Map database: steroids (epitestosterone), isporenoids (ginkgolide C), linear tetracyclines (oxytetracycline), macrolides and lactone polyketides (zearalenone), flavonoids (procyanidin B2, quercetin 3-(2″-p-hydroxybenzoyl-4″-p-coumarylrhamnoside), epicatechin 3-O-beta-D-allopyranoside, 6′-Hydroxy-4,2′,3′,4′-tetramethoxychalcone, calomelanol A, and butein), glycerophosphocholines (1-heptadecanoyl-sn-glycero-3-phosphocholine), fatty acyls and conjugates (8,11-Octadecadiynoic acid and sebacic acid), and octadecanoids (13-HOTE and 13-OxoODE) (Figure S3b). By annotating with the KEGG database, 31 metabolites were assigned to 71 metabolic pathways, including carbon metabolism, tryptophan metabolism, caffeine metabolism, fructose and mannose metabolism, glycine, and serine and threonine metabolism (Table S3).

2.5. Gene Coexpression Network Construction

Twenty-four differential pathways were common in the transcriptome and metabolome, which were mainly annotated as ABC transporters, arginine and proline metabolism, flavonoid biosynthesis, isoquinoline alkaloid biosynthesis, linoleic acid metabolism, phenylpropanoid, tryptophan metabolism, etc. However, there was no clear pathway constructed for gene expression and other metabolite abundance in the spiral grain group. To further explore the important factors involved in spiral grain formation, the correlations of 24 pathways, 23 metabolites, and 72 unigenes (Figure S4) were analyzed (Table S4). A total of 16 metabolites were highly correlated with unigenes, which were selected as the candidate traits for further analysis.
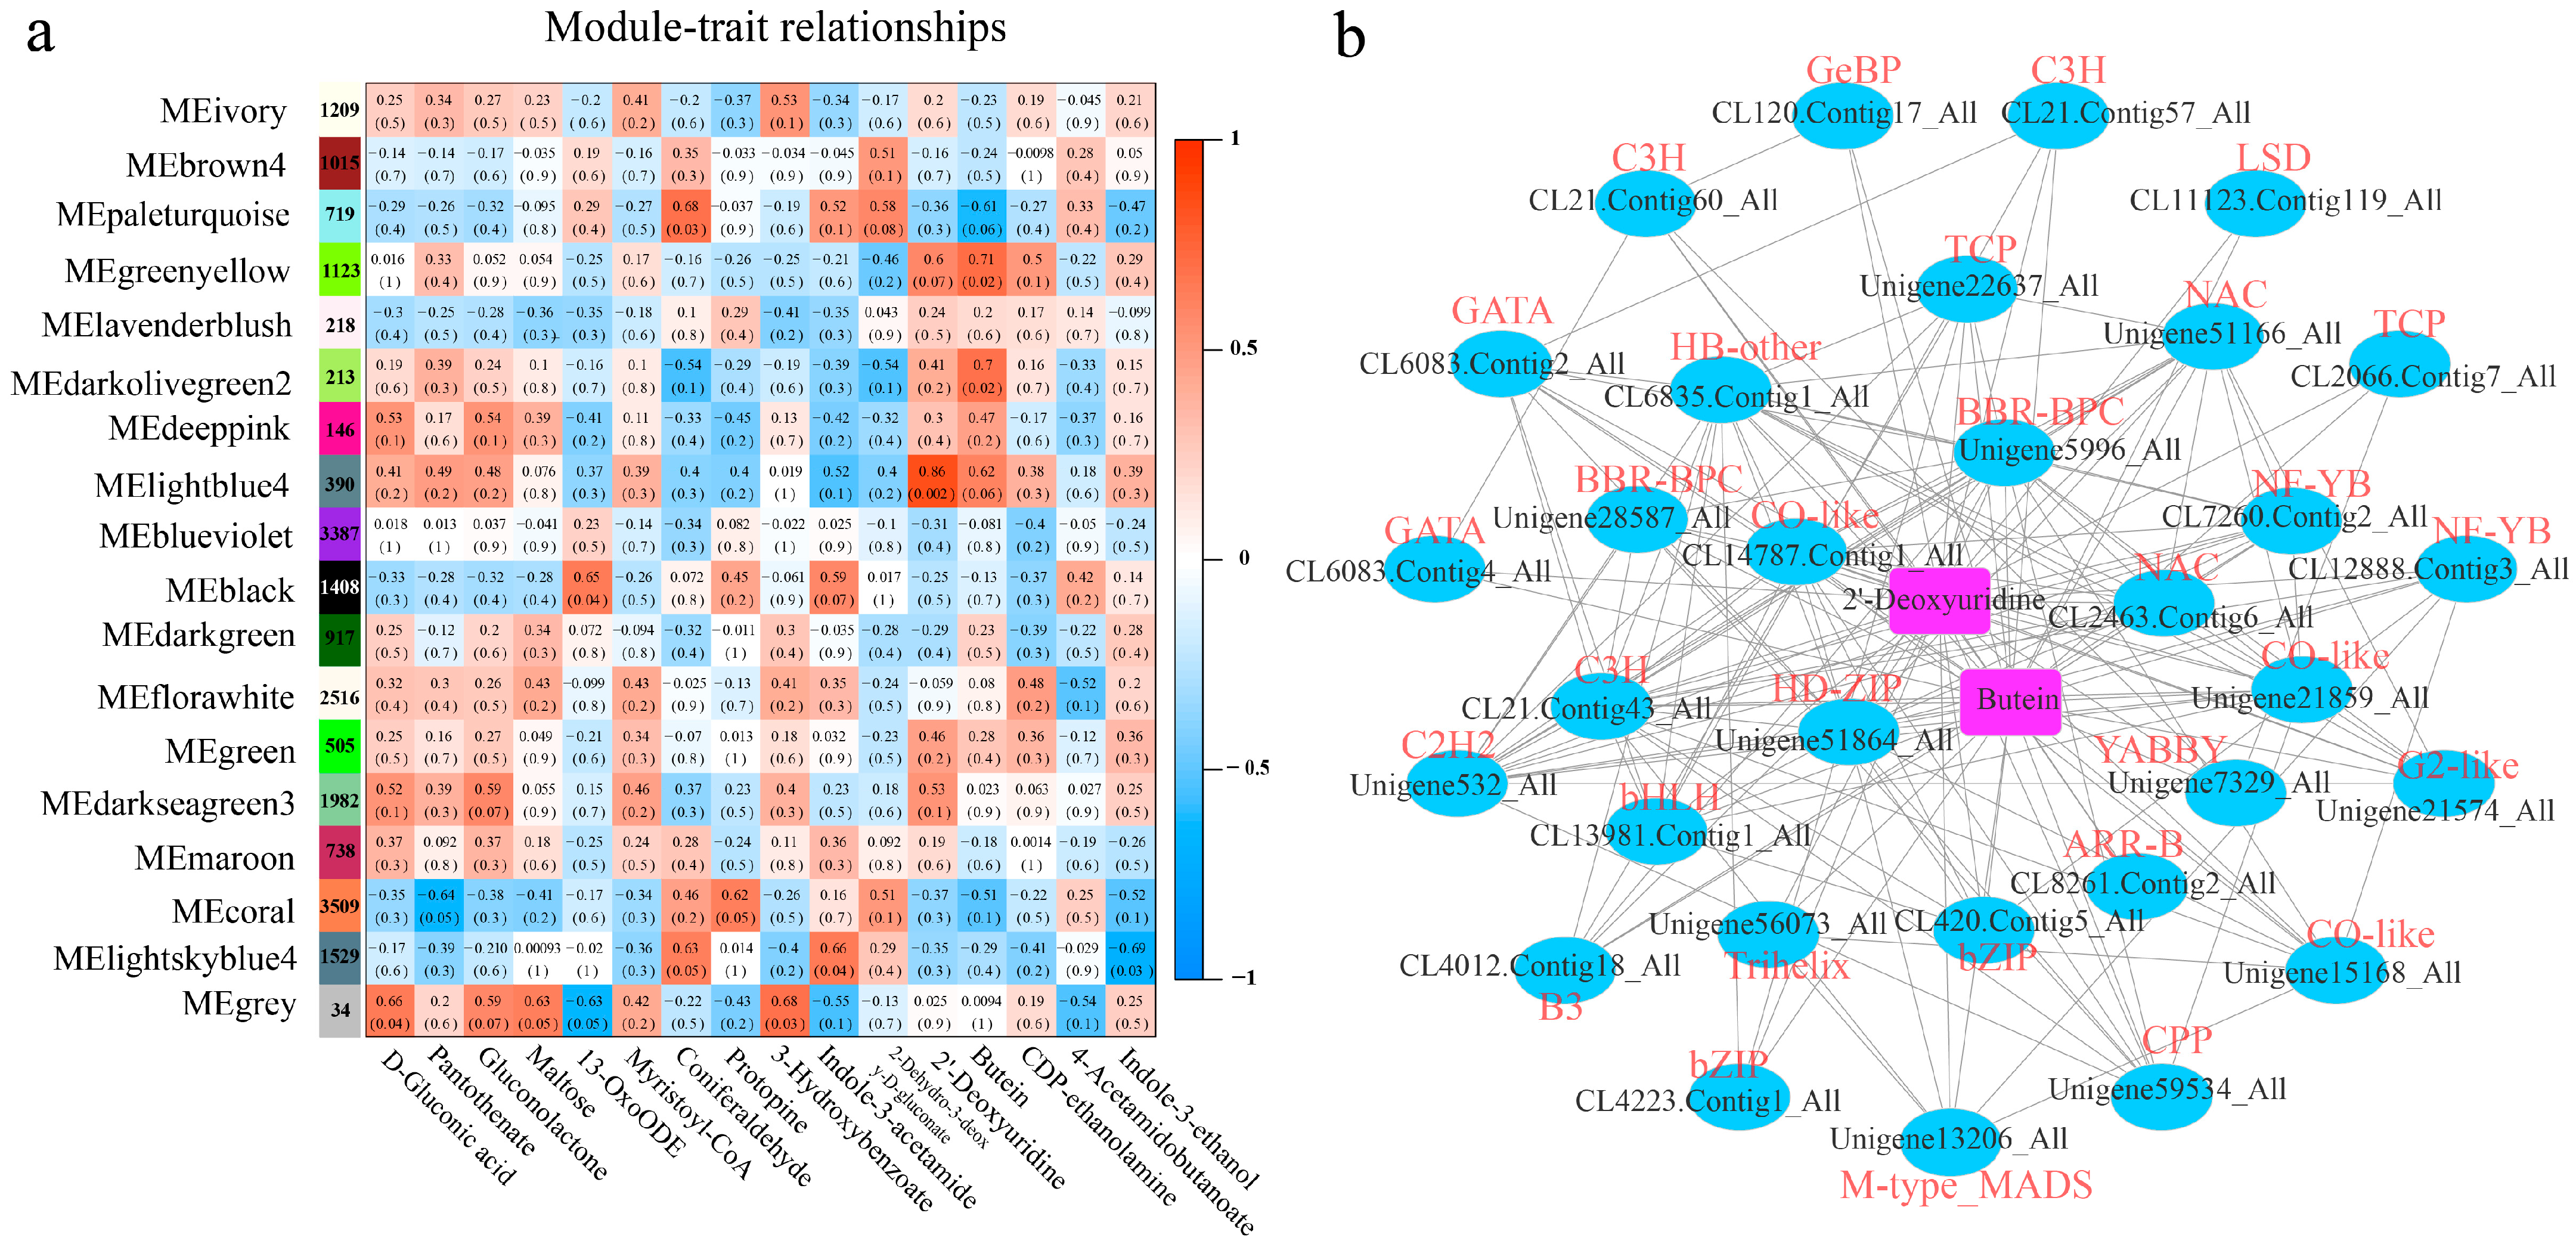
Coexpression networks were analyzed using 21,558 annotation unigenes. These unigenes were clustered into 18 modules labeled with different colors, and each module contained unigenes with similar expression patterns (Figure 6a). Among the 18 modules, lightblue4 was the only one that was highly correlated with the traits (r > 0.8; p < 0.05). The lightblue4 module contains 390 unigenes, which include 21 TFs (bZIP, HD-ZIP, bHLH, C3H, NAC, etc.). A heatmap of module–trait relationships showed that the lightblue4 module highlighted the metabolites that differed significantly between the straight and twisted trunks of P. yunnanensis. For example, the abundance of 2′-deoxyuridine was higher in the PS group. A GO analysis of the lightblue4 module showed that its unigenes were significantly enriched in glucose transport, monosaccharide transmembrane transport, and hexose transmembrane transport in the biological process category and significantly enriched in active transmembrane transporter activity, symporter activity, and sugar proton symporter activity in the molecular function category (Figure S5a). A KEGG enrichment analysis revealed that glutathione metabolism, starch and sucrose metabolism, and cyanoamino acid metabolism were most strongly enriched in the lightblue4 module genes (Figure S5b). A cytoscape interaction network showed the interaction of TFs and two metabolites (2′-deoxyuridine and butein) (Figure 6b), which indicated that the TFs may be closely related to the spiral grain of P. yunnanensis.

2.6. RT-qPCR Verification

Based on a DEG analysis and the coexpression network, a total of ten unigenes were used to validate the transcriptome results, which included genes related to plant hormone signal transduction (CL3988.Contig2_All (MKK4_5), CL7342.Contig1_All (BAK1), Unigene31619_All (ARF7), CL2039.Contig1_All (WRKY33), CL12088.Contig3_All (COI1), CL1065.Contig7_All (CRE1), and CL5455.Contig3_All (PIF3)), transporters (Unigene43064_All (ABCG2) and Unigene28800_All (ABCC2)), and microtubule-related proteins CL4761.Contig5_All (KIF11). The RT-qPCR analyses showed trends in expression that were consistent with those found by RNA-seq (Figure S6), suggesting that the transcriptome results were reliable.

3. Discussion

The cell wall, a major structural determinant of plants, can regulate the extent and symmetry of plant cell growth and is a complex matrix of polysaccharides and proteins. The polysaccharides comprise cellulose, hemicellulose, and pectin [45]. Cellulose synthase (CesA), organized in the plasma membrane, can synthesize cellulose [46]. Once CesA combines with 18 glucose chains, cellulase microfibrils are formed [47]. The direction of cell expansion depends on the angle of the cellulose microfibrils, with maximal cell expansion typically perpendicular to the net orientation of the cellulose microfibrils [48]. The patterns of cellulose microfibrils are disturbed by microtubules [49]. SPIRAL1, a microtubule-based modulator, is one of the first proteins identified that determines the twisted growth of plants [50,51]. In addition, SPIRAL1, ark2 [52], csi1/pom2 [53], eb1 (a,b,c) [54], mor1 [55], spr1/sku6 [56], and tor1/spr2 [57], which encode microtubule-associated proteins, have been proven to play a role in the helical growth of A. thaliana. In this study, two differential microtubule-associated proteins (AURKX and KIF11) were also found in straight- and twisted-trunk P. yunnanensis. Therefore, we speculated that these two proteins may also be one of the factors affecting the formation of twisted-trunk P. yunnanensis. Of course, their functions need further analysis. In addition, previous research has also found that cell-wall-related genes (e.g., rhm1, cob, and sku5) play a role in spiral grain [58,59,60]. It has been demonstrated that helical twist is related to cell expansion and that the helical pattern of cell expansion is associated with altered cell wall composition [58]. The cell wall composition could be directly or indirectly regulated by plant hormones. For example, gibberellinin directly induces XET expression in rice leaf sheaths [61]. The walls of GA3-treated Hong Mang Mai seedlings showed increased extensibility, which resulted in changes in wall glucan content, autolysis, and glucanase activity [62].
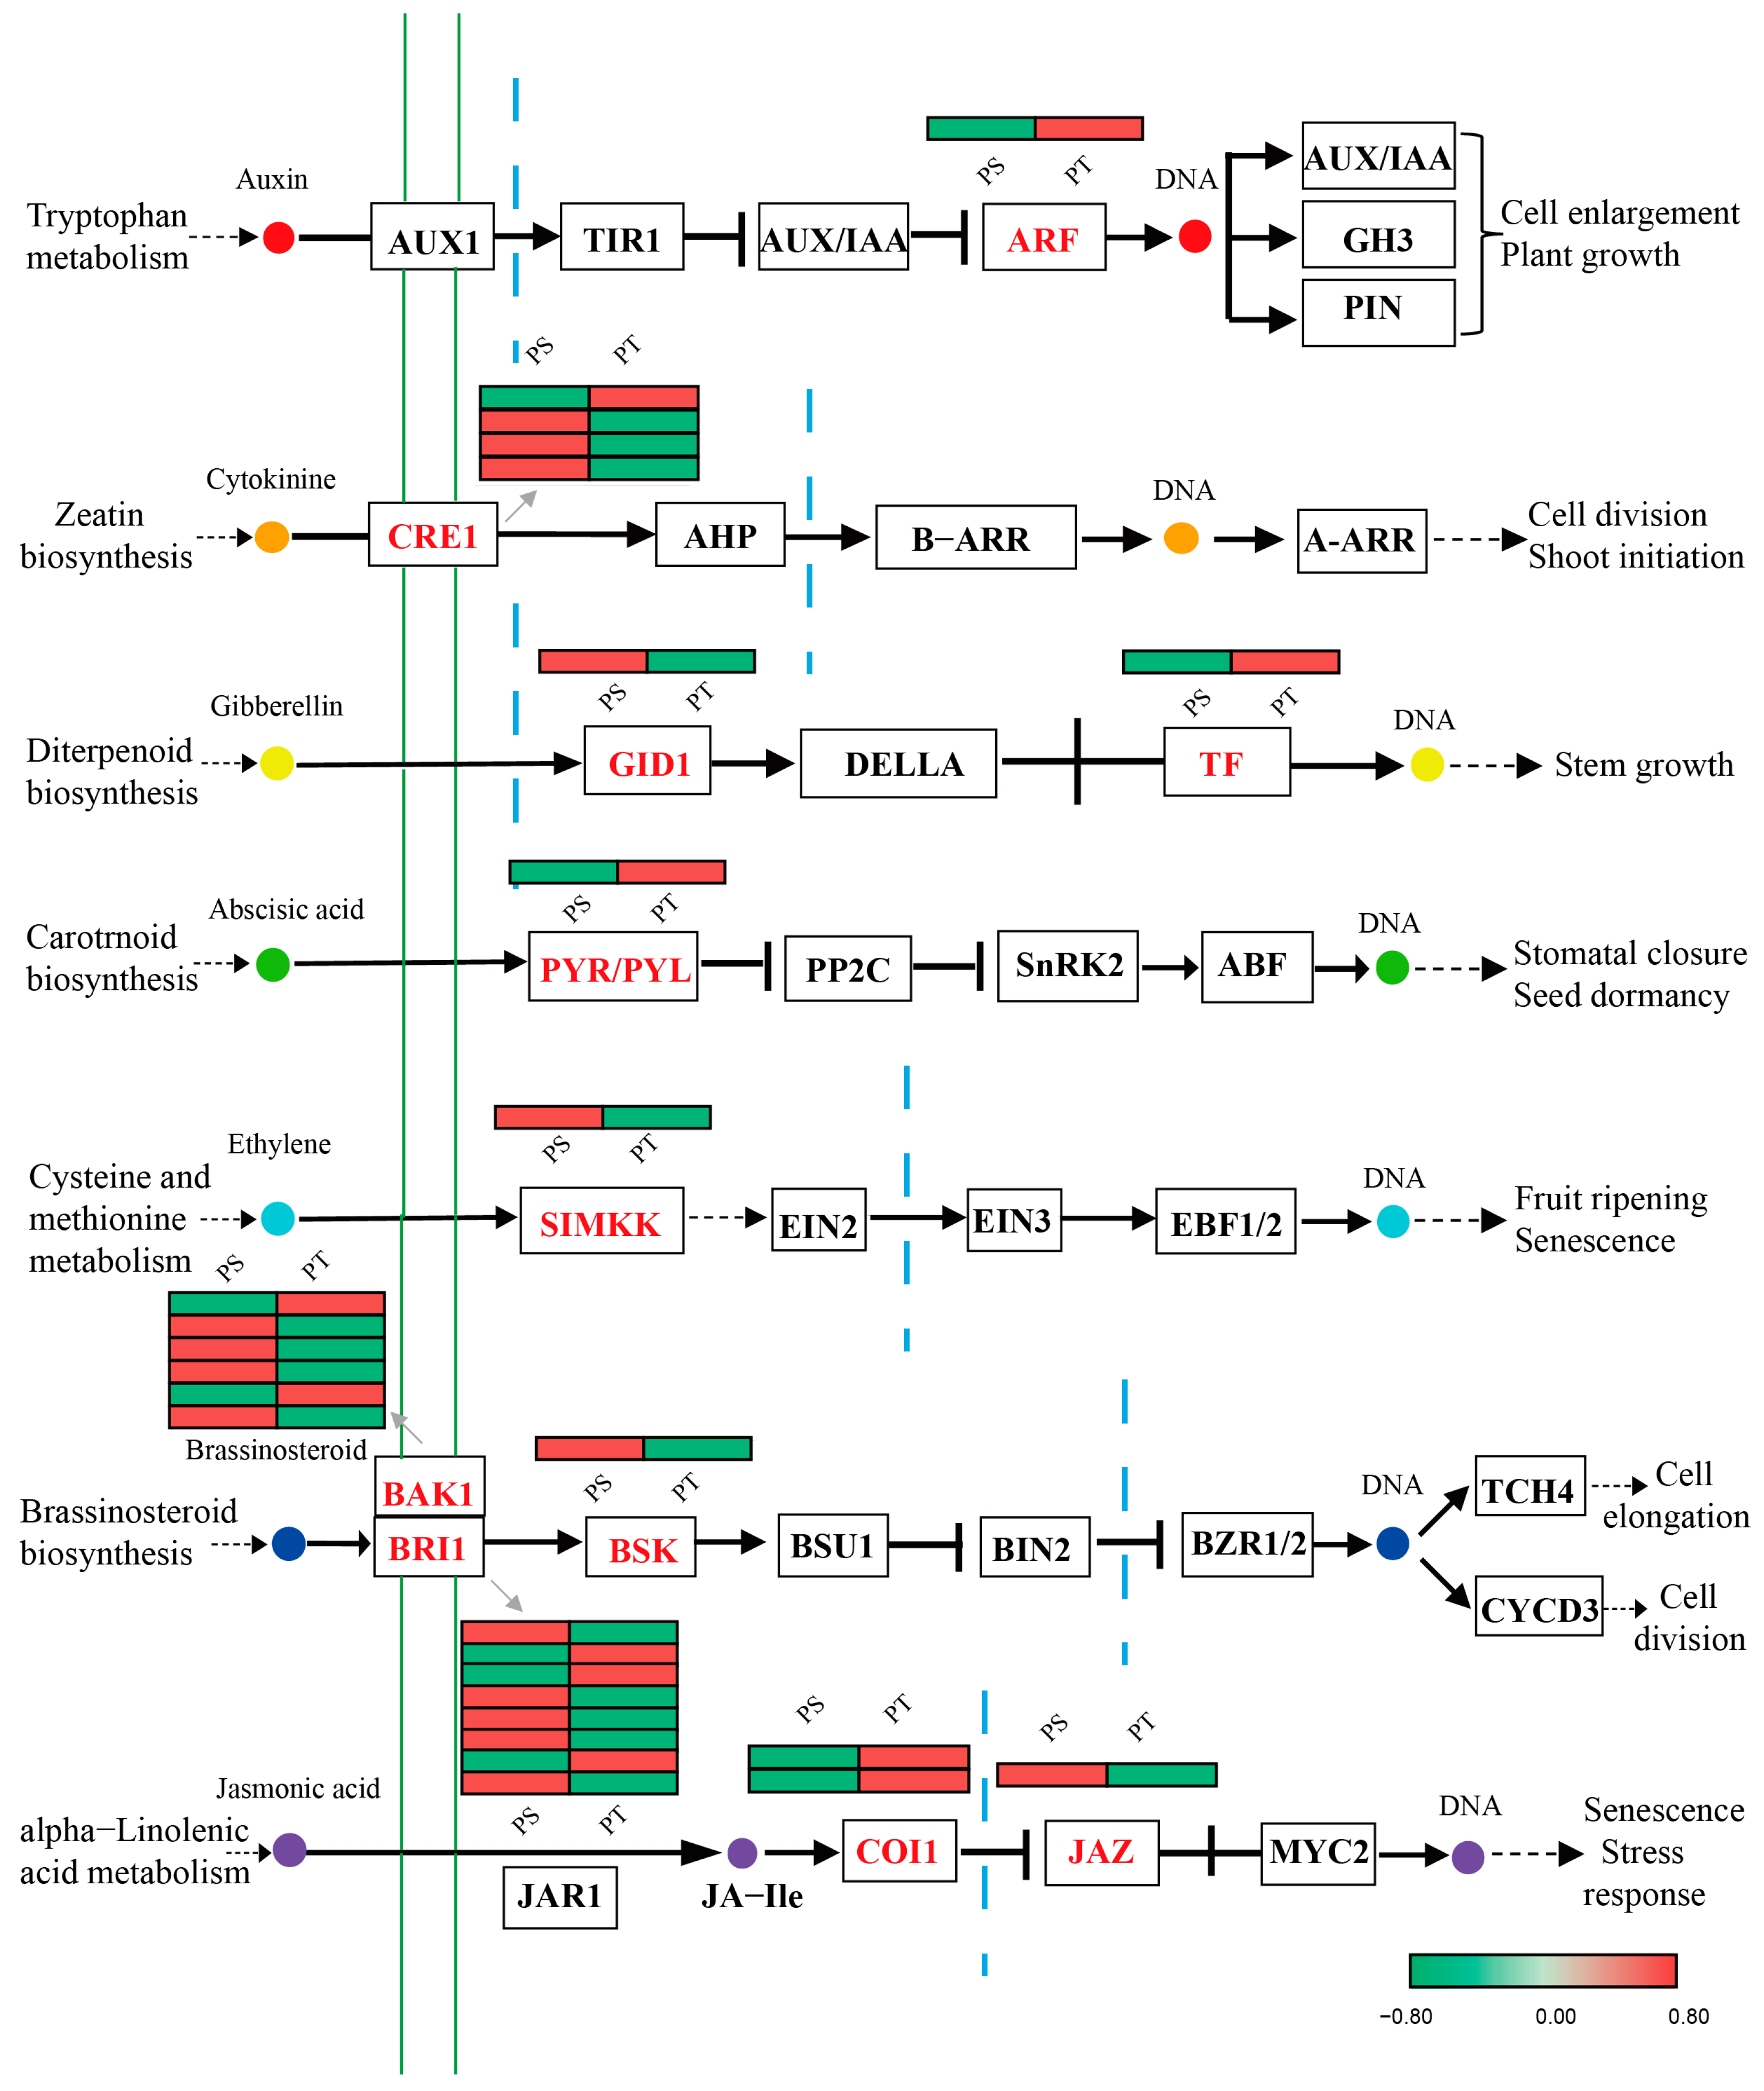
The plant hormone ethylene plays a key role in the rate of cambial division, tracheid cell wall biochemistry, and tracheid morphology and may function in the formation of spiral grains. In an earlier study, an increased number of early wood tracheids in trunk sections was correlated with a more left-handed spiral grain angle, and increased ethylene (ET) regulates the extent of the spiral grain angle [20]. Indole-3-acetic acid (IAA) has been shown to participate in the regulation of spiral grain formation [27]. These findings indicate that these two plant hormones are involved in the quantitative regulation of wood formation [20,63]. In this study, 27 DEGs were associated with plant hormone signal transduction. They encode the following 11 compounds from 7 hormone signaling pathways (Figure 7): ARF (auxin response factor) in auxin (IAA) signaling; CRE1 (cytokinin receptor) in cytokinin (CTK) signaling; GID1 (gibberellin receptor GID1) and TF (phytochrome-interacting factor 4, PIF4) in gibberellin (GA) signaling; PYR/PYL (abscisic acid receptor PYR/PYL family, PYL) in abscisic acid (ABA) signaling; SIMKK (mitogen-activated protein kinase 4/5, MKK4/5) in ethylene (ET) signaling; BAK1 (BRI1-associated receptor kinase 1), BRI1 (brassinosteroid-insensitive 1), and BSK (BR signaling kinase) in brassinosteroid (BR) signaling; and COI1 (coronatine-insensitive 1) and JAZ (jasmonate ZIM domain-containing protein) in jasmonic acid (JA) signaling. Surprisingly, few DAMs were detected in plant hormone signal transduction, which may be transported to be utilized in others. These results, to some extent, indicated that plant hormones may contribute to the formation of spiral grains in P. yunnanensis.
Environmental factors largely contribute to the developmental growth of plants. Many studies have focused on the relationship between spiral grain and abiotic factors and hypothesized that the formation of spiral grain is induced by multiple external stresses. In addition, no clear molecular explanation is obtained for the spiral grain occurrences. A large number of DEGs (416 unigenes, mainly coding 14 proteins) between the straight type and twist type of P. yunnanensis were mapped to the plant–pathogen interaction pathway, including CPK (calcium-dependent protein kinase), CML (calcium-binding protein CML), FLS2 (LRR receptor-like serine/threonine protein kinase FLS2), RPM1 (disease resistance protein RPM1), and WRKY33 (WRKY transcription factor 33). Meanwhile, some DAMs for terpenoid compounds (ginkgolide C and nomilin), microbial metabolism in diverse environments (d-lactic acid, (S)-2-hydroxyglutarate, paraxanthine, 4-methylcatechol, and glucosaminic acid), antimicrobials (oxytetracycline, sulfamethopyrazine, nafcillin, and norfloxacin), and natural toxins (zearalenone) were found. All of these metabolites are involved in the defense of plants against both biotic and abiotic responses [64]. The nucleoside derivative 2′-deoxyuridine plays a vital role in DNA replication and repair processes within living organisms. Its significance lies in its ability to act as a substrate for DNA synthesis enzymes, contributing to the maintenance of genetic stability [65]. In addition, the study found that the rhizosphere microbial community between the straight and twisted trunk types of P. yunnanensis was different [66]. In summary, the differences in microbes may affect the growth of P. yunnanensis based on plant–microbe interactions. Unlike mammals, plants have no mobile defender cells and a somatic adaptive immune system [67]. Instead, they rely on two distinct types of immune receptors: pattern-triggered immunity (PTI), which is based on the recognition of molecules common to many classes of microbes, and effector-triggered immunity (ETI), which is based on the response to pathogen virulence factors on host targets [68,69,70]. PTI is initiated by pathogen-associated molecular patterns (MAMPs/PAMPs) with pattern recognition receptors (PRRs), including FLS2, which forms a receptor-like kinase complex with BAK1 and recognizes a conserved 22-amino-acid fragment (flg22) of bacterial flagellin [70,71]. Furthermore, ETI is induced through the recognition of pathogen effectors by plant disease resistance (R) proteins, including RPM1 and RPS2. In this study, these proteins were encoded by most DEGs and were identified as important hubs for changes in the plant–pathogen interaction pathway. Consequently, the alteration of hub protein activities in twisted-trunk P. yunnanensis has a large influence on plant immunity, which is highly related to the spiral grain growth of trees.

4. Materials and Methods

4.1. Plant Materials

Based on similar diameters and tree heights, five natural P. yunnanensis trees with straight trunks and twisted trunks (spiral angle > 30°) were chosen, respectively. All trees were selected in the nature forest on Mount Fangshan (E 101°46′24″, N 26°7′08″), Yongren County, Chuxiong Yi Autonomous Prefecture, Yunnan Province, China. The group of P. yunnanensis samples was mainly defined as follows: twisted xylem was XT, straight xylem was XS, twisted phloem was PT, and straight phloem was PS. For each group, we collected samples from five trees, which yielded five biological replicates for RNA-seq analyses. In addition, we also artificially divided the plants into four other groups, namely, the twisted group (T, XT+XP), straight group (S, PT+PS), xylem group (M, XT+XS), and phloem group (P, PT+PS) for a follow-up analysis and PT and PS for a metabolome analysis.

4.2. RNA Isolation and cDNA Library Construction

Total RNA from 20 samples was isolated using the RNAprep pure plant kit (Tiangen Biotech, Beijing, China). The RNA concentration was determined using a spectrophotometer at A260/280 (NanoDrop 1000; Thermo Scientific, Wilmington, DE, USA), and the integrity was assessed with an Agilent 2100 system (Agilent Technologies, Santa Clara, CA, USA). The qualified RNA samples were used for complementary DNA (cDNA) library construction. Each library produced approximately 6 gigabases (Gb) of raw data on the Hiseq-PE150 platform. The transcriptome data in this study were submitted to the NCBI short-read archive (SRA) database under accession number PRJNA507489.

4.3. RNA-Seq Analysis

The readings were assembled using Trinity [72]. In brief, first, a k-mer (k = 25) dictionary was constructed from all sequence reads, and Inchworm was used to assemble the read dataset and generate linear contigs. Then, the Chrysalis clusters related the contigs that comprise alternatively spliced transcripts or other paralogous genes. Finally, Butterfly analyzed the paths of consecutive plausible sequences and generated longer transcript sequences. The result of Trinity’s assembly is shown as unigenes. The final unigenes were obtained by clustering the homologous transcript sequences using Tgicl version 2.1 [73]. All unigenes assembled and spliced from the 20 final unigenes were submitted to BLASTX [74] alignment (E-value of less than 10−5) in NT, NR, Swiss-Prot, COG, GO, KEGG, PlantTFdb (plant transcription factor database), PRGdb (plant resistance gene database), InterPro, and STRINGdb (a search tool for the retrieval of interacting genes/proteins database), respectively. These databases were used to estimate unigene functions.
DEGs between pairs of sample groups were detected using the DEGseq2 package [75] based on read count. The parameters for DEG detection were as follows: (1) p value ≤ 0.05 and (2) |log2FC| ≥ 1. The DEGs were further classified into the following two patterns: up-regulation and down-regulation. TBtools [76] was used to search the enriched GO terms and KEGG pathways, and the visualization was carried out with the ggplot2 package [77].

4.4. Metabolome Sample Preparation and Analyses

The phloem sample (50 mg) was extracted with 1000 μL of extract (the volume proportion of methanol, acetonitrile, and water was 2:2:1) and 2 μL of 2-chlorol-L-phenylalalnine (2 mg/L) (as an internal quantitative standard). All samples were vortexed and mixed for 30 s, then ground into a fine powder using a grinding mill at 45 Hz for 10 min, and ultrasonicated for 10 min in an ice bath. After resting at −20 °C for 1 h, the samples were centrifuged at 12,000 rpm and 4 °C for 15 min, and 500 μL of supernatant was transferred to EP tubes, and the dried extracts were concentrated under vacuum. Next, 160 mL of the acetonitrile and water extract (the volume proportion was 1:1) was added to the dried extract and redissolved, vortexed for 30 s, ultrasonicated for 10 min in an ice bath again, and centrifuged at 12,000 rpm and at 4 °C for 15 min again. Finally, 120 mL of supernatant was transferred to a vial for UHPLC-QTOF-MS analysis. Metabolites were detected using the UHPLC-QTOF-MS analysis platform (Waters Acquity I-Class PLUS UHPLC and Waters Xevo G2-Xs QTof HRMS) at Biomarker Technologies Corporation (Beijing, China). Chromatographic analysis was performed on an Acquity UPLC HSS T3 column (Waters; 100 mm × 2.1 mm, 1.8 μm). The mobile phases comprised A (water containing 0.1% formic acid) and B (0.1% formic acid in acetonitrile). The gradient elution program was as follows: 2% B at 0~0.25 min, 2~98% B at 0.25~10.0 min, 98% B at 10.0~13.0 min, 2~98% B at 13.0~13.1 min, and 2% B at 13.1~15.0 min. The injection volume was 1 μL and eluted at a flow rate of 0.4 mL/min. The acquisition rate was set at 5 spectra/s. Metabolites were acquired under 2.0 kV (positive ion mode) and 1.5 kV (negative ion mode) capillary voltages. The parameters of MS data acquisition were set as follows: a cone voltage of 30 V, an ion source temperature of 150 °C, a desolvent gas temperature of 500 °C, and a backflush gas flow rate and desolventizing gas flow of 50 L/h and 800 L/h, respectively. OPLS-DA was carried out to compare the differences in the spiral grain group using the ropls packages of R (3.3.2 version). The parameters VIP (variable importance in the projection) > 1 and p < 0.05 were the basis for DAM identification. Annotation of metabolites was performed using databases including the HMDB, KEGG, and Lipid Maps databases.

4.5. Coexpression Network Construction

A coexpression network analysis (WGCNA) [78] of approximately 22,000 genes was performed using the R package based on the unigenes with annotation. The common pathways with DEGs and DAMs in PS vs. PT were screened, and a correlation analysis was performed between DEGs and DAMs. The abundance of DAMs was used as the phenotypic traits file. Modules highly correlated with important metabolites were identified. The expression network of unigenes in the highlighted module was performed for visualization using Cytoscape 3.6.1 [79].

4.6. Quantitative Real-Time Polymerase Chain Reaction

To validate the results of the expression profiling obtained by RNA-seq, RT-qPCR (real-time quantitative PCR) was performed to compare ten DEGs between two different trunk types (Table S5). The total RNA isolation RNAprep pure plant kit (Tiangen Biotech, Beijing, China, DP441) was employed to extract RNA from different trunk types and tissues of P. yunnanensis. The RNA was checked using a Nanodrop (NanoDrop 1000; Thermo Scientific, Wilmington, DE, USA) and an Agilent 2100 Bioanalyzer (Agilent Technologies), and the qualified RNA was used as a template for cDNA synthesis. Reverse transcription was performed using the FastQuant RT kit (Tiangen Biotech, Beijing, China). Chemical fluorescence dry (ChamQ SYBY qPCR Master Mix; Nanjing, China) was used to check the expression of hub genes or DEGs on a real-time PCR instrument (Rotor-Gene Q; Qiagen, Germany). The reference gene AT2G24020 from Pinus pinaster [80] was used to quantify the relative mRNA levels. The primer pairs were designed using Primer Premier 5 [81] and synthesized by Sangon Biotech Co., Ltd. (Shanghai, China). A three-step amplification was carried out as follows: 95 °C for 2 min; 45 cycles at 95 °C for 10 s, 56 °C for 30 s, and 72 °C for 60 s. The 2−∆∆Ct method [82] was used to calculate the relative expression level. This RT-qPCR was performed using five biological replicates.

5. Conclusions

Many naturally occurring P. yunnanensis trees are characterized by spiral grain, which limits their importance in forestry production, afforestation, and environmental conservation. Previous studies hypothesized that the formation and growth of spiral grains in P. yunnanensis were induced by some abiotic and biotic factors. However, the regulatory mechanisms of metabolites and genes, as well as their correlation, are unclear. Integrative transcriptome and metabolome techniques were used to investigate how spiral grains formed in P. yunnanensis. A transcriptome analysis identified that ARF7 and MKK4_5, the IAA- and ET-related receptors, may explain the contribution of plant hormones in spiral grain. Differences in transporters (ABCG2 and ABCC2) were found in this study, which indicated that the difference in spiral grain may be affected by nutrient or water availability. Resistance proteins (RPM1 and RPS2) were also significantly different in the straight and twisted trunk types. A gene enrichment analysis revealed an important role of the plant–pathogen interaction pathway in the growth of spiral grains. Based on the metabolome, terpenoid compounds (ginkgolide C and nomilin) were differentially abundant in the two different trunk types of P. yunnanensis. Additionally, a correlation analysis identified that transcription factors such as bZIP, HD-ZIP, bHLH, C3H, and NAC were strongly associated with 2′-deoxyuridine and butein, of which 2′-deoxyuridine indirectly participates in the synthesis of terpenoids. The above results indicated that plant hormones, plant immunity, and terpenoid compounds exert strong effects on the formation and growth of spiral grains in P. yunnanensis. In summary, the excavation of transcriptomic and metabolomic resources, as well as the establishment of plant metabolic regulation models, can facilitate the exploration of the mechanism of spiral grain formation in P. yunnanensis.
Above all, the present study concludes that plant cell walls, hormones (IAA and ET), and secondary metabolites (terpenes and nucleoside derivatives) are of interest in the further study of spiral grain in trees.

Supplementary Materials

The following supporting information can be downloaded at https://www.mdpi.com/article/10.3390/ijms241914658/s1.

Author Contributions

C.H. and D.Z. conceived and designed the experiment. S.M., H.L. and D.Z. analyzed the data. P.G., P.L. and X.Z. performed the experiments. P.G. and P.L. wrote the manuscript. D.Z. and C.H. reviewed and edited the manuscript. All authors have read and agreed to the published version of the manuscript.

Funding

This study was funded by the Applied Basic Research Programs of Yunnan Provincial Expert Workstation (202005AF150020) and the Yunnan Provincial “Ten-Thousand Program” for Leading Industry Innovation (YUWR-CYJS-2020-018).

Data Availability Statement

The transcriptome data in this study are available from the NCBI SRA database under accession number PRJNA507489.

Acknowledgments

We thank Laigeng Li for help with suggestions for the experiment and Wuyuan Yin, Dezhou Shen, and Yiran Luo for help with sample collections.

Conflicts of Interest

The authors declare no conflict of interest.

Abbreviations

ABC transportersATP-binding cassette transporters
ABCC2ATP-binding cassette subfamily C member 2
ABCG2ATP-binding cassette G2
ARF7auxin response factor 7
BAK1BRI1-associated receptor kinase 1
bHLHbasic helix–loop–helix
bZIPbasic leucine zipper
C3Hp-coumarate 3-hydroxylase
COI1coronatine insensitive 1
CRE1cytokinin response 1
HD-ZIPhomeodomain leucine zipper
KIF11kinesin family member 11
NACN-acetylcysteine
PIF3phytocheome-interacting factor 3
RPM1resistance to pseudomonas maculicola 1
RPS2ribosomal protein S2
13-HOTE13-hydroxyoctadecatrienoic acid
13-OxoODE13-oxooctadecadienoic acid

References

  1. Mendis, M.S.; Halwatura, R.U.; Somadeva, D.R.K.; Jayasinghe, R.; Gunawardana, M. Influence of timber grain distribution on orientation of saw cuts during application: Reference to heritage structures in Sri Lanka. Case Stud. Constr. Mater. 2019, 11, e00237. [Google Scholar] [CrossRef]
  2. Harris, J.M. Spiral Grain and Wave Phenomena in Wood Formation; Springer: Berlin/Heidelberg, Germany, 1989; 214p. [Google Scholar]
  3. Hansen, J.K.; Roulund, H. Spiral grain in a clonal trial with Sitka spruce. Can. J. For. Res. 1998, 28, 911–919. [Google Scholar] [CrossRef]
  4. Fonweban, J.N.; Mavrou, I.; Gardiner, B.; Macdonald, E. Modelling the effect of spacing and site exposure on spiral grain angle on Sitka spruce (Picea sitchensis (Bong.) Carr.) in Northern Britain. Forestry 2013, 86, 331–342. [Google Scholar] [CrossRef]
  5. Stevens, W.C.; Johnston, D.D. Distortion caused by spiralled grain. Timber Technol. 1960, 68, 217–218. [Google Scholar]
  6. Forsberg, D.; Warensjö, M. Grain Angle Variation: A major determinant of twist in sawn Picea abies (L.) Karst. Scand. J. For. Res. 2001, 16, 269–277. [Google Scholar] [CrossRef]
  7. Hannrup, B.; Grabner, M.; Karlsson, B.; Müller, U.; Rosner, S.; Wilhelmsson, L.; Wimmer, R. Genetic parameters for spiral-grain angle in two 19-year-old clonal Norway spruce trials. Ann. For. Sci. 2002, 59, 551–556. [Google Scholar] [CrossRef]
  8. Maclaren, P. Internal wood quality of radiata pine on farm sites—A review of the issues. N. Z. J. For. 2002, 47, 24–28. [Google Scholar]
  9. Danborg, F. Spiral grain in plantation trees of Picea abies. Can. J. For. Res. 1994, 24, 1662–1671. [Google Scholar] [CrossRef]
  10. Danborg, F. Drying properties and visual grading of juvenile wood from fast grown Picea abies and Picea sitchensis. Scand. J. For. Res. 1994, 9, 91–98. [Google Scholar] [CrossRef]
  11. Perstorper, M.; Pellicane, P.J.; Kliger, I.R.; Johansson, G. Quality of timber products from Norway spruce. Wood Sci. Technol. 1995, 29, 339. [Google Scholar] [CrossRef]
  12. Forsberg, D. Shape stability of sawn wood of Norway spruce in relation to site parameters, wood characteristics and market requirements. Med. Phys. 1997, 25, 2046–2053. [Google Scholar]
  13. Fujimoto, T.; Akutsu, H.; Nei, M.; Kita, K.; Kuromaru, M.; Oda, K. Genetic variation in wood stiffness and strength properties of hybrid larch (Larix gmelinii var. japonica × L. kaempferi). J. For. Res. 2006, 11, 343–349. [Google Scholar] [CrossRef]
  14. Zobel, B.; Stonecypher, R.W.; Browne, C. Inheritance of spiral grain in young loblolly pine. For. Sci. 1968, 14, 376–379. [Google Scholar]
  15. Savidge, R.A.; Farrar, J.L. Cellular adjustments in the vascular cambium leading to spiral grain formation in conifers. Can. J. Bot. 1984, 62, 2872–2879. [Google Scholar] [CrossRef]
  16. Gapare, W.; Hathorn, A.; Kain, D.; Matheson, C.A.; Wu, H. Inheritance of spiral grain in the juvenile core of Pinus radiata. Can. J. For. Res. 2006, 37, 116–127. [Google Scholar] [CrossRef]
  17. Dumbrell, I.C.; McGrath, J.F. Effect of fertiliser and growth rate on angle of spiral grain in young Pinus radiata in Western Australia. Aust. For. 2000, 63, 142–146. [Google Scholar] [CrossRef]
  18. Moore, J.R.; Cown, D.J.; Mckinley, R.B. Modelling spiral grain angle variation in New Zealand-grown radiata pine. N. Z. J. For. Sci. 2015, 45, 1–9. [Google Scholar] [CrossRef]
  19. Silva, J.C.; Borralho, N.; Wellendorf, H. Genetic parameter estimates for diameter growth, pilodyn penetration and spiral grain in Picea abies (L.) Karst. Silvae Genet. 2000, 49, 29–36. [Google Scholar]
  20. Eklund, L.; Säll, H.; Linder, S. Enhanced growth and ethylene increases spiral grain formation in Picea abies and Abies balsamea trees. Trees 2003, 17, 81–86. [Google Scholar] [CrossRef]
  21. Włoch, W.; Mazur, E.D.; Bełtowski, M. Formation of spiral grain in the wood of Pinus sylvestris L. Trees 2002, 16, 306–312. [Google Scholar] [CrossRef]
  22. Eklund, L.; Säll, H. The influence of wind on spiral grain formation in conifer trees. Trees 2000, 14, 324–328. [Google Scholar] [CrossRef]
  23. Smythies, E.A. Notes on the twisted fibre in Chir Pine. Indian For. 1915, 41, 69–75. [Google Scholar]
  24. Rault, J.P.; Marsh, E.K. The incidence and silvicultural implications of spiral grain in Pinus longifolia Roxb. In South Africa and Its Effect on Converted Timber, Proceedings of the Commonwealth Forestry Conference, Ottawa, ON, Canada, 11 August 1952; Forestry Products Institute: Pretoria, South Africa, 1952. [Google Scholar]
  25. Champion, H.G. More about spiral grain in conifers. Indian For. 1929, 55, 57–58. [Google Scholar]
  26. Skatter, S.; Kučera, B. Spiral grain-An adaptation of trees to withstand stem breakage caused by wind-induced torsion. Holz Als Roh-Und Werkst. 1997, 55, 207–213. [Google Scholar] [CrossRef]
  27. Zagórska-Marek, B.; Little, C.H.A. Control of fusiform initial orientation in the vascular cambium of Abies balsamea stems by indol-3-ylacetic acid. Can. J. Bot. 1986, 64, 1120–1128. [Google Scholar] [CrossRef]
  28. Li, S.; Wang, P.; Yuan, W.; Su, Z.; Bullard, S.H. Endocidal Regulation of Secondary Metabolites in the Producing Organisms. Sci. Rep. 2016, 6, 29315. [Google Scholar] [CrossRef]
  29. Teklić, T.; Parađiković, N.; Špoljarević, M.; Zeljković, S.; Lončarić, Z.; Lisjak, M. Linking abiotic stress, plant metabolites, biostimulants and functional food. Ann. Appl. Biol. 2020, 178, 169–191. [Google Scholar] [CrossRef]
  30. Jha, Y.; Mohamed, H.I. Plant Secondary Metabolites as a Tool to Investigate Biotic Stress Tolerance in Plants: A Review. Gesunde Pflanz. 2022, 74, 771–790. [Google Scholar] [CrossRef]
  31. Yang, F.; Shen, H.; Huang, T.; Yao, Q.; Hu, J.; Tang, J.; Zhang, R.; Tong, H.; Wu, Q.-J.; Zhang, Y.J.; et al. Flavonoid production in tomato mediates both direct and indirect plant defences against whiteflies in tritrophic interactions. Pest Manag. Sci. 2023. [Google Scholar] [CrossRef]
  32. Keswani, C.; Singh, H.B.; García-Estrada, C.; Caradus, J.R.; He, Y.-W.; Mezaache-Aichour, S.; Glare, T.R.; Borriss, R.; Sansinenea, E. Antimicrobial secondary metabolites from agriculturally important bacteria as next-generation pesticides. Appl. Microbiol. Biotechnol. 2019, 104, 1013–1034. [Google Scholar] [CrossRef]
  33. Huang, P.; Lin, F.; Li, B.; Zheng, Y. Hybrid-Transcriptome Sequencing and Associated Metabolite Analysis Reveal Putative Genes Involved in Flower Color Difference in Rose Mutants. Plants 2019, 8, 267. [Google Scholar] [CrossRef] [PubMed]
  34. Ku, Y.-S.; Contador, C.A.; Ng, M.-S.; Yu, J.; Chung, G.; Lam, H.-M. The Effects of Domestication on Secondary Metabolite Composition in Legumes. Front. Genet. 2020, 11, 581357. [Google Scholar] [CrossRef] [PubMed]
  35. Oh, J.; Cho, I.H. The aroma profile and aroma-active compounds of Brassica oleracea (kale) tea. Food Sci. Biotechnol. 2021, 30, 1205–1211. [Google Scholar] [CrossRef] [PubMed]
  36. Chevalier, W.; Moussa, S.A.; Ottoni, M.M.N.; Dubois-Laurent, C.; Huet, S.; Aubert, C.; Desnoues, E.; Navez, B.; Cottet, V.; Chalot, G. Multisite evaluation of phenotypic plasticity for specialized metabolites, some involved in carrot quality and disease resistance. PLoS ONE 2021, 16, e0249613. [Google Scholar] [CrossRef] [PubMed]
  37. Bano, C.; Singh, N.B.; Sunaina, S. Differential responses of pea seedlings to salicylic acid under UV-B stress. Trop. Plant Res. 2016, 3, 586–591. [Google Scholar] [CrossRef]
  38. Bano, C.; Amist, N.; Sunaina; Singh, N. B. UV-B radiation escalate allelopathic effect of benzoic acid on Solanum lycopersicum L. Sci. Hortic. 2017, 220, 199–205. [Google Scholar] [CrossRef]
  39. Chiappero, J.; Cappellari, L.D.R.; Palermo, T.B.; Giordano, W.; Banchio, E. Antioxidant status of medicinal and aromatic plants under the influence of growth-promoting rhizobacteria and osmotic stress. Ind. Crops Prod. 2021, 167, 113541. [Google Scholar] [CrossRef]
  40. Zhou, R.; Kong, L.; Yu, X.; Ottosen, C.O.; Zhao, T.; Jiang, F.; Wu, Z. Oxidative damage and antioxidant mechanism in tomatoes responding to drought and heat stress. Acta Physiol. Plant. 2019, 41, 1–11. [Google Scholar] [CrossRef]
  41. Wang, F.; Sethiya, P.; Hu, X.; Guo, S.; Chen, Y.; Li, A.; Tan, K.; Wong, K.H. Transcription in fungal conidia before dormancy produces phenotypically variable conidia that maximize survival in different environments. Nat. Microbiol. 2021, 6, 1066–1081. [Google Scholar] [CrossRef]
  42. Xu, Y.L.; Zhang, R.L.; Tian, B.; Bai, Q.S.; Wang, D.W.; Cai, N.H.; He, C.Z.; Kang, X.Y.; Duan, A.A. Development of novel microsatellite markers for Pinus yunnanensis and their cross amplification in congeneric species. Conserv. Genet. Resour. 2013, 5, 1113–1114. [Google Scholar] [CrossRef]
  43. Conesa, A.; Götz, S. Blast2GO: A Comprehensive suite for functional analysis in plant genomics. Int. J. Plant Genom. 2008, 2008, 12. [Google Scholar] [CrossRef] [PubMed]
  44. Wang, J.; Zhang, T.; Shen, X.; Liu, J.; Zhao, D.; Sun, Y.; Wang, L.; Liu, Y.; Gong, X.; Liu, Y.; et al. Serum metabolomics for early diagnosis of esophageal squamous cell carcinoma by UHPLC-QTOF/MS. Metabolomics 2016, 12, 1–10. [Google Scholar] [CrossRef]
  45. Yang, J.; Bak, G.; Burgin, T.; Barnes, W.J.; Mayes, H.B.; Peña, M.J.; Urbanowicz, B.R.; Nielsen, E. Biochemical and genetic analysis identify CSLD3 as a beta-1,4-glucan synthase that functions during plant cell wall synthesis. Plant Cell 2020, 32, 1749–1767. [Google Scholar] [CrossRef] [PubMed]
  46. Schneider, R.; Hanak, T.; Persson, S.; Voigt, C.A. Cellulose and callose synthesis and organization in focus, what’s new? Curr. Opin. Plant Biol. 2016, 34, 9–16. [Google Scholar] [CrossRef]
  47. Lei, L.; Li, S.; Du, J.; Bashline, L.; Gu, Y. Cellulose synthase interactive3 regulates cellulose biosynthesis in both a microtubule-dependent and microtubule-independent manner in Arabidopsis. Plant Cell 2013, 25, 4912–4923. [Google Scholar] [CrossRef]
  48. Carpita, N.C.; Gibeaut, D.M. Structural models of primary cell walls in flowering plants: Consistency of molecular structure with the physical properties of the walls during growth. Plant J. 1993, 3, 1–30. [Google Scholar] [CrossRef]
  49. Wasteneys, G.O. Progress in understanding the role of microtubules in plant cells. Curr. Opin. Plant Biol. 2005, 7, 651–660. [Google Scholar] [CrossRef]
  50. Sedbrook, J.C.; Ehrhardt, D.W.; Fisher, S.E.; Scheible, W.R.; Somerville, C.R. The Arabidopsis sku6/spiral1 gene encodes a plus end-localized microtubule-interacting protein involved in directional cell expansion. Plant Cell 2004, 16, 1506–1520. [Google Scholar] [CrossRef]
  51. Nakajima, K.; Furutani, I.; Tachimoto, H.; Matsubara, H.; Hashimoto, T. SPIRAL1 encodes a plant-specific microtubule-localized protein required for directional control of rapidly expanding Arabidopsis cells. Plant Cell Online 2004, 16, 1178–1190. [Google Scholar] [CrossRef]
  52. Sakai, T.; Honing, H.; Nishioka, M.; Uehara, Y.; Takahashi, M.; Fujisawa, N.; Saji, K.; Seki, M.; Shinozaki, K.; Jones, M.A. Armadillo repeat-containing kinesins and a NIMA-related kinase are required for epidermal-cell morphogenesis in Arabidopsis. Plant J. Cell Mol. Biol. 2008, 53, 157–171. [Google Scholar] [CrossRef]
  53. Bringmann, M.; Li, E.; Sampathkumar, A.; Kocabek, T.; Persson, H.S. POM-POM2/CELLULOSE SYNTHASE INTERACTING1 is essential for the functional association of cellulose synthase and microtubules in Arabidopsis. Plant Cell 2012, 24, 163–177. [Google Scholar] [CrossRef] [PubMed]
  54. Bisgrove, S.R.; Lee, Y.R.J.; Liu, B.; Peters, N.T.; Kropf, D.L. The microtubule plus-end binding protein EB1 functions in root responses to touch and gravity signals in Arabidopsis. Plant Cell 2008, 20, 396–410. [Google Scholar] [CrossRef] [PubMed]
  55. Whittington, A.T.; Vugrek, O.; Wei, K.J.; Hasenbein, N.G.; Sugimoto, K.; Rashbrooke, M.C.; Wasteneys, G.O. MOR1 is essential for organizing cortical microtubules in plants. Nature 2001, 411, 610–613. [Google Scholar] [CrossRef]
  56. Furutani, I.; Watanabe, Y.; Prieto, R.; Masukawa, M.; Hashimoto, T. The SPIRAL genes are required for directional control of cell elongation in Aarabidopsis thaliana. Development 2000, 127, 4443–4453. [Google Scholar] [CrossRef]
  57. Buschmann, H.; Fabri, C.O.; Hauptmann, M.; Hutzler, P.; Laux, T.; Lloyd, C.W.; Schäffner, A.R. Helical growth of the Arabidopsis mutant tortifolia1 reveals a plant-specific microtubule-associated protein. Curr. Biol. 2004, 14, 1515–1521. [Google Scholar] [CrossRef]
  58. Saffer, A.M.; Carpita, N.C.; Irish, V.F. Rhamnose-containing cell wall polymers suppress helical plant growth independently of microtubule orientation. Curr. Biol. 2017, 27, 2248–2259. [Google Scholar] [CrossRef] [PubMed]
  59. Yuen, C.; Sedbrook, J.C.; Perrin, R.M.; Carroll, K.L.; Masson, P.H. Loss-of-function mutations of ROOT HAIR DEFECTIVE3 suppress root waving, skewing, and epidermal cell file rotation in Arabidopsis. Plant Physiol. 2005, 138, 701–714. [Google Scholar] [CrossRef]
  60. Sedbrook, J.C.; Carroll, K.L.; Hung, K.F.; Masson, P.H.; Somerville, C.R. The Arabidopsis SKU5 gene encodes an extracellular glycosyl phosphatidylinositol-anchored glycoprotein involved in directional root growth. Plant Cell. 2002, 14, 1635–1648. [Google Scholar] [CrossRef]
  61. Cui, D.; Neill, S.J.; Tang, Z.; Cai, W. Gibberellin-regulated XET is differentially induced by auxin in rice leaf sheath bases during gravitropic bending. J. Exp. Bot. 2005, 56, 1327–1334. [Google Scholar] [CrossRef]
  62. Chen, L.; Higashitani, A.; Suge, H.; Takeda, K.; Takahashi, H. Spiral growth and cell wall properties of the gibberellin-treated first internodes in the seedlings of a wheat cultivar tolerant to deep-sowing conditions. Physiol. Plant. 2003, 118, 147–155. [Google Scholar] [CrossRef]
  63. Eklund, L.; Little, C. Interaction between indole-3-acetic acid and ethylene in the control of tracheid production in detached shoots of Abies balsamea. Tree Physiol. 1995, 15, 27–34. [Google Scholar] [CrossRef]
  64. Han, J.W.; Choi, G.J.; Kim, B.S. Antimicrobial aromatic polyketides: A review of their antimicrobial properties and potential use in plant disease control. World J. Microbiol. Biotechnol. 2018, 34, 163. [Google Scholar] [CrossRef] [PubMed]
  65. Yudkina, A.V.; Kovalenko, E.A.; Endutkin, A.V.; Panferova, E.P.; Kirilenko, A.A.; Kokhanenko, A.A.; Zharkov, D.O. Factors Affecting the Stability of the Trimer of 2′-Deoxyuridine 5′-Triphosphate Nucleotide Hydrolase from Escherichia coli. Mol. Biol. 2023, 57, 312–319. [Google Scholar] [CrossRef]
  66. Li, P.L.; Zong, D.; Gan, P.H.; Li, H.L.; Wu, Z.Y.; Li, F.H.; Zhao, C.L.; Li, L.G.; He, C.Z. Comparison of the diversity and structure of the rhizosphere microbial community between the straight and twisted trunk types of Pinus yunnanensis. Front. Microbiol. 2023, 14, 1066805. [Google Scholar] [CrossRef] [PubMed]
  67. Jones, J.D.G.; Dangl, J.L. The plant immune system. Nature 2006, 444, 323–329. [Google Scholar] [CrossRef] [PubMed]
  68. Jones, D.A.; Takemoto, D. Plant innate immunity-direct and indirect recognition of general and specific pathogen-associated molecules. Curr. Opin. Immunol. 2004, 16, 48–62. [Google Scholar] [CrossRef]
  69. Kim, M.G.; Cunha, L.D.; McFall, A.J.; Belkhadir, Y.; DebRoy, S.; Dangl, J.L.; Mackey, D. Two Pseudomonas syringae type III effectors inhibit RIN4-regulated basal defense in Arabidopsis. Cell 2005, 121, 749–759. [Google Scholar] [CrossRef]
  70. Qi, Y.; Tsuda, K.; Glazebrook, J.; Katagiri, F. Physical association of pattern-triggered immunity (PTI) and effector-triggered immunity (ETI) immune receptors in Arabidopsis. Mol. Plant Pathol. 2011, 12, 702–708. [Google Scholar] [CrossRef]
  71. Gómez-Gómez, L.; Boller, T.J.M.C. FLS2: An LRR receptor-like kinase involved in the perception of the bacterial elicitor flagellin in Arabidopsis. Mol. Cell 2000, 5, 1003–1011. [Google Scholar] [CrossRef]
  72. Grabherr, M.G.; Haas, B.J.; Yassour, M.; Levin, J.Z.; Thompson, D.A.; Amit, I.; Adiconis, X.; Fan, L.; Raychowdhury, R.; Zeng, Q.; et al. Full-length transcriptome assembly from RNA-Seq data without a reference genome. Nat. Biotechnol. 2011, 29, 644–652. [Google Scholar] [CrossRef]
  73. Pertea, G.; Huang, X.; Liang, F.; Antonescu, V.; Sultana, R.; Karamycheva, S.; Lee, Y.; White, J.; Cheung, F.; Parvizi, B.; et al. TIGR Gene Indices clustering tools (TGICL): A software system for fast clustering of large EST datasets. Bioinformatics 2003, 19, 651–652. [Google Scholar] [CrossRef]
  74. Cameron, M.; Williams, H.E.; Cannane, A. Improved gapped alignment in BLAST. IEEE/ACM Trans. Comput. Biol. Bioinform. 2004, 1, 116–129. [Google Scholar] [CrossRef]
  75. Wang, L.; Feng, Z.; Wang, X.; Wang, X.; Zhang, X. DEGseq: An R package for identifying differentially expressed genes from RNA-seq data. Bioinformatics 2010, 26, 136–138. [Google Scholar] [CrossRef]
  76. Chen, C.; Chen, H.; Zhang, Y.; Thomas, H.R.; Frank, M.H.; He, Y.; Xia, R. TBtools—An integrative toolkit developed for interactive analyses of big biological data. Mol. Plant 2020, 13, 1194–1202. [Google Scholar] [CrossRef] [PubMed]
  77. Wickham, H. Elegant graphics for data analysis. Media 2009, 35, 10–1007. [Google Scholar]
  78. Langfelder, P.; Horvath, S. WGCNA: An R package for weighted correlation network analysis. BMC Bioinform. 2008, 9, 559. [Google Scholar] [CrossRef]
  79. Cline, M.S.; Smoot, M.E.; Cerami, E.G.; Kuchinsky, A.; Landys, N.; Workman, C.; Christmas, R.H.; Avila-Campilo, I.; Creech, M.L.; Gross, B.E.; et al. Integration of biological networks and gene expression data using Cytoscape. Nat. Protoc. 2007, 2, 2366–2382. [Google Scholar] [CrossRef] [PubMed]
  80. Granados, J.M.; Ávila, C.; Cánovas, F.M.; Cañas, R.A. Genomes, selection and testing of reference genes for accurate RT-qPCR in adult needles and seedlings of maritime pine. Tree Genet. 2016, 12, 1–15. [Google Scholar]
  81. Lalitha, S. Primer Premier 5. Biotech Softw. Internet Rep. Comput. Softw. J. Sci. 2000, 1, 270–272. [Google Scholar] [CrossRef]
  82. Livak, K.J.; Schmittgen, T. Analysis of relative gene expression data using real-time quantitative PCR and the 2−ΔΔCT method. Methods 2001, 25, 402–408. [Google Scholar] [CrossRef]
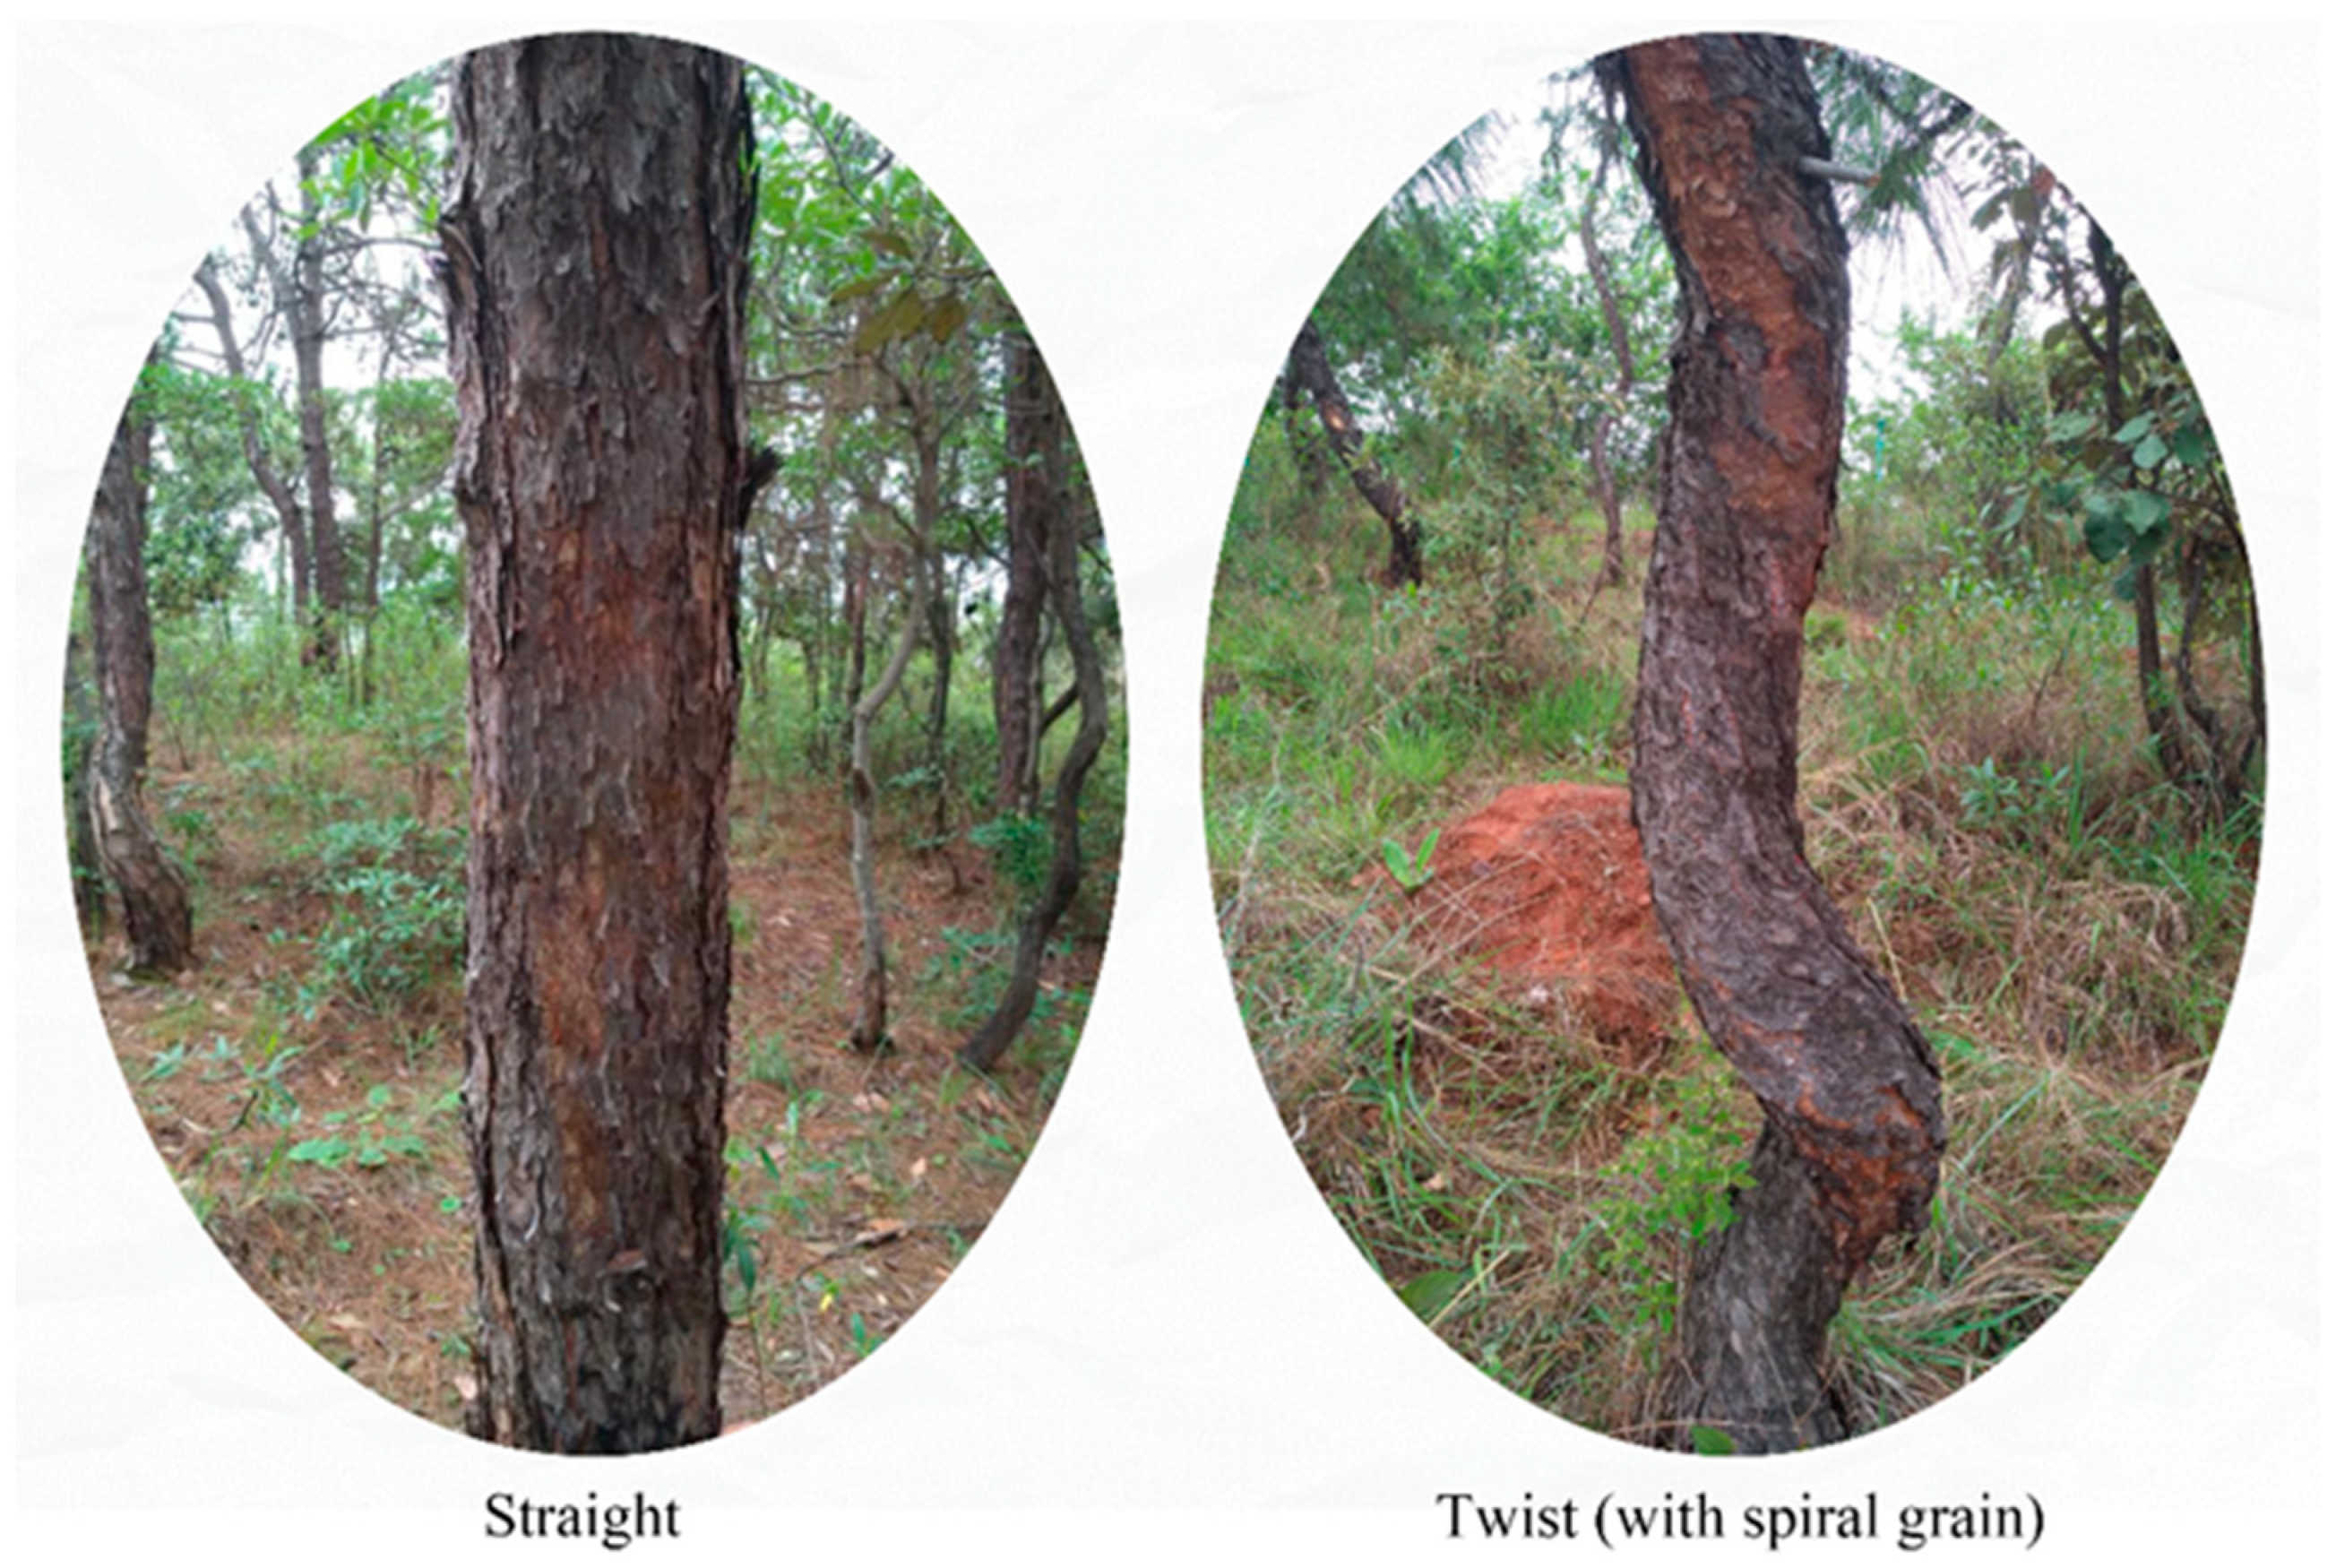
Figure 1. Spiral grain in Pinus yunnanensis.
Ijms 24 14658 g001
Figure 2. The annotated result of NR, COG, and GO. (a) NR of E-value distribution. (b) NR of similarity distribution. (c) NR of species distribution. (d) COG function classification. (e) GO classification.
Ijms 24 14658 g002
Figure 3. Information on DEGs. (a) DEG counts in different pairs. (b) Annotation of DEG numbers by NR, NT, Swissport, COG, KEGG, and GO databases in different pairs. S: straight; T: twisted; X: xylem; P: phloem; XS: straight xylem; XT: twisted xylem; PS: straight phloem; PT: twisted phloem.
Ijms 24 14658 g003
Figure 4. KEGG enrichment of XS vs. XT, PS vs. PT, and S vs. T pairs.
Ijms 24 14658 g004
Figure 5. DAM screening in the PS vs. PT pair. (a) DAM volcano in positive mode (ESI+); (b) DAM volcano in negative mode (ESI−).
Ijms 24 14658 g005
Figure 6. WGCNA analysis and hub unigene search. (a) Relationships between gene modules and metabolite traits. (b) Network of transcription factors (TFs) in modules highly connected to 2′-deoxyuridine and butein metabolites. Each ellipse node indicates a TF gene, which is labeled in red, and the round rectangle node indicates a metabolite; they are labeled in blue.
Ijms 24 14658 g006
Figure 7. Differentially expressed genes assigned to plant hormone signal transduction. The map is from the Kyoto Encyclopedia of Genes and Genomes (KEGG). The gene expression levels of each treatment are shown in different columns, as described in the color key, and the different rows represent the different genes.
Ijms 24 14658 g007
Disclaimer/Publisher’s Note: The statements, opinions and data contained in all publications are solely those of the individual author(s) and contributor(s) and not of MDPI and/or the editor(s). MDPI and/or the editor(s) disclaim responsibility for any injury to people or property resulting from any ideas, methods, instructions or products referred to in the content.