Article

OGR1 (GPR68) and TDAG8 (GPR65) Have Antagonistic Effects in Models of Colonic Inflammation

Department of Gastroenterology and Hepatology, University Hospital Zurich, University of Zurich, 8091 Zurich, Switzerland
*
Author to whom correspondence should be addressed.
These authors contributed equally to this work.
Int. J. Mol. Sci. 2023, 24(19), 14855; https://doi.org/10.3390/ijms241914855
Submission received: 1 September 2023 / Revised: 29 September 2023 / Accepted: 29 September 2023 / Published: 3 October 2023
(This article belongs to the Section Molecular Pathology, Diagnostics, and Therapeutics)

Abstract

:
G-protein-coupled receptors (GPRs), including pro-inflammatory ovarian cancer GPR1 (OGR1/GPR68) and anti-inflammatory T cell death-associated gene 8 (TDAG8/GPR65), are involved in pH sensing and linked to inflammatory bowel disease (IBD). OGR1 and TDAG8 show opposite effects. To determine which effect is predominant or physiologically more relevant, we deleted both receptors in models of intestinal inflammation. Combined Ogr1 and Tdag8 deficiency was assessed in spontaneous and acute murine colitis models. Disease severity was assessed using clinical scores. Colon samples were analyzed using quantitative polymerase chain reaction (qPCR) and flow cytometry (FACS). In acute colitis, Ogr1-deficient mice showed significantly decreased clinical scores compared with wildtype (WT) mice, while Tdag8-deficient mice and double knockout (KO) mice presented similar scores to WT. In Il-10-spontaneous colitis, Ogr1-deficient mice presented significantly decreased, and Tdag8-deficient mice had increased inflammation. In the Il10−/− × Ogr1−/− × Tdag8−/− triple KO mice, inflammation was significantly decreased compared with Tdag8−/−. Absence of Ogr1 reduced pro-inflammatory cytokines in Tdag8-deficient mice. Tdag8−/− had significantly more IFNγ+ T-lymphocytes and IL-23 T-helper cells in the colon compared with WT. The absence of OGR1 significantly alleviates the intestinal damage mediated by the lack of functional TDAG8. Both OGR1 and TDAG8 represent potential new targets for therapeutic intervention.

1. Introduction

OGR1 and TDAG8 are pH-sensing GPRs that belong to the GPR4 subfamily. They are activated by acidic extracellular pH [1,2,3], reaching their maximal activation at approximately pH 6.8, and are silent at pH higher than 7.6 [1,4,5,6]. TDAG8 and OGR1 sense extracellular protons through histidine residues located in the extracellular region of the receptors, resulting in signaling pathway activation and modification of a variety of cell functions. Intracellularly, TDAG8 and OGR1 couple to different Gα protein subunits, triggering the activation of their corresponding downstream signaling pathways [7].
TDAG8 is present in immune cell-specific cells [8] and is found on T cells, macrophages, eosinophils, mast cells, and other cells of the innate immune system [8,9,10,11]. The presence of TDAG8 protects from intestinal inflammation as Tdag8 deficiency exacerbates intestinal inflammation and fibrosis in the dextran sodium sulfate (DSS)-induced chronic colitis [12], the DSS-induced acute colitis [13], and the T cell transfer-induced colitis mouse models [13]. TDAG8 can be activated by acidic extracellular pH through the protonation of several histidine residues on the receptor extracellular domains and activate downstream signals through the Gαs/cAMP [14] and Gα12/13/Rho pathways [15]. TDAG8 was proposed to act as a negative regulator of inflammation [13,16] through the activation of a Gαs-coupled mechanism [5]. TDAG8 has been identified as an IBD risk gene in genome-wide association studies [17]. In addition to IBD, TDAG8 has been identified as a risk gene for other inflammatory diseases, such as COPD, asthma, multiple sclerosis, and ankylosing spondylitis [18,19,20,21].
OGR1 is expressed in various cell types including intestinal macrophages, granulocytes, endothelial cells, and fibroblasts [22]. The presence of OGR1 perpetuates intestinal inflammation as Ogr1 deficiency protects from fibrosis [22] and intestinal inflammation in the spontaneous colitis mouse model [23]. Confirmatively, the positive effect of an Ogr1 inhibitor in the acute and chronic DSS colitis mouse models has been demonstrated [24]. OGR1 couples predominantly through Gq11 proteins, leading to activation of the phospholipase C (PLC)/inositol phosphate (IP)/Ca2+/extracellular signal-regulated kinases (ERK) pathway [1,2] and the Gα12/13/Rho signaling pathway [8,25,26,27]. OGR1 activation has a pro-inflammatory effect in colitis by increasing immune and inflammatory factors, as well as genes associated with cell adhesion, ECM remodeling, fibrosis, and organization of actin cytoskeleton among other genes, resulting in elevated fibrosis and a more severe inflammation [23,24,28]. The intestine of IBD patients shows increased mRNA expression of OGR1, especially upon inflammation, compared with the intestine of healthy individuals [22]. Furthermore, the mRNA expression of OGR1 correlates with clinical scores given to IBD patients, indicating that OGR1 has a clinically relevant pro-inflammatory effect that could constitute a therapeutic target [22,23]. In mice, increased OGR1 mRNA expression has also been shown in colon tumors when compared with normal colon samples, confirming a role for OGR1 in both colitis and tumorigenesis [29].
TDAG8 and OGR1 appear to have antagonistic effects, also referred to as “OGR1-TDAG8 reciprocity” [7]. Ogr1 deficiency is mostly anti-inflammatory and therefore protective, whilst Tdag8 deficiency causes opposite effects. To date, there are no data on a potential mutual influence of the pathways activated by both receptors, and their opposite effects on inflammation seem to arise from the activation of different transcription factors and cellular processes. Thus, OGR1 appears to block autophagy and induce the activation of the endoplasmic reticulum stress transcription factor X-box-binding protein-1 through the IRE1α-JNK signaling pathway [30]. Following activation by an acidic environment, different downstream signals from both receptors seem to trigger independent molecular mechanisms whose contribution ultimately modulates inflammation under acidic conditions. The combined effect of both deficiencies has not yet been determined.
Studies of recent years have shown that GPRs, which are involved in the pH sensing of the intercellular space, are linked to IBD [1,23,29,31,32]. IBD consists of two main phenotypes: ulcerative colitis (UC) and CD. In 2017, there were 6.8 million cases of IBD globally [33]. IBD is characterized by a chronic inflammation of the intestinal wall leading to severe and persistent mucosal damage. An increasing body of studies have provided evidence that the pathogenesis of IBD is associated with genetic susceptibility [17], intestinal microbiota [34], environmental factors, and immunological abnormalities [35]. Strikingly, low pH accompanies the course of the disease: local acidification in the gut lumen has been observed during intestinal inflammation and is implicated in the pathogenesis and progression of IBD [36,37]. Fecal fluid of patients suffering from severe UC was characterized by low fecal pH, bicarbonate, and very high lactate levels [38]. In addition, low pH occurs in chronic inflammation and inflammation-induced tumors due to hypoxia, low perfusion, and production of glycolytic metabolites [39]. This is the first study where the physiological consequences of the double deletion of OGR1 and TDAG8 have been investigated. The aim of this study was to better understand the link between the physiological role of both receptors and assess which one has a predominant effect or is physiologically more relevant in the context of intestinal inflammation. We hypothesized that deletion of pro-inflammatory Ogr1 balances out the absence of anti-inflammatory Il-10 and Tdag8, and consequently OGR1 inhibition represents a potential therapeutic option in IBD, particularly for patients carrying mutations in the CD susceptibility gene TDAG8.

2. Results

2.1. Ogr1 Deficiency Reduces Clinical Severity in the DSS-Induced Acute Colitis Model, Both in a WT and Tdag8−/− Background

To investigate the interplay of Ogr1 and Tdag8 in the development of acute intestinal inflammation, 12–15-week-old WT (n = 21), Ogr1−/− (n = 10), Tdag8−/− (n = 14), and Ogr1−/− × Tdag8−/− (n = 10) littermate mice were exposed to DSS for 8 days, which resulted in pronounced colitis. As a control, WT mice (n = 7) and Ogr1−/− × Tdag8−/− mice (n = 5) were exposed to water (H2O) for the same duration. As observed earlier, Tdag8−/− deficiency did not lead to further body weight loss or a further deteriorated disease activity score compared with WT mice upon DSS. However, Ogr1-deficient mice upon DSS showed significantly less body weight loss (Figure 1A) and a significantly decreased disease activity score (Figure 1B) compared with the corresponding WT (p = 0.0026 and p = 0.0148) and Tdag8−/− genotypes (p = 0.0031 and p = 0.0144), respectively. The H2O control groups showed no differences between WT and double KO mice (p = 0.8687). Before euthanasia, an endoscopy was performed on all mice (Figure 1C). The resulting murine endoscopic index of colitis severity [MEICS] score (Figure 1D) showed significantly decreased scores for Ogr1-deficient mice, compared with WT (p < 0.0055) and Tdag8−/− mice (p = 0.0064) upon DSS. Additionally, the scores of Ogr1−/− × Tdag8−/− mice were significantly decreased when compared with WT (p = 0.0033) and Tdag8−/− (p = 0.0024) mice upon DSS (Figure 1D). A score for surface, vascularity, and transparency, used to calculate the MEICS, were also assessed separately (Supplementary Figure S1A). The surface score was significantly decreased in the Ogr1−/− mice compared with WT mice (p < 0.001) and Tdag8−/− mice (p < 0.001) upon DSS. Both the vascularity and the transparency score were significantly decreased in the Ogr1−/− mice compared with WT mice (p = 0.0110 and 0.0116, respectively) upon DSS.
The relative spleen weight measured postmortem (Figure 1E) was significantly decreased in Ogr1−/− mice upon DSS compared with WT mice (p < 0.0005) and showed no significant difference compared with the H2O control mice, indicating less leukocyte accumulation (Figure 1E). Similarly, the Ogr1−/− × Tdag8−/− mice upon DSS showed significantly decreased relative spleen weight compared with the Tdag8−/− (p = 0.0302) mice upon DSS (Figure 1E). Ogr1−/− mice upon DSS showed a significantly greater colon length when compared with WT mice upon DSS (p < 0.0114) (Figure 1F). The other groups exposed to DSS showed a decrease in relative colon length similar to the H2O control mice.
Histology samples were used to assess the severity of inflammation in colon specimens from all groups using HE staining (Figure 2A). The histological score (Figure 2B) was significantly lower in Ogr1−/− mice with DSS-induced acute colitis compared with the other DSS groups (WT [p = 0.001] and Tdag8−/− [p < 0.0024]). The histological score of Ogr1-deficient mice showed no significant differences when compared with that of the WT H2O control mice (Figure 2B). The Ogr1−/− × Tdag8−/− mice upon DSS showed a decreased histological score compared with the Tdag8−/− and WT mice upon DSS, but statistical significance was not reached (p = 0.5115, both). Lymphocyte infiltration and epithelial damage, used to calculate the histology score, were also assessed separately (Supplementary Figure S1B). The lymphocyte infiltration score was significantly decreased in the Ogr1−/− mice compared with WT mice (p = 0.0028) and Tdag8−/− mice (p < 0.001) upon DSS. In contrast, lymphocyte infiltration remained unchanged in Tdag8−/− mice compared with WT mice upon DSS (p = 0.7228). In the Ogr1−/− × Tdag8−/− double KO mice, lymphocyte infiltration was significantly decreased compared with Tdag8−/− mice (p = 0.0349), indicating that the absence of Ogr1 can also improve inflammation in the context of a Tdag8 deficiency. The epithelial damage score was significantly decreased in Ogr1−/− mice compared with WT (p < 0.001), Tdag8−/− (p = 0.0091), or Ogr1−/− × Tdag8−/− mice (p = 0.0117) upon DSS. In contrast to the lymphocyte infiltration sub-analysis, the epithelial damage score showed no amelioration for the Ogr1−/− × Tdag8−/− double KO mice compared with Tdag8−/− mice or WT mice upon DSS.

2.2. Il-10 Deficiency: The Absence of Tdag8 Exacerbates Colitis, While the Absence of Ogr1 Is Protective

In order to extend our studies, the Il-10−/− spontaneous colitis mouse model was applied. For that, Il-10−/− × Ogr1−/− (n = 13), Il-10−/− × Tdag8−/− (n = 8), and Il-10−/− × Ogr1−/− × Tdag8−/− (n = 9) mice were investigated. As a control, littermates from the respective KO with Il-10-deficiency were used (total, n = 17; Il-10−/− × Ogr1−/− littermates, n = 9; Il-10−/− × Tdag8−/− littermates, n = 5; and Il-10−/− × Ogr1−/− × Tdag8−/− littermates, n = 3). Successful induction of colitis was confirmed by an overall body weight loss (Figure 3A). Of note, and in contrast to the DSS model, Tdag8 deficiency in the Il10−/− background led to a clearly exacerbated disease, as demonstrated by a significant increase in body weight loss (p = 0.0107). Loss of OGR1 was protective: Il-10−/− × Ogr1−/− mice showed a significantly higher body weight at euthanasia compared with Il-10−/− (p = 0.0275), Il-10−/− × Tdag8−/− (p = 0.0003), and Il-10−/− × Ogr1−/− × Tdag8−/− mice (p = 0.0339) (Figure 3A). The disease activity score was obtained daily (Figure 3B) and showed a significant decrease at euthanasia for mice of the Il-10−/− × Ogr1−/− group compared with Il-10−/− mice (p = 0.0002) or Il-10−/− × Tdag8−/− mice (p < 0.0001). Before euthanasia, an endoscopy was performed on all mice (Figure 3C). The resulting MEICS score showed that Il-10−/− × Ogr1−/− mice presented an ameliorated colitis compared with their Il-10−/− littermates (p < 0.0001, Figure 3D). In contrast, Il-10−/− × Tdag8−/− mice showed a significant higher MEICS score compared with their Il-10−/− littermates (p < 0.0001, Figure 3D). Triple KO mice showed a significantly lower MEICS score as compared with Il-10−/− (p = 0.0173, Figure 3D). Il-10−/− × Tdag8−/− mice showed a significant increase in spleen weight (Figure 3E) compared with other groups (Il-10−/− × Ogr1−/− [p < 0.0001], and Il-10−/− × Ogr1−/− × Tdag8−/− [p = 0.0221]).
On the other hand, Il-10−/− × Ogr1−/− mice showed a significantly lower spleen weight compared with Il-10−/− animals (p = 0.0057). There was a reduction in spleen weight when Il-10−/− × Tdag8−/− mice were compared with Il-10−/− × Ogr1−/− × Tdag8−/− mice (p = 0.0221). Il-10−/− × Ogr1−/− mice showed a significantly greater colon length when compared with Il-10−/− (p < 0.0007, Figure 3F). Il-10−/− × Ogr1−/− × Tdag8−/− mice showed a significantly greater colon length when compared with Il-10−/− (p = 0.0446) or Il-10−/− × Tdag8−/− mice (p < 0.0112).
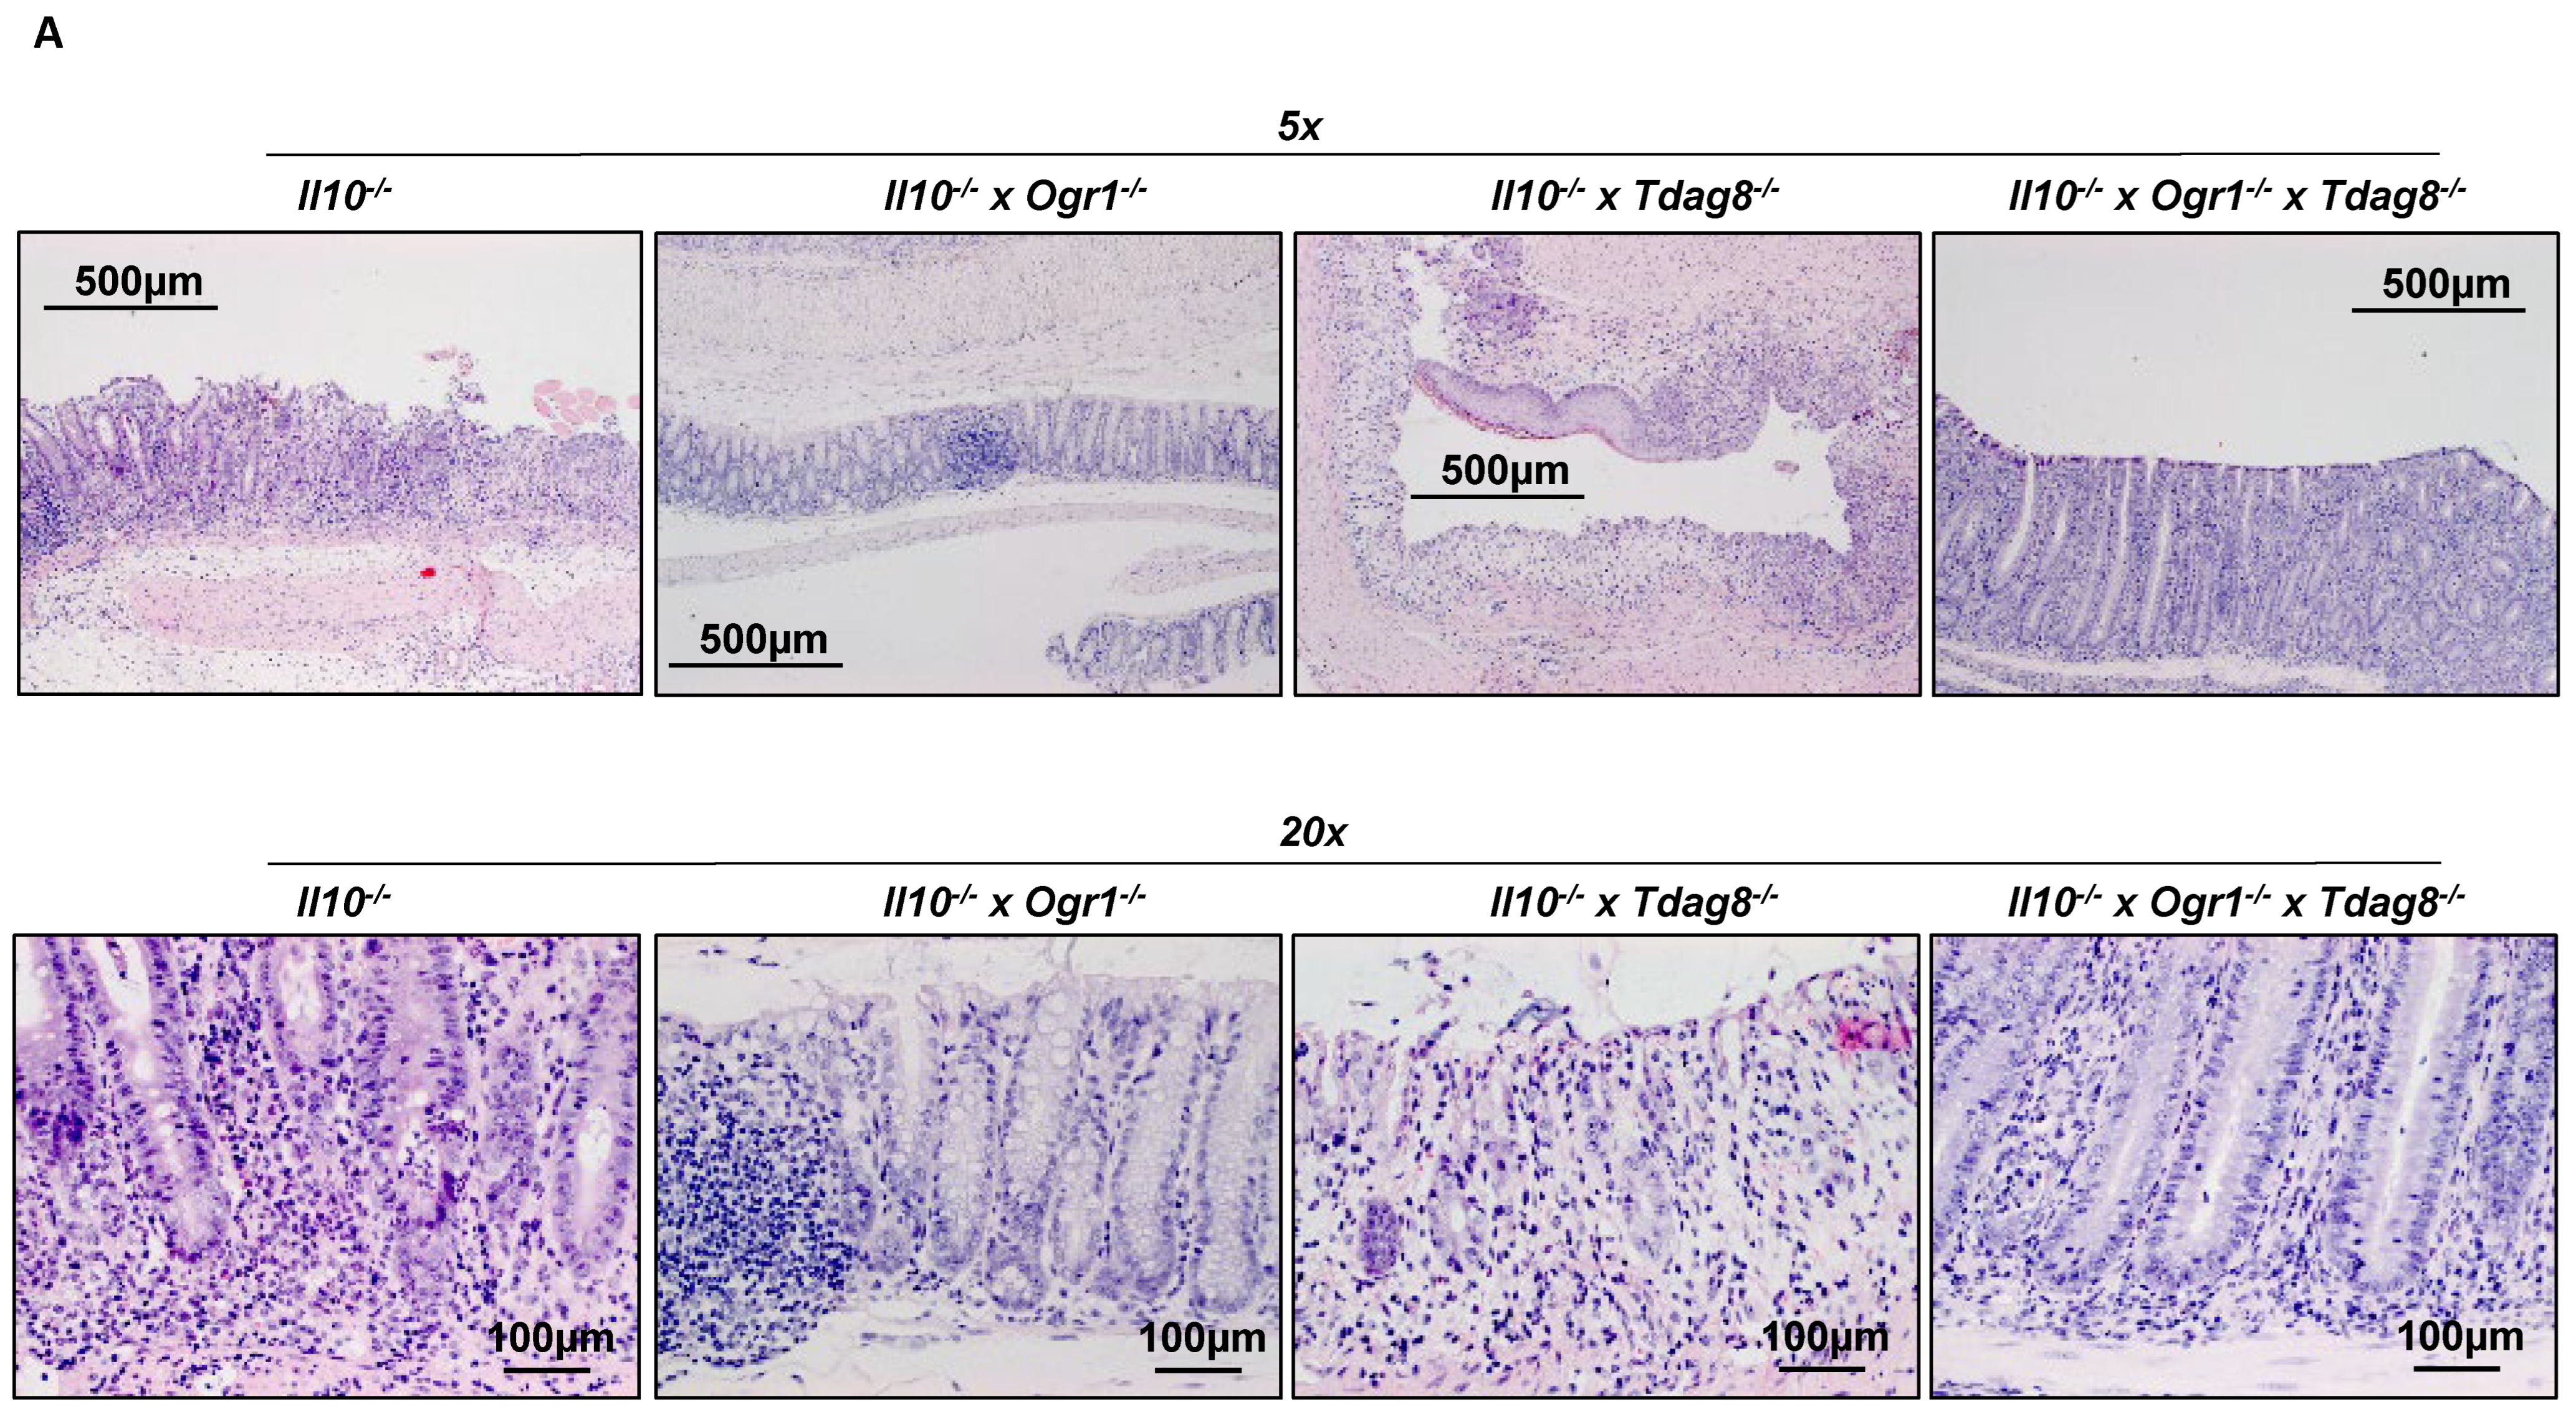
To further assess the severity of inflammation, the distal 1 cm of the colon from all the specimens were subjected to histology. The histological score of the colon (Figure 4A,B and Supplementary Figure S2A) was significantly decreased in Il-10−/− × Ogr1−/− mice compared with Il-10−/− mice (p < 0.0001), confirming the protective nature of an Ogr1 deficiency. As expected, Il-10−/− × Tdag8−/− mice showed a significant exacerbation of the disease compared with Il-10−/− mice (p < 0.0001), including cryptitis (Supplementary Figure S2B). Interestingly, triple KO mice showed no significant difference compared with Il-10−/− × Ogr1−/− mice (p = 0.1601) and Il-10−/− mice (p = 0.2666), but a significantly lower score compared with Il-10−/− × Tdag8−/− mice (p < 0.0001). These results demonstrate that the protective effect of the Ogr1 depletion is maintained in a Tdag8−/− background. Il-10−/− × Tdag8−/− mice showed a significantly higher histological score compared with all other groups (p < 0.0001).
Additionally, a histological score of the small bowel was performed (Supplementary Figure S3). The results support the findings from the histological score of the colon and showed a significantly decreased score in Il-10−/− × Ogr1−/− mice compared with Il-10−/− (p = 0.0032), Il-10−/− × Tdag8−/− (p < 0.001), and Il-10−/− × Ogr1−/− × Tdag8−/− (p = 0.0059) mice.

2.3. The Absence of Ogr1 Reduces Pro-Inflammatory Cytokine Expression in Tdag8-Deficient mice in the Model of Spontaneous Colitis

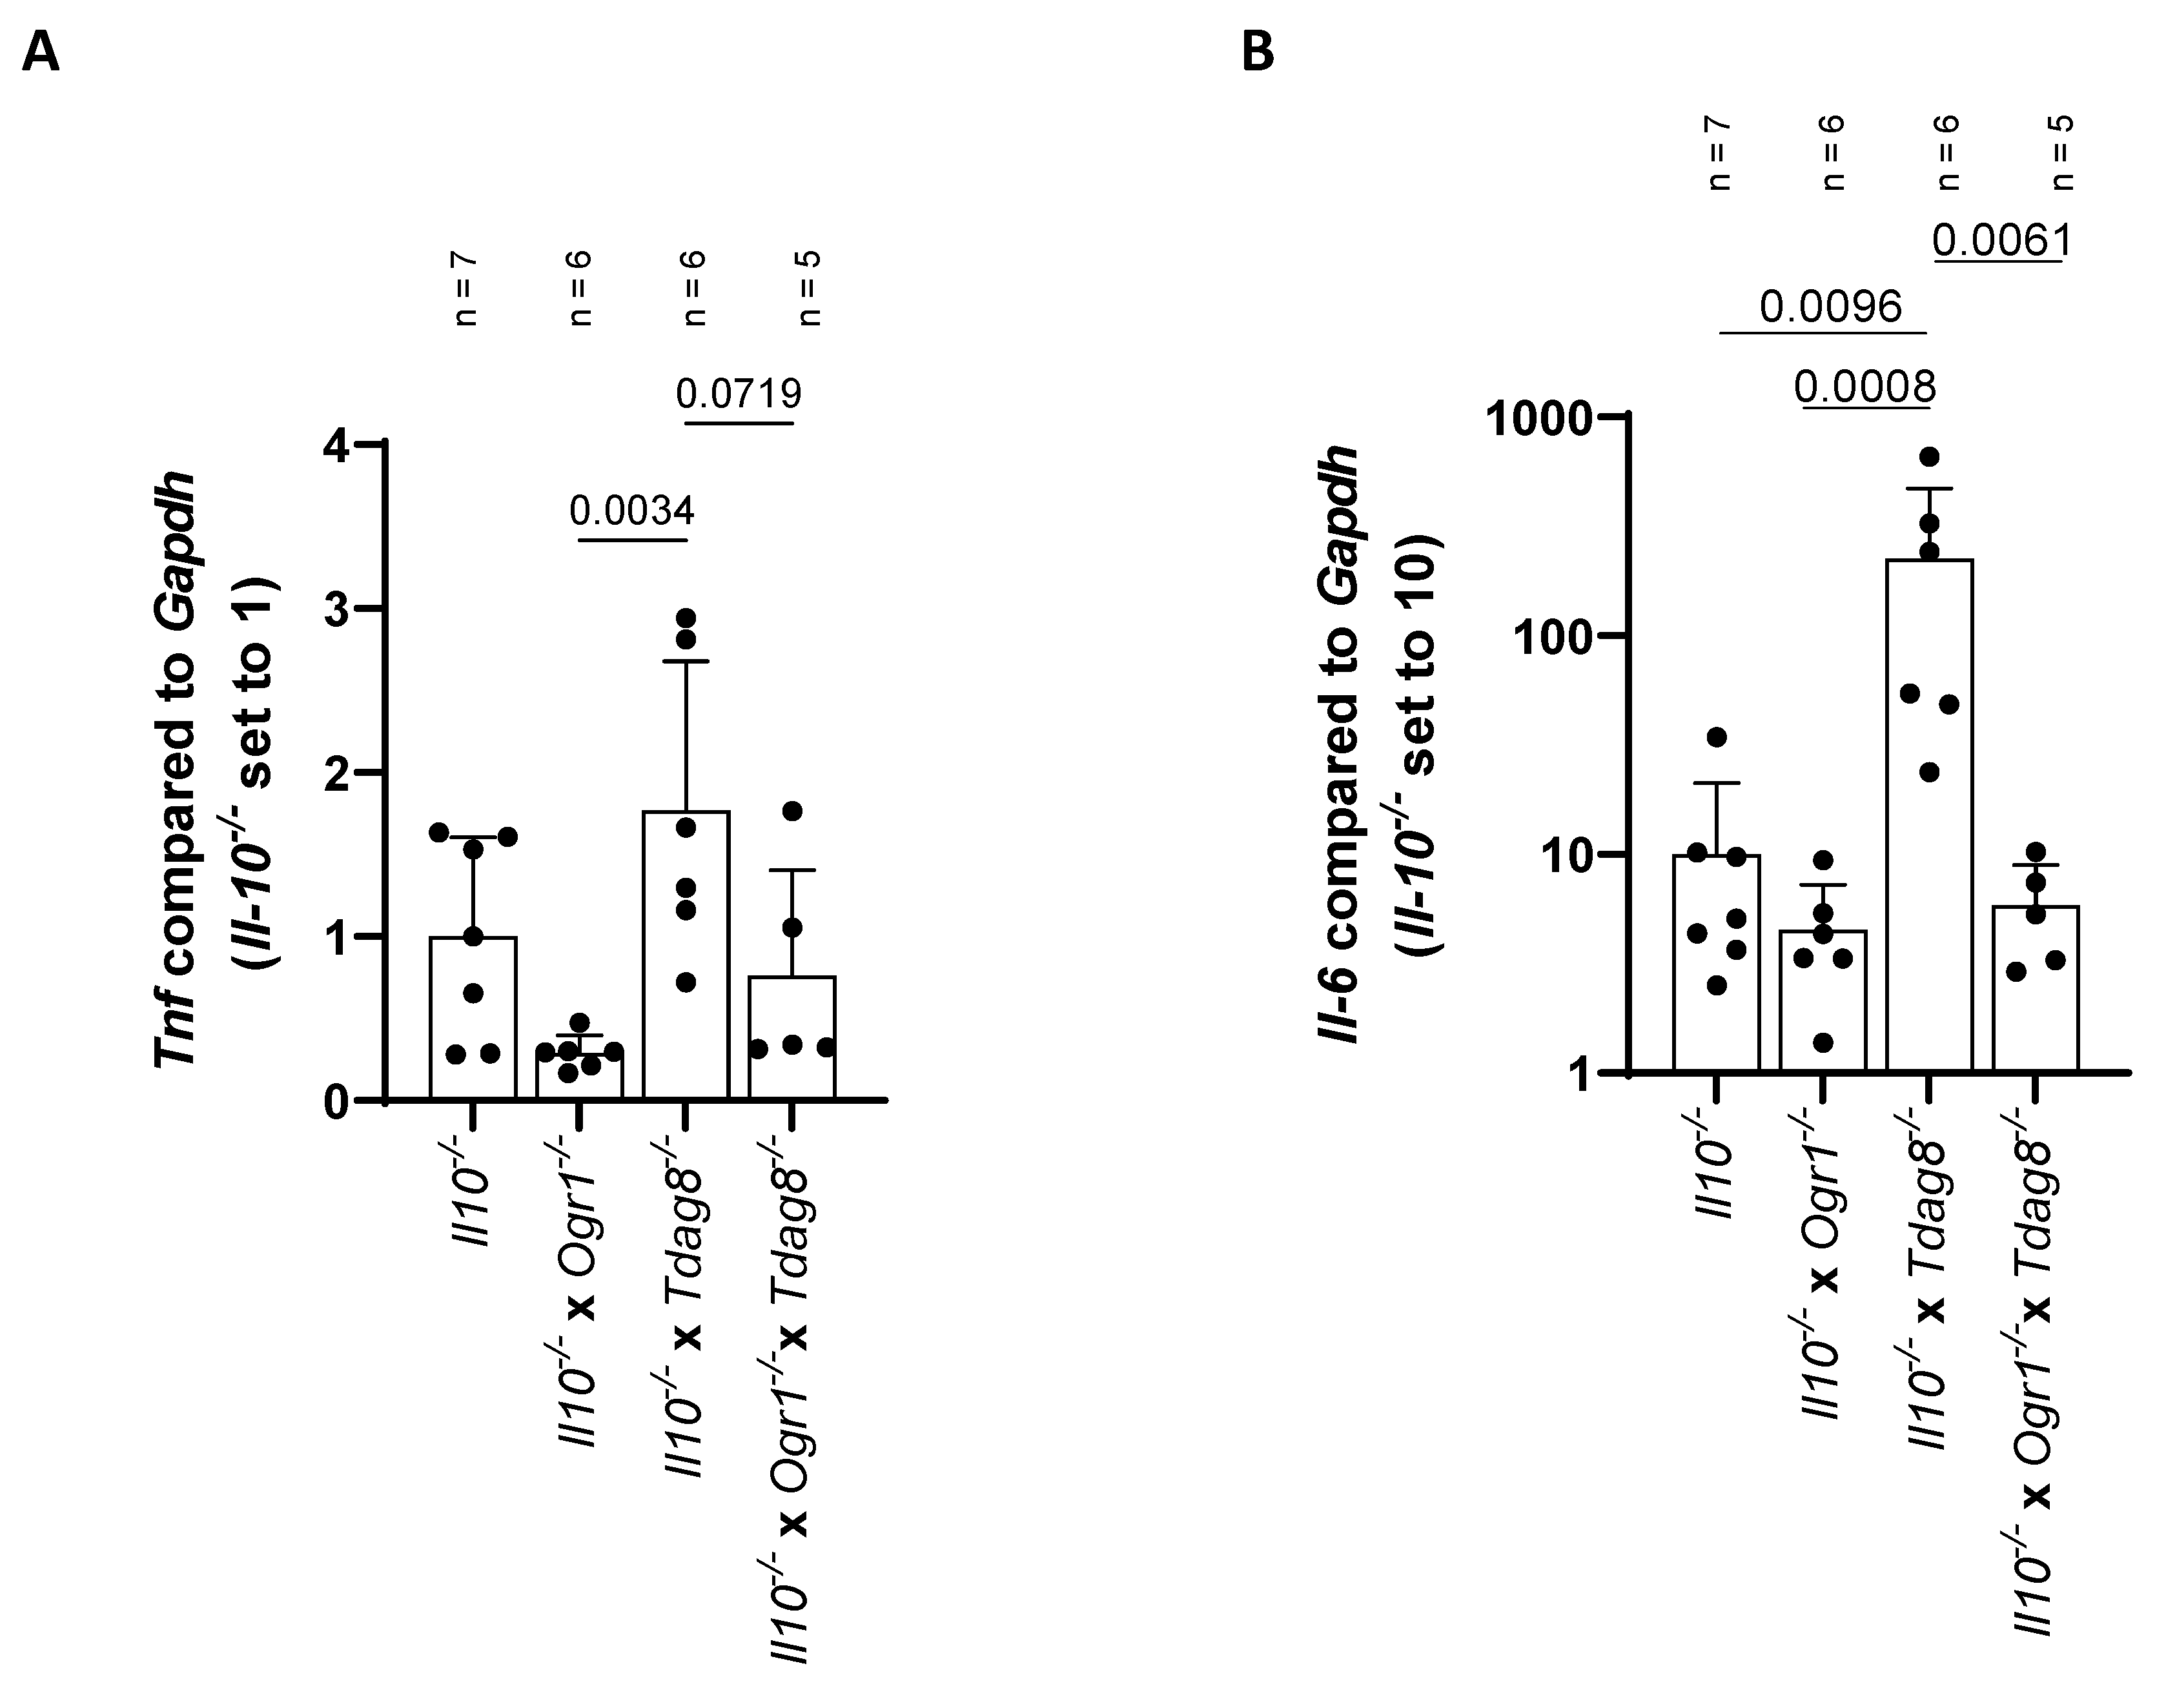
Transcriptional analysis showed a trend towards a decreased expression of Tnf and Il-6 in Il-10−/− × Ogr1−/− mice when compared with Il-10−/− mice (Figure 5A,B). In contrast, Il-10−/− × Tdag8−/− mice showed a significantly increased Il-6 expression compared with Il-10−/− mice (p = 0.0096, Figure 5B). The corresponding increase in Tnf expression was not significant (p = 0.1657, Figure 5A). Interestingly, Il-10−/− × Ogr1−/− × Tdag8−/− mice showed a trend towards a decreased Tnf expression compared with Il-10−/− × Tdag8−/− mice (p = 0.0719) and a significant reduction in Il-6 expression levels (p = 0.0061), suggesting a decreased inflammation in the triple KO mice.

2.4. Ogr1-Deficient Mice Present Decreased Pro-Inflammatory Cell Populations in the Colon Even in the Absence of Tdag8

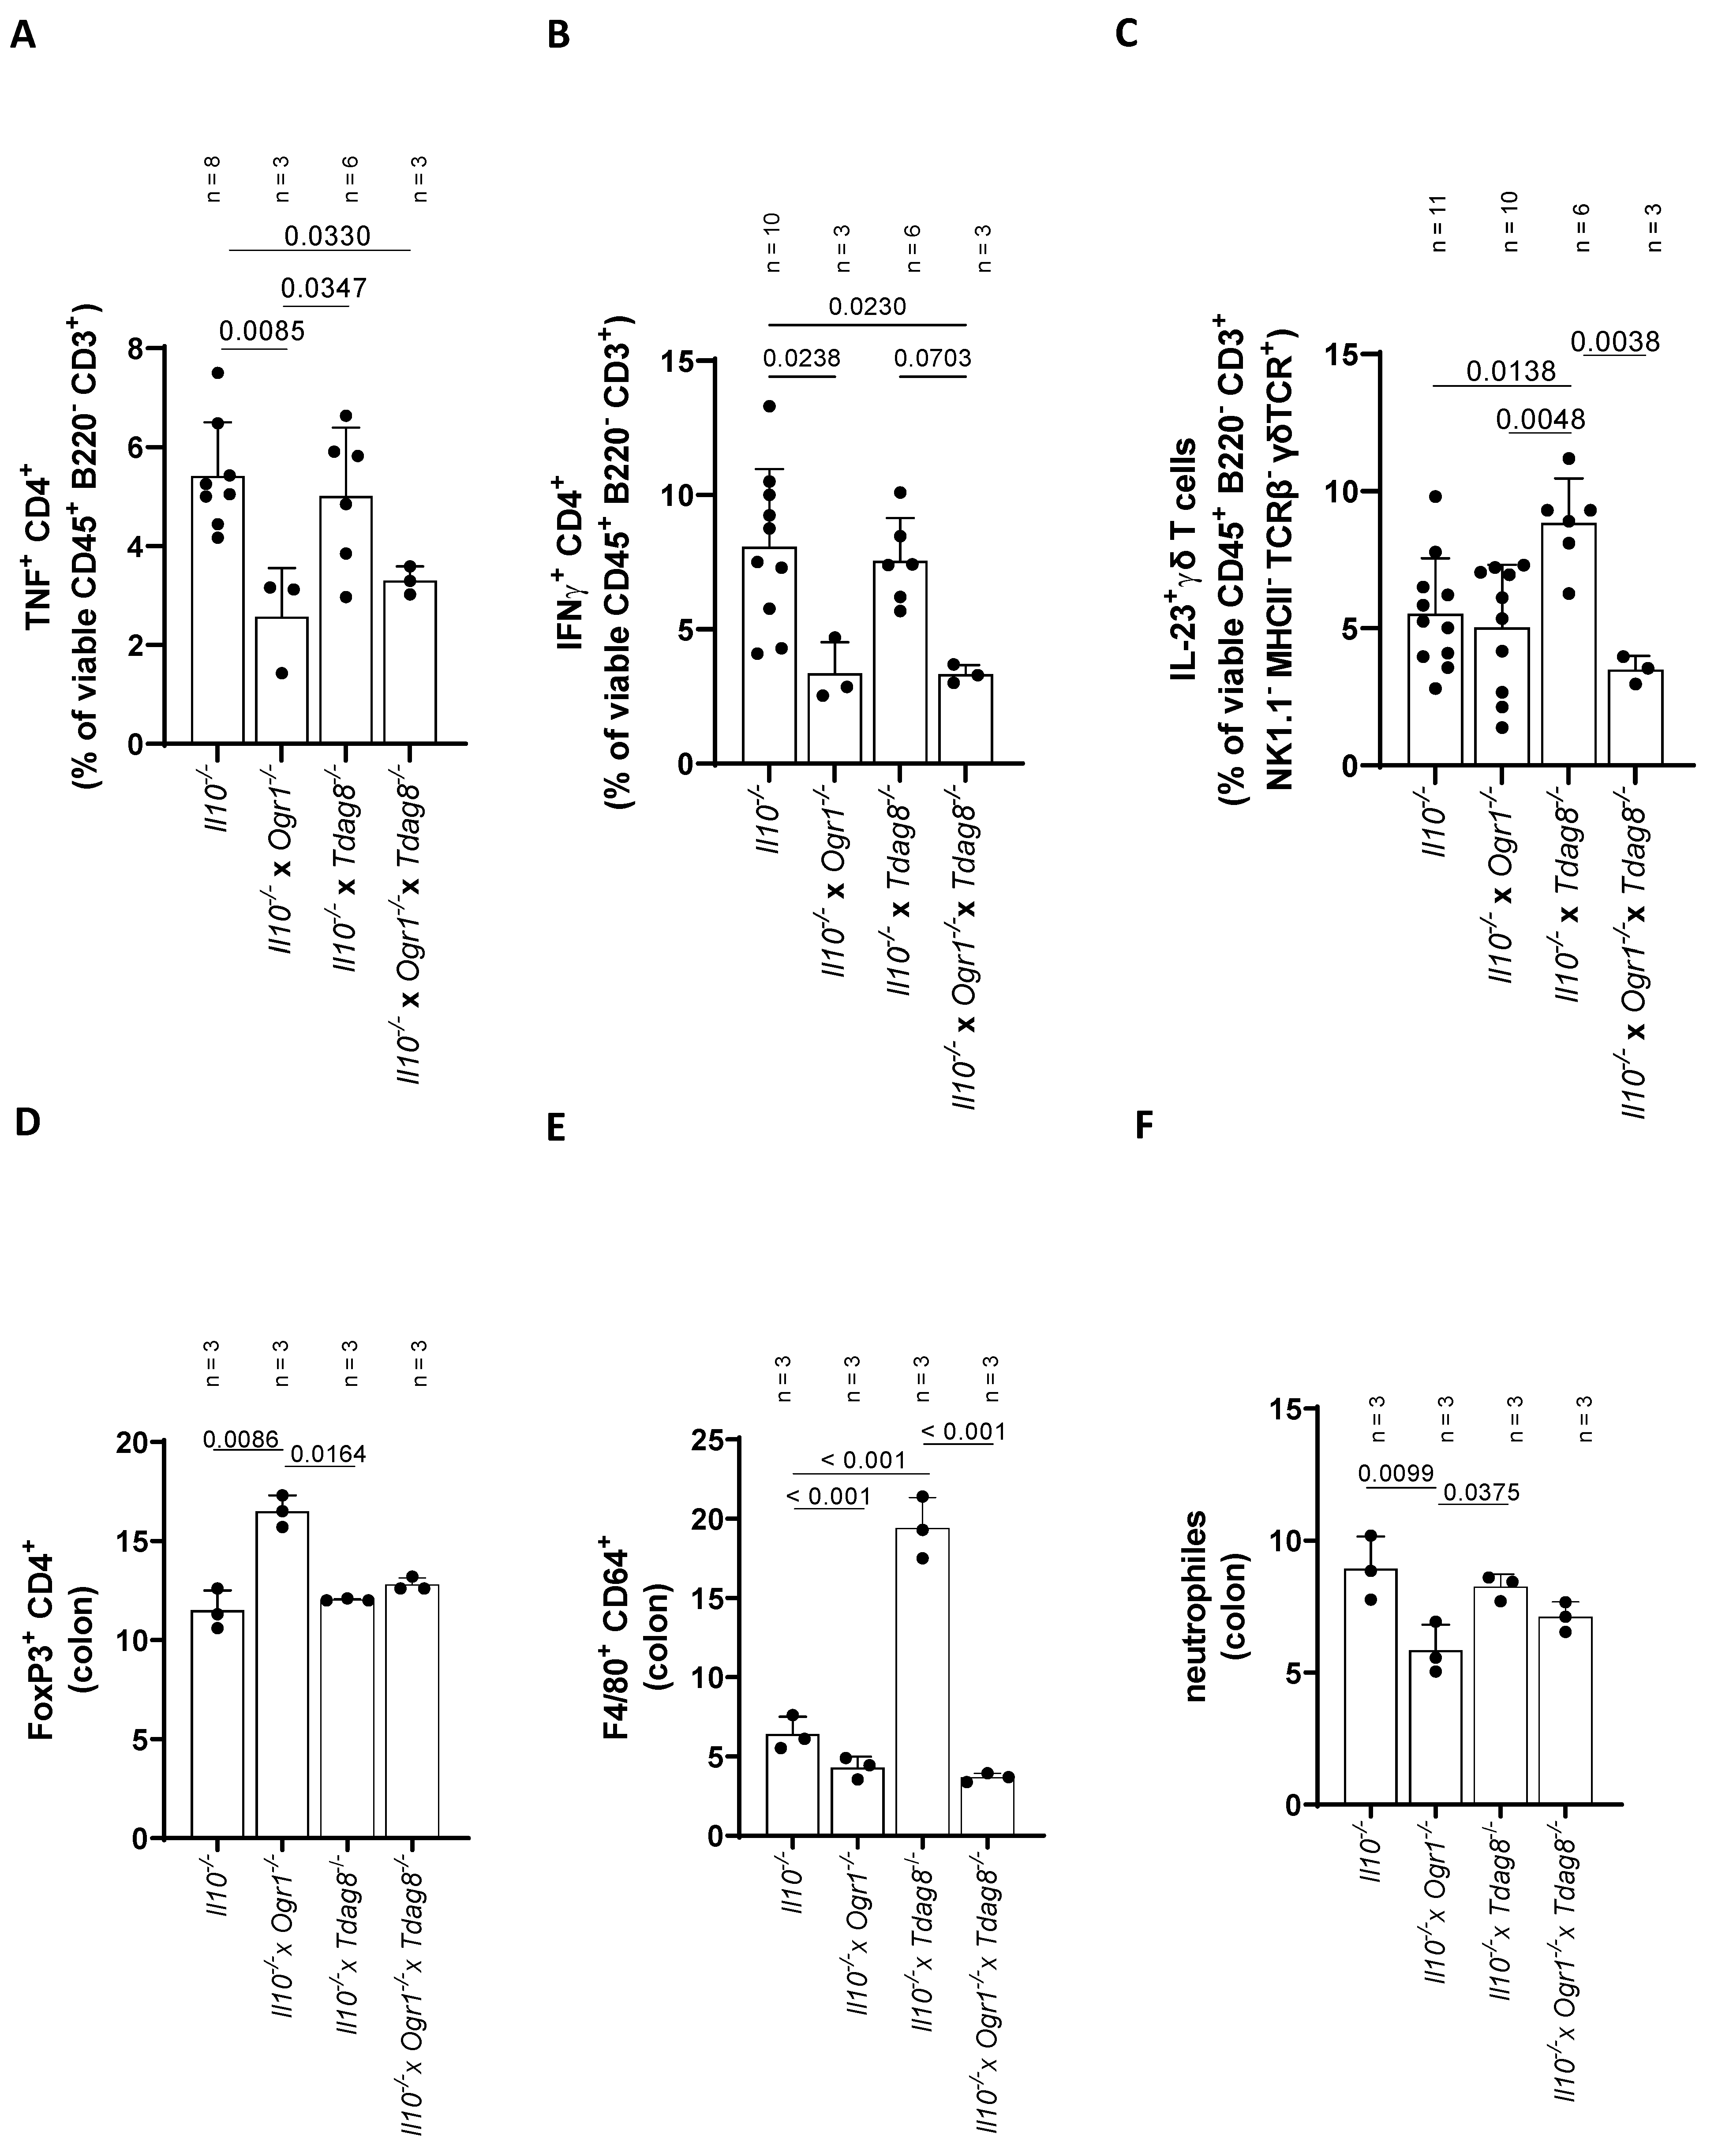
Histological analysis revealed an increased influx of lymphocytes in the colon of Il-10−/− and Il-10−/− × Tdag8−/− mice compared with Il-10−/− × Ogr1−/− and Il-10−/− × Ogr1−/− × Tdag8−/− animals (Figure 4A,B). Subsequently, we focused on the presence of pro-inflammatory T-cell populations in the colon using FACS analysis. The number of TNF+ CD4+ T-cells (Figure 6A and Supplementary Figure S4A) were significantly decreased in colon samples from Ogr1-deficient mice compared with Il-10−/− mice (p = 0.0085), whereas the number of these cells was unaffected in the absence of Tdag8 (Figure 6A). Il-10−/− × Ogr1−/− × Tdag8−/− mice showed a decreased number of TNF+ CD4+ T-cells compared with Il-10−/− mice (p = 0.0330), confirming the data obtained by qPCR analysis. A similar picture emerged when measuring the number of IFN+ CD4+ T-cells (Figure 6B). Il-10−/− × Tdag8−/− mice showed a similar number of IFN+ CD4+ T-cells to Il-10−/− mice and a trend toward an increased number compared with Il-10−/− × Ogr1−/− (p = 0.0726) and Il-10−/− × Ogr1−/− × Tdag8−/− mice (p = 0.0703, Figure 6B). The IL-23 pathway plays a key role in IBD pathogenesis through the promotion of a pathological Th17 response, which in turn has been linked to Tdag8 function. Consequently, we assessed IL-23 in γδT-cells. The number of IL-23+ γδTCR+ T-cells was significantly increased in colon samples from Il-10−/− × Tdag8−/− mice compared with Il-10−/− animals (p = 0.0138, Figure 6C and Supplementary Figure S4B) and deficiency of Ogr1 (Il-10−/− × Ogr1−/− × Tdag8−/− mice) reduced this level back to the corresponding control (Il-10−/− × Tdag8−/− mice, p = 0.0038, Figure 6C). The amount of IL-23+ γδTCR+ T-cells was not increased in Il-10−/− animals compared with Il-10−/− × Ogr1−/− and Il-10−/− × Ogr1−/− × Tdag8−/− mice. The number of γδTCR+ B-cells, Ly6C+ CD11b+ monocytes, and F4/80+ CD64+ macrophages remained unchanged in the colon samples of all genotypes. Subsequently, we analyzed the FoxP3+ CD4+ Treg cell population in the colon (Figure 6D and Supplementary Figure S4C). This population was significantly increased in colon samples from Il-10−/− × Ogr1−/− mice compared with Il-10−/−, and Il-10−/− × Tdag8−/− mice (p < 0.0086, 0.0164, respectively, Figure 6D). We also analyzed the presence of F4/80+ CD64+ macrophages in the colon (Figure 4E and Supplementary Figure S4D). These cells were significantly more prominent in colon samples from Il-10−/− × Tdag8−/− mice compared with Il-10−/−, Il-10−/− × Ogr1−/−, and Il-10−/− × Ogr1−/− × Tdag8−/− mice (p < 0.0001 each, Figure 6E). Further, we determined the presence of the CD11b+ Ly6G+ neutrophil population in the colon (Figure 6F and Supplementary Figure S4D). The number of neutrophils was significantly decreased in colon samples from Il-10−/− × Ogr1−/− mice compared with Il-10−/− and Il-10−/− × Tdag8−/− mice (p = 0.0099 and 0.0375, respectively).
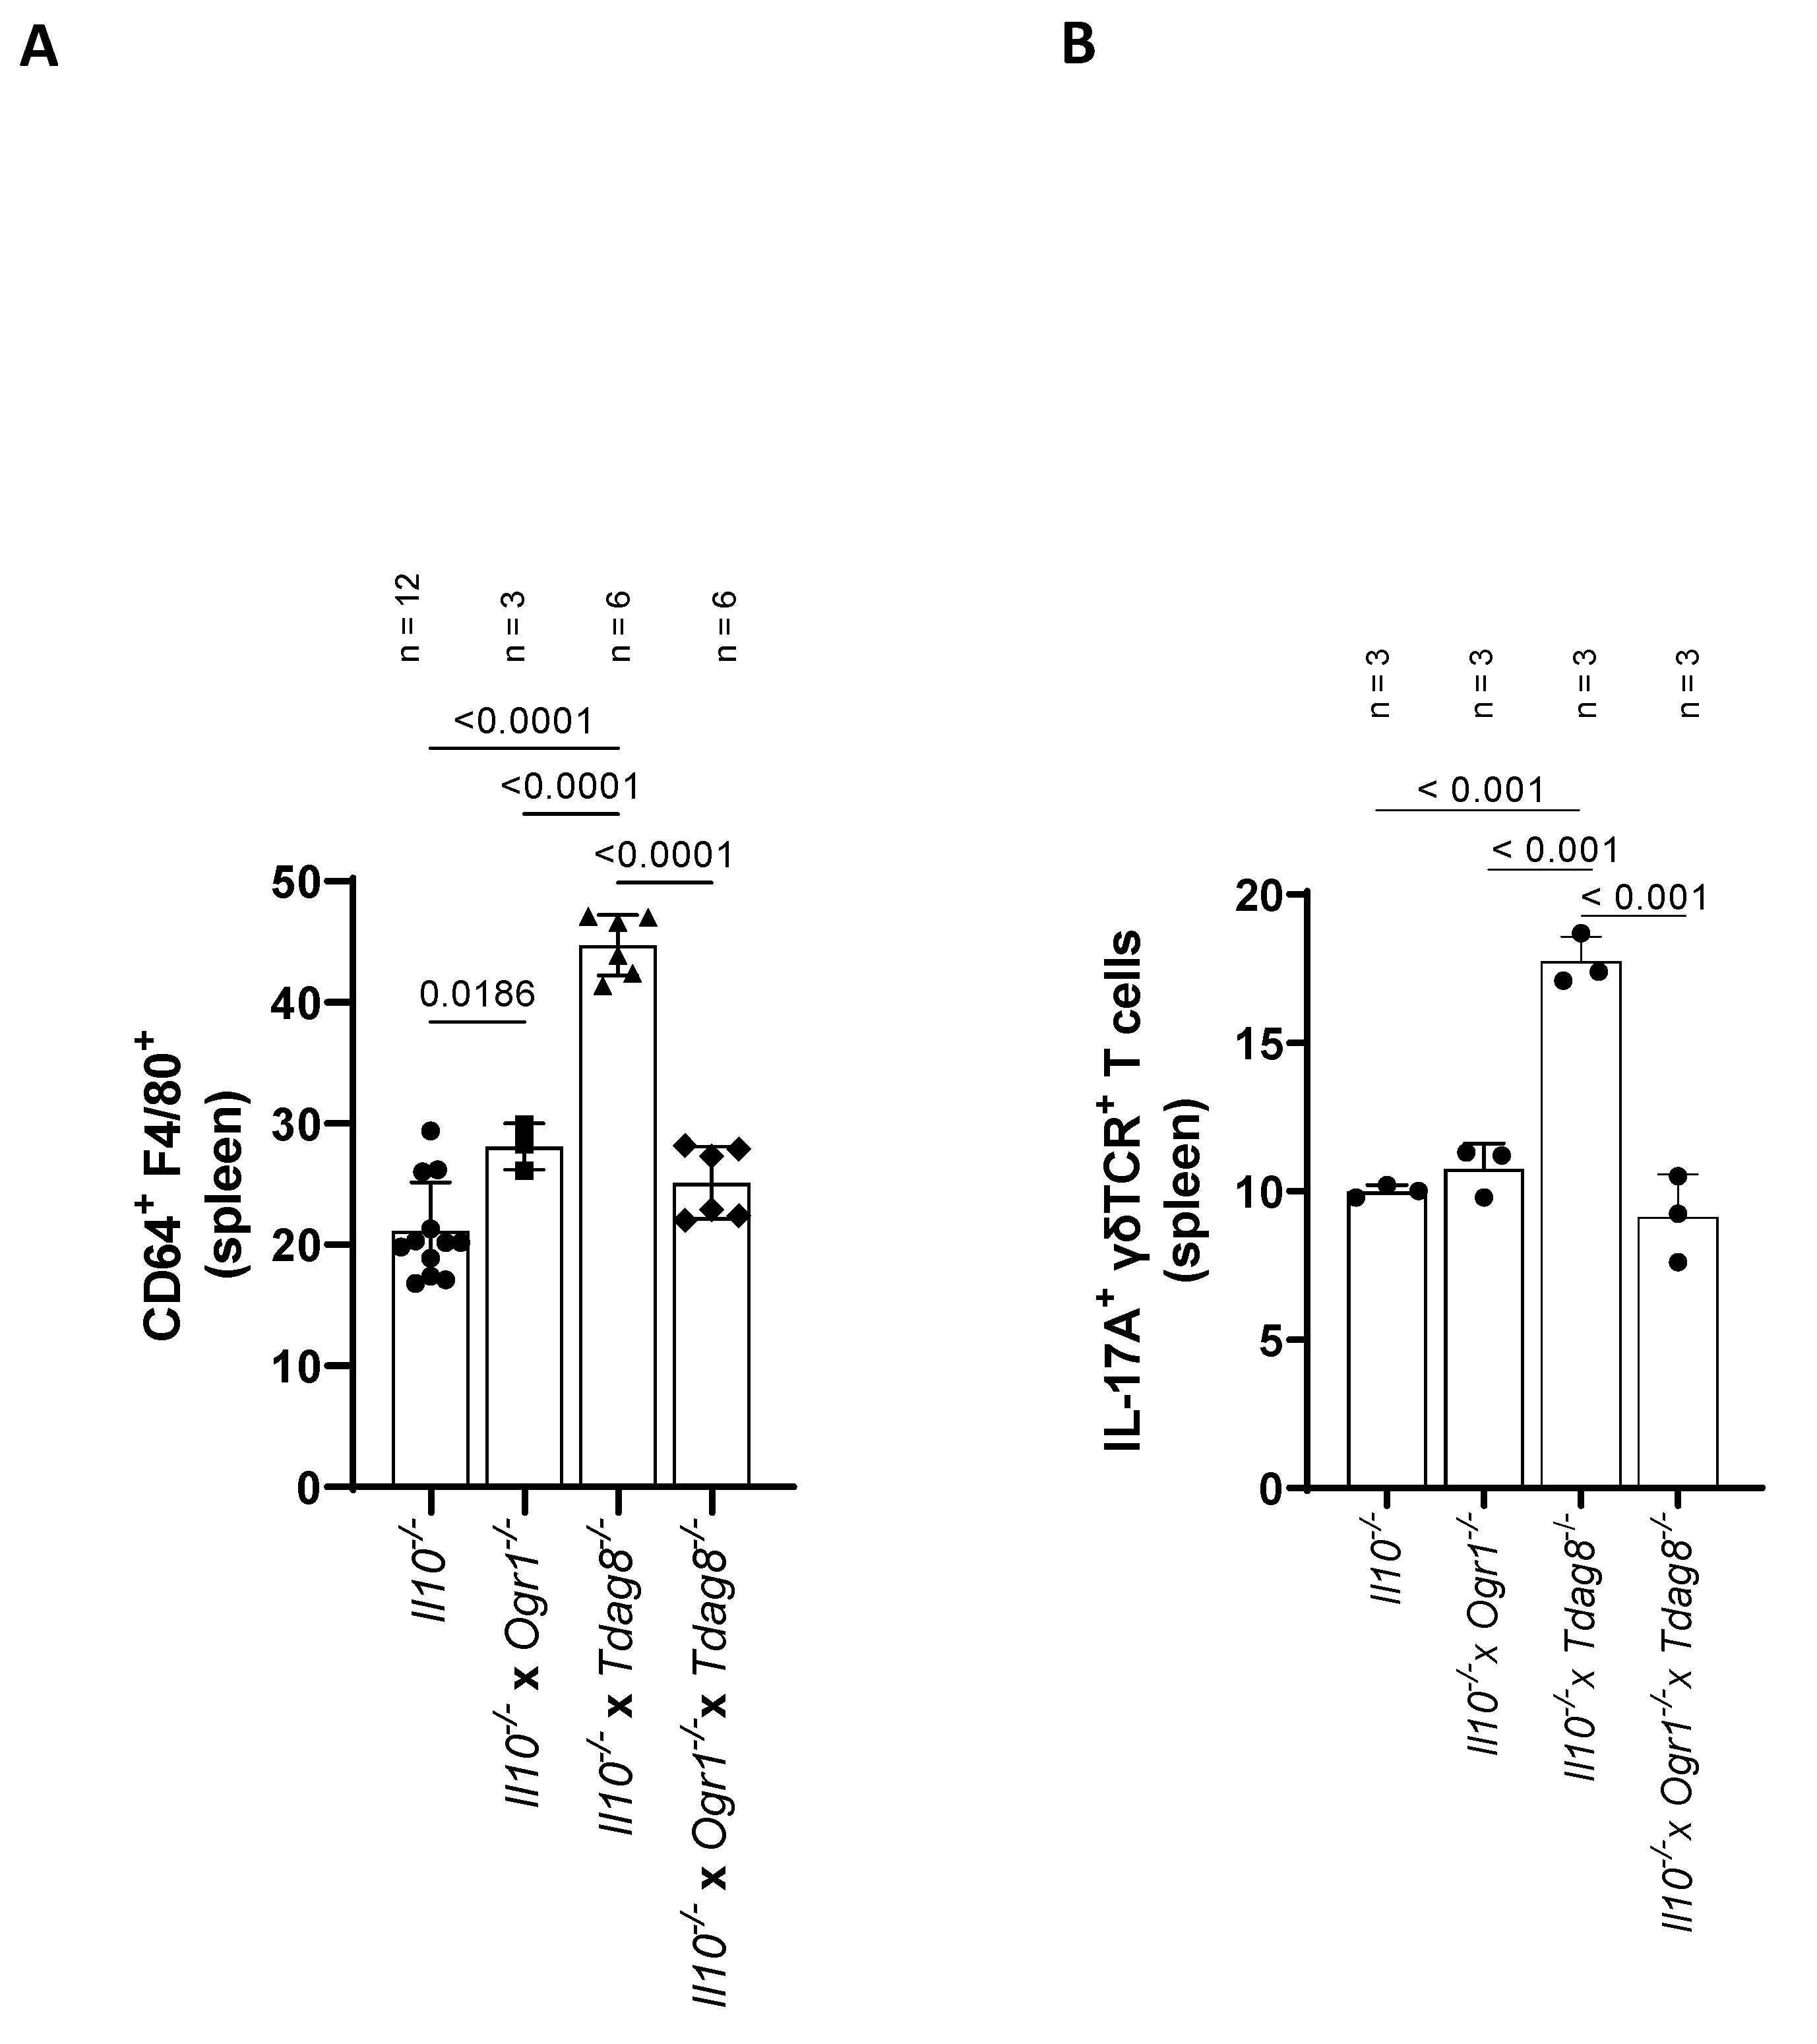
Given the high number of macrophages in Il10−/− × Tdag8−/− mice in the colon, we analyzed this cell population in spleen samples by FACS (Figure 7A and Supplementary Figure S5A). The number of F4/80+ CD64+ macrophages was significantly increased in Il-10−/− × Tdag8−/− mice compared with Il-10−/−, Il-10−/− × Ogr1−/−, and Il-10−/− × Ogr1−/− × Tdag8−/− animals (p < 0.0001 each, Figure 7A). The majority of F4/80+ CD64+ macrophages belong to the CD206+ CD163+ M2c subtype and remained unchanged in all genotypes (Supplementary Figure S5B,C). Since pro-inflammatory IL-17 plays a key role in IBD pathogenesis through the recruitment of monocytes and neutrophils, we also assessed the number of IL-17A+ γδTCR+ T cells (Figure 7B and Supplementary Figure S5D). The number of IL-17A+ cells was significantly increased in spleen samples from Il-10−/− × Tdag8−/− mice compared with Il-10−/−, Il-10−/− × Ogr1−/−, and Il-10−/− × Ogr1−/− × Tdag8−/− mice (p < 0.0001 each, Figure 7B).

3. Discussion

In the present study, we investigated the role of anti-inflammatory TDAG8 and pro-inflammatory OGR1 proton-sensing receptors using well-established murine models of acute and spontaneous colitis. It is interesting to note that in the IL10 deficiency model (spontaneous colitis) the pro-inflammatory effects of TDAG8 deficiency became clearly visible and highly significant. We can therefore state that TDAG8 deficiency exacerbates colonic inflammation already triggered by a lack of IL10. Exacerbation was particularly prominent in overall disease scores and when measuring IL6 and F4/80+ CD64+ macrophages as well as IL23+ γδ T cells in the colon. Spleen weight also reflected exacerbation and macrophages and IL17+ T cells were found increased in spleen. These data are in agreement with the notion that in Il10-receptor-deficiency colonic inflammation is strongly driven by inflammatory macrophages which produce IL6 [40] and thus support increases in IL23 and subsequently Th17 pathology [41,42,43]. Importantly, absence of Ogr1 led to a significant amelioration of inflammation both in the DSS model, as described before [24], and in the Il10 deficiency model, even when Tdag8 was knocked out in addition to IL10. In the latter case, Ogr1 deletion led to significantly decreased levels of Il-6 in the whole colon, and a decreased percentage of IL-23+ γδ T cells and F4/80+ macrophages in the colon and a decrease in both F4/80+ and IL-17A+ splenocytes, compared with IL10−/− × TDAG8−/− littermates. These results demonstrate that deletion of the pro-inflammatory receptor Ogr1 can largely balance out the absence of anti-inflammatory Il-10 and Tdag8.
There is now strong evidence that IBD pathogenesis is driven by IL-23 and its receptor IL-23R which promote a pathological Th17 response [44]. The pH-sensing receptor TDAG8 likely plays a role in this sequence of events. Lactic acidosis stimulates the production of IL-23 by mononuclear phagocytes, promoting the expected Th17 profile [45]. Il-17a was increased in Tdag8-deficient mice in a model of myocardial infarction [46]. It was further shown that TDAG8 promotes Th17 cell pathogenicity [47] and is required for the maintenance of lysosomal function, in particular for autophagy and pathogen defense [48]. An impairment of the function of TDAG8 also enhances antigen presentation of dendritic cells to T-cells, thereby promoting inflammation [49]. TDAG8 is also required for lysosome homeostasis and protein degradation, which play an important role in phagocytosis [49]. In the colon, TDAG8 deficiency or the coding variant I231L, an inflammatory disease-associated variant, promote inflammation and fibrosis by impairing the differentiation of CD4+ T-cells to Th17- and Th22-cells, and enhancing pro-inflammatory cytokines while reducing anti-inflammatory cytokines [12,13,49]. A genetic loss of function in the coding region of TDAG8 was described to affect lysosomal pH, thereby linking lysosomal dysfunction with increased risk of developing colitis [48].
Conversely, OGR1 is induced by hypoxia via hypoxia-inducible factor (HIF)1α and TNF, which are associated with inflammation [23,29]. OGR1-KO mice showed a reduction in the expansion of Th17 and Th1 cells in a murine model of autoimmune encephalomyelitis [50]. OGR1 signaling in immune and stromal cells appears required for production of IL6 and IL23 in inflammation, and the protective effect of Ogr1 deficiency appears to involve the suppression of the IL-23 pathway and therefore the Th17 response in Il-10−/− × Tdag8−/− × Ogr1−/− mice in our study. Of note, OGR1 may also negatively regulate IL-10 production from differentiating CD4+ cells as activation of OGR1 with ogerin resulted in suppression of IL-10 secretion by T cells [51].
Clearly, IL-10 and TDAG8 act on complementary routes to inhibit inflammation, otherwise the exacerbation of disease in Il-10−/− × Tdag8−/− animals observed here would not be measured. Our data as well as other reports suggest that macrophages are key in eliciting colitis in IL10 deficiency [40,41,42,43,52]. It will be interesting to define in greater detail the interplay of these complementary pathways in this cell type. In this context it is worth noting that activation of TDAG8 was described to increase IL-10 secretion in macrophages [53].
This study has several limitations. The DSS-induced colitis model only reflects the immunological situation during acute inflammation, while Il-10-deficient mice are useful in determining long-term effects of ongoing inflammatory initiated spontaneously. In comparison, defining features of IBD include severe and long-lasting mucosal tissue destruction interrupted by gradually shorter remission phases. Further studies are needed to study the effects of the double KO in an animal model that recapitulates the relapsing-remitting pattern of IBD.
Regarding potential new therapeutic approaches in IBD, our data suggest that agonism of TDAG8 may be particularly useful in situations where IL10 signaling is diminished. OGR1 inhibition should be investigated as a therapeutic option generally in IBD, as this pH-sensing receptor appears to sustain inflammation acting on pro-inflammatory pathways that are sensitive to inhibition by IL-10. Inhibition of OGR1 could be of special interest to patients carrying mutations in the CD susceptibility gene TDAG8.

4. Materials and Methods

4.1. Animals

All animal experiments were performed according to the ARRIVE criteria. The generation, breeding, and genotyping of C57BL/6 B6-Gpr68 < tm1Dgen > (Ogr1−/−) and C57BL/6 B6-Gpr65 < tm1Dgen > (Tdag8−/−) mice, initially obtained from Deltagen, Inc., San Mateo, CA, has been described previously [13]. The double KO mice B6-Gpr65 < tm1Dgen> × B6-Gpr68 < tm1Dgen > (Ogr1−/− × Tdag8−/−) were bred from the aforementioned mice and genotyped. The animal experiment protocol was approved by the Veterinary Authority of the canton of Zurich (registration number ZH 113/2021). Littermates were used in all experiments. The animals were co-housed wherever possible and bedding was exchanged among the cages to minimize potential effects of microbiota variation. All the animals were housed in a specific pathogen-free facility. The animals were kept in type II long clear-transparent individually ventilated cages (IVCs, 365 mm × 207 mm × 140 mm, Allentown, NJ, USA) with autoclaved dust-free bedding and tissue papers as nesting material. They were fed a pelleted and extruded mouse diet (R/M–H Extrudat, ssniff Spezialdiäten, Soest, Germany) ad libitum. The light/dark cycle in the room was provided through natural daylight (sunrise: 07:00 h, sunset: 18:00 h). The mice were weighed at 10:00 h every morning. The temperature was set to 21 ± 1 °C, with a relative humidity of 55 ± 5% and 75 complete changes of filtered air per hour (filter: Megalam MD H14, Camfil, Zug, Switzerland).

4.2. DSS-Induced Acute Colitis

Acute colitis was induced in WT, Ogr1−/−, Tdag8−/−, and Ogr1−/− × Tdag8−/− mice by the addition of 2.5% DSS (36–50 kDa, MP Biomedicals, Santa Ana, CA, USA) in the drinking water for eight consecutive days. Mouse body weight and clinical phenotype were assessed daily.

4.3. Spontaneous Il-10 Deficient Colitis Model

B6.129P2-Il10 < tm1Cgn > /J (Il-10−/−) mice were crossed with the above-mentioned strains to generate mice susceptible for spontaneous colitis (Il-10−/−, Ogr1−/− × Il-10−/−, Tdag8−/− × Il-10−/−, and Ogr1−/− × Tdag8−/− × Il-10−/−, n = 17, 13, 8, 9, respectively). Mice were observed for 291 days during which mouse body weight and clinical phenotype were assessed.

4.4. Assessment of Colonoscopy and Histological Score in mice

Prior to endoscopic assessment, the animals were anesthetized intraperitoneally with a mixture of 90–120 mg ketamine (Narketan 10%, Vétoquinol AG, Bern, Switzerland) and 8 mg xylazine (Rompun 2%, Bayer, Zürich, Switzerland) per kg body weight, and examined with the Tele Pack Pal 20043020 (Karl Storz Endoskope, Tuttlingen, Germany). Mice were scored with a MEICS [54]. For the assessment of the histological scores, 1 cm of the distal third of the colon was removed, fixed in paraformaldehyde solution (4% in PBS, Santa Cruz Biotechnology, Santa Cruz, CA, USA), embedded, stained with hematoxylin and eosin (HE), and scored as described [55,56].

4.5. Ribonucleic Acid (RNA) Isolation, Complementary DNA (cDNA) Synthesis, and qPCR

Total RNA was isolated from colon and ileum using the Maxwell RSC simplyRNA tissue kit (Promega, Madison, WI, USA, AS1340). For all samples, lysis buffer from the kit was added to snap frozen resections, and samples were shredded in M tubes (Miltenyi Biotec, Bergisch Gladbach, Germany) using a gentleMACS tissue homogenizer (Miltenyi Biotec). RNA concentration was determined by absorbance at 260 and 280 nm with a NanoDrop (Thermo Fisher Scientific, Waltham, MA, USA). cDNA synthesis was performed using a High-Capacity cDNA Reverse Transcription Kit (Applied Biosystems, Foster City, CA, USA) following the manufacturer’s instructions. qPCR was performed using the TaqMan Fast Universal Master Mix (Applied Biosystems) on a QuantStudio™ 6 Flex Real-Time PCR System and results were analyzed with the SDS software (Applied Biosystems). For each sample, triplicates were measured, and glyceraldehyde-3-phosphate dehydrogenase (Gapdh) was used as endogenous control. Results were analyzed using the ∆∆CT method. The following gene expression assays for mice were used: Tnf Mm00443259_g1 (Thermo Fischer Scientific), Il-6 Mm00446190_m1 (Applied Biosystems), and Gapdh 4352339E.

4.6. FACS

For single-cell FACS analysis, lamina propria lymphocytes and splenocytes were isolated. Surface antigens were stained with a mix of antibodies including a viability marker (Supplementary Table S1) and incubated at 4 °C for 20 min. After washing with phosphate-buffered solution (PBS) and centrifugation, all the samples were fixed. For fixation, BD Cytofix/Cytoperm (554722) and BD Perm/Wash (554723) were used following the manufacturer’s instructions. The pellet was then resuspended in PBS. Intracellular antigens were stained with a mix of antibodies (Supplementary Table S1). Data were acquired on a FACS LSR II Fortessa 4L (BD) and analyzed with the FlowJo software (version 10.2).

4.7. Lamina Propria Lymphocytes Isolation

Following the manufacturer’s instructions, Hanks’ balanced salt solution (HBSS) was prepared from the solid salts (Sigma Aldrich, Burlington, MA, USA, Hanks’ Balanced Salts, H2387-10X1L). The enzyme mix for digestion was prepared as follows: 0.4 mg/mL collagenase type IV (Gibco, Billings, MT, 17104-019) and 0.6 mg/mL dispase (Gibco, 17105-041) were added to 10% fetal calf serum (FCS) low Ig (PAN Biotech, Aidenbach, Germany, P30-2802) in HBSS colorless (Sigma Aldrich, H8264-1L). Cells were isolated from 2 cm of the distal colon per sample. The samples were first transferred in 2 mM EDTA (Sigma Aldrich, 38057-1EA) in HBSS for 15 min at 37 °C while shaking. The supernatant was removed, and the samples were incubated in 2 mM EDTA in HBSS for another 30 min. The supernatant was removed again, and the samples were incubated in warm HBSS before transferring into the previously prepared enzyme mix for digestion and incubated for 20 min at 37 °C while shaking. After incubation, the samples were sheared with the help of a syringe and 18 G needle and then passed through a 70 µm cell strainer. The supernatant was removed after centrifugation, and the cells were resuspended in PBS before staining and fixation.

4.8. Splenocyte Isolation

Spleen samples were cut up, passed through a 70 µm cell strainer with PBS, and centrifuged. The formed pellet was then lysed with 3 mL ACK buffer (NH4Cl 0.15 M, KHCO3 0.01 M, EDTA-Na2 0.001 M) for 3 min at room temperature. After resuspension with PBS, the solution was filtered with a 70 µm cell strainer and centrifuged again. The pellet was then resuspended in PBS before staining and fixing the cells.

4.9. Compensation Controls

Two different bead kits were used for compensation controls: ArC Amine reactive compensation bead kit (Thermo Fisher Scientific, A10346) for the cell viability marker. For the remaining antibodies, the BD CompBeads kit anti-rat and anti-hamster (Becton Dickinson Pharmingen Biosciences, San Diego, CA, USA, 552845), and the BD CompBeads kit anti-mouse (Becton Dickinson Pharmingen Biosciences, 552843) were used. All the compensation controls were prepared following the manufacturer’s instructions.

4.10. Statistical Analysis

Statistical analyses were performed using GraphPad Prism 8 [GraphPad Software], version 9.5.1. (733), with analysis of variance [ANOVA]. Normal distribution was analyzed using the Shapiro–Wilk test, followed by Tukey post hoc test (Figure 3A,D, Figure 4B, Figure 5A, Figure 6B,C,E,F, and Figure 7A,B) or non-parametric Kruskal–Wallis test followed by multiple comparison test with Benjamini, Krieger, and Yekutieli correction (Figure 1A,B,D–F, Figure 2B, Figure 3B,E,F, Figure 5B, and Figure 6A,D). Differences were considered significant at a p-value < 0.05, as indicated in the figures. Results are presented as mean ± standard deviation (SD) or ± standard error of the mean (SEM), as indicated in the figure legends.

Supplementary Materials

The following supporting information can be downloaded at: https://www.mdpi.com/article/10.3390/ijms241914855/s1.

Author Contributions

Conceptualization, G.R.; data curation, L.P., M.B., C.S., F.F., N.W., and M.H.; writing—original draft preparation, L.P., M.B., and M.H.; writing—review and editing, L.P., M.B., C.d.V., K.S., P.A.R., M.H., and G.R.; statistical calculations, Y.M. All authors have read and agreed to the published version of the manuscript.

Funding

This research was funded by Swiss National Science Foundation, grant number 310030_172870 and 314730_153380 to Gerhard Rogler.

Institutional Review Board Statement

The animal experiment protocol was approved by the Veterinary Authority of the canton of Zurich (registration number ZH 113/2021).

Informed Consent Statement

Not applicable.

Data Availability Statement

The data underlying this article are available in a repository provided by the University of Zurich (the link to the repository still needs to be defined).

Conflicts of Interest

The authors declare no conflict of interest.

Abbreviations

cAMPCyclic adenosine monophosphate
CDCrohn’s disease
cDNAComplementary DNA
DSSDextran sodium sulphate
FSCForward scatter
GapdhGlyceraldehyde-3-phosphate dehydrogenase
GPRsG-protein coupled receptors
GPR4G-protein coupled receptor 4
HBSSHanks’ balanced salt solution
HEHematoxylin and eosin
IBDInflammatory bowel disease
IFNγInterferon gamma
ILInterleukin
KOKnockout
MEICSMurine endoscopic index of colitis severity
OGR1Ovarian cancer GPR 1 (GPR68)
PBSPhosphate-buffered solution
qPCRReal-time quantitative polymerase chain reaction
SSCSide scatter
TDAG8 T-cell death-associated gene 8 (GPR65)
TNFTumor necrosis factor
UCUlcerative colitis
WTWildtype

References

  1. Ludwig, M.G.; Vanek, M.; Guerini, D.; Gasser, J.A.; Jones, C.E.; Junker, U.; Hofstetter, H.; Wolf, R.M.; Seuwen, K. Proton-sensing G-protein-coupled receptors. Nature 2003, 425, 93–98. [Google Scholar] [CrossRef] [PubMed]
  2. Ichimonji, I.; Tomura, H.; Mogi, C.; Sato, K.; Aoki, H.; Hisada, T.; Dobashi, K.; Ishizuka, T.; Mori, M.; Okajima, F. Extracellular acidification stimulates IL-6 production and Ca(2+) mobilization through proton-sensing OGR1 receptors in human airway smooth muscle cells. Am. J. Physiol. Lung Cell Mol. Physiol. 2010, 299, L567–L577. [Google Scholar] [CrossRef] [PubMed]
  3. Mogi, C.; Tomura, H.; Tobo, M.; Wang, J.Q.; Damirin, A.; Kon, J.; Komachi, M.; Hashimoto, K.; Sato, K.; Okajima, F. Sphingosylphosphorylcholine antagonizes proton-sensing ovarian cancer G-protein-coupled receptor 1 (OGR1)-mediated inositol phosphate production and cAMP accumulation. J. Pharmacol. Sci. 2005, 99, 160–167. [Google Scholar] [CrossRef] [PubMed]
  4. Ishii, S.; Kihara, Y.; Shimizu, T. Identification of T cell death-associated gene 8 (TDAG8) as a novel acid sensing G-protein-coupled receptor. J. Biol. Chem. 2005, 280, 9083–9087. [Google Scholar] [CrossRef] [PubMed]
  5. Mogi, C.; Tobo, M.; Tomura, H.; Murata, N.; He, X.D.; Sato, K.; Kimura, T.; Ishizuka, T.; Sasaki, T.; Sato, T.; et al. Involvement of proton-sensing TDAG8 in extracellular acidification-induced inhibition of proinflammatory cytokine production in peritoneal macrophages. J. Immunol. 2009, 182, 3243–3251. [Google Scholar] [CrossRef] [PubMed]
  6. Wang, J.Q.; Kon, J.; Mogi, C.; Tobo, M.; Damirin, A.; Sato, K.; Komachi, M.; Malchinkhuu, E.; Murata, N.; Kimura, T.; et al. TDAG8 is a proton-sensing and psychosine-sensitive G-protein-coupled receptor. J. Biol. Chem. 2004, 279, 45626–45633. [Google Scholar] [CrossRef] [PubMed]
  7. Imenez Silva, P.H.; Wagner, C.A. Physiological relevance of proton-activated GPCRs. Pflugers Arch. 2022, 474, 487–504. [Google Scholar] [CrossRef]
  8. Tomura, H.; Mogi, C.; Sato, K.; Okajima, F. Proton-sensing and lysolipid-sensitive G-protein-coupled receptors: A novel type of multi-functional receptors. Cell Signal. 2005, 17, 1466–1476. [Google Scholar] [CrossRef]
  9. Kottyan, L.C.; Collier, A.R.; Cao, K.H.; Niese, K.A.; Hedgebeth, M.; Radu, C.G.; Witte, O.N.; Khurana Hershey, G.K.; Rothenberg, M.E.; Zimmermann, N. Eosinophil viability is increased by acidic pH in a cAMP- and GPR65-dependent manner. Blood 2009, 114, 2774–2782. [Google Scholar] [CrossRef]
  10. Tan, J.K.; McKenzie, C.; Marino, E.; Macia, L.; Mackay, C.R. Metabolite-Sensing G Protein-Coupled Receptors-Facilitators of Diet-Related Immune Regulation. Annu. Rev. Immunol. 2017, 35, 371–402. [Google Scholar] [CrossRef]
  11. Zhu, X.; Mose, E.; Hogan, S.P.; Zimmermann, N. Differential eosinophil and mast cell regulation: Mast cell viability and accumulation in inflammatory tissue are independent of proton-sensing receptor GPR65. Am. J. Physiol. Gastrointest. Liver Physiol. 2014, 306, G974–G982. [Google Scholar] [CrossRef] [PubMed]
  12. Marie, M.A.; Sanderlin, E.J.; Satturwar, S.; Hong, H.; Lertpiriyapong, K.; Donthi, D.; Yang, L.V. GPR65 (TDAG8) inhibits intestinal inflammation and colitis-associated colorectal cancer development in experimental mouse models. Biochim. Biophys. Acta Mol. Basis Dis. 2022, 1868, 166288. [Google Scholar] [CrossRef] [PubMed]
  13. Tcymbarevich, I.; Richards, S.M.; Russo, G.; Kuhn-Georgijevic, J.; Cosin-Roger, J.; Baebler, K.; Lang, S.; Bengs, S.; Atrott, K.; Bettoni, C.; et al. Lack of the pH-sensing Receptor TDAG8 [GPR65] in Macrophages Plays a Detrimental Role in Murine Models of Inflammatory Bowel Disease. J. Crohns Colitis 2019, 13, 245–258. [Google Scholar] [CrossRef]
  14. Jin, Y.; Sato, K.; Tobo, A.; Mogi, C.; Tobo, M.; Murata, N.; Ishii, S.; Im, D.S.; Okajima, F. Inhibition of interleukin-1beta production by extracellular acidification through the TDAG8/cAMP pathway in mouse microglia. J. Neurochem. 2014, 129, 683–695. [Google Scholar] [CrossRef] [PubMed]
  15. Hikiji, H.; Endo, D.; Horie, K.; Harayama, T.; Akahoshi, N.; Igarashi, H.; Kihara, Y.; Yanagida, K.; Takeda, J.; Koji, T.; et al. TDAG8 activation inhibits osteoclastic bone resorption. FASEB J. 2014, 28, 871–879. [Google Scholar] [CrossRef] [PubMed]
  16. Onozawa, Y.; Komai, T.; Oda, T. Activation of T cell death-associated gene 8 attenuates inflammation by negatively regulating the function of inflammatory cells. Eur. J. Pharmacol. 2011, 654, 315–319. [Google Scholar] [CrossRef] [PubMed]
  17. Franke, A.; McGovern, D.P.; Barrett, J.C.; Wang, K.; Radford-Smith, G.L.; Ahmad, T.; Lees, C.W.; Balschun, T.; Lee, J.; Roberts, R.; et al. Genome-wide meta-analysis increases to 71 the number of confirmed Crohn’s disease susceptibility loci. Nat. Genet. 2010, 42, 1118–1125. [Google Scholar] [CrossRef]
  18. Hardin, M.; Cho, M.; McDonald, M.L.; Beaty, T.; Ramsdell, J.; Bhatt, S.; van Beek, E.J.; Make, B.J.; Crapo, J.D.; Silverman, E.K.; et al. The clinical and genetic features of COPD-asthma overlap syndrome. Eur. Respir. J. 2014, 44, 341–350. [Google Scholar] [CrossRef]
  19. Hussman, J.P.; Beecham, A.H.; Schmidt, M.; Martin, E.R.; McCauley, J.L.; Vance, J.M.; Haines, J.L.; Pericak-Vance, M.A. GWAS analysis implicates NF-kappaB-mediated induction of inflammatory T cells in multiple sclerosis. Genes Immun. 2016, 17, 305–312. [Google Scholar] [CrossRef]
  20. International Genetics of Ankylosing Spondylitis Consortium; Cortes, A.; Hadler, J.; Pointon, J.P.; Robinson, P.C.; Karaderi, T.; Leo, P.; Cremin, K.; Pryce, K.; Harris, J.; et al. Identification of multiple risk variants for ankylosing spondylitis through high-density genotyping of immune-related loci. Nat. Genet. 2013, 45, 730–738. [Google Scholar] [CrossRef]
  21. Jostins, L.; Ripke, S.; Weersma, R.K.; Duerr, R.H.; McGovern, D.P.; Hui, K.Y.; Lee, J.C.; Schumm, L.P.; Sharma, Y.; Anderson, C.A.; et al. Host-microbe interactions have shaped the genetic architecture of inflammatory bowel disease. Nature 2012, 491, 119–124. [Google Scholar] [CrossRef] [PubMed]
  22. de Valliere, C.; Cosin-Roger, J.; Baebler, K.; Schoepflin, A.; Mamie, C.; Mollet, M.; Schuler, C.; Bengs, S.; Lang, S.; Scharl, M.; et al. pH-Sensing G Protein-Coupled Receptor OGR1 (GPR68) Expression and Activation Increases in Intestinal Inflammation and Fibrosis. Int. J. Mol. Sci. 2022, 23, 1419. [Google Scholar] [CrossRef] [PubMed]
  23. de Valliere, C.; Wang, Y.; Eloranta, J.J.; Vidal, S.; Clay, I.; Spalinger, M.R.; Tcymbarevich, I.; Terhalle, A.; Ludwig, M.G.; Suply, T.; et al. G Protein-coupled pH-sensing Receptor OGR1 Is a Regulator of Intestinal Inflammation. Inflamm. Bowel Dis. 2015, 21, 1269–1281. [Google Scholar] [CrossRef] [PubMed]
  24. de Valliere, C.; Babler, K.; Busenhart, P.; Schwarzfischer, M.; Maeyashiki, C.; Schuler, C.; Atrott, K.; Lang, S.; Spalinger, M.R.; Scharl, M.; et al. A Novel OGR1 (GPR68) Inhibitor Attenuates Inflammation in Murine Models of Colitis. Inflamm. Intest. Dis. 2021, 6, 140–153. [Google Scholar] [CrossRef]
  25. Li, J.; Guo, B.; Wang, J.; Cheng, X.; Xu, Y.; Sang, J. Ovarian cancer G protein coupled receptor 1 suppresses cell migration of MCF7 breast cancer cells via a Galpha12/13-Rho-Rac1 pathway. J. Mol. Signal. 2013, 8, 6. [Google Scholar] [CrossRef] [PubMed]
  26. Wei, W.C.; Bianchi, F.; Wang, Y.K.; Tang, M.J.; Ye, H.; Glitsch, M.D. Coincidence Detection of Membrane Stretch and Extracellular pH by the Proton-Sensing Receptor OGR1 (GPR68). Curr. Biol. 2018, 28, 3815–3823.e4. [Google Scholar] [CrossRef]
  27. Wiley, S.Z.; Sriram, K.; Liang, W.; Chang, S.E.; French, R.; McCann, T.; Sicklick, J.; Nishihara, H.; Lowy, A.M.; Insel, P.A. GPR68, a proton-sensing GPCR, mediates interaction of cancer-associated fibroblasts and cancer cells. FASEB J. 2018, 32, 1170–1183. [Google Scholar] [CrossRef]
  28. Hutter, S.; van Haaften, W.T.; Hunerwadel, A.; Baebler, K.; Herfarth, N.; Raselli, T.; Mamie, C.; Misselwitz, B.; Rogler, G.; Weder, B.; et al. Intestinal Activation of pH-Sensing Receptor OGR1 [GPR68] Contributes to Fibrogenesis. J. Crohns Colitis 2018, 12, 1348–1358. [Google Scholar] [CrossRef]
  29. de Valliere, C.; Cosin-Roger, J.; Simmen, S.; Atrott, K.; Melhem, H.; Zeitz, J.; Madanchi, M.; Tcymbarevich, I.; Fried, M.; Kullak-Ublick, G.A.; et al. Hypoxia Positively Regulates the Expression of pH-Sensing G-Protein-Coupled Receptor OGR1 (GPR68). Cell Mol. Gastroenterol. Hepatol. 2016, 2, 796–810. [Google Scholar] [CrossRef]
  30. Maeyashiki, C.; Melhem, H.; Hering, L.; Baebler, K.; Cosin-Roger, J.; Schefer, F.; Weder, B.; Hausmann, M.; Scharl, M.; Rogler, G.; et al. Activation of pH-Sensing Receptor OGR1 (GPR68) Induces ER Stress Via the IRE1alpha/JNK Pathway in an Intestinal Epithelial Cell Model. Sci. Rep. 2020, 10, 1438. [Google Scholar] [CrossRef]
  31. Seuwen, K.; Ludwig, M.G.; Wolf, R.M. Receptors for protons or lipid messengers or both? J. Recept. Signal. Transduct. Res. 2006, 26, 599–610. [Google Scholar] [CrossRef] [PubMed]
  32. de Valliere, C.; Vidal, S.; Clay, I.; Jurisic, G.; Tcymbarevich, I.; Lang, S.; Ludwig, M.G.; Okoniewski, M.; Eloranta, J.J.; Kullak-Ublick, G.A.; et al. The pH-sensing receptor OGR1 improves barrier function of epithelial cells and inhibits migration in an acidic environment. Am. J. Physiol. Gastrointest. Liver Physiol. 2015, 309, G475–G490. [Google Scholar] [CrossRef] [PubMed]
  33. Collaborators, G.B.D.I.B.D. The global, regional, and national burden of inflammatory bowel disease in 195 countries and territories, 1990–2017: A systematic analysis for the Global Burden of Disease Study 2017. Lancet Gastroenterol. Hepatol. 2020, 5, 17–30. [Google Scholar]
  34. Lee, M.; Chang, E.B. Inflammatory Bowel Diseases (IBD) and the Microbiome-Searching the Crime Scene for Clues. Gastroenterology 2021, 160, 524–537. [Google Scholar] [CrossRef]
  35. Nakase, H. Treatment of inflammatory bowel disease from the immunological perspective. Immunol. Med. 2020, 43, 79–86. [Google Scholar] [CrossRef]
  36. Fallingborg, J.; Christensen, L.A.; Jacobsen, B.A.; Rasmussen, S.N. Very low intraluminal colonic pH in patients with active ulcerative colitis. Dig. Dis. Sci. 1993, 38, 1989–1993. [Google Scholar] [CrossRef]
  37. Nugent, S.G.; Kumar, D.; Rampton, D.S.; Evans, D.F. Intestinal luminal pH in inflammatory bowel disease: Possible determinants and implications for therapy with aminosalicylates and other drugs. Gut 2001, 48, 571–577. [Google Scholar] [CrossRef]
  38. Vernia, P.; Caprilli, R.; Latella, G.; Barbetti, F.; Magliocca, F.M.; Cittadini, M. Fecal lactate and ulcerative colitis. Gastroenterology 1988, 95, 1564–1568. [Google Scholar] [CrossRef]
  39. Boedtkjer, E.; Pedersen, S.F. The Acidic Tumor Microenvironment as a Driver of Cancer. Annu. Rev. Physiol. 2020, 82, 103–126. [Google Scholar] [CrossRef]
  40. Shouval, D.S.; Biswas, A.; Goettel, J.A.; McCann, K.; Conaway, E.; Redhu, N.S.; Mascanfroni, I.D.; Al Adham, Z.; Lavoie, S.; Ibourk, M.; et al. Interleukin-10 receptor signaling in innate immune cells regulates mucosal immune tolerance and anti-inflammatory macrophage function. Immunity 2014, 40, 706–719. [Google Scholar] [CrossRef]
  41. Redhu, N.S.; Bakthavatchalu, V.; Conaway, E.A.; Shouval, D.S.; Tsou, A.; Goettel, J.A.; Biswas, A.; Wang, C.; Field, M.; Muller, W.; et al. Macrophage dysfunction initiates colitis during weaning of infant mice lacking the interleukin-10 receptor. Elife 2017, 6, e27652. [Google Scholar] [CrossRef] [PubMed]
  42. Patik, I.; Redhu, N.S.; Eran, A.; Bao, B.; Nandy, A.; Tang, Y.; El Sayed, S.; Shen, Z.; Glickman, J.; Fox, J.G.; et al. The IL-10 receptor inhibits cell extrinsic signals necessary for STAT1-dependent macrophage accumulation during colitis. Mucosal. Immunol. 2023, 16, 233–249. [Google Scholar] [CrossRef] [PubMed]
  43. Ma, S.; Zhang, J.; Liu, H.; Li, S.; Wang, Q. The Role of Tissue-Resident Macrophages in the Development and Treatment of Inflammatory Bowel Disease. Front. Cell Dev. Biol. 2022, 10, 896591. [Google Scholar] [CrossRef] [PubMed]
  44. McGovern, D.; Powrie, F. The IL23 axis plays a key role in the pathogenesis of IBD. Gut 2007, 56, 1333–1336. [Google Scholar] [CrossRef] [PubMed]
  45. Shime, H.; Yabu, M.; Akazawa, T.; Kodama, K.; Matsumoto, M.; Seya, T.; Inoue, N. Tumor-secreted lactic acid promotes IL-23/IL-17 proinflammatory pathway. J. Immunol. 2008, 180, 7175–7183. [Google Scholar] [CrossRef] [PubMed]
  46. Nagasaka, A.; Mogi, C.; Ono, H.; Nishi, T.; Horii, Y.; Ohba, Y.; Sato, K.; Nakaya, M.; Okajima, F.; Kurose, H. The proton-sensing G protein-coupled receptor T-cell death-associated gene 8 (TDAG8) shows cardioprotective effects against myocardial infarction. Sci. Rep. 2017, 7, 7812. [Google Scholar] [CrossRef]
  47. Gaublomme, J.T.; Yosef, N.; Lee, Y.; Gertner, R.S.; Yang, L.V.; Wu, C.; Pandolfi, P.P.; Mak, T.; Satija, R.; Shalek, A.K.; et al. Single-Cell Genomics Unveils Critical Regulators of Th17 Cell Pathogenicity. Cell 2015, 163, 1400–1412. [Google Scholar] [CrossRef]
  48. Lassen, K.G.; McKenzie, C.I.; Mari, M.; Murano, T.; Begun, J.; Baxt, L.A.; Goel, G.; Villablanca, E.J.; Kuo, S.Y.; Huang, H.; et al. Genetic Coding Variant in GPR65 Alters Lysosomal pH and Links Lysosomal Dysfunction with Colitis Risk. Immunity 2016, 44, 1392–1405. [Google Scholar] [CrossRef]
  49. Chen, X.; Jaiswal, A.; Costliow, Z.; Herbst, P.; Creasey, E.A.; Oshiro-Rapley, N.; Daly, M.J.; Carey, K.L.; Graham, D.B.; Xavier, R.J. pH sensing controls tissue inflammation by modulating cellular metabolism and endo-lysosomal function of immune cells. Nat. Immunol. 2022, 23, 1063–1075. [Google Scholar] [CrossRef]
  50. D’Souza, C.A.; Zhao, F.L.; Li, X.; Xu, Y.; Dunn, S.E.; Zhang, L. OGR1/GPR68 Modulates the Severity of Experimental Autoimmune Encephalomyelitis and Regulates Nitric Oxide Production by Macrophages. PLoS ONE 2016, 11, e0148439. [Google Scholar] [CrossRef]
  51. McAleer, J.P.; Fan, J.; Roar, B.; Primerano, D.A.; Denvir, J. Cytokine Regulation in Human CD4 T Cells by the Aryl Hydrocarbon Receptor and Gq-Coupled Receptors. Sci. Rep. 2018, 8, 10954. [Google Scholar] [CrossRef] [PubMed]
  52. El Sayed, S.; Patik, I.; Redhu, N.S.; Glickman, J.N.; Karagiannis, K.; El Naenaeey, E.S.Y.; Elmowalid, G.A.; Abd El Wahab, A.M.; Snapper, S.B.; Horwitz, B.H. CCR2 promotes monocyte recruitment and intestinal inflammation in mice lacking the interleukin-10 receptor. Sci. Rep. 2022, 12, 452. [Google Scholar] [CrossRef] [PubMed]
  53. Onozawa, Y.; Fujita, Y.; Kuwabara, H.; Nagasaki, M.; Komai, T.; Oda, T. Activation of T cell death-associated gene 8 regulates the cytokine production of T cells and macrophages in vitro. Eur. J. Pharmacol. 2012, 683, 325–331. [Google Scholar] [CrossRef] [PubMed]
  54. Becker, C.; Fantini, M.C.; Wirtz, S.; Nikolaev, A.; Kiesslich, R.; Lehr, H.A.; Galle, P.R.; Neurath, M.F. In vivo imaging of colitis and colon cancer development in mice using high resolution chromoendoscopy. Gut 2005, 54, 950–954. [Google Scholar] [CrossRef]
  55. Obermeier, F.; Kojouharoff, G.; Hans, W.; Scholmerich, J.; Gross, V.; Falk, W. Interferon-gamma (IFN-gamma)- and tumour necrosis factor (TNF)-induced nitric oxide as toxic effector molecule in chronic dextran sulphate sodium (DSS)-induced colitis in mice. Clin. Exp. Immunol. 1999, 116, 238–245. [Google Scholar] [CrossRef]
  56. Steidler, L.; Hans, W.; Schotte, L.; Neirynck, S.; Obermeier, F.; Falk, W.; Fiers, W.; Remaut, E. Treatment of murine colitis by Lactococcus lactis secreting interleukin-10. Science 2000, 289, 1352–1355. [Google Scholar] [CrossRef]
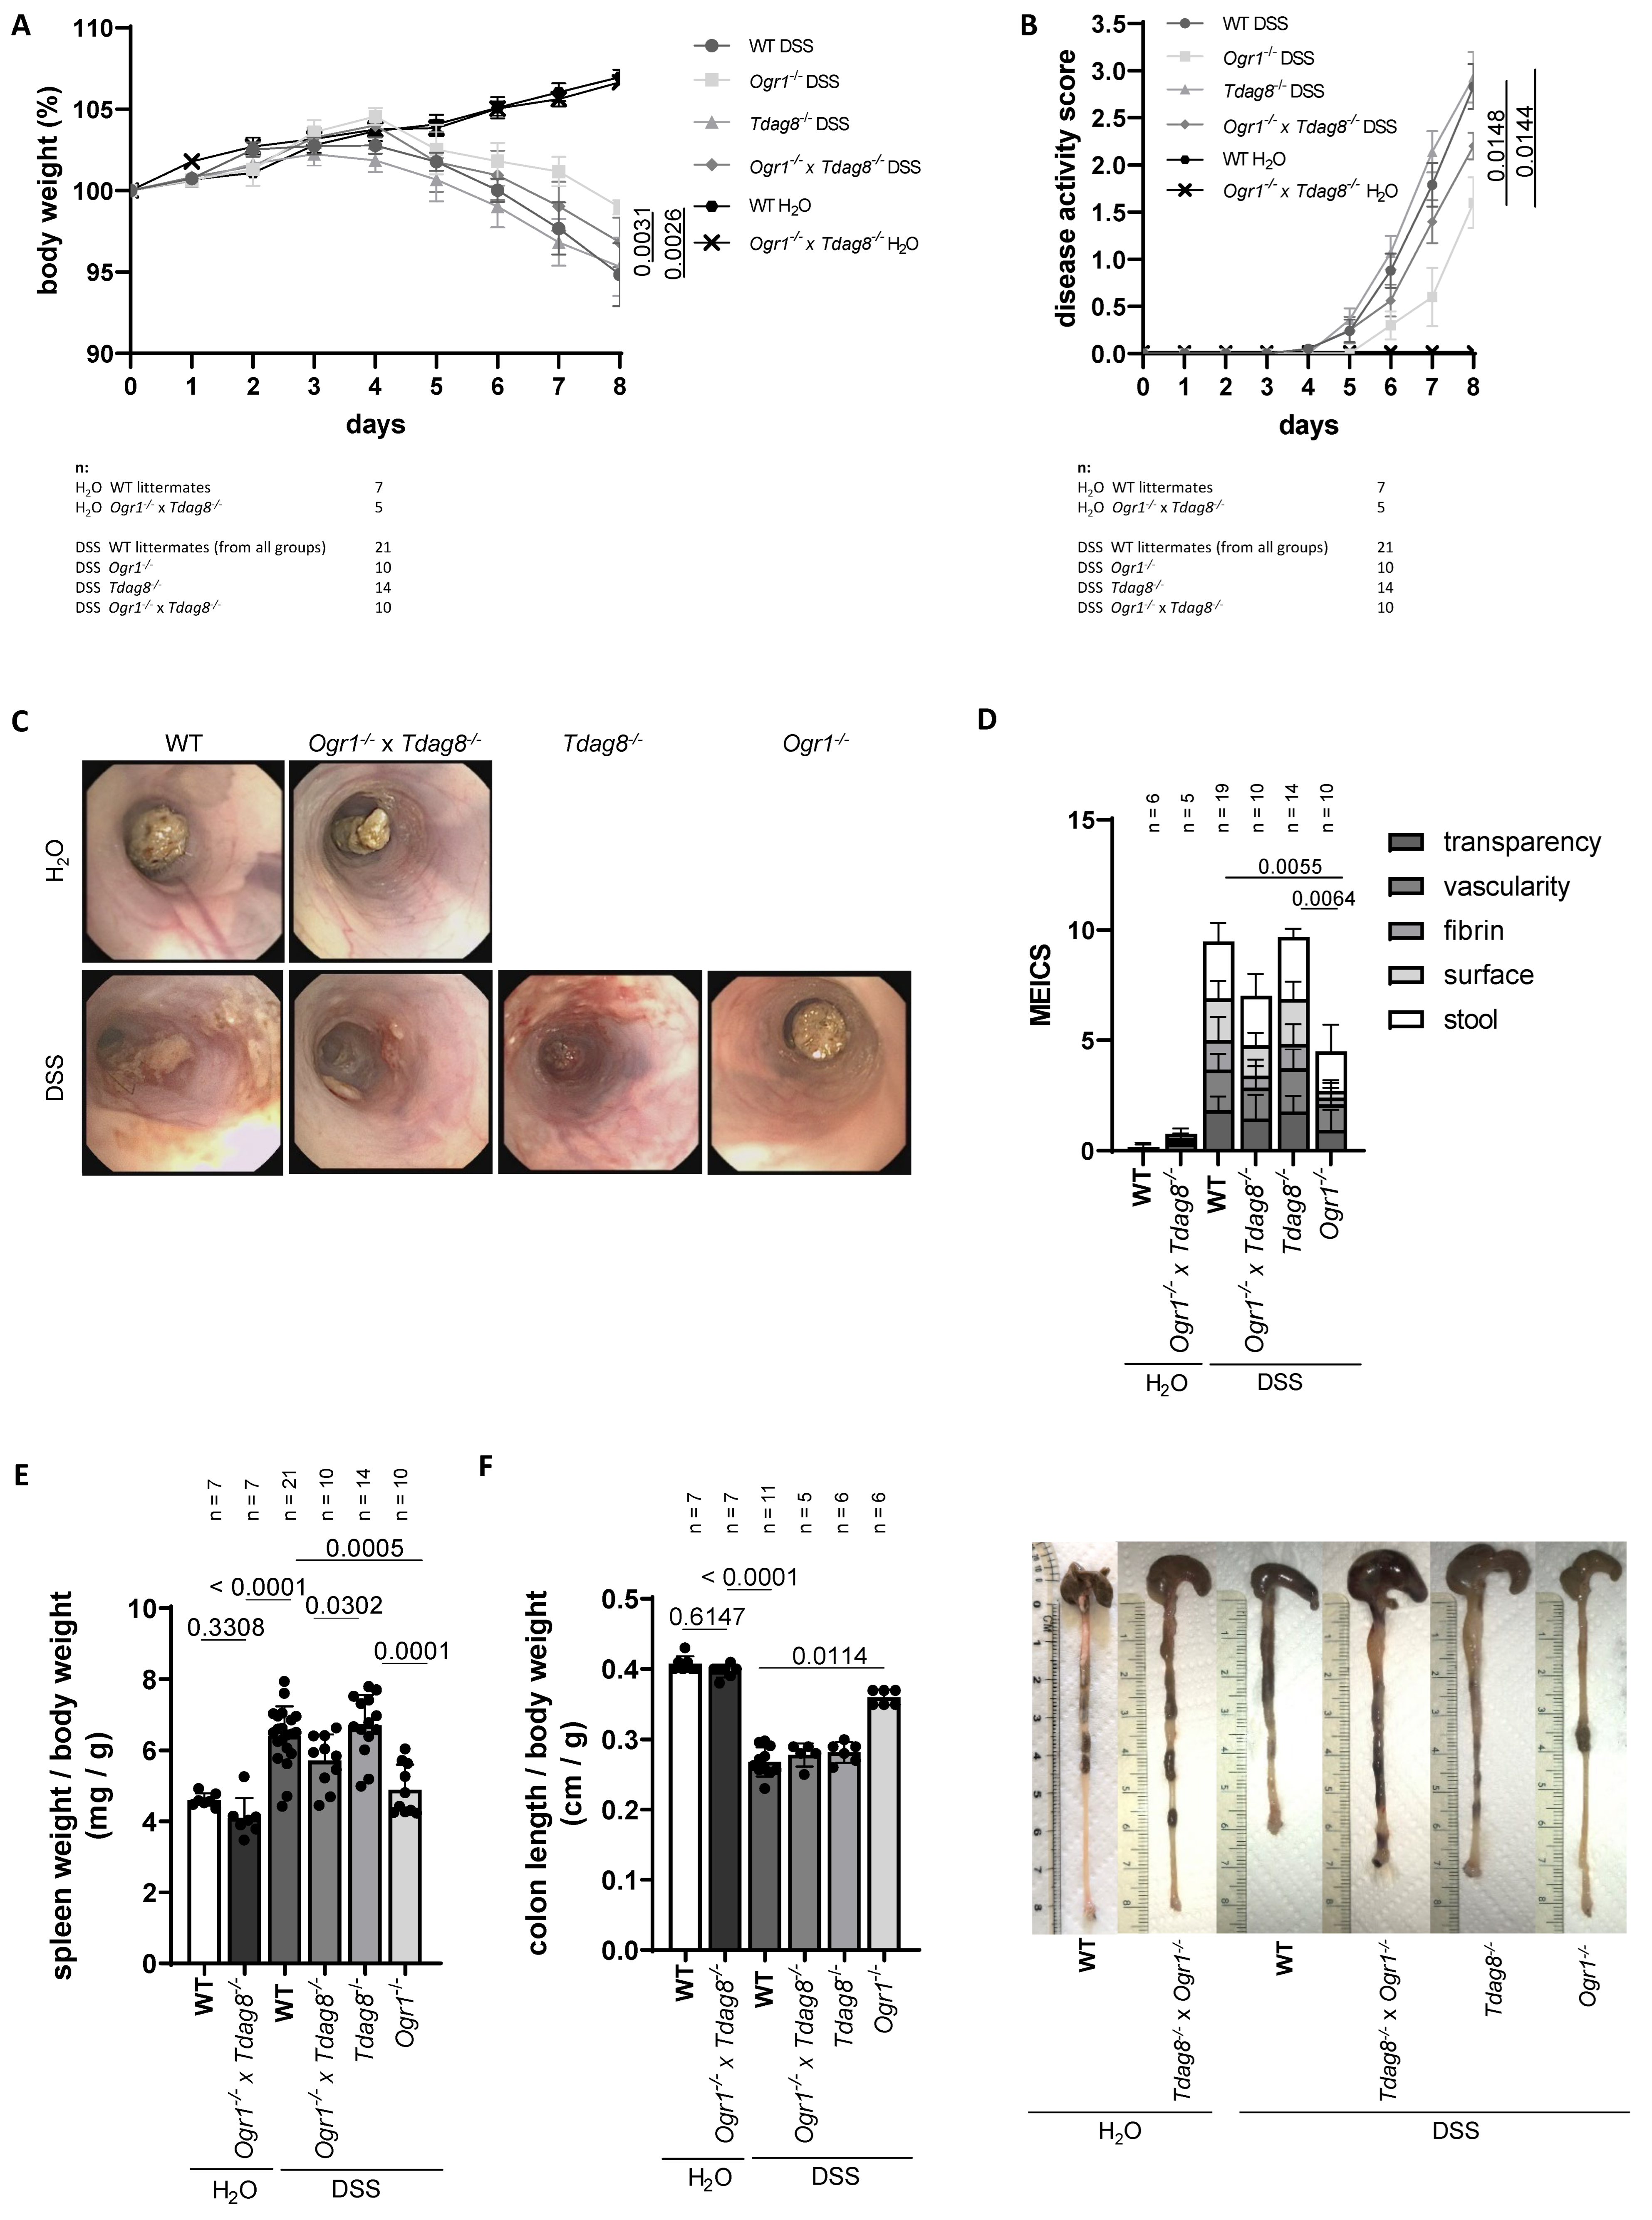
Figure 1. The absence of OGR1 reduces inflammation upon DSS-induced acute colitis. (A) Body weight, ±SEM. (B) Clinical disease activity score ± SEM. (C) Coloscopy, representative images of each group. (D) MEICS, ±SD. (E) Spleen weight/body weight ± SEM. (F) Colon length/body weight, ±SD, and exemplary pictures of colons from each group.
Ijms 24 14855 g001
Figure 2. The absence of OGR1 reduces the histological score upon DSS-induced acute colitis. (A) Exemplary microscopic pictures of HE stained colons. (B) Histological score, ±SD. One-way ANOVA, p-values and n as indicated, * p < 0.05.
Ijms 24 14855 g002aIjms 24 14855 g002b
Figure 3. The absence of TDAG8 aggravates inflammation in the spontaneous colitis model. (A) Body weight ± SEM. (B) Clinical disease activity score ± SEM. (C) Coloscopy, representative images of each group. (D) MEICS compared between groups, ±SD. (E) Spleen weight, ±SD. (F) Colon length, ±SD, and representative images of colons from each group.
Ijms 24 14855 g003
Figure 4. The absence of TDAG8 aggravates the histological score in the spontaneous colitis model. (A) Representative images of HE stained colons from each group. (B) Histological score, ±SD. One-way ANOVA, p-values and n as indicated.
Ijms 24 14855 g004aIjms 24 14855 g004b
Figure 5. The absence of TDAG8 aggravates inflammation in the chronic colitis model. qPCR results for Tnf and Il-6 in the spontaneous colitis model, ±SD, ordinary one-way ANOVA, with p-values as indicated. (A) Tnf compared with Gapdh with Il-10−/− set to 1. (B) Il-6 compared with Gapdh with Il-10−/− set to 10 (logarithmic y-axis).
Ijms 24 14855 g005
Figure 6. FACS results from colon samples of the spontaneous colitis mouse model. FACS analysis, ±SD, ordinary one-way ANOVA, with p-values as indicated. (A) TNF+ CD4+ cells isolated from colon. (B) Analysis of IFNγ+ CD4+ cells. (C) IL-23+ γδTCR T-cells. (D) FoxP3+ CD4+ Tregs. (E) F4/80+ CD64+. (F) Neutrophils.
Ijms 24 14855 g006
Figure 7. FACS results from spleen samples of the spontaneous colitis mouse model. FACS analysis, ±SD, ordinary one-way ANOVA, with p-values as indicated. (A) Manual gating of CD64+ F4/80+ macrophages isolated from spleen (% of viable CD45+ B220 CD3 CD11b+ Ly6G+ neutrophils excluded, CD11b+ Ly6C+ monocytes excluded, NK1.1). (B) IL-17A+ (% of viable CD45+ B220 CD3+ NK1.1+ γδTCR+ T-cells).
Ijms 24 14855 g007
Disclaimer/Publisher’s Note: The statements, opinions and data contained in all publications are solely those of the individual author(s) and contributor(s) and not of MDPI and/or the editor(s). MDPI and/or the editor(s) disclaim responsibility for any injury to people or property resulting from any ideas, methods, instructions or products referred to in the content.