Article

Molecular Landscape of Tourette’s Disorder

1
Department of Cognitive Neuroscience, Donders Institute for Brain Cognition and Behaviour, Radboud University Medical Center, 6525 GA Nijmegen, The Netherlands
2
Department of Human Genetics, Radboud University Medical Center, 6525 GA Nijmegen, The Netherlands
3
Conway Institute of Biomolecular and Biomedical Research, School of Medicine, University College Dublin, D04 V1W8 Dublin, Ireland
*
Author to whom correspondence should be addressed.
Int. J. Mol. Sci. 2023, 24(2), 1428; https://doi.org/10.3390/ijms24021428
Submission received: 28 November 2022 / Revised: 29 December 2022 / Accepted: 1 January 2023 / Published: 11 January 2023
(This article belongs to the Special Issue Genomics of Brain Disorders 4.0)

Abstract

:
Tourette’s disorder (TD) is a highly heritable childhood-onset neurodevelopmental disorder and is caused by a complex interplay of multiple genetic and environmental factors. Yet, the molecular mechanisms underlying the disorder remain largely elusive. In this study, we used the available omics data to compile a list of TD candidate genes, and we subsequently conducted tissue/cell type specificity and functional enrichment analyses of this list. Using genomic data, we also investigated genetic sharing between TD and blood and cerebrospinal fluid (CSF) metabolite levels. Lastly, we built a molecular landscape of TD through integrating the results from these analyses with an extensive literature search to identify the interactions between the TD candidate genes/proteins and metabolites. We found evidence for an enriched expression of the TD candidate genes in four brain regions and the pituitary. The functional enrichment analyses implicated two pathways (‘cAMP-mediated signaling’ and ‘Endocannabinoid Neuronal Synapse Pathway’) and multiple biological functions related to brain development and synaptic transmission in TD etiology. Furthermore, we found genetic sharing between TD and the blood and CSF levels of 39 metabolites. The landscape of TD not only provides insights into the (altered) molecular processes that underlie the disease but, through the identification of potential drug targets (such as FLT3, NAALAD2, CX3CL1-CX3CR1, OPRM1, and HRH2), it also yields clues for developing novel TD treatments.

1. Introduction

Tourette’s disorder (TD) is a childhood-onset neurodevelopmental disorder characterized by multiple motor and vocal tics lasting more than one year. Tics are generally preceded by premonitory urges, peak in severity between the ages of 10 and 12, fluctuate over time, and, in most cases, show improvement by late adolescence or early adulthood. TD affects approximately 1% of the general population, is more prevalent in males and is often associated with other neuropsychiatric comorbidities, including attention-deficit/hyperactivity disorder (ADHD), obsessive compulsive disorder (OCD), autism spectrum disorders (ASDs), anxiety, and depression [1,2]. TD is a highly familial and heritable disorder [3]. Furthermore, TD is thought to be a complex disease resulting from interactions between multiple genetic and environmental risk factors, although the etiology and pathogenesis of TD have not yet been (fully) elucidated. Genetic studies have suggested that both common genetic variants with small effects and rare variants with larger effects contribute to TD risk, although small sample sizes have hindered the discovery of genome-wide significant signals. Various biological effects of the genes (and their encoded proteins) that have been associated with TD, including alterations in the histaminergic pathway, synaptic transmission, cell adhesion, and mitochondrial function, highlight the complexity of the disorder [4,5]. Moreover, environmental factors, such as pre-, peri-, and postnatal events, psychological stress, and infections, could not only contribute to gene-environment interactions but also affect the development, course, and severity of TD symptoms [6,7]. Neurobiologically, TD appears to involve abnormalities in the development, structure and function of cortico-striato-thalamo-cortical (CSTC) circuits associated with motor and behavioral control and with impaired signaling of multiple modulatory neurotransmitters, especially dopamine [8].
As for treating TD, current therapies—including psychoeducation, behavioral interventions and medication, such as atypical antipsychotics—may partly ameliorate symptoms [9,10,11,12]. However, inadequate control of tics and the occurrence of adverse side effects hinder the treatment of TD. Therefore, novel strategies are required to enhance our understanding of the molecular basis of this disorder, which could in turn provide clues for the development of (more) effective treatments. Previous studies have shown that drug candidates are more likely to pass clinical trials and be approved for patients if they target genes linked to human disease [13,14], highlighting the importance of human genetics in drug target identification. In addition, considering that well-powered studies of candidate gene hypotheses for other complex traits, e.g., schizophrenia [15,16], showed that previously reported positive findings were highly likely to be false positives, we decided to focus on omics datasets.
More specifically, we applied and extended the approach that we used before to build so-called ‘molecular landscapes’ of complex neuropsychiatric diseases, including ADHD [17], ASDs [18], OCD [19], and Parkinson’s disease (PD) [20]. In short, we first compiled a comprehensive list of candidate genes that are associated with TD through one or more types of omics data. These data primarily included genomic data (different types of common and rare genetic variants) and were corroborated by epigenomic data (DNA methylation) and transcriptomic data (differential gene/mRNA expression in blood and brain). To identify the molecular mechanisms that are affected in TD, we then performed tissue/cell type specificity and functional enrichment analyses of the TD candidate genes. As biofluid levels of many metabolites represent ‘intermediate phenotypes’ (that link genetic or environmental risk factors to a disease) and the variation in these metabolite levels is at least in part attributable to genetic factors [21,22,23], we also used genomic data to investigate the extent and direction of genetic overlap between TD and the levels of a large number of blood and cerebrospinal fluid (CSF) metabolites. Subsequently, we applied additional selection criteria—that reflected the amount of independent omics evidence—to the list of TD candidate genes, resulting in ‘prioritized’ TD candidate genes and candidate genes for which less omics evidence implicating them in TD etiology was available. Lastly, we built a molecular landscape of TD through integrating the results from the tissue/cell type and functional enrichment analyses with an elaborate literature search for interactions between the proteins encoded by the TD candidate genes and the metabolites implicated through the genetic overlap analyses and other metabolome/microbiome studies. The resulting TD landscape provides insights into the (altered) molecular processes that underlie the disease as well as potential drug targets that could be further developed into treatments.

2. Results

2.1. Input Omics Datasets and Candidate Genes

Based on the literature search and our analyses of the TD GWAS data, we compiled a list of TD candidate genes from the single-omics studies of TD (i.e., genomics, transcriptomics, epigenomics, metabolomics, and microbiomics). We provide the characteristics of the included studies in Table S1 and below, we briefly describe the included studies.
Based on the type of omics evidence they provide, we classified the studies as guiding (genomics studies), corroborating (epigenomics and transcriptomics studies) and additional (metabolomics and microbiome) studies. For the genomics data, we compiled a list of TD candidate genes from studies of rare genetic variants/events—(i) eight chromosomal rearrangements studies [24,25,26,27,28,29,30,31] (the main list includes 15 genes and the extended list consists of 23 genes), (ii) fifteen single-nucleotide variation (SNV) studies [27,32,33,34,35,36,37,38,39,40,41,42,43,44,45] (the main list includes 134 genes and the extended list consists of 846 genes), and (iii) eleven copy number variations (CNV) studies [37,44,46,47,48,49,50,51,52,53,54] (the main list includes 52 genes, and the extended list consists of 956 genes)—and studies of common genetic variants (of single-nucleotide polymorphisms or SNPs), i.e., genome-wide association studies (GWASs). The GWAS-derived genes include the results from our own unpublished analyses of the summary statistics data from the TD GWAS by Yu et al. [55], i.e., 113 genes from the MAGMA analysis, 224 genes from the FUMA analysis, and 143 genes from the TWAS analysis. In addition, the GWAS-derived candidate genes include published results of (other) studies using TD GWASs, including cross-disorder studies and annotation of the GWAS by Yu et al. from the GWAS Catalog [56,57,58,59,60], as well as the preliminary MAGMA results from the newest TD GWAS (available as a preprint on medRxiv at the time of analysis) [61].
Corroborating evidence for the genomic-studies-derived genes was assembled from two epigenome-wide association studies (EWASs) that investigated DNA methylation in the peripheral blood of TD patients versus controls [62,63] (the main list includes 71 genes and the extended list consists of 8 genes), and transcriptomic studies in the brain (postmortem, in the striatum of medicated TD patients vs. controls) [64] (957 genes) and blood (medicated [65,66] and unmedicated [67,68] TD patients versus control). We could not find any published proteomic studies of TD.
As for additional evidence, we included findings from three studies that investigated metabolomic changes in the plasma of TD patients [69], serum of PANS patients [70], and urine in a case study of PANDAS-associated tics [71], and from microbiome studies in children with tic disorder [72] and in PANS/PANDAS patients with tics [73]. These results were used as supportive evidence for the metabolites linked to TD through the PRS-based analyses (see below).
We combined the lists of genes implicated through the abovementioned genomic, epigenomic and transcriptomic studies along with their functional annotations into one table (Table S2). In total, we compiled a list of 872 TD candidate genes implicated in TD through the genomic studies (guiding evidence), and this list was subsequently used in tissue and cell specificity and functional enrichment analyses.

2.2. Tissue and Cell Type Specificity

We performed specificity analyses to identify the tissues and cell types with enhanced expression of TD-associated genes. We separately analyzed the genes associated with TD based on all types of genomic data and on the postmortem brain transcriptomic data to identify tissues and cell types that contribute to the development of TD and that are particularly affected by lifelong TD, respectively.

2.2.1. Genomic Data

In the Tissue Specific Expression Analysis (TSEA), we found that genes preferentially expressed in 2 out of the 25 human tissues tested were significantly enriched (pSI < 0.05, FDR p-value < 5 × 10⁻², see Materials and Methods) within the 872 TD candidate genes: the brain as a whole (FDR p-value = 9.17 × 10⁻⁹, 148 genes) and the pituitary (FDR p-value = 1.30 × 10⁻⁵, 114 genes; of note, 74 genes were enriched in both the brain and pituitary). We also observed strong expression enrichment in the brain and, to a lesser extent, the pituitary at the more stringent pSI cutoff of 0.01 (brain: FDR p-value = 2.73 × 10⁻⁵, 81 genes; pituitary: FDR p-value = 1.3 × 10⁻², 46 genes), which indicated an expression enrichment of specific TD candidate genes in the brain (and pituitary) (File S1).
In the analysis of human spatiotemporal brain gene expression data (6 brain regions across 10 developmental periods), we found that TD gene expression was enriched in seven spatiotemporal coordinates, involving 4 brain regions during specific developmental periods: (I) cerebellum: early fetal period (FDR p-value = 2.8 × 10⁻², 53 genes); (II) cortex: early mid-fetal period (FDR p-value = 4 × 10⁻³, 51 genes), neonatal period/early infancy (FDR p-value = 5 × 10⁻³, 33 genes), adolescence (FDR p-value = 1.4 × 10⁻², 34 genes), young adulthood (FDR p-value = 5.021 × 10⁻⁴, 48 genes); (III) striatum: early mid-fetal period (FDR p-value = 4.3 × 10⁻², 36 genes); (IV) thalamus: neonatal period/early infancy (FDR p-value = 2.1 × 10⁻², 46 genes). We also observed a trend-significant enrichment of the late mid-fetal period in the cortex (FDR p-value = 5.2 × 10⁻², 36 genes) and mid–late childhood in the cerebellum (FDR p-value = 7.9 × 10⁻², 53 genes) (File S2).
Taking into account the substantial cellular heterogeneity in brain tissue, we then used single-cell data from adult mice to identify individual candidate cell populations that are likely to be affected in TD. In the Cell-Specific Expression Analysis (CSEA), we observed a trend-significant enrichment of two cell populations: Drd2+ medium spiny neurons (MSNs) of the striatum (33 genes) and layer 6 corticothalamic neurons (Ntsr+, 21 genes), although these results did not pass our threshold for significance (FDR p-value = 1.6 × 10⁻¹ for both cell types) (File S3).

2.2.2. Brain Transcriptomic Data

Alterations of gene expression from a complex mix of cells, such as those from brain tissue, may represent changes in the (relative) cellular composition of the tissue [74]. To this end, we also applied the CSEA method to the transcriptomic data from the postmortem striatum of TD patients [64] to infer the cellular fingerprint of a lifelong disease. Among the striatal cell types assessed by CSEA, genes downregulated in TD striatum were over-represented in the expression profiles of cholinergic interneurons (FDR p-value < 5 × 10⁻² across all pSI thresholds) and, to a lesser extent, Drd1+ MSNs (FDR p-value = 6 × 10⁻²), indicating a loss and/or reduced function of these cell types. Of note, the enrichment of cholinergic interneurons was also significant for the basal forebrain, which is consistent with their restricted distribution in the central nervous system (CNS), i.e., with these cell types being concentrated in these particular brain regions (the basal forebrain, caudate and putamen) [75]. Furthermore, genes downregulated in the TD striatum were also enriched for genes that are highly expressed in cortical cells, i.e., layer 6 corticothalamic neurons (Ntsr+ neurons), layer 5 pyramidal neurons projecting to the thalamus, spinal cord and striatum (Glt25d2 neurons), and cortical neurons that express the prepronociceptin gene (Pnoc+ neurons) (File S4). The analysis of the WGCNA module that was enriched for downregulated genes further confirmed an overabundance of genes that are highly expressed in interneurons, and it provided evidence for an involvement of Drd2+ MSNs (FDR p-value < 5 × 10⁻² across all pSI thresholds) (File S5). Lastly, the analysis of upregulated genes revealed an overrepresentation of immunity-related cell types (in the cortex) and glial cells (in the cerebellum and cortex) (File S6), while the WGCNA module analysis yielded a specific enrichment of immune cells (File S7).

2.3. Functional Enrichment Analyses

We used Ingenuity Pathway Analysis (IPA) to identify canonical pathways, diseases/biological functions and upstream regulators that are enriched within the 872 TD candidate genes. We provide the full results of all analyses performed with IPA in Table S3, while below, we describe the most significant findings (i.e., with FDR p-value < 5 × 10⁻²).
The canonical pathway analysis in IPA identified two signaling pathways that were significantly enriched within the 872 genes: ‘cAMP-mediated signaling’ and ‘Endocannabinoid Neuronal Synapse Pathway’ (Table 1). Three genes—ADCY2, MAPK3, and PRKAR2A—were implicated in both pathways, suggesting a (partial) shared underlying biology.
In the diseases and biofunctions analysis, IPA identified significant enrichment of 71 functional annotations contained within two functional categories: Molecular and Cellular Functions and Physiological System Development and Function (Table 2). Most of the enriched functions are linked to the development and function of the nervous system and include many overlapping genes (Table S3b). The Diseases and Disorders category was highly enriched for cancer-related diseases (Table S3b). This result is partly driven by the inclusion in IPA of findings from the COSMIC and ClinVar projects, which identified many associations between genes and various cancers, and genes involved in normal biological processes are impacted when these functions are dysregulated by cancer. After filtering the results to exclude cancer, we found a significant association (FDR p-value < 5 × 10⁻²) with 119 disease annotations falling into several higher-level categories, including ‘Neurological Disease’ (54 annotations), ‘Psychological Disorders’ (30), ‘Developmental Disorder’ (19), ‘Hereditary Disorder’ (17), ‘Cardiovascular Disease’ (9), ‘Skeletal and Muscular Disorders’ (9), ‘Gastrointestinal Disease’ (7), ‘Infectious Disease’ (5), and ‘Inflammatory Disease’ (4).
In the upstream regulator analysis, none of the identified upstream regulators remained significant after correction for multiple testing (Table S3c). That being said, the top regulators at a suggestive p-value threshold (uncorrected p-value < 1 × 10⁻²) include—among ‘Drugs and Chemicals’—molybdenum disulfide (chemical reagent), topotecan (chemical drug), GnRH analog (biologic drug), lipoxin LXA4 (endogenous chemical), and—among ‘Genes, RNAs and Proteins’—NEDD4 (enzyme), OPRM1 (G-protein coupled receptor), ANGPT2 (growth factor), CLCA2 (ion channel), and TEAD4 (transcription regulator).

2.4. Shared Genetic Etiology Analyses with Levels of Blood and Cerebrospinal Fluid Metabolites

2.4.1. Polygenic Risk Score (PRS)-Based Analyses

We conducted PRS-based analyses to investigate the presence and extent of genetic overlap between TD and metabolite concentrations in blood and/or CSF. After Bonferroni correction for the number of tests performed, we identified significant associations between TD and the levels of 37 blood metabolites (out of the 993 blood metabolites tested) and 2 CSF metabolites (out of the 338 CSF metabolites tested). The results for these metabolites are presented in Table 3, along with the superpathway and pathway annotations (where applicable). Genetic variants associated with TD explained up to 2.08% of the genetically determined variation in the levels of the 37 significant blood metabolites, and up to 9.90% of the variation in the levels of the two significant CSF metabolites. The complete results of the PRS-based analyses for the blood and CSF metabolites are provided in Table S4a,b.

2.4.2. SNP Effect Concordance Analysis (SECA)

Through performing SECA for the significantly associated metabolites from the PRS-based analyses, we found a significant genetic concordance between TD and the levels of all 39 metabolites (Table 3). Among these, 24 blood metabolites showed positive concordance, indicating that genetic variants associated with TD also convey genetic risk to increased blood levels of these metabolites. The remaining 13 blood metabolites—including indoxyl sulfate, homocitrulline, pyridoxate, myo-inositol, triacylglycerols—and the two CSF metabolites—N-acetyl-aspartyl-glutamate (NAAG) and butyrate—showed negative concordance with TD, implying that genetic variants associated with TD also convey genetic risk to decreased blood/CSF levels of these metabolites.

2.5. Molecular Landscape of TD

Through the approach described in the Materials and Methods and by integrating the results from the tissue/cell type specificity and functional enrichment analyses with the literature search for interactions between the proteins encoded by the 872 TD candidate genes and the metabolites implicated through the PRS-based analyses, we built a molecular landscape of TD (Figure 1). The landscape is located in the synapse, where presynaptic and postsynaptic neurons interact with astrocytes, microglial cells and the extracellular matrix (ECM), together forming a structure referred to in the literature as the pentapartite synapse [81,82]. For building the landscape, we focused on the 239 proteins encoded by the prioritized TD candidate genes (see Materials and Methods)—that are dark blue in Figure 1—and their interactions. In addition, if they interacted with at least one of the dark blue proteins, we added some of the remaining proteins encoded by the remaining TD candidate genes for which there was less omics evidence available (see Materials and Methods)—and these proteins are light blue in Figure 1. In total, this amounted to 197 (unique) dark blue proteins and 276 (unique) light-blue proteins that are shown in the landscape. The landscape also includes 42 yellow proteins/molecules that have been implicated in TD through transcriptomics/metabolomics data and/or other functional evidence. Lastly, the 11 blood and 2 CSF metabolites of which the levels were found to show significant genetic overlap with TD are indicated in orange and grey, respectively. All interactions between the landscape proteins/molecules can be found—with their corresponding literature references—in Table S5, but below, we have provided a description of the main processes in the landscape, with the key implicated proteins/molecules/metabolites in bold and by part of the neuronal cells where these processes/cascades are mainly taking place.

2.5.1. Description of the TD Landscape

Presynaptic and Postsynaptic Neurons

  • Extracellular matrix (ECM)
Synapses are enwrapped by a layer of extracellular matrix (ECM), which is important for (shaping and maintaining) synaptic morphology and function. The ECM of the brain consists of non-fibrous proteins such as glycoproteins, matricellular proteins (such as periostin and tenascins), enzymes that regulate ECM deposition and degradation, and fibrous/structural proteins (such as collagens and laminins) [83]. The ECM proteins can modulate the activity or bioavailability of extracellular signaling molecules, such as growth factors, cytokines, chemokines, and extracellular enzymes, and/or bind directly to cell surface receptors to regulate cellular functions. ECM components are synthesized intracellularly in glia and neurons and secreted into the ECM, where they aggregate with the existing matrix, fill the synaptic cleft, and interact with cell surface receptors. Furthermore, the ECM is also involved in the exchange of nutrients and metabolites between the CNS and systemic circulation [84].
First, THBS1, an adhesive glycoprotein that is downregulated by indoxyl sulfate (IS), binds and interacts with multiple other landscape proteins, both in the ECM and membrane. Another ECM glycoprotein involved in—among other functions—cell adhesion is FN1, and this protein is upregulated by palmitic acid and (also) has very many interactions with other landscape proteins in ECM and membrane. In addition, POSTN (periostin) is an ECM protein that plays a role in cell adhesion and ECM remodeling by regulating the expression of landscape proteins—including FN1—and interacting with membrane proteins. The tenascin TNN is involved in neurite outgrowth through binding the ITGA4-ITGB1-complex in the membrane (of microglial cells). Moreover, enzymes that regulate ECM function are the peptidase DPP4 that (also) binds FN1, the protease HTRA3 that cleaves FN1, and LOLX1, an oxidase that catalyzes the formation of crosslinks in collagen and elastin fibers. In addition, RELN (reelin) is a serine protease that regulates many functions, e.g., neuronal adhesion, neuronal migration, neurite outgrowth and synaptic plasticity. RELN expression is regulated by the transcription factors NPAS3 and TBR1 as well as the membrane receptor FFAR3 (see below), while butyric acid decreases its acetylation and demethylation. Moreover, RELN degrades FN1 and binds/signals through the membrane protein LRP8 (in astrocytes). Fibrous/structural landscape proteins include several collagen proteins (COL4A2, COL5A1, COL6A3, and COL8A1) that regulate synaptogenesis and neuronal cell adhesion, and the laminin LAMA5.
Other ECM landscape proteins include the vasoactive peptide ADM (that downregulates FN1), lipid transport-regulating APOM (that downregulates FN1 and is downregulated by palmitic acid), GCG (which is a precursor that can be cleaved into multiple peptides, one of which downregulates FN1), CLCA2 (a chloride channel accessory protein that regulates the expression of CDKNA1 and FN1), CX3CL1 (a membrane protein that is cleaved by the neuronal membrane enzyme ADAM10 into a soluble form that is a ligand for both CX3CR1 and the ITGA4-ITGB1-complex in the membrane of microglial cells), the interleukins IL17A and IL31, LTBP1—a key regulator of transforming growth factor beta proteins such as TGFB1 and TGFB3—and NOTCH2NLA, a component of the NOTCH signaling pathway that regulates neuronal differentiation and can also be located in the cytoplasm. Other ECM proteins with a role in regulating neuronal differentiation and function are NXPH1 (that binds and interacts with NRXN1 in the presynaptic membrane), the protease inhibitor SERPINE2 (that, among other interactions, downregulates the expression of the cytokine TNFB), the nerve growth factor VGF (that, e.g., regulates CHGB, a neuroendocrine secretory granule protein), and members of the WNT protein family (WNT1, WNT3, WNT5A, and WNT10B) that modulate many processes such as neuronal differentiation and migration, dendrite development, synaptogenesis, adult neurogenesis, and neural plasticity (summarized in [85]).
  • Cell membrane
Neuronal cell membrane proteins connect extracellular and intracellular signaling cascades and largely determine a neuronal cell’s capacity to communicate and interact with its environment. Different types of cell membrane proteins can be discerned, including enzymes, receptors, ion channels, transporters, cell adhesion-regulating proteins, and other membrane proteins [86].
First, a number of landscape proteins are membrane-located enzymes, such as DPEP2 (involved in the metabolism of arachidonic acid), FKBP11 (that regulates protein folding), MARK3 (involved in the phosphorylation of MAPT), and NAALAD2, an enzyme that is expressed in neuronal and astrocytic membranes and regulates glutamate synthesis, see below. In addition, DAGLA is a membrane-located enzyme that is involved in the metabolism of arachidonic acid and stearic acid. DAGLA also complexes with the presynaptic transporter SLC6A4 (see below) and with the postsynaptic density scaffolding protein HOMER2. Furthermore, like the related protein ZDHHC8 in the Golgi membrane (see below), the membrane-located enzyme ZDHCC17 transfers palmitic acid onto target proteins, and it also complexes with TNFB and other landscape proteins, including the membrane proteins LMBR1L and TMEM100B.
As for receptors, different functional classes are located in the (neuronal) cell membrane. In this respect, several landscape proteins are G protein-coupled receptors (GPCRs). GPCRs are highly expressed throughout the brain and regulate synaptic transmission and plasticity [87]. After being bound and activated by their ligands, GPCRs regulate downstream signaling through stimulatory G-proteins—CRHR1, the receptor for the hormone CRH and in this way a major regulator of the hypothalamic–pituitary–adrenal (HPA) cascade, and HRH2, a receptor of histamine that interacts with the TD-linked enzyme histidine decarboxylase (HDC) (see below) and regulates arachidonic acid production—and inhibitory G proteins. Examples of the latter type of GPCRs include CX3CR1 (a membrane receptor that is highly expressed in microglial cells and that is activated and involved in regulating the immune response through binding its ligand CX3CL1, which itself also signals through the membrane ITGA4-ITGB1-complex) and DRD2, a dopamine that receptor interacts with, regulates, or is regulated by multiple landscape proteins. Other membrane GPCRs that signal through inhibitory G-proteins are FFAR3 (that is activated by butyrate and downregulates the expression of landscape proteins such as RELN and the potassium channel (see below) KCNH5), as well as FPR1, FPR2 and FPR3, chemokine receptors that form a functional complex, regulate inflammation, and are regulated by the extracellular proteins ANXA1 and arachidonic acid metabolite LXA4 and by intracellular BHLE40 and COP1. Furthermore, opioid receptors representing the μ, δ, and κ families—encoded by the OPRM1, OPRD1 and OPRK1 genes, respectively—interact with each other (with OPRM1 signaling through both stimulatory and inhibitory G-proteins) and multiple landscape proteins in the cell membrane (CD302, DRD2, EGFR, and SLC6A4), extracellular space (ADM, FN1) and cytoplasm (CKB, CRKL, HSP90AA1, NCL, PI4KA, and TLN2). Lastly, the PROK2-PROKR2 complex induces the production of gonadotropin-releasing hormone (GnRH), which has been linked to TD (see below). Other non-GPCR landscape membrane receptors include the kinase receptors EGFR—that interacts with many landscape proteins, including being inhibited by the cytoplasmic protein ERRFI1—and FLT3 that, when bound/activated by the cytokine FLT3LG, regulates the phosphorylation of MAPK3 and MAPT. Moreover, FLT3 regulates the expression of nuclear EXCC6, cytoplasmic PIM1, and lysosomal MPO, and is degraded by RNF115. Other membrane receptors in the landscape include IL17RB—which forms a functional complex with IL17RA that has IL17A as its ligand—and PLA2R1, a receptor of phospholipase A2 (not shown) that upregulates the expression of the mitochondrial enzyme MGST1 (see below). Furthermore, PTPRU is a (pre) synaptic phosphatase receptor involved in the development and maintenance of dopaminergic neurons [88], while NOTCH1 is a (pre)synaptic membrane receptor that interacts with multiple landscape proteins and, upon ligand activation, the notch intracellular domain (NOTCH1-ID) is released into the cytoplasm and subsequently the nucleus, where it functions as a transcription factor through, e.g., interacting with RERE (see below). Moreover, a number of landscape proteins are (subunits of) neurotransmitter receptors that, when activated through neurotransmitter binding, function as ligand-gated ion channels (see below): the acetylcholine receptor subunits CHRNA7 and CHRNB4, the GABA (γ-aminobutyric acid) receptor subunits GABRA2, GABRB3 and GABRG1, and the NMDA glutamate receptor subunits GRIN1, GRIN2A, GRIN2B and GRIN3A. Lastly, SELE (selectin-E) is a (pre-or post)synaptic membrane receptor that is involved in immunoadhesion and that is (also) highly expressed in brain vascular endothelial cells. SELE binds its membrane-located ligand extracellular SELPLG—which leads to its dephosphorylation—and its expression is regulated by intracellular ENO1, ESR1, indoxyl sulfate, MAPK3K4, MAPK3, MRTFA and RCAN1, membrane-located NOTCH1, and secreted, extracellular SERPINE2.
In addition, several membrane-located ion channels operate in the landscape. A first group of ion channels are the neurotransmitter receptors that, upon activation, function as ligand-gated ion channels (see above). Secondly, the landscape contains multiple (subunits of) voltage-gated ion channels that mediate the transport of (univalent and divalent) ions into neuronal cells, including the calcium channel subunit CACNA1D, the chloride channel subunit CLCN2 (which is activated by arachidonic acid), the sodium channel subunit SCN5A, and the potassium channel subunits HCN1, HCN4, KCNH3, KCNH5, KCNJ11 and astrocytic KCNK1, with the latter also being regulated by the cytoplasmic enzyme SENP1 (see below).
Members of the ATP-binding cassette (ABC) family of transporters—ABCA7 and ABCG8 (which itself forms a functional complex with extracellular APOM (see above))—play a role in lipid homeostasis. In addition, ABCC1 mediates the export of organic anions and many drugs from the cytoplasm. In astrocytes, the expression of ABCG8 is regulated by NR1H2, whereas ABCC1 forms a complex with the multifunctional membrane protein LMBR1L (see below). Other landscape transporters belong to the solute carrier family of proteins, including the (post)synaptic sodium/bicarbonate cotransporter SLC4A10 that regulates intracellular pH, SLC6A2—a presynaptic amine transporter that inhibits both DRD2 and SLC6A4—and the presynaptic serotonin transporter SLC6A4 that interacts with many landscape proteins and terminates the action of serotonin in the synaptic cleft by transporting serotonin (back) into presynaptic neurons. In addition, SLC23A1 transports vitamin C into presynaptic neurons, SCL26A2 transports sulfate into these neurons (not shown), and SLC30A9 as well as SLC39A12 transport zinc into postsynaptic neurons and astrocytes, respectively.
Several membrane proteins in the landscape also have an important role in regulating cell adhesion, i.e., CD47—which is bound and activated by THBS1 and forms a complex with the (microglial) ITGA4-ITGB1-complex—and CD276 that form a presynaptic complex, and CD302 that forms a presynaptic complex with OPRM1. Furthermore, CNTN6—which complexes with NOTCH1, leading to the release of NOTCH1-ID to the nucleus (not shown)—and CNTNAP2—of which the expression is regulated by the transcription factor FOXP2—are proteins of the contactin family that regulate (pre)synaptic cell adhesion. In addition, CDHR1 is a cell adhesion protein of which the expression is upregulated by CX3CL1, while presynaptic NRCAM and the postsynaptic protocadherins PCDH7, PCDH12 and PCDH17—which also interact with each other—are cell adhesion proteins that are involved in the establishment and maintenance of specific neuronal connections in the brain. Lastly, the teneurin proteins TENM2—that binds the ADGRL1 receptor—and TENM4—that complexes with extracellular OLFM1 (see below)—also regulate neuronal cell adhesion and connectivity.
Lastly, a number of ‘other’ membrane proteins act in the landscape. First, presynaptic neuroligins such as NLGN3 and NLGN4X regulate synapse function and synaptic signal transmission through forming a synapse-spanning functional complex with postsynaptic neurexins such as NRXN1. In the same way, presynaptic EFNA5 and postsynaptic EPHB2 can form a synapse-spanning complex that modulates synaptic function. Moreover, the membrane protein RIMBP2 regulates (pre)synaptic transmission through interacting with the membrane-located scaffold protein RIMS1 and the calcium channel CACNA1D. AGRN (agrin) is a transmembrane protein that is large enough to span the synaptic cleft and act across it [89,90] (not shown) and forms multiple functional complexes with other intra- and extracellular landscape proteins. Another membrane protein that interacts with many other landscape proteins is LMBR1L. In addition, the membrane protein KIDINS220 is a key regulator of synaptic plasticity through binding and interacting with extracellular FN1 and OLFM1, as well as cytoplasmic GAK (see below). In turn, OLFM1—which also binds TENM4 (see above)—inhibits complex formation between the inner cell membrane-associated protein RTN4R and the transmembrane protein LINGO1, with the RTN4R-LINGO1-complex being a key regulator of axonal growth.
  • Cytoskeleton
The cytoskeleton has three components, i.e., actin filaments, intermediate filaments, and microtubules (MTs), and a large number of landscape proteins regulate the function of these components and interact with each other as well as cytoplasmic, nuclear, and membrane-located proteins. In CNS cells, the cytoskeleton is crucial for cell shape and physiology, and it also forms specialized structures such as growth cones—that are responsible for axon elongation and guidance during development—dendritic spines and synapses—that form the structural basis for nerve cell communication and higher order processes such as learning and memory—and membrane specializations critical for the initiation and propagation of nerve impulses.
Firstly, actin filaments play an important role in neuronal development, including regulating growth cone dynamics (ACTR3), remodeling of dendritic spines (ABI2, DBN1), and migration of neuronal precursors [91] (ABI2, DBN1). In addition, certain landscape proteins link the cytoskeleton to the cell membrane (ANK3, EPB41), while other—at least to some extent cytoskeletal—proteins regulate actin filament organization (KLHL5, LIMCH1, MPRIP, and PDLIM7), actin-based transport (myosins including MYO10, MYO19), and cell adhesion (CTNNA3, LIMCH1, PKP4, TLN2, and TRIP6).
Secondly, intermediate filaments (or neurofilaments) are important for organelle positioning, transport, and function [92], and PRPH is an important protein in neurofilaments.
Lastly, the crosstalk between actin filaments and MTs is important for regulating cytoskeleton-associated processes such as cell migration, cell division, cell polarity and cell (neuronal) shape. More specifically, MTs are composed of tubulin dimers—different combinations of TUBA1A, TUBA1B and/or TUBA1C—and serve as routes for intracellular transport and structural support for dendrites and axons. In addition, MTs contribute to the development, maintenance, and plasticity of synapses, including roles in (pre)synaptic vesicle (re)cycling, mitochondrial arrangement, and interactions with receptors in the neuronal membrane [93]. In addition, the centrosome is the main MT-organizing center and is the main site of microtubule nucleation and anchoring involved in many processes, particularly during cell division, cell migration and differentiation. In this respect, the landscape contains several proteins that are involved in centrosome function: CEP85L, CEP128, CENJP, HAUS3, MPHOSPH9, PCM1, and WDR62. Furthermore, the landscape contains a large number of MT-associated motor proteins that move along MTs and regulate intracellular protein trafficking and transports: proteins from the DNAH-complex (DNAH1, DNAH3, DNAH5, DNAH7, DNAH10 (not shown), and DNAH11), DYNC2H1 and DYNC2I1 (involved in retrograde transport), KIF26B and KLC1 (that specifically regulate organelle transport along MTs).
Lastly, landscape proteins regulate the function/stability/organization of MTs, including ABGL4, CAPN6, CCDC66, MAPT, MTUS2, NCKAP5L, and NINL.
  • Cytoplasm
The cytoplasm has many functions in (neuronal) cells, including regulating signal transduction between the cell membrane and the nucleus and/or cellular organelles/other cell parts, producing molecules/metabolites involved in many signaling cascades (e.g., glycolysis, gluconeogenesis, protein biosynthesis) and storing or transporting these molecules/metabolites from their production site to other parts of the cell, post-translational modifications of synthesized proteins, and cell cycle regulation.
First, a number of landscape proteins are located in the cytoplasm but mainly regulate cytoskeletal processes. These proteins include RHOA and its activators ARHGAP26, DLC1, KALRN, NGEF and TRIO. In addition, cytoplasmic FARP2, GCA, TJP1 and TROAP regulate cell adhesion through interacting with the cytoskeleton.
Moreover, a large number of cytoplasmic landscape proteins are enzymes, including DGKQ (involved in lipid metabolism), ENO1 (involved in glycolysis) and POFUT1—that form a complex, with POFUT1 also regulating, through fucosylation, membrane-located NOTCH1 and transmembrane AGRNMDH1 (involved in the TCA cycle) and PFKM (involved in glycolysis and inhibited by citrate). Other cytoplasmic landscape enzymes are involved in regulating the metabolism of phosphatidylinositol (PI), with (changes in) PI (metabolites) having been linked to normal human brain development and aging as well as organizing the cell membrane [94,95], i.e., IMPA1 (important enzyme for maintaining intracellular levels of the PI metabolite myo-inositol (MI) that mediates brain signaling in response to hormones, neurotransmitters and growth factors [96]), OSBPL2, PI4KA, PIKFYVE and PLCH1. Furthermore, two (partially) cytoplasmic landscape enzymes—AHCY and COMT—are involved in the metabolism of S-adenosylmethionine (SAM)—the methyl donor for most methylation reactions in cells, including histone and DNA methylation in the nucleus—that for its synthesis requires betaine, which itself is synthesized in the mitochondria (see below). In addition, PRMT1—which is activated by FAM98B—is involved in (arginine) methylation of multiple proteins and histones. Moreover, cAMP—that is produced by ADCY2—is degraded by PDE4A, an enzyme that binds and interacts with PRKAR2A, a kinase that is regulated by cAMP. Furthermore, SULT4A1 is involved in the metabolism of multiple neurotransmitters. Lastly, HDC—an enzyme that is upregulated by TNFB—interacts with the histamine receptor HRH2 (see above) and converts histidine to histamine using pyridoxal 5′-phosphate (PLP, the active form of vitamin B6) as cofactor, while WWOX is an oxidoreductase enzyme that interacts with multiple landscape proteins in the cytoplasm and nucleus where it functions as an adaptor protein and transcriptional repressor, respectively.
Multiple cytoplasmic proteins also regulate (mainly presynaptic) vesicle transport/trafficking (CLTC1, NSF, VPS13A), recycling (GAK and STON2 (highly expressed in astrocytes) and exocytosis (DYSF, PREPL, and SNAP29). DYSF is a cell membrane and cytoplasmic protein that uses calcium as a cofactor and regulates the expression of both extracellular FN1 and cytoplasmic ACTR3.
Furthermore, a large number of cytoplasmic landscape proteins regulate post-translational modifications of proteins, i.e., ubiquitination and SUMOylation. Both these modifications are reversible processes that regulate protein localization and activity. Ubiquitination marks proteins for proteasome-dependent degradation, while sumoylation is not used to tag proteins for degradation but modifies proteins involved in many cellular processes including gene expression, chromatin structure, signal transduction, DNA damage response and cell cycle progression. Molecular chaperone proteins such as BAG5 and HSP90AA1—that has very many interactions in the landscape, such as forming a complex with the adaptor protein ST13—play an important role in maintaining a protein’s native folding and function, which protects against the buildup of misfolded proteins [97]. When misfolded proteins interact with chaperones (which cannot be refolded), they can be shuttled for ubiquitin-dependent proteasome degradation.
As for ubiquitination-related proteins, the landscape contains both ubiquitin-conjugating enzymes—including UBE2J1 and BIRC6, an anti-apoptotic protein that has CASP8 (which itself is a protease with multiple interactions in the landscape) and DIABLO as its ubiquitination targets—and many E3 ubiquitin ligases, i.e., ASB3 (which degrades TNFRSF1B) and ASB8, the complex of COP1, COPS9, DCAF1 (which degrades ESR1) and RBX1, DCAF12, FBXL17 (which degrades PRMT1), RNF115 (which degrades EGFR and FLT3), RNF4 and RNF41. After having been ubiquitinated, proteins are degraded by the 26S proteasome complex, of which the landscape proteins ADRM1, PSMD7, PSMD14 are subunits. In addition, PSME4 is an associated component of the proteasome that promotes ubiquitin-independent degradation and binds with PSMD14 and FBXL17. Ubiquitination is counterbalanced by the action of deubiquitinating enzymes (DUBs) that remove ubiquitin from target proteins, such as UCHL1 and USP4. Lastly, DESI1, PIAS3, PIAS4, SENP1, and SENP6 are proteins that can operate in the cytoplasm and—mainly—the nucleus and that regulate the SUMOylation of proteins.
The landscape also contains several RNA-binding proteins (RBPs) that function both in the cytoplasm and nucleus and regulate various aspects of mRNA metabolism, including mRNA processing, stability, transport and translation and thus affect neurodevelopment, synapse homeostasis, and the neuronal cytoskeleton [98]: EDC4, MARF1, MEX3B, and PAN3—that all form a complex—IGF2BP1, NCL, PIWIL1—which binds and stabilizes the mRNA of DHX57MAPT, RBMS1 (that complexes with MEX3B), RBFOX1, SPATS2, TNRC6A, and YTHDF2.
In addition, the landscape contains many cytoplasmic kinases that are involved in specific signaling cascades, including MAPK3—a kinase that regulates and interacts with many other landscape proteins—and the NF-kappa-B (NFKB) kinase complex that interacts with the landscape proteins/kinases LRRC14, TANK—that downregulates TNFB expression—TBR1, TNIP2, TRAF3, and TRIP6. Other kinases in the landscape include CRKL (a kinase that interacts with multiple other landscape proteins, including increasing the expression of HDC and TNFB as well as activating MAPK3), GRK4 (which inhibits MAPK3), and the cAMP-dependent PRKAR2A. In addition to kinases, a number of phosphatases operate in the landscape, such as DUSP6, PPP1R3A, PPP1R3B and PPP2R2B.
Furthermore, multiple cytoplasmic landscape proteins—some of which can also be located in the nucleus—regulate the cell cycle. In this respect, CDKN1A, a protein with many interactions in the landscape, is an important regulator of cell cycle progression (and other landscape processes). PIM1 phosphorylates CDKN1A, which results in the relocation of CDKN1A to the cytoplasm and enhanced CDKN1A stability, while the nuclear/cytoplasmic protein FHIT—that also complexes with ENO1—upregulates CDKN1A expression. Other cytoplasmic landscape proteins involved in cell cycle regulation are the kinases GAK, PKN2 and STK38, and TOB2.
Lastly, four ‘miscellaneous’ landscape proteins can be located in the cytoplasm and—to some extent—in the nucleus and have (very) many interactions with other landscape proteins, i.e., CASP8, EP300, ESR1 and RICTOR. First, CASP8 is a key regulator of apoptosis and its activity/expression is regulated by arachidonic acid, butyric acid, citrate, GABA, glutamate and palmitic acid. Furthermore, CASP8 activity is regulated by—among other proteins—cytoplasmic DIABLO and nuclear IP6K2 (an enzyme involved in phosphatidylinositol metabolism, see above). In addition, EP300 functions as an acetyltransferase for proteins such as ESR1, ETS1, GABPB1, PHF5A and TADA3 (in the nucleus), and MAPK3, MAPT, PRMT1 (in the cytoplasm). Upon binding its ligand, the female sex hormone estradiol, ESR1 can either function as a cytoplasmic adapter protein or as a nuclear transcription factor. The nuclear translocation—and hence transcriptional activation/activity—of ESR1 activity/activation is regulated by MACROD1 and the WWC1-DLC1-complex. RICTOR is part of the mammalian target of rapamycin (mTOR) complex 2 (mTORC2), a multiprotein complex critical for cell growth and metabolism. RICTOR forms a functional complex with multiple landscape proteins and regulates the expression of membrane-located DRD2, cytoplasmic PSMD7 and PSME4, and mitochondrial NDUFA4.
  • Organelles
Multiple interacting landscape proteins are involved in regulating mitochondrial functioning in both pre- and postsynaptic neurons.
Specifically, several TD landscape proteins are mitochondrial matrix proteins that regulate mitochondrial translation, including translation factors (GUF1, LRPPRC, GFM2, MTIF3, MTRFR), mt-tRNA synthetase (NARS2), 39S subunit proteins of mitochondrial ribosome (MRPL3 and MRPL40) and rRNA methyltransferase MRM1. Mitochondrial translation is essential for maintaining the cellular energetic balance through the synthesis of proteins involved in the oxidative phosphorylation (OXPHOS). This is required for adenosine triphosphate (ATP) production and the folding of the mitochondrial cristae. Therefore, impaired mitochondrial translation results in diminished ATP production and consequent cellular energy deficit [99], as well as impaired maintenance of mitochondrial DNA (mtDNA) [100].
Several mitochondrial proteins are involved in importing and sorting other proteins (IMMP2L, XPNPEP3, and DNAJC15). Specifically, IMMP2L and DNAJC15—located in the mitochondrial inner membrane—are involved in the processing and activation of DIABLO, which is subsequently released into the cytosol, where it can initiate apoptosis through activating caspases (such as CASP8). Other landscape proteins are involved in mitochondrial fusion and cristae formation (OPA1) and mitophagy (PARK7 and MAP1LC3B).
Multiple mitochondrial landscape proteins operate in metabolic pathways. These include proteins that regulate the metabolism of: (1) carbohydrates related to the tricarboxylic acid (TCA) cycle, such as the interconversion of citrate (CIT) to isocitrate via cis-aconitate (CAA), catalyzed by ACO2, the transport of citrate by SLC25A1, and the conversion of malate to pyruvate catalyzed by ME2; (2) the urea cycle, in which the CPS1 enzyme is required to convert ammonia into urea and protect the brain from ammonia toxicity [101]; (3) amino acids, including NAT8L, an enzyme that synthesizes N-acetylaspartate (NAA), which is subsequently converted with glutamate to form N-acetylaspartyl-glutamate (NAAG), in a cytoplasmic reaction catalyzed by RIMKLA and RIMKLB; (4) choline and betaine, with both enzymes catalyzing one step of the two-step process of choline to betaine conversion: CHDH and ALDH7A; and (5) detoxification/control of reactive oxygen species (ROS) levels and glutathione metabolism (TXNRD2 and MGST1).
The neurodevelopment and normal function of synapses also depend on a readily available supply of ATP. In neurons, the majority of ATP is generated in the mitochondria by OXPHOS via the electron transport chain (ETC) and the ATP synthase complex. Multiple landscape proteins are subunits or assembly factors of the ETC, specifically Complex I proteins (NDUFA13, NDUFA6, NDUFB1, and NUBPL), Complex IV proteins (NDUFA4, PNKD), and the ATP synthase complex (ATP5IF1). Furthermore, creatine kinase B (CKB) reversibly catalyzes the transfer of phosphate between ATP and creatine (CR) for the synthesis of phosphocreatine (PCR) in the so-called phosphocreatine shuttle, which acts as an energy-buffering system between the mitochondrial sites of ATP production and the cytosolic sites of ATP utilization. In addition, MPV17, an ion channel in the inner mitochondrial membrane, may also be involved in the control of OXPHOS, apart from its role in mitochondrial deoxynucleotide homeostasis and mtDNA maintenance. Similarly, POLG that encodes the catalytic subunit of DNA polymerase γ, is responsible for mtDNA replication and maintenance.
Lastly, MICU3 is a brain-specific enhancer of mitochondrial calcium uptake that forms a heterodimer with MICU1.
The endoplasmic reticulum (ER) is a large, dynamic organelle that has multiple roles in the cell. First, the ER has an important role in lipid biosynthesis and metabolism, e.g., enzymes such as CEPT1 (involved in phospholipid metabolism), CERS5 and SGPP2 (involved in sphingolipid metabolism), and DHDDS and NUS1 (involved in lipid metabolism in general). In addition, ER-located enzymes in the landscape are involved in protein modification, including fucosylation (POFUT1) and palmitoylation (ZDHHC11, which catalyzes the addition of palmitic acid onto various proteins thus affecting their localization and function). Furthermore, landscape ER proteins regulate intracellular protein transport: LMAN2, MPPE1, PIGW, SORT1, and VAMP7. Other landscape proteins are involved in ubiquitin-dependent degradation of misfolded ER proteins: chaperone proteins DNAJC18 and DNAJC22, GABARAPL2, SEL1L, SELENOK, TMBIM6, TMEM33, and UBE2J1. Lastly, TMBIM6 also functions as a calcium transporter that modulates ER calcium homeostasis.
The Golgi apparatus (GA) is the main site of protein modification, which includes transferring chondroitin sulfate (CS), the most abundant type of proteoglycan expressed in CNS acting as a barrier molecule affecting axonal growth, neuronal cell migration and plasticity [102] (CSGALNACT2), and transferring palmitic acid onto DRD2 (ZDHHC8), which is important for DRD2 relocating to the neuronal membrane [103]. In addition, the GA is involved in regulating protein trafficking (AP3B2, DOP1B, MPPE1, SORT1, and VAMP7) and zinc transport (SLC30A6).
The peroxisomes are multifunctional organelles that contribute to fatty acid/lipid metabolism (ACAA1 and SLC27A2) and metabolite/cofactor transport (SLC25A17, which is inhibited by pyridoxal 5′-phosphate). In addition, two landscape proteins are involved in peroxisome biogenesis and proliferation, i.e., PEX2 and PEX11B.
The lysosomes constitute the major proteolytic compartment and contain multiple landscape proteins, i.e., KLHL22, LAPTM5 and VPS13A, that are involved in the degradation of target proteins such as DEPDC5 and NPRL2. In addition, the peroxidase MPO is activated by arginine, inhibited by butyric acid, forms a functional complex in the extracellular space with FN1, and is involved in oxidative stress and lysosomal damage.
In presynaptic neurons, several landscape proteins regulate the function of endosomes (EN), including membrane trafficking, degradation of proteins such as EFGR, and protein transport to lysosomes or cytoplasmic vesicles (CVs) (ARL8B, DNAJC13, PIKFYVE, and ZFYVE28). In turn, CVs mediate autophagy and protein transport to and from the plasma membrane and between organelles, and landscape proteins are specifically involved in CV-linked autophagy (GABARAPL2, MAP1LC3B, and TBC1D5), CV trafficking, exocytosis (of proteins such as PAM, an enzyme that catalyzes the conversion of inactive to active (secreted) neuropeptides) and/or recycling (ASTN2, CLTCL1, PTPRN2, SORT1, and VAMP7).
  • Nucleus
In the nucleus of pre- and postsynaptic neurons, four groups of proteins can be discerned. The first group of proteins are part of and/or regulate the function of the nuclear pore complex (NPC) that mediates nucleocytoplasmic transport, genome organization and gene expression [104]: GLE1, NUP85, NUTF2, RANBP1, RANGAP1, TOR1A, TNIK, and WDR62. The second group of proteins regulate rRNA processing and ribosome synthesis, including BMS1, DGCR8, NOP14, and TCOF1. The third group of landscape proteins in the nucleus are functionally involved in transcriptional regulation as well as DNA and histone modifications. In this respect, the landscape contains a large number of transcription factors, such as BBX, CDX2, GABPB1, GTF2H1, GTF2IRD1, HOXB4, JUND, MYT1L and POU3F2 (which both have a key role in neuronal differentiation), NR4A2 (which is highly expressed in dopaminergic neurons and, e.g., upregulates DRD2 expression), PHF3, TEAD2, TERF2IP, USF2, and the zinc finger proteins ZNF536, ZNF664, ZNF837, and ZNHIT3. In addition, some of the landscape transcription factors are specifically known to activate gene transcription, e.g., ETS1—which is activated by TCF20, itself a transcriptional activator—GTF2A1, MRTFA, and POU4F2. Other transcription factors specifically repress gene transcription, including AEBP1, ATN1, BHLHE40, FOXP1—which is specific to dopaminergic neurons, regulates the expression of landscape proteins such as CDKNA1 and CNTN6, and is regulated by EP300POU4F2, RERE—which functionally interacts the intracellular, nuclear domain of NOTCH1 (NOTCH1-ID)—RUNX1T1—which interacts with ATN1, ETS1 and the histone-modifying enzyme (see below) EP300—and TBR1. Furthermore, the landscape contains a few other proteins that regulate the transcriptional process itself, i.e., the subunits of the DNA-dependent RNA polymerases II (POLR2I) and III (POLR3C, POLR3H), and XRN2. Moreover, as transcription proceeds, transcripts are (differently) capped, spliced, and polyadenylated so they can be efficiently exported across the nuclear envelope to the cytoplasm for translation of mRNA to protein. Landscape proteins that are involved in this pre-mRNA processing include FIP1L1 (involved in polyadenylation), LRPPRC (which, in addition to its role in the mitochondria (see above), regulates nuclear mRNA export), and multiple proteins that regulate pre-mRNA splicing, as part of splicing complexes: ESS2, GEMIN6, SF3A2, SNU13, three splicing factors of the SRSF protein family—SRSF3 (also involved in nuclear mRNA export), SRSF4 and SRSF7—and SUGP1. In addition, WDR61—a nuclear protein that has multiple interactions with other landscape proteins—and PHF5A bind each other and are a part of the PAF1C complex that regulates transcription elongation and chromatin structure (see below) [105], with PHF5A also being involved in pre-mRNA splicing.
Multiple landscape proteins are implicated in chromatin remodeling, i.e., post-translational modifications (PTMs) of DNA, histones and non-histone targets, including acetylation, methylation and sumoylation, which in turn affects gene transcription [106]. The PTMs are performed by multi-protein complexes that are recruited to act at specific regions of chromatin, and landscape proteins that are members of these complexes include ACTR8, INO80D and MCRS1 (that bind and are part of the INO80 complex), BCL11A and BCL7A (subunits of BAF complex), BRPF3, KANSL1, KAT14 and TADA3 (that bind and are part of the ATAC complex, with TADA3 also activating CDKN1A and being regulated by EP300), MORF4L2, and L3MBTL2 and PHC3 (that are part of the polycomb repressor complex, which keeps genes in a non-transcribed state). As for specific PTMs, the aforementioned and other landscape proteins are involved in DNA/histone acetylation (BRPF3, EP300—that also acts on non-histone targets, including ETS1, GABPB1 and PRMT1KANSL1, KAT14, MCRS1, MORF4L2, PHF14, and TADA3), methylation (six histone methyltransferases—ASHL1, KMT5A, KMT2C, KMT2D, NSD1 and NSD3—and one histone demethylase, KDM5B), and (de)sumoylation (PIAS4—which mediates the sumoylation of, e.g., PARK7—and SENP6).
Lastly, the fourth group of nuclear landscape proteins are involved in DNA damage repair: ERCC5 (involved in repairing UV-induced DNA damage), GTF2H1 (a transcription factor (see above) that also repairs damaged DNA), IHO1 (which repairs double-strand DNA breaks), MAU2 and NIPBL—which are part of the cohesin complex that repairs DNA damage—RPA2 (which binds and stabilizes ssDNA) and XRCC6, a protein that repairs DNA damage and has very many interactions with other landscape proteins.

Microglial Cells and Astrocytes

  • Microglial cells
Microglial cells play diverse roles in brain development and adult brain function, including the regulation of synaptic plasticity and pruning. They also serve as brain macrophages and are important for the brain immune response, as they are primary sources of immune response factors such as cytokines that in turn can modulate synaptic plasticity [107]. The membrane receptors/proteins (CD47, CX3CR1 (which is a microglia-specific receptor), ITGA4, and ITGB1) and extracellular cytokines (CX3CL1) and other molecules (FN1 and TNN) that are expressed in and regulate the function of microglial cells have already been described above in the part about pre- and postsynaptic neurons.
  • Astrocytes
Astrocytes and their projections envelop pre- and postsynaptic neurons and closely approach the synaptic cleft, representing key components of the synapse that are active mediators of synaptic function [108,109]. In addition, astrocytes are important for maintaining the blood–brain barrier (BBB) and brain cholesterol metabolism [110]. A number of protein interactions that (also) occur in astrocytes have already been described above in the part about pre- and postsynaptic neurons. Below, we have added proteins and their interactions that are—to some extent—specific to astrocytes.
NR1H2 (also known as Liver X receptor beta, LXRβ) is a transcription factor that is mainly expressed in astrocytes and other glial cells [111] and that has an important role in regulating brain cholesterol metabolism and dopaminergic neuronal function. In the landscape, NR1H2 downregulates the expression of both TSHR and DIO2. TSHR is a GPCR that signals through stimulatory G-proteins and forms a functional complex with FN1 but that also regulates thyroid hormone synthesis through binding and being activated by its ligand, thyroid stimulating hormone (TSH). In addition, DIO2 is an ER membrane-located enzyme that the conversion of thyroxine or T4 (the inactive form of thyroid hormone) to triiodothyronine or T3 (the active form of thyroid hormone). T3 generated by DIO2 is then transported out of astrocytes and into neurons by the membrane transporter SLC16A2. Furthermore, DIO2 is degraded by the ER membrane-located ubiquitination protein UBE2J1, it forms a complex with cytoplasmic RBX1, and it is involved in downregulating the expression of the transcription factor NR4A2. NR1H2 also regulates the expression of the membrane cholesterol/lipid transporter ABCG8. Lastly, histamine (see above) is transported in and out of astrocytes (and presynaptic neurons) by the membrane transporters SLC22A3 and SLC29A3, while in astrocytes, it is also methylated and hence inactivated by the HNMT enzyme.
Below, we will provide six examples of key landscape proteins that are interesting putative (novel) drug targets for TD—i.e., FLT3, NAALAD2, CXC3R1 and CXC3L1, OPRM1, and HRH2—and we discuss why and how these targets can be linked to four aspects of target specificity (i.e., regional, temporal, molecular and modulatory specificity).

3. Discussion

In this paper, we have compiled, analyzed and integrated different types of omics data into a molecular landscape of TD. Below, we will discuss the main findings from our analyses and provide examples of putative drug targets derived from the landscape that could be modulated with a beneficial effect on TD.
First, we tested the (general) hypothesis that the expression of genes for a specific disease will be relatively enhanced in tissue and cell types that are vulnerable to this disease. We found that TD candidate gene expression is enhanced in the brain and pituitary, two tissues that were shown to be rich in neural cells [112]. Our subsequent spatiotemporal analysis of brain tissue revealed that especially the cerebellum, cortex, striatum, and thalamus across various developmental periods may be involved in TD etiology. These results are consistent with previous reports of alterations in anatomical and functional circuits involving the cortex, striatum and thalamus (see above) as well as the cerebellum being key contributors to the pathogenesis of TD [113,114]. Furthermore, our analyses of mouse data showed enriched expression of TD candidate genes in two cell types in particular, i.e., Drd2+ MSNs and layer 6 corticothalamic neurons. In keeping with their potential involvement in TD, these two cell types are also enriched among genes that were found to be downregulated in the postmortem striatum of TD patients, which further suggests that TD onset and progression may be particularly related to deficits in the function or presence of these cells. Drd2+ medium spiny neurons (MSNs) are inhibitory/GABAergic neurons (MSNs) that express the dopamine D2 receptor and, together with Drd1+ MSNs, they constitute approximately 95% of the neurons in the striatum, the main input structure of the basal ganglia. Drd2+ MSN neurons act as crucial regulators of striatal output via the ‘indirect’ pathway and so alter striatal-mediated ‘action’. Furthermore, these MSNs receive convergent excitatory inputs from the cortical and thalamic areas and further project to the output nuclei of the basal ganglia circuit [115]. In addition, Drd2+ MSNs have been shown to be crucial in habit formation in mice [116,117]. This is particularly interesting because both from a cognitive-behavioral and neuroscientific perspective, tics—the hallmark of TD—can be viewed as habits that have been formed over time and that are associated with premonitory sensations and can, at least partially, be controlled [118,119,120,121,122]. As a result, habit reversal training (HRT) is currently among the first-line behavioral interventions aimed at reducing tics [123,124]. Furthermore, rodent studies have shown that Drd2 expression changes during development, with increased expression across early postnatal life and peak Drd2 expression by early adolescence, followed by decreased expression in adulthood (reviewed in [125]). In accordance, the dopaminergic excitability of Drd2+ MSNs also decreases during the juvenile period [126] and in humans, a similar peak of dopaminergic innervation of the striatum was observed in preadolescence, with a subsequent decrease during adulthood [127]. In addition, postmortem studies have shown an increased DRD2 density in the frontal cortex and striatum of TD patients [128,129] while it was also demonstrated in monozygotic twins that differences in DRD2 binding influence TD severity [130]. Based on all these findings, it seems that drugs aimed at reducing DRD2 activity during the critical time window associated with TD (i.e., childhood to (early) adolescence) would be beneficial and, indeed, DRD2 antagonists are currently still the standard pharmacological treatment of TD/tics [131]. The downregulated genes in postmortem TD striatum were also enriched for genes that are highly specific to cholinergic neurons, in line with the observed reduction in cholinergic (ChAT+) interneurons in postmortem immunohistochemical studies of TD patient striatum [64,132]. Interestingly, habit formation (see above) is (also) modulated by striatal cholinergic interneurons [133,134], and these neurons are also important for synchronizing the activity of (Drd2+) MSNs that suppresses or ends a movement bout [135]. In addition, pharmacotherapy with cholinergic drugs has been observed to modulate motor tics [136]. Lastly, we found that the upregulated genes in postmortem TD striatum are highly expressed in glial and immune cells, which may imply that inflammation-mediated mechanisms (also) contribute to TD, but this enrichment was not found through our analysis of the genetic data. Taken together, our tissue and cell type specificity analyses suggest that TD is not confined to a single brain region and that there are potentially multiple cellular routes to TD.
Our analyses of the TD candidate genes revealed two significantly enriched pathways: ‘cAMP-mediated signaling’ and ‘Endocannabinoid Neuronal Synapse Pathway’. In Figures S1 and S2, we provide a graphical representation of the two pathways at the cellular level in which the proteins encoded by TD candidate genes and the metabolites implicated through the PRS-based analyses are indicated in purple. First, cAMP (3′-5′-cyclic adenosine monophosphate) is an important second messenger molecule that is used for intracellular signal transduction. cAMP is produced from ATP by adenylate cyclases (such as the landscape protein ADCY2) that themselves are activated through stimulatory GPCRs (including the landscape proteins CRHR1, HRH2, OPRM1, and TSHR) or inhibited through inhibitory GPCRs (landscape proteins DRD2—the dopamine receptor that interacts with many landscape proteins and is also enriched in TD-linked Drd2+ neurons (see above)—FPR1, FPR2, FFAR3, OPRD1, OPRK1, and OPRM1). Furthermore, cAMP is degraded by phosphodiesterase enzymes [137] such as the landscape protein PDE4A and it regulates synaptic function through activating protein kinase A (PKA) (of which the landscape protein PRKAR2A is a regulatory subunit) [138]. All these findings suggest that abnormalities in cAMP signaling could be a central functional theme in TD etiology. In this respect, studies of postmortem brains from TD patients have revealed reduced concentrations of cAMP in the cerebral cortex and putamen [139,140]. Conversely, increased cortical and striatal levels of cAMP and associated reduced levels of phosphodiesterase activity have been associated with stereotypic, tic-like behavior of deer mice [141]. Changes in cAMP levels and activity in dopaminergic neurons during development may also underlie tic-like symptoms in ADHD, a disorder that is highly comorbid with TD [142]. Lastly, and interestingly, some drugs that target cAMP-mediated signaling are already in use to treat TD or in the clinical trial phase, e.g., the DRD2 modulator aripiprazole, the DRD2 antagonist risperidone and the opioid receptor antagonist naloxone (see below), further implying that cAMP signaling is altered in TD.
The second pathway that is enriched within the TD candidate genes points towards an involvement of (altered) endocannabinoid signaling in TD etiology. The endocannabinoid system (ECS) comprises two cannabinoid receptors—CNR1 and CNR2—their ligands, the endocannabinoids, and the enzymes regulating endocannabinoid synthesis and degradation. CNR1 is highly expressed in the CNS, while CNR2 is mainly expressed in immune cells and activated microglia, with some expression also detected in the CNS. Furthermore, endocannabinoids are endogenous lipid-signaling molecules that are produced in the cell membrane from phospholipid precursors and act as messengers that modulate pre- and postsynaptic functions [143,144] in multiple brain regions. The two best characterized endocannabinoids are arachidonoyl ethanolamide (AEA or anandamide) and 2-arachidonoylglycerol (2-AG). Interestingly, endocannabinoids are also derivatives of arachidonic acid (AA) and our PRS-based analyses implicated genetic sharing between TD and increased AA blood levels (see below). Previous studies have also suggested altered ECS signaling in the pathophysiology of TD. In this respect, studies have yielded inconclusive results regarding genetic variation in CNR1 being associated with TD [145,146] but significantly increased CSF levels of several endocannabinoids as well as AA were reported in TD patients compared with controls [147]. In addition, the enriched ‘Endocannabinoid Neuronal Synapse Pathway’ contains the key landscape protein DAGLA, an enzyme that can be located in the pre- and postsynaptic membrane (see above) and that produces 2-AG in an autocrine fashion [148]. Moreover, Dagla KO zebrafish show stereotypical movements and deficits in motion perception [149]. Interestingly, several enzymes in the enriched endocannabinoid-related pathway (shown in Figure S2) are also encoded by genes that are not TD candidate genes—and that are therefore not in the landscape—but of which the expression is differentially regulated in the blood of TD patients. Specifically, FAAH—an enzyme that hydrolyzes AEA to AA—was upregulated in the blood of TD patients aged 5–9 [66]. In addition, ABHD6—an enzyme that hydrolyzes 2-AG to AA—was upregulated in the blood of TD patients aged 13–16, and ABHD6 expression was positively correlated with symptom severity in adult TD patients [66,67]. AEA can also be produced through the hydrolysis of N-acyl-phosphatidylethanolamines (NAPEs) by the enzyme NAPEPLD—that was downregulated in the blood of TD patients aged 5–9 [66]—or by the combined action of the enzymes ABHD4 (downregulated in the blood of TD patients aged 13–16) and GDE1 (of which the expression in blood was negatively correlated with TD severity) [66,67]. Furthermore, inhibition of FAAH and MGLL (an enzyme that degrades 2-AG to AA) resulted in increased levels of AEA and 2-AG, respectively, which—in mice—disrupted habit formation [150,151] that has been hypothesized to also be underlying TD (see above). In addition, when bound and activated by endocannabinoids, CNR1 can act as an inhibitory GPCR that suppresses cAMP production and subsequent PKA activation [152,153]. This constitutes a link between the endocannabinoid pathway and the cAMP pathway discussed above, with the landscape proteins ADCY2 and PRKAR2A also being involved in both enriched pathways. Moreover, when CNR1 and DRD2 are co-expressed, co-stimulation with agonists of these two receptors led to an increase in cAMP production in striatal neurons, while when applied separately, CNR1 or DRD2 agonists inhibited cAMP production [154], which suggests a link between endocannabinoid, cAMP and dopaminergic signaling. Lastly, cannabinoid receptors are also a prime target of the exogenous cannabinoid D9-tetrahydrocannabinol (THC), the psychotropic component of cannabis. In this respect, a putatively beneficial role of cannabis in TD treatment comes from anecdotal evidence of patients reporting improvement in their tics after using cannabis [155] as well as some case studies and clinical trials (summarized in [156,157]). That being said, as most of these studies provide only low level of evidence for a beneficial effect, the European and American authorities currently only recommend cannabis use for (adult) treatment-resistant TD cases in which established therapy did not alleviate symptoms [10,11,12]. In addition, developmental observations suggest that endocannabinoid receptor expression increases only gradually in the postnatal period, which (partially) explains the observed insensitivity to the psychoactive effects of cannabis in young people. Therefore, it was hypothesized that children may respond positively to medicinal applications of cannabis without undesirable central effects [158]. However, only three single case reports are currently available to suggest that a medicinal form of cannabis would be effective and safe for treating severe tics in minors with TD [159,160,161].
In addition to the pathway analysis, we conducted further analyses for biological functions that are enriched within the TD candidate genes. Most of the enriched functions are related to processes such as development, migration and proliferation of neurons/brain cells (leading to neuronal circuitry development), synaptic function, and neurotransmission. In this respect, previous studies have reported altered synaptic plasticity in TD patients compared to controls (in the cortex and brain stem) [162,163,164]. In addition, a recent study assessed the enrichment of multiple gene sets using individual-level genotype data and identified three genome-wide significant gene sets that are implicated in TD, i.e., ligand-gated ion channel signaling, lymphocytic signaling, and cell adhesion and trans-synaptic signaling [5].
Apart from the analyses of which we discussed the results above, we performed PRS-based analyses to determine the presence, extent, and direction of genetic overlap between TD and blood or CSF metabolite levels. Below, we will discuss the main findings from these analyses. As a general comment, we would like to point out that although different levels of metabolites in the blood (plasma or serum) may not directly reflect changes in the brain, they reflect alterations in metabolic pathways in the body and may therefore be associated indirectly with the development of TD. In addition, many metabolites can cross the BBB—via transporters or diffusion—and changes in the blood levels of these metabolites likely lead to more direct changes in the brain and vice versa.
First, we found genetic sharing between TD and higher blood levels of betaine. Betaine (also known as trimetylglycine) is an amino acid that is taken up into the body through the diet or can be synthesized in the mitochondria from choline in a two-step process catalysed by landscape proteins CHDH and ALDH7A. Betaine acts as an important cellular osmolyte and a methyl donor for the conversion of homocysteine to methionine—and hence increases methionine levels [165]—as part of the methionine cycle [166]. This cycle produces S-adenosylmethionine (SAM) and S-adenosylhomocysteine (SAH), key modulators of cellular methylation and hence epigenetic regulators [167,168]. Interestingly, MAT2A and MAT2B, two enzymes from the methionine cycle—that converts methionine to SAM—were found to be upregulated in the blood of TD patients aged 13–16 [66], while the landscape proteins PRMT1 and AHCY catalyze the subsequent conversion of SAM to SAH and SAH to homocysteine, respectively. In addition, the blood expression of PRMT1 is correlated with TD severity [67]. Furthermore, methionine was shown to induce stereotypy and prepulse inhibition deficits in mice [169] and to increase amphetamine-induced stereotyped behaviors in rats [170]. Higher homocysteine serum and plasma concentrations were also found in patients with primary dystonia compared to controls [171,172]. All these findings provide further support to an involvement of homocysteine/methionine metabolism in TD, in which alterations in homocysteine/methionine levels would lead to changes in methylation of downstream substrates, including histones and result in altered gene expression [167,168].
We also identified a shared genetic etiology between TD and decreased blood levels of pyridoxate, the primary catabolic product of vitamin B6. Blood levels of pyridoxate are strongly correlated with blood levels of its precursor pyridoxal 5′-phosphate (PLP), the active form of vitamin B6. Therefore, pyridoxate has been suggested as a possible complementary and short-term marker of vitamin B6 status [173]. In this respect, previous studies have shown that supplementation of vitamin B6 in combination with other molecules such as magnesium [174,175] was safe and effective in alleviating symptoms of TD in children and adolescents. Furthermore, enzymes involved in the metabolism of pyridoxate and PLP were found to be differentially expressed in TD patients: ALPL—that catalyzes the dephosphorylation of PLP to pyridoxal (the transportable form of vitamin B6)—was upregulated in the postmortem striatum of TD patients [64], while PDXK—that catalyzes the conversion of vitamin B6 precursors to their phosphorylated counterparts, including PLP—and PHOSPHO2—that dephosphorylates PLP—were downregulated in the blood of children with TD [66]. Moreover, the blood expression of AOX1—that converts PLP to pyridoxate—was positively correlated with TD severity [67]. Interestingly, magnesium—that is a cofactor of many landscape proteins—is (also) a cofactor for most of these enzymes. Lastly, and importantly, vitamin B6 (PLP) acts as a cofactor in various enzymatic reactions, including the conversion of histidine to histamine by the important landscape protein HDC.
Furthermore, we found genetic sharing between TD and increased blood levels of Tumor necrosis factor-beta (TNFB), a cytokine that is produced by lymphocytes. In the landscape, TNFB interacts with several proteins, and it induces downstream signaling by binding to heterodimeric TNFRSF1A and TNFRSF1B [176]. TNFRSF1A and TNFRSF1B expression is upregulated in the striatum of TD patients [64] and the blood expression of TNFSRF1B is negatively correlated with TD symptom severity [67]. In addition, a mutation in TNFRSF1A has been linked to persistent tics [177]. A direct involvement of TNFB in the pathogenesis of TD has not been studied but some evidence for its (putative) role in TD comes from studies on auto-immune disorders. First, TNFB regulates the formation of tertiary lymphoid-like structures [178,179], such as the murine nasal-associated lymphoid tissue (NALT) [180] that is analogous to the human tonsils/adenoids [181]. Group A streptococcal (GAS) bacteria that are present in both mouse NALT and human tonsils [182] are crucial in the pathophysiology of PANDAS, an auto-immune disease that presents itself as a combination of tics and OCD-like symptoms [183]. In addition, streptococcal superantigens—that are involved in PANDAS [184]—directly stimulate the secretion of TNFB [185]. Furthermore, TNFB is crucial for protecting against Toxoplasma bacterial infection in the CNS [186], which is interesting because a possible role of Toxoplasma infection in the pathogenesis of TD and tic disorder has been reported [187,188].
Furthermore, we identified genetic overlap between TD and decreased blood levels of myo-inositol (MI). MI is a metabolite of the second messenger phosphatidylinositol (PI) [189], and PI and its metabolites regulate normal human brain development and aging as well as the organization of the cell membrane [94,95]. In addition, MI (derivatives) play crucial roles in various processes, such as signal transduction, osmoregulation, membrane biogenesis and trafficking, cytoskeletal organization, gene expression, DNA repair, energy metabolism and autophagy, and they have been implicated in multiple disorders [190]. In line with our findings, a brain MRS study in TD reported reduced MI levels in the left frontal cortex [191]. The levels of intracellular MI are dependent on de novo synthesis, conversion of MI derivatives, uptake from the extracellular fluid and/or degradation. In this respect, a role for altered MI signaling in TD is also implicated by the fact that some key enzymes involved in the synthesis of MI were found to be differentially expressed in the brain and/or blood of TD patients: HK2 (increased in the postmortem striatum of TD patients [64], ISYNA1 (an enzyme that catalyzes the rate-limiting step in MI synthesis and of which the expression was downregulated in the blood of TD patients aged 5–9 and 13–16 [66]) and the landscape protein IMPA1 (upregulated in the blood of TD patients aged 10–12 [66]). Moreover, Impa1 KO mice showed TD-like behaviors, including increased motor activity in the open field and forced-swim tests, hyperactivity, and stereotypy in the home cage [192]. Four landscape proteins involved in the conversion of MI derivatives were also differentially expressed: PLCH1 (downregulated in TD striatum [64]), PI4KA (downregulated in the blood of TD patients aged 5–9 [66]), PIKFYVE (upregulated in blood of TD patients aged 13–16 [66]) and IP6K2 (alternatively spliced in the blood of TD patients and blood expression is negatively correlated with TD severity [67,68]. Furthermore, the expression of the MI transporter SLC5A11 was dysregulated in the blood of TD patients (upregulated and downregulated in TD patients aged 5–9 and 13–16, respectively [66]). Lastly, MI is catabolized in the kidneys by the enzyme MIOX, and blood expression of MIOX was found to be upregulated in TD patients aged 5–9 [66].
Our PRS-based analyses also revealed genetic sharing between TD and increased or decreased blood levels of multiple types of lipids, including glycerophospholipids, sphingolipids, triacylglycerols, fatty acids, myo-inositol (see above) and lipid ratios. As for fatty acids (FA), these are utilized as energy source, signaling molecules and structural components of membranes [193], and depending on their chemical structure and chain length, they are classified as saturated, monounsaturated, or polyunsaturated (PUFA). In this respect, we found genetic sharing between TD and increased blood levels of saturated, long chain FA such as stearate (stearic acid) and palmitate (palmitic acid), as well as (long chain) PUFA. These PUFA are divided into omega-6 FA—including the essential PUFA linoleate (linoleic acid, LA) that is a precursor of gamma-linolenate (gamma-linolenic acid) and arachidonate (arachidonic acid, AA, see above)—and omega-3 FA, such as the essential PUFA alpha-linolenate (alpha-linolenic acid). Palmitic acid (PA) is the most common saturated FA found in the human body and can be provided through the diet or be synthesized endogenously from other FA—such as palmitoylethanolamide (PAE) that is increased in the CSF of TD patients [147] and that is converted to PA by FAAH, an enzyme that is also involved in AA synthesis (see above)—carbohydrates and amino acids. PA represents 20–30% of total FA in membrane phospholipids and adipose triacylglycerols [194] and it has multiple functions—reflected by the multiple landscape proteins of which it regulates the expression or activity—including palmitoylation, a post-translational modification of proteins that involves the attachment of PA to specific cysteines, which increases the hydrophobicity of cytoplasmic proteins and hence increases their affinity for cytosolic membrane surfaces. Furthermore, AA is the biologically active omega-6 FA and represents about 20% of the neuronal FA. AA is converted to various eicosanoids that are important mediators of inflammation—with both pro- and anti-inflammatory activities—and is involved in regulating synaptic transmission [195]. More specifically, AA is released from membrane phospholipids through phospholipase enzymes. Subsequently, AA can be metabolized by three different groups of enzymes, i.e., cyclooxygenases, lipoxygenases and cytochrome P450 enzymes that generate numerous biologically active mediators, many of which are potential preventive and therapeutic targets for various diseases [196]. In this respect, it is interesting that the cyclooxygenase PTGS1 and the lipoxygenases ALOX5, ALOX5AP and ALOX15B were all found to be upregulated in the postmortem striatum of TD patients [64]. Moreover, and as already discussed above, AA is a precursor for endocannabinoids and therefore, it has an important role in regulating both endocannabinoid and cAMP signaling, the two pathways that were significantly enriched in the TD candidate genes (see above). Linked to this, the extracellular and anti-inflammatory [197] metabolite LXA4—which is synthesized from AA through sequential actions of lipoxygenases—mostly exerts its effects through GPCRs such as the landscape protein FPR2 and CNR1. As for its effect on CNR1, LXA4 was found to act as an allosteric modulator of CNR1, thereby enhancing its affinity for AEA and ultimately decreasing cAMP production [198], which may make LXA4 a potential TD treatment that could be used instead of the cannabinoids themselves (see above). Lastly, omega-3 and omega-6 FA compete with each other in their effects on downstream signaling [199]. In keeping with this, omega-3 FA can decrease the bodily levels of omega-6 FA through being ingested via the diet (e.g., from fish oil) and they have important anti-inflammatory properties, e.g., through inhibiting NFKB signaling [200]. Therefore, it follows that omega-3 FA would constitute a putative adjunctive treatment of TD and indeed, a randomized, double-blind, placebo-controlled trial in children indicated that omega-3 FA supplementation may be beneficial in the reduction in tic-related impairment for some children and adolescents with TD, but not for tics per se [201].
In addition to blood metabolites, we found genetic sharing between TD and the CSF levels of two metabolites: NAAG and butyrate. As for NAAG, we will discuss this metabolite and its links with TD in detail below. Butyrate (or butyric acid, BA) is a short chain fatty acid naturally produced by bacterial fermentation of undigested carbohydrates, such as dietary fiber in the gut. Interestingly, different levels of BA-producing bacterial groups [202,203,204]—including Roseburia [72], Faecalibacteriumin [205] and Bacteroidia [206]—were found in the microbiome of TD/tic disorder patients compared to controls, suggesting that rebalancing of gut microbiota could be a promising biological therapy for TD [207]. BA then travels from the gut through the systemic circulation and reaches the brain, where it crosses the BBB via monocarboxylated transporters of the SCL16 family [208], including SLC16A3, SLC16A4 and SLC16A7 that were found to be differentially expressed in the blood or postmortem brain tissue of TD patients [64,66]. In the brain, BA can act as a regulator of the immune response through its anti-inflammatory actions in microglia [209], an epigenetic regulator that increases gene expression through inhibiting histone deacetylation [210,211] and/or as an endogenous ligand for a subset of GPCRs, including the landscape protein FFAR3 and—not shown in the landscape—FFAR2 (upregulated in postmortem TD brain) [64] and HCAR2 (of which the blood expression is negatively correlated with TD severity) [67]. BA also modulates the expression/activity of many (other) landscape proteins. In the extracellular matrix, BA decreases the expression of COL4A2, COL5A1, COL6A3, IL17A, and TNFAIP2; it increases the expression of ANXA1 and WNT5; and it regulates the acetylation and methylation of RELN. In the cytoplasm, BA increases the activity of HDC—leading to increased histamine synthesis (see below)—and CASP8, while it also increases the expression of CDKN1A and GAK. Furthermore, BA decreases the expression of cytoplasmic ESR1, NCL and PRKAR2A, and it increases the release of DIABLO from mitochondria. In addition, BA activates cAMP-PKA signaling—although independently from GCPR-mediated signaling) [212]—and there is a positive association between BA and endocannabinoids in human subjects (enrolled in a 6-week exercise intervention) [213], indicating that BA regulates both pathways that were enriched in our data. Lastly, previous studies have suggested a beneficial role of BA in treatment of neuropsychiatric conditions, such as ASDs [214,215], Huntington’s disease (HD) and PD, where it exerts neuroprotective effects, supports mitochondrial function and decreases behavioral abnormalities [216,217,218,219] through inhibiting histone deacetylation [218,220]. Furthermore, BA was shown to positively affect memory-related synaptic plasticity [221] and omega 3 FA (see above) were shown to restore the normal levels of BA-producing bacteria [222]. All these findings suggest that approaches aimed at increasing (CNS) butyrate levels—e.g., through changing the gut microbiome or having an omega 3 FA-rich diet—may be considered as (adjunctive) treatments for TD.
Based on all our data and analyses, we built an integrated molecular landscape of TD that contains interactions between more than 500 proteins, metabolites and other molecules, and above, we have already described the main landscape processes. Before providing more details about specific putative drug targets that we identified in the landscape and as a more general comment, we would like to note that multiple landscape proteins—spanning different subcellular locations—are involved in protein degradation. These include (proteins constituting) the ubiquitin-proteasome system in the cytoplasm, ER proteins involved in ubiquitin-dependent degradation of misfolded ER proteins, CV-mediated autophagy, and molecular chaperones, and all these proteins regulate the removal and recycling of misfolded proteins and damaged organelles. Furthermore, impairment of these processes and accumulation of protein aggregates and faulty organelles can lead to the generation of oxidative stress, inflammation, and cell death [223], which in turn affects synapse formation, maturation, and plasticity [224]. In addition, based on the four aspects of target specificity described in the Materials and Methods, we identified a number of putative drug targets in the TD landscape, and we will describe six of these targets in more detail below.
First, FLT3 is a membrane-located receptor tyrosine kinase that regulates inflammation and other immunity-related functions [225]. FLT3 is the most significantly associated gene in the largest GWAS of TD published to date [55]. FLT3 shows regional specificity for TD, as it is highly expressed in the brain and in our TWAS, we found TD-associated eQTLs with a positive effect on FLT3 expression in multiple brain regions (top finding for the cortex; Z-score = 4.66 and p-value = 3.24 × 10⁻⁶). In keeping with this, a recent study also found the most significant TD-associated TWAS signal for the cortex and, more specifically, the dorsolateral prefrontal cortex [226]. In the same study, the authors reported an increased expression of FLT3 in lymphoblastoid cell lines derived from TD patients compared to controls [226]. As for its temporal specificity for TD, FLT3 is highly expressed in two brain regions for which we have found spatiotemporal enrichment of TD candidate gene expression (see above), i.e., in the cerebellum (in the neonatal period and infancy, early and middle-late childhood, adolescence, and young adulthood) and in the thalamus (in adolescence and young adulthood). Moreover, FLT3 has considerable molecular specificity for TD as it interacts with multiple other landscape proteins. For example, upon binding its ligand, the cytokine FLT3LG—which has been linked to TD as well, as FLT3LG blood expression is positively correlated with TD symptom severity [67]—regulates the phosphorylation of MAPK3 and MAPT, two highly interactive landscape proteins, while it also regulates the expression of cytoplasmic PIM1 and nuclear EXCC6, two proteins that (also) interact with many other landscape proteins. Lastly, FLT3 (putatively) has modulatory specificity for TD because, and as mentioned above, TD-associated eQTLs upregulate FLT3 expression in multiple brain regions, which suggests that inhibition of FLT3 (function) could have a beneficial effect on TD symptoms. In this respect, it is interesting that inhibitors of FLT3 have been approved for various cancers and have been trialed with positive effect for multiple T-cell-mediated auto-immune diseases [225] that are genetically and/or clinically overlapping/comorbid with TD [227,228,229]. Moreover, FLT3 inhibitors have been found to have a therapeutic effect in (human) cell and mouse models of Rett syndrome, a genetically determined neurodevelopmental disorder [230], and to alleviate peripheral neuropathic pain in mice [231]. The above being said, additional in silico, in vitro and in vivo studies are needed to further determine if and how FLT3-based treatments for TD could be developed.
Another promising drug target from the landscape is NAALAD2, an enzyme that is expressed in neuronal and astrocytic membranes and that converts N-acetyl-aspartyl-glutamate (NAAG) to N-acetylaspartate (NAA, which is synthesized by the mitochondrial landscape enzyme NAT8L) and glutamate. Conversely, NAAG is formed from NAA and glutamate by the cytoplasmic landscape enzymes RIMKLA and RIMKLB. As for its regional and temporal specificity for TD, NAALAD2 is highly expressed in the pituitary, neurons and astrocytes [232] and it is highly expressed in the striatum during young adulthood [233], respectively. Furthermore, NAALAD2 has molecular specificity for TD because it works on two important, TD-linked neurotransmitters: NAAG and glutamate. NAAG is one of the only CSF markers for which we found genetic sharing with TD and it is thought to function as a neurotransmitter in both the CNS and peripheral nervous system, with its lowest expression being in the pituitary [234], a finding that is in line with NAALAD2 expression being the highest in this brain region (see above). In a magnetic resonance spectroscopy (MRS) study, patients with TD also had reduced levels of NAA in the left putamen and bilateral frontal cortex [191]. In addition, the main excitatory neurotransmitter glutamate—that is converted from NAAG by NAALAD2—interacts with multiple landscape proteins. Furthermore, a number of MRS studies have investigated the involvement of (brain) glutamate in TD, but this has yielded inconsistent results [235,236,237]. Lastly, it seems that NAALAD2 also has (putative) modulatory specificity for TD. In addition to genetic sharing (see above), we found a negative genetic concordance between TD and CSF levels of NAAG, indicating that genetic variants associated with TD are also associated with decreased NAAG CSF levels. In turn, this suggests that (brain) NAALAD2—which uses NAAG to ‘produce’ glutamate—should be inhibited to treat TD. Furthermore, transcriptomic profiling has shown decreased RIMKLB levels and increased NAT8L levels in the blood of TD patients aged 5 to 9 [66], as well as alternative splicing of RIMKLA in the blood of adult TD patients [68]. All these findings suggest that in addition to inhibiting NAALAD2, a treatment to reduce TD symptoms may be to activate/increase NAAG synthesis. However, there are currently no known treatments that increase NAAG synthesis. Interestingly, inhibiting FLT3 (see above) also prevents glutamate-induced toxicity [238]—that could be the result of increased NAALAD2 expression/activity—which constitutes a functional link between NAALAD2 and FLT3. Moreover, NAALAD2 inhibitors—that elevate synaptic NAAG levels [239]—were found to reduce stereotypical movements in different mouse models (of schizophrenia) [240,241], which further highlights the suitability of NAALAD2 as a novel TD target and the need to conduct further experiments to develop it into an effective TD treatment.
Two other interacting putative drug targets from the landscape are the membrane receptor CX3CR1 and its ligand, the chemokine CX3CL1. CX3CR1 is highly expressed in the microglial cell membrane. In addition, the CX3CR1-CX3CL1-complex plays a key role in regulating brain inflammation [242] as well as synaptic pruning and connectivity [243,244,245], while CX3CL1 is also located in the neuronal cell membrane where it can be cleaved into a soluble chemokine by the membrane-located landscape enzyme ADAM10 [246,247]. As for their regional specificity for TD, the expression of CX3CR1 was found to be upregulated in the (postmortem) striatum of TD patients (FC = 1.78) [64] and increased CX3CL1 blood expression is correlated with increased TD symptom severity [67]. Both proteins also show temporal specificity for TD. CX3CR1 expression is upregulated in the blood of TD patients aged 10–12 years (FC = 1.18) [66] and in mouse striatum, Cx3cr1 shows a temporal expression pattern corresponding to developmental stages that could be linked to TD occurrence and resolution (i.e., first upregulation, then downregulation) [248]. In addition, CX3CL1 is highly expressed in the striatum (in the neonatal period, early infancy and early childhood), cortex (neonatal period, early infancy, early childhood and adolescence) and the thalamus (neonatal period and early infancy), while mouse Cxc3l1 also shows the same temporal expression pattern in the striatum than Cx3cr1 does [248]. Moreover, CX3CR1 and CX3CL1 have molecular specificity for TD, and this not only through forming a functional complex with each other but also through additional effects of CXC3L1 on multiple other landscape proteins—that were not all drawn in the landscape but can be found in Table S5—e.g., as a ligand of the ITGA4-ITGB1-complex and through upregulating the expression of extracellular POSTN and membrane-located CDHR1. Lastly, there is some evidence that the CX3CR1-CX3CL1-complex could be modulated with a beneficial effect on TD. However, both an inhibition and activation of this complex have been found to have a neuroprotective effect, depending on whether the intervention was carried out in the developing or adult brain [249]. For instance, neutralizing antibodies against (brain) CX3CR1 ameliorated exogenous CX3CL1-induced PD-like behaviors in an adult rat model [250], while another study in a mouse model of PD revealed the neuroprotective capacity of CX3CL1 that resides solely upon the soluble form but not the membrane-located form of CX3CL1 [251]. Moreover, in a mouse model of Rett syndrome, it was shown that the presence of CX3CR1 is detrimental to the neurodevelopmental trajectory and (partial) ablation of CX3CR1 attenuated disease severity [252]. For these reasons, further studies are needed to further determine if and how CX3CR1/CX3CL1-based treatments for TD could be developed.
Furthermore, the TD landscape contains three presynaptic membrane-located opioid receptors—OPRM1, OPRK1 and OPRD1—of which we think that especially OPRM1 fits all aspects of drug target specificity for TD. OPRM1 is an opioid receptor of the μ family that mediates downstream signaling through binding both endogenous opioids (such as endorphin and endomorphin) and synthetic opioids (such as morphine, heroin, fentanyl and methadone) [253,254]. OPRM1 shows regional specificity for TD, as OPRM1 is highly expressed in the brain but its expression is specifically downregulated in the (postmortem) striatum of TD patients (FC = −1.43) [64]. OPRM1 also has temporal specificity for TD as it is highly expressed in the thalamus (in the early fetal period, early mid-fetal period, neonatal–early infancy period, adolescence and young adulthood) and the cerebellum (late fetal period and late infancy). Moreover, OPRM1 has considerable molecular specificity for TD as it interacts with multiple other landscape proteins, including the opioid receptors of the δ and κ families OPRD1 and OPRK1. In addition, OPRM1, OPRD1 and OPRK1 are involved in cAMP-mediated signaling (one of the two enriched pathways within the TD candidate genes), while OPRM1 is also a (putative) upstream regulator of multiple landscape genes (see above). As for the—putative—modulatory specificity of OPRM1, it should first be noted that abnormalities of the opioid system have been found in TD previously [255,256]. In this respect, previous reports have shown that pharmacological manipulation of the endogenous opioid system has a beneficial effect on TD (symptoms). Specifically, several case reports [257,258,259] and a randomized, double-blind, placebo-controlled study [260] have suggested that TD symptom reduction may be achieved with an opioid receptor antagonist such as naloxone or naltrexone that both have a high binding affinity for OPRM1 [261]. In addition, some studies have indicated dose-dependent effects of naloxone in patients with TD, with low doses causing a decrease in tics while higher doses cause increased tics [262,263]. Conversely, case reports have also shown that the full OPRM1 agonist methadone and the partial OPRM1 agonist buprenorphine are successful in alleviating symptoms of TD [264,265]. Furthermore, impaired OPRM1 function has been suggested to lead to decreased release of gonadotropin-releasing hormone (GnRH) [266] that is produced by the PROK2-PROKR2 complex in the landscape. In turn, this leads to a reduced secretion of the gonadotrophins LH and FSH that have been found to be especially lower in the plasma of male TD patients, and this associated with the onset of puberty [267]. Given the above, further studies are required to assess which opioid receptor agonists and/or antagonists could be used to treat TD and when these drugs would need to be administered to have the best effect and least side effects.
The last putative drug target from the landscape that we would like to discuss in some detail is HRH2, a (neuronal) membrane receptor of histamine. Firstly, HRH2 shows regional specificity for TD, as it is highly expressed in both excitatory and inhibitory neurons [268], and its expression in blood has been found to be negatively correlated with symptom severity in TD symptoms [67]. As for its temporal specificity, HRH2 expression is upregulated in the blood of TD patients aged 10–12 years (FC = 1.12) [66] and in mouse striatum, Hrh2 shows a temporal expression pattern corresponding to developmental stages that could be linked to TD occurrence and resolution (i.e., first upregulation, then downregulation) [248]. In addition, HRH2 is highly expressed in the striatum (in the neonatal period, early infancy, early childhood and adolescence) and cortex (neonatal period, early infancy, early childhood, adolescence and early adulthood). Moreover, HRH2 has molecular specificity for TD, as it binds and interacts with HDC, the cytoplasmic enzyme that has been linked to TD by strong genetic evidence [32,269,270] and the results from our analyses (Table S2) and that converts histidine to the HRH2 ligand histamine. In addition, HRH2 regulates the production of arachidonic acid, one of the top metabolites emerging from the PRS-based analyses (see above) and it upregulates the expression of IL17A, a cytokine that itself has several interactions in the landscape and of which the blood levels were found to be increased in TD patients [271,272]. Furthermore, HDC uses PLP as its cofactor to synthesize histamine from histidine, with both PLP and histidine being implicated in TD through our analyses (see above). Histamine (see above) is also transported in and out of astrocytes and presynaptic neurons by the landscape transporters SLC22A3 and SLC29A3, while in astrocytes, it is also methylated and, hence, inactivated by the HNMT enzyme [273]. The blood expression of HNMT was also found to be upregulated is TD patients aged 13–16 (FC = 1.70), while that of SLC22A3 was downregulated in TD patients aged 10–13 (FC = −1.10) and positively correlated with TD severity [66,67], further suggesting a dysregulation of histamine metabolism in TD. Specifically, and linked to the putative modulatory specificity of HRH2, low brain concentrations of its ligand histamine have been reported in the Hdc knockout (KO) mouse model of TD, and histamine repletion ameliorated tic-like stereotypical movements in these animals [274]. In addition, histamine bound to HRH2 has been shown to have a neuroprotective effect by alleviating the NMDA glutamate receptor-induced excitotoxicity via cAMP signaling [275]. Moreover, the histamine precursor histidine was shown to promote astrocyte migration and provide neuroprotection through HRH2 [276]. Histidine and HNMT inhibitors also ameliorated methamphetamine-induced stereotyped behavior and behavioral sensitization in rodent models, while HDC inhibitors and HRH2 antagonists enhanced this behavior [277,278,279,280,281,282,283]. As histamine does not cross the BBB [284], a potential strategy to increase the brain levels of histamine—that could then bind and signal through HRH2—would be to provide additional histidine through the diet. Histidine is transported across the BBB by SLC3A2 and SLC7A5 that form heterodimers [285] and are both upregulated in TD postmortem striatum [64]. This being said, further studies are needed to assess the effects of histidine supplementation and/or administering agonists of HRH2 other than histamine (that pass the BBB) on TD symptoms.
Our study should be viewed in the context of a number of strengths and limitations. Particular strengths are that, to our knowledge, we have analyzed all available omics data for TD for the first time and integrated the results from these analyses with an extensive literature search for interactions between the TD-linked genes/proteins and metabolites into a molecular landscape of the disease. In turn, this TD landscape not only provides insights into the altered molecular processes that underlie the disease but also, and importantly, it enabled the identification of biologically meaningful drug target leads for further studies. An important limitation of the study was that because of the lack of omics data for specific TD symptoms, we decided to use a ‘broad’ definition of the TD phenotype, and because of this, we could not derive any insights about the molecular mechanisms underlying these specific symptoms from our results. Moreover, a number of omics studies of which we used the data were limited in sample size and therefore likely underpowered for a meaningful statistical analysis of the individual study results. However, we tried to address this by prioritizing those genes/proteins for building the landscape that have been implicated in TD through one type of genomic evidence and at least one other type of genomics or other omics evidence (i.e., the ‘dark blue’ genes/proteins). Another limitation is that the PRS-based analyses that we conducted only consider the joint effect of (very) many common genetic variants associated with TD, but further studies are needed to elucidate whether and to what extent rare genetic variants (also) contribute to metabolite levels. In addition, more advanced methods would need to be applied to dissect the ‘broad’ PRS-based signal containing hundreds of thousands of SNPs into genetic loci and even individual genes. Furthermore, the PRS-based approach only represents a starting point for identifying genetically determined levels of blood or CSF biomarkers, and further studies using for example Mendelian Randomization and metabolomics could help identify any causal or pleiotropic effects of specific metabolites on TD, and vice versa [286]. Lastly, both the protein–protein interaction databases that we used and the extensive literature search that we conducted for building the landscape are—by default—incomplete and more interactions may become known and be experimentally validated in the future. Therefore, additional studies are required to follow up on and validate/corroborate the main findings and leads from our landscape. For example, future in vivo and interventional studies could be carried out that modulate metabolites and/or interactions between genes/proteins and metabolites through existing medications or dietary changes, and that may provide new ways to lessen the burden of TD.

4. Materials and Methods

4.1. Literature Search and Selection of Omics Datasets

We searched public databases (i.e., PubMed and Europe PMC [287], which include peer-reviewed articles and preprints, and GWAS Catalog [56]) for human ‘omics’ studies in subjects with Tourette’s disorder (TD) or tic disorders, as well as pediatric acute onset neuropsychiatric syndrome (PANS) including pediatric autoimmune neuropsychiatric disorders associated with streptococcal infection (PANDAS), which have been proposed as etiological subtypes of TD [288]. The ‘omics’ notion refers to system-wide data derived from high-throughput assays measuring simultaneously all or nearly all molecules of the same type at the various level of cellular functions. These comprise: (I) genomics—the study of sequence level DNA variation associated with the disorder that can be identified through linkage analysis in family-based studies and through association studies in family and population-based data, including (a) common single-nucleotide sequence variation (base changes/substitutions/insertions/deletion), referred to as single-nucleotide polymorphisms (SNPs), found at frequencies greater than 1% in a population and investigated in genome-wide association studies (GWASs), (b) rare single-nucleotide variants (SNVs), usually exceedingly rare or unique to an individual, investigated in next-generation sequencing (NGS) studies, most often focused on protein-coding regions of the genome, known as exome sequencing, (c) rare structural variation, including copy number variation (CNV), referring collectively to differences that are at least 50 bp in length between two individual genomes; (d) chromosomal aberrations; (II) epigenomics—the study of non-sequence-level DNA modifications (changes that are heritable and do not entail a change in DNA sequence [289]), including: DNA methylation, histone modifications, and chromatin modelling; (III) transcriptomics—the study of RNA transcript abundance and expression using microarrays or RNA sequencing (RNA-seq), including protein-coding messenger RNA (mRNA) and two types of noncoding RNA with regulatory roles: long noncoding RNA (lncRNA) and microRNA (miRNA), with the latter also recognized as a type of epigenetic machinery; (IV) proteomics—the study of protein abundance and expression using antibody-based arrays and mass spectrometry (MS); (V) metabolomics—the study of low-molecular-weight compounds (metabolites) using techniques such as liquid chromatography–mass spectrometry (LC-MS) or nuclear magnetic resonance spectroscopy (NMR); (VI) microbiomics—the study of fecal microbiota as a proxy for microbiota of the gastrointestinal tract (gut microbiota). Microbiome studies were included if they reported bioactive microbiota-derived metabolites related to the alternations in the microbial composition, as microbial metabolites could affect brain activity in the microbiota–gut–brain bidirectional communication [290]. We conducted this literature search for eligible data up to 1 December 2021; otherwise-eligible studies published after this date were not included in our analyses. Additionally, reference lists from reviews were used for reference checking. Studies were excluded if (i) the study was published in a language other than English, (ii) the molecules assayed or analyzed were limited to those in candidate genes/molecules, (iii) data were not accessible. Findings considered significant in the primary publication by the study authors, using their experimental design and thresholds, are included in our main lists, while subthreshold findings are listed in the extended lists.

4.2. Analyses of TD GWAS summary Statistics

We obtained the summary statistics of the largest TD GWAS meta-analysis of 14,307 individuals from the PGC website (https://www.med.unc.edu/pgc/, accessed on 24 March 2021). Prior to further analyses, we applied filters to the summary statistics, as implemented in the munge_sumstats.py script (version 1.0.1), available within the LD score regression package (ldsc) [291]; https://github.com/bulik/ldsc, accessed on 10 April 2021): (a) imputation quality INFO score above 0.9; (b) sample MAF above 1%; (c) remove indels and structural variants; (d) remove strand-ambiguous SNPs; (e) remove SNPs whose alleles do not match the alleles in 1000 Genomes.
To better understand the mechanism by which variations at GWAS loci influence susceptibility to TD, we used different methods to dissect GWAS loci and identify TD-relevant genes. We focused on strategies aiming to prioritize genes rather than variants to arrive at more interpretable results.

4.2.1. Genome-Wide Gene-Based Analysis in MAGMA

We used Multi-marker Analysis of GenoMic Annotation (MAGMA), v1.09 [292], to perform gene-based analysis of the TD GWAS meta-analysis summary statistics. MAGMA combines multiple variants that are mapped to a gene, while adjusting for the linkage disequilibrium (LD) between those variants and tests the joint association of all variants in the gene with the phenotype. This approach reduces the number of tests that need to be performed and enables the identification of effects consisting of multiple weaker associations that would be missed in the individual variant analysis. Specifically, for each of 19,427 protein-coding genes included in the NCBI 37.3 database, we considered all single-nucleotide polymorphisms (SNPs) located in the gene body (0 kb) and 100 kb windows on both sides. Then, using an updated SNP-wise Mean model, we combined the resulting SNP p-values into a gene test statistic (the sum over squared SNP Z-statistics) and computed the corresponding gene p-value. We used the 1000 Genome Project Phase 3 European population as reference data to account for the LD-induced covariance of SNP p-values. For further analyses, we considered genes with the p-value < 1.0 × 10⁻³, a less stringent cut-off to enable the retrieval of suggestive associations. Previous studies have shown that SNPs in (the vicinity of) a gene with sub-threshold p-values as high as 1.00 × 10⁻⁴ are likely to carry a significant biological signal affecting gene expression and function and may reach significance in later higher-powered studies [293,294].

4.2.2. SNP Functional Annotation and Gene Mapping in FUMA

  • SNP functional annotation
We used the FUMA online platform (v1.3.6b, [295], http://fuma.ctglab.nl/, accessed on 16 August 2021) for the identification of genomic risk loci and functional annotation of SNPs from the TD GWAS meta-analysis summary statistics. We first identified independent significant SNPs with a p-value < 1.0 × 10⁻⁵ and which are independent of each other at r2 < 0.6. These SNPs were further represented by lead SNPs, which are a subset of the independent significant SNPs in approximate linkage equilibrium with each other at r2 < 0.1 (based on LD information calculated from 1000 genomes). We then defined associated genomic loci by merging any physically overlapping lead SNPs (linkage disequilibrium (LD) blocks < 250 kb apart). We selected all candidate SNPs in associated genomic loci that were in LD (r2 > 0.6) with one of the independent significant SNPs, had a p-value < 5 × 10⁻² and minor allele frequency (MAF) > 0.0001, for functional annotation. Functional consequences for these SNPs were obtained by matching SNPs’ chromosomes, base-pair positions, and reference and alternate alleles to databases containing known functional annotations, including ANNOVAR categories [296], Combined Annotation-Dependent Depletion (CADD) scores [297], RegulomeDB scores [298], and chromatin states [299,300]. ANNOVAR categories identify the SNP’s genic position (e.g., intron, exon, and intergenic) and associated function. CADD scores predict how deleterious the effect of a SNP is likely to be for a protein structure/function, with higher scores referring to higher deleteriousness. A CADD score above 12.37 is the threshold to be potentially pathogenic [297]. The RegulomeDB score is a categorical score based on information from expression quantitative trait loci (eQTLs) and chromatin marks, ranging from 1a to 7, with lower scores indicating a higher probability of having a regulatory function.
  • Gene mapping
Subsequently, we used FUMA to map functionally annotated SNPs to genes by combining three mapping strategies: positional, eQTL and 3D chromatin interaction mappings. For positional mapping, SNPs were mapped to known protein-coding genes in the human reference assembly (GRCh37/hg19) based on the physical distance of 10 kb windows on both sides. For eQTL and chromatin interaction mappings, we performed analyses (1) across all available tissue/cell types—enabling full extracting of possible candidate genes and (2) within brain—to prioritize brain-specific candidate genes by eQTLs and chromatin interactions. Specifically, for brain-specific eQTL mapping, we used only brain-related eQTL data available within FUMA: eQTL Catalogue [301]: BrainSeq (DLPFC) [302] and Schwartzentruber_2018 (Sensory neurons) [303], PsychENCODE (PFC, TC, CB) [304], xQTL (DLPFC) [305], The CommonMind Consortium (CMC) (DLPFC) [306], BRAINEAC (10 brain regions) (http://www.braineac.org/), and GTExv8 Brain (13 brain regions). We used a false discovery rate (FDR) p-value of 5 × 10⁻² to define significant eQTL associations. FUMA annotates those significant eQTLs with candidate SNPs and those SNPs are mapped to the gene whose expression is potentially affected by the SNPs. In brain-specific chromatin interaction mapping, we identified significant chromatin loops (FDR p-value < 1.0 × 10⁻⁶) using built-in chromatin interaction data from: the dorsolateral prefrontal cortex and hippocampus [307], adult and fetal cortex [308], prefrontal cortex from PsychENCODE [304], FANTOM5 [309]. In FUMA, the candidate SNPs are required to be overlapped with one end of the loop and transcription start sites (TSS) of genes (500 bp up- and 250 bp downstream from the TSS) with the other end of the loop to be mapped. Since HiC is designed to measure the physical interactions of two genomic regions, not all significant loops necessarily contain functional interactions. We further limited chromatin interaction mapping to those where SNPs overlap with enhancer regions and gene TSSs overlap with promoter regions predicted by Roadmap consortium (http://egg2.wustl.edu/roadmap/data/byDataType/dnase/). In brain-specific analyses, we used only E053-E082 brain [300] for those annotations. For all analyses, we also performed additional filtering of SNPs based on functional annotations (CADD and RegulomeDB), as it affects gene prioritization (setting a CADD score threshold will cause FUMA to use only highly deleterious SNPs or filtering SNPs by RegulomeDB score prioritizes SNPs which are likely to affect regulatory elements per one of the mapping strategies).

4.2.3. Transcriptome-Wide Association Study

Under the assumption that the effect of genetic variation on a phenotype is mediated by gene expression, we performed a transcriptome-wide association study (TWAS) to integrate TD GWAS meta-analysis summary statistics and cis-eQTL signals and prioritize candidate risk genes for TD. TWAS was implemented in FUSION [310] using the FUSION.assoc.test.R script with default settings over all autosomal chromosomes. Pre-computed SNP-expression weights from all tissue reference samples from GTEx Consortium (GTEx v7) were obtained from the FUSION website (http://gusevlab.org/projects/fusion/, accessed on 23 April 2021). We applied this recommended agnostic approach to scan all tissues models to improve our ability to detect relevant regulatory mechanisms that mediate the phenotypic association [311]. To discover genes whose expression is regulated by the same variants that underlie GWAS hits, we performed colocalization analysis using the interface to the coloc R package [312] available in FUSION for all genes below TWAS p-value threshold of 5 × 10⁻⁴ (Fusion.assoc_test.R--coloc_P flag). This Bayesian approach evaluates the posterior probability (PP) that genetic associations within a locus for two outcomes are driven by a shared causal variant. It enables the distinction between associations driven by horizontal pleiotropy (1 causal SNP affecting both gene expression and phenotype; posterior probability PP4) and linkage (2 causal SNPs in LD affecting gene expression and phenotype separately; posterior probability PP3). Significant features were considered as colocalized based on their low PP3 (<0.2) used as a less stringent threshold for evidence of non-independent association signal, as applied previously [313]. Of note, while TWAS tests for association between gene expression and a phenotype, it accounts only for genetically predicted expression (common cis eQTLs) and constitutes only a small fraction of total expression that also includes environmental and technical components [314].

4.2.4. Shared Genetic Etiology Analyses with Levels of Blood and Cerebrospinal Fluid Metabolites

  • Polygenic risk score (PRS)-based analyses
Polygenic risk score (PRS) is used to summarize the aggregated risk from common variants across the genome, and it is a valuable tool for comparing the shared genetic basis of different traits. To test for genetic sharing between TD and levels of blood metabolites, cytokines and metals, as well as levels of CSF metabolites, we performed polygenic risk score (PRS)-based analyses in PRSice (v1.25) [315] using the summary-summary statistic based approach. As ‘base phenotype’, we used TD GWAS meta-analysis summary statistics. As ‘target phenotypes’, we used publicly available GWAS summary statistics for a total of 993 blood (serum and/or plasma) traits reported in six separate studies, including 941 metabolites [23,77,78,80], 41 cytokines [76] and 11 metals [316], as well as 338 CSF metabolic traits [79]. First, we performed clumping in PLINK (v1.90) [317] to remove SNPs in linkage disequilibrium (LD, based on R2 > 0.25 within 500 kb window) with the SNP with the smallest p-value in the base phenotype and generated sets of independent SNPs. Subsequently, we calculated PRS in PRSice using clumped SNPs whose p-value in the base phenotype were below seven broad p-value thresholds (PT) (0.001, 0.05, 0.1, 0.2, 0.3, 0.4, and 0.5) to select the one that maximized the variance explained (R2) for the base phenotype in the target phenotypes. PRS are estimated as a sum of risk alleles across SNPs with GWAS p-values below a given p-value threshold, weighted by the effect sizes estimated by the GWAS. Finally, we performed regression to test the association between the PRS and target phenotypes, i.e., the extent to which combined SNPs from each of the seven PT-linked PRS for TD predict each of the target phenotypes (993 blood and 338 CSF metabolic traits’ levels). To account for the large number of tests, we applied Bonferroni correction and set p-value thresholds of 7.19 × 10⁻⁶ (0.05/(993 tests × 7 PTs)) and 2.11 × 10⁻⁵ (0.05/(338 tests × 7 PTs)) to designate statistically significant results for blood and CSF metabolic traits, respectively. We also calculated Benjamini–Hochberg-adjusted (FDR) p-value and set a less stringent cut-off of FDR p-value < 1 × 10⁻² to retrieve suggestive associations [318].
  • SNP effect concordance analyses (SECA)
For the statistically significant findings from the PRS-based analyses, we performed SNP Effect Concordance analysis (SECA) [319] to test for the genetic concordance (i.e., the same SNP effect directions across both traits) between TD and blood/CSF metabolite levels. We applied Bonferroni correction to account for the number of tests performed in SECA and to designate statistically significant results.

4.3. Integration, Annotation, and Prioritization of Omics Studies Results

4.3.1. Integration of Omics Studies Results

We unified gene symbols and Entrez Gene identifiers (Entrez ID) across different genomic, transcriptomic and epigenomic datasets using ‘HGNChelper’ [320,321] and ‘org.Hs.eg.db’ [322] R packages. The ‘HGNChelper’ package identifies known aliases and outdated gene symbols based on the HUGO Gene Nomenclature Committee (HGNC) database [323], as well as common mislabeling introduced by spreadsheets, and provides corrections where possible. We used the most current available maps of aliases for correcting gene symbols. The ‘org.Hs.eg.db’ annotation package extracts Entrez Gene identifiers for gene symbols using data provided by Entrez Gene ftp://ftp.ncbi.nlm.nih.gov/gene/DATA (date stamp from the source: 13 September 2021). Gene lists were merged into a master table by unified Entrez ID and gene symbol. Genes for which Entrez ID was not identified were not included in our subsequent analyses. All analyzes were conducted in R [324].
We unified metabolite names across different studies using information from the Human Metabolome Database (HMDB) [325]. Some metabolites were classified as ‘Unknown’, indicating that their chemical identity was not yet determined at the time of analysis. Metabolites were assigned to metabolic groups—superpathways (amino acids, carbohydrates, cofactors and vitamins, energy, lipids, nucleotides, peptides, and xenobiotic metabolism) and pathways, based on the description in the Kyoto Encyclopedia of Genes and Genomes database (KEGG) [326]. Given that some metabolites are differently preserved in blood plasma and serum, and that platforms may differ in extraction protocols, we examined all metabolites included in the original studies and have not selected the largest sample available for a particular metabolite.

4.3.2. Gene-Level Annotation of Omics Studies Results

We annotated genes with a set of molecular features that would facilitate building of the molecular landscape and provide a rationale to further prioritize genes for therapeutic targeting. Specifically, we used information contained in the UniProt Knowledgebase (UniProtKb) [327] (http://www.uniprot.org, accessed on 27 September 2021) to extract functional and subcellular localization annotations for genes/proteins. We used Human Protein Atlas (HPA) version 21.0 [268] (http://v21.proteinatlas.org, accessed on 18 February 2021) to obtain data on tissue and cell expression of RNA/protein, as well as their subcellular location. Genes were considered to be expressed in the brain if they were detected on at least RNA level in the mammalian brain (integrated data from human, pig and mouse). In HPA, protein expression is based on immunohistochemical data. Each subcellular location is given one of the four reliability scores (Enhanced, Supported, Approved, or Uncertain) based on available protein/RNA/gene characterization data from both HPA and the UniProtKB/Swiss-Prot database. Furthermore, we extracted information on the potential functional importance of a gene/protein, such as essentiality and druggability. A gene is considered essential when it is indispensable for the reproductive success of an organism and, thus, the loss of its function compromises the viability or fitness of the organism. In humans, essentiality is estimated based on loss-of-function (LoF) mutation intolerance, either from population exome sequencing (in vivo) data—statistical estimates of unexpected mutational depletion identify genes presumed to be subjected to functional constraints [328]; or (2) CRISPR-based in vitro perturbation experiments—systematic testing of gene-silencing effects on human cell cultures identifies genes that affect cell viability or optimal fitness upon perturbation. To this end, we used human gene essentiality estimations based on different measures of tolerance to LoF mutations provided by Bartha et al., 2018 [329] (extracted from Supplementary Information S2). Estimates include the following scores based on the Exome Aggregation Consortium (ExAC) sample of 60,706 human exomes [328]: residual variation intolerance score (RVIS) [330], Evo-Tol [331], missense Z-score [332], LoFtool [333], probability of haploinsufficiency (Phi) [334], probability of loss-of-function intolerance (pLI) [328] and selection coefficient against heterozygous loss-of-function (shet) [335]. Scores based on cell culture perturbation-based experiments include data from KBM7, Raji, Jiyoye, HCT116 and K562 cell lines [336]; the KBM7 cell line [337], and RPE1, GBM514, HeLa and DLD1 cell lines [338]. Furthermore, we used information on gene druggability that could give scope for drug repurposing or redesign. The druggable genome can be defined as the genes/gene products known or predicted to interact with drugs, ideally with a therapeutic benefit to the patient. To prioritize druggable genes, we used the list of 4479 genes defined by Finan et al. as the ‘druggable genome’ ([339], provided in Table S1). Genes reported by Finan et al. are divided into 3 tiers corresponding to their position in the drug development pipeline: Tier 1 contains genes encoding targets of approved or clinical trial drugs; Tier 2 genes encoding targets with high sequence similarity to Tier 1 proteins or targeted by small drug-like molecules; and Tier 3 contains genes encoding secreted and extracellular proteins, genes encoding proteins with more distant similarity to Tier 1 targets, and genes belonging to the main druggable gene families not already included in Tier 1 and Tier 2 (GPCRs, nuclear hormone receptors, ion channels, kinases, and phosphodiesterases).

4.3.3. Prioritization of Omics Studies Results

Since the DNA sequence remains unaltered throughout life and is not influenced by environment or development (apart from somatic mutations), genetic variants associated with the disorder are thought to contribute to/precede, and not be a consequence of, disease development. Moreover, previous studies have shown that drug candidates are more likely to pass clinical trials and be approved for patients if they target genes linked to human disease [13,14], highlighting the importance of human genetics in target identification and drug discovery. Given the above, we prioritized the results of genomics studies of TD and used them as an anchor point for further analyses exploring molecular mechanisms implicated in TD etiology and modeling interactions of other omics data. Specifically, we compiled the primary list of TD candidate genes for enrichment analyses (referred to as ‘TD candidate genes’ throughout the text), which included genes reported as primary significant findings (main lists) from: GWAS-based analyses (MAGMA, FUMA, TWAS, and cross-disorder), preliminary MAGMA of the newest TD GWAS, rare single-nucleotide variants (SNVs), copy number variations (CNVs), chromosomal aberrations, as well as genes reported as subthreshold findings (included in the extended lists)—only if they were reported in at least two separate studies. We classified studies based on assigned evidence level as: guiding (genomics studies), corroborating (epigenomic and transcriptomic studies) and additional (metabolomics, microbiome). Of note, given the paucity of data, we decided not to consider evidence about the (putative) regulations of mRNAs/proteins by miRNAs.

4.4. Tissue and Cell Type Specificity Analyses

To test the assumption that genes associated with disease are more likely to be highly expressed in the tissues and cells afflicted by the disease, we performed tissue and cell type specificity analyses.
We used the Tissue-Specific Expression Analysis (TSEA, v1.0: Updated 3 March 2014) [340] and the Cell-Specific Expression Analysis (CSEA) [341,342] web tools to test whether genes preferentially expressed in any given tissue or cell type were enriched in the set of 872 TD genes. For the TSEA, we used the gene expression data for 25 broad human tissue types derived from the Genotype-Tissue Expression (GTEx) project [343] and human brain region- and time-specific gene expression RNA seq data obtained from the BrainSpan Atlas [344]. For the CSEA, we used the mouse-cell-type-specific gene expression profiling experiments that were conducted on a single platform, most using published translating ribosome affinity purification (TRAP) data, as described in [342]. The TRAP method estimates a rate of protein synthesis and is a better predictor of actual protein levels than measurements of mRNA levels [345]. The specificity of expression was represented as a specificity index probability (pSI) statistic at thresholds 0.05 to 0.0001, with a smaller value indicating higher specificity. For details on pSI score calculation, we refer to the original publication [340]. We considered genes with pSI statistics smaller than 0.05 as significantly enriched in the tissue or cell type. The overlap between TD genes and the genes enriched in each tissue or cell type was estimated using Fisher’s exact test followed by false discovery rate (FDR) correction with Benjamini–Hochberg method. The significance threshold was defined as FDR p-value < 5 × 10⁻².
We additionally applied CSEA to the results of differential expression analysis of postmortem transcriptome data from the striatum of TD patients [64] to investigate which cell types are particularly affected by the lifelong TD. These analyses were performed separately for down- and up-regulated genes from combined analysis of caudate and putamen, as well as for the top modules from the weighted gene co-expression network analysis (WGCNA) that were most significantly enriched for down- and up-regulated genes. Such joint analyses can further improve the power to detect cellular composition alterations from transcriptomic data [74].

4.5. Functional Enrichment Analyses

We used Ingenuity Pathway Analysis (IPA) software (QIAGEN, Hilden, Germany) to identify canonical pathways, diseases and functions, and upstream regulators that were enriched in the set of 872 TD candidate genes. The significance of the association between our dataset and the given pathway, disease/function, and upstream regulator was measured using the right-tailed Fisher’s Exact Test, followed by false discovery rate (FDR) calculation using the Benjamini-Hochberg method to correct for multiple-testing. A threshold of FDR p-value < 5 × 10⁻² (−log (FDR p-value) > 1.3) was used to designate statistically significant findings, while results with unadjusted p-value < 1 × 10⁻² are reported as suggestive associations. For statistical calculations, all genes associated with pathways, functions, and regulators in the Ingenuity Knowledge Base (IKB) were used as the reference set.
Canonical pathways are well-characterized metabolic and cell signaling cascades derived from the literature and public and third-party databases compiled in the IKB. For canonical pathways, apart from the p-value of overlap, a ratio indicating the strength of the association is also provided (the number of genes from the dataset that map to the pathway divided by the total number of genes that map to the canonical pathway). Pathways with high ratios and low p-values may be the most likely candidates for an explanation of the observed phenotype.
In the diseases and functions analysis, IPA identifies diseases and biological processes associated with the dataset based on the prior knowledge of expected causal effects between genes/proteins and the diseases/functions contained in the IKB. We report results organized in the three main categories: ‘Diseases and Disorders’, ‘Molecular and Cellular Functions’, and ‘Physiological System Development and Function’, along with the FDR p-value of overlap and (number of) molecules associated with each function.
Upstream regulator analysis identifies ‘upstream regulators’—molecules that may control the expression of target genes in our dataset, based on the expected causal effects derived from the literature. We report upstream regulators classified into two main groups: ‘Drugs and Chemicals’ and ‘Genes, RNAs and Proteins’.

4.6. Molecular Landscape of TD

First, we filtered the TD candidate genes (see above) based on the number of lines of supporting evidence, prioritizing genes that (a) are present in at least two independent main genetic lists (studies/analyses) or where a genetic finding had corroborating evidence in epigenetic or transcriptomic studies (requiring evidence from two independent blood studies or one brain study), (b) genes that are expressed in brain (tissues) based on the data in HPA, and (c) genes that are protein-coding. This step resulted in the list of TD ‘prioritized’ candidate genes and their encoded proteins that we focused on for building the landscape, with the remaining genes/proteins from the candidate list—for which less omics evidence was available—only being used in a second stage (see below).
Second, we filtered the metabolites linked to TD through the PRS-based analyses and/or (other metabolome/microbiome studies), based on the strength of the supporting (genetic) evidence. We included HMDB-annotated metabolites implicated through PRS-based analyses with (a) a Bonferroni-adjusted p-value < 5 × 10⁻², (b) an FDR p-value < 1 × 10⁻², if they were also implicated through other metabolome/microbiome studies, or (c) an FDR p-value < 5 × 10⁻², if they were replicated in PRS-based analyses and implicated through metabolome/microbiome studies. We also included metabolites linked through PRS-based analyses (FDR p-value < 5 × 10⁻²) or metabolome/microbiome studies if they could be directly linked to a TD-associated protein through a functional or metabolic interaction (e.g., the TD-associated protein is a transporter or receptor for the metabolite).
Subsequently, to build the actual molecular landscape of TD, we applied an approach that was used previously for other neuropsychiatric diseases [20,346]. The UniProt Protein Knowledge Base (http://www.uniprot.org, accessed on 27 September 2021) [327] was used to gather basic information on the function(s) and subcellular localization(s) of all the landscape candidate genes/proteins. We also used PubMed (https://pubmed.ncbi.nlm.nih.gov) to identify the functional, experimental evidence-based interactions between the landscape candidate proteins. This included assembling protein–protein interactions (PPIs) and protein–metabolite interactions data from several literature-curated resources that contain high-quality interactions with experimental evidence. These included primary and secondary databases, such as the Ingenuity Knowledge Base available in IPA, OmniPath [347], The Human Reference Interactome (HuRI) [348] (http://www.interactome-atlas.org, accessed on 18 April 2022), High-quality INTeractomes (HINT) [349] (http://hint.yulab.org, accessed on 11 April 2022), and The Integrated Interactions Database (IID) [350] (http://iid.ophid.utoronto.ca, accessed on 17 April 2022). These protein–protein interaction resources differ in the number and types of relationships they capture, e.g., physical binary interactions, enzymatic reactions, or functional relationships, and taken together, the resources provide good coverage of the protein interactome. From this interactome data, we then selected the interactions between the proteins encoded by the prioritized TD candidate genes (see above) as well as—and in a second stage—between proteins encoded by prioritized TD candidate genes and proteins encoded by other genes from the list of candidate genes for which less omics evidence was available, proteins/genes implicated in TD through transcriptomics data and/or other functional evidence, as well as the metabolites emerging from our PRS-based analyses.
Furthermore, we annotated interacting proteins with their contextual information, including cell expression from HPA and subcellular localization from UniProtKb. Biological processes carried out by interacting proteins are separated in the cellular and subcellular space, which helps their precise regulation [351]. Therefore, we (also) curated assembled interactome data to retain interactions that are biologically likely to occur in a given (sub)cellular location. For example, if in a binary interaction both proteins did not share the same localization or at least one compartment in multiple localized proteins, the interaction was ruled out as likely not occurring, an approach that has been used before [352]. Furthermore, all self-interactions were removed and not considered for the landscape. In addition, we determined the most likely cell type for each interaction based on the expression profiles contained in the HPA and the results of our cell type specificity analyses.
Lastly, we used the program Serif DrawPlus version 4.0 (www.serif.com, Nottingham, UK) to draw the figure depicting the molecular landscape of TD. We tried to avoid repetitive drawing of a protein or protein–protein interactions as much as possible. If multiple locations of a protein–protein interaction were possible, functional interaction and/or expression data or other protein–protein interactions were used to identify the (most) appropriate location.

4.7. Selection of Putative Drug Targets from the Built Molecular Landscape of TD

After building the molecular landscape, we selected some putative drug targets based on four broad aspects of target specificity. First, a good drug target should be highly expressed in the (brain) tissues and cell types that are affected in the disease [353,354] (in this case TD)—and preferably differentially expressed in comparison with healthy controls—constituting the regional specificity of the target. To evaluate this aspect of target specificity, we analyzed the available postmortem brain data, although the differential expression of the genes/proteins in these data may cause TD or represent a consequence of TD (including compensatory mechanisms). Linked to the regional specificity, putative drug targets should also be temporally associated with the onset and/or progression of TD. To assess this temporal specificity, we again looked at the available data, including transcriptional data during striatal development [248]—which correspond to different stages of brain development and function that in turn could be linked to TD symptom occurrence, peak and resolution—and temporal gene expression data in (normal) brain tissue [344] and the blood of TD patients [66]. A third aspect of an ideal drug target for TD—that is linked to the molecular landscape—is its molecular specificity, i.e., whether it is involved in (multiple) biological processes and protein interactions in the landscape. Lastly, a suitable drug target needs to have sufficient modulatory specificity, in that it should be inherently druggable [339] and modulating the target in a certain direction—e.g., because disease-associated variants are eQTLs that (up- or down-) regulate the expression of the target [355], which is especially the case for essential genes that are relatively depleted for eQTLs [356]—has a (putative) beneficial aspect on TD (symptoms).

5. Conclusions

In conclusion, through integrating the results from multiple analyses of TD-linked genes derived from different types of omics data with an extensive literature search, we built a molecular landscape of TD. This landscape provides insights into the altered subcellular, molecular, and metabolic pathways and processes that are underlying the disease, including cAMP signaling, endocannabinoid signaling, multiple metabolic pathways (e.g., involving polyunsaturated fatty acids such as arachidonic acid, butyrate, NAAG, and myo-inositol), and synaptic functioning. Importantly, the landscape also yields clues towards potential drug targets (FLT3, NAALAD2, CX3CL1-CX3CR1, OPRM1, and HRH2) that can be further developed into TD treatments.

Supplementary Materials

The following supporting information can be downloaded at: https://www.mdpi.com/article/10.3390/ijms24021428/s1.

Author Contributions

Conceptualization, J.W. and G.P.; Methodology, J.W., W.D.W. and G.P.; Investigation, J.W., W.D.W. and G.P.; Data curation, J.W.; Writing—original draft preparation, J.W. and G.P.; Writing—review and editing, J.W., W.D.W., J.K.B., J.C.G. and G.P.; Visualization, J.W., W.D.W. and G.P.; Supervision, G.P.; Funding acquisition, J.K.B., J.C.G. and G.P. All authors have read and agreed to the published version of the manuscript.

Funding

This work has been supported by the European Union Seventh Framework People Programme under grant agreement no. 316978 (FP7-PEOPLE-2012-ITN—TS-EUROTRAIN) and by the European Union Seventh Framework Programme under grant agreement no. 278948 (TACTICS). In addition, the work has received funding from the European Union’s Horizon 2020 Programme under grant agreement no. 728018 (Eat2BeNice) and grant agreement no. 847818 (CANDY), and from the University College Dublin Ad Astra Programme and University College Dublin Conway Institute Director’s Award.

Institutional Review Board Statement

Not applicable.

Informed Consent Statement

Not applicable.

Data Availability Statement

All key data that support the findings of this study are available in the main text or the Supplementary Materials.

Conflicts of Interest

G.P. is director and J.W. as well as W.D.W. are employees of Drug Target ID, Ltd., but their activities at this company do not constitute competing interests with regard to this paper. In the past 3 years, J.K.B. has been a consultant to/a member of the advisory board of/and/or a speaker for Takeda, Roche, Medice, Angelini, Janssen, Boehringer-Ingelheim, and Servier. He is not an employee of any of these companies, and not a stock shareholder of any of these companies. He has no other financial or material support, including expert testimony, patents, royalties. J.C.G. does not report any conflicts of interest. In addition, the funders had no role in the design of the study; in the collection, analyses, or interpretation of data; in the writing of the manuscript; or in the decision to publish the results.

References

  1. Robertson, M.M.; Eapen, V.; Singer, H.S.; Martino, D.; Scharf, J.M.; Paschou, P.; Roessner, V.; Woods, D.W.; Hariz, M.; Mathews, C.A.; et al. Gilles de la Tourette syndrome. Nat. Rev. Dis. Prim. 2017, 3, 16097. [Google Scholar] [CrossRef] [PubMed]
  2. Martino, D.; Ganos, C.; Pringsheim, T.M. Chapter Fifty-Three-Tourette Syndrome and Chronic Tic Disorders: The Clinical Spectrum Beyond Tics. In International Review of Neurobiology; Chaudhuri, K.R., Titova, N., Eds.; Academic Press: Cambridge, MA, USA, 2017; Volume 134, pp. 1461–1490. [Google Scholar]
  3. Mataix-Cols, D.; Isomura, K.; Pérez-Vigil, A.; Chang, Z.; Rück, C.; Larsson, K.J.; Leckman, J.F.; Serlachius, E.; Larsson, H.; Lichtenstein, P. Familial Risks of Tourette Syndrome and Chronic Tic Disorders. A Population-Based Cohort Study. JAMA Psychiatry 2015, 72, 787–793. [Google Scholar] [CrossRef] [PubMed] [Green Version]
  4. Sun, N.; Tischfield, J.A.; King, R.A.; Heiman, G.A. Functional Evaluations of Genes Disrupted in Patients with Tourette’s Disorder. Front. Psychiatry 2016, 7, 11. [Google Scholar] [CrossRef] [PubMed] [Green Version]
  5. Tsetsos, F.; Yu, D.; Sul, J.H.; Huang, A.Y.; Illmann, C.; Osiecki, L.; Darrow, S.M.; Hirschtritt, M.E.; Greenberg, E.; Muller-Vahl, K.R.; et al. Synaptic processes and immune-related pathways implicated in Tourette syndrome. Transl. Psychiatry 2021, 11, 56. [Google Scholar] [CrossRef] [PubMed]
  6. Mathews, C.A.; Scharf, J.M.; Miller, L.L.; Macdonald-Wallis, C.; Lawlor, D.A.; Ben-Shlomo, Y. Association between pre- and perinatal exposures and Tourette syndrome or chronic tic disorder in the ALSPAC cohort. Br. J. Psychiatry 2014, 204, 40–45. [Google Scholar] [CrossRef] [Green Version]
  7. Tagwerker Gloor, F.; Walitza, S. Tic Disorders and Tourette Syndrome: Current Concepts of Etiology and Treatment in Children and Adolescents. Neuropediatrics 2016, 47, 84–96. [Google Scholar] [CrossRef]
  8. Harris, K.; Singer, H.S. Tic disorders: Neural circuits, neurochemistry, and neuroimmunology. J. Child Neurol. 2006, 21, 678–689. [Google Scholar] [CrossRef]
  9. Andrén, P.; Jakubovski, E.; Murphy, T.L.; Woitecki, K.; Tarnok, Z.; Zimmerman-Brenner, S.; van de Griendt, J.; Debes, N.M.; Viefhaus, P.; Robinson, S.; et al. European clinical guidelines for Tourette syndrome and other tic disorders-version 2.0. Part II: Psychological interventions. Eur. Child Adolesc. Psychiatry 2021, 31, 403–423. [Google Scholar] [CrossRef]
  10. Müller-Vahl, K.R.; Szejko, N.; Verdellen, C.; Roessner, V.; Hoekstra, P.J.; Hartmann, A.; Cath, D.C. European clinical guidelines for Tourette syndrome and other tic disorders: Summary statement. Eur. Child Adolesc. Psychiatry 2022, 31, 377–382. [Google Scholar] [CrossRef]
  11. Pringsheim, T.; Okun, M.S.; Müller-Vahl, K.; Martino, D.; Jankovic, J.; Cavanna, A.E.; Woods, D.W.; Robinson, M.; Jarvie, E.; Roessner, V.; et al. Practice guideline recommendations summary: Treatment of tics in people with Tourette syndrome and chronic tic disorders. Neurology 2019, 92, 896–906. [Google Scholar] [CrossRef]
  12. Roessner, V.; Eichele, H.; Stern, J.S.; Skov, L.; Rizzo, R.; Debes, N.M.; Nagy, P.; Cavanna, A.E.; Termine, C.; Ganos, C.; et al. European clinical guidelines for Tourette syndrome and other tic disorders-version 2.0. Part III: Pharmacological treatment. Eur. Child Adolesc. Psychiatry 2022, 31, 425–441. [Google Scholar] [CrossRef]
  13. King, E.A.; Davis, J.W.; Degner, J.F. Are drug targets with genetic support twice as likely to be approved? Revised estimates of the impact of genetic support for drug mechanisms on the probability of drug approval. PLoS Genet. 2019, 15, e1008489. [Google Scholar] [CrossRef]
  14. Nelson, M.R.; Tipney, H.; Painter, J.L.; Shen, J.; Nicoletti, P.; Shen, Y.; Floratos, A.; Sham, P.C.; Li, M.J.; Wang, J.; et al. The support of human genetic evidence for approved drug indications. Nat. Genet. 2015, 47, 856–860. [Google Scholar] [CrossRef]
  15. Johnson, E.C.; Border, R.; Melroy-Greif, W.E.; de Leeuw, C.A.; Ehringer, M.A.; Keller, M.C. No Evidence That Schizophrenia Candidate Genes Are More Associated with Schizophrenia Than Noncandidate Genes. Biol. Psychiatry 2017, 82, 702–708. [Google Scholar] [CrossRef]
  16. Farrell, M.S.; Werge, T.; Sklar, P.; Owen, M.J.; Ophoff, R.A.; O’Donovan, M.C.; Corvin, A.; Cichon, S.; Sullivan, P.F. Evaluating historical candidate genes for schizophrenia. Mol. Psychiatry 2015, 20, 555–562. [Google Scholar] [CrossRef] [Green Version]
  17. Poelmans, G.; Pauls, D.L.; Buitelaar, J.K.; Franke, B. Integrated genome-wide association study findings: Identification of a neurodevelopmental network for attention deficit hyperactivity disorder. Am. J. Psychiatry 2011, 168, 365–377. [Google Scholar] [CrossRef]
  18. Poelmans, G.; Franke, B.; Pauls, D.L.; Glennon, J.C.; Buitelaar, J.K. AKAPs integrate genetic findings for autism spectrum disorders. Transl. Psychiatry 2013, 3, e270. [Google Scholar] [CrossRef] [Green Version]
  19. Van de Vondervoort, I.; Poelmans, G.; Aschrafi, A.; Pauls, D.L.; Buitelaar, J.K.; Glennon, J.C.; Franke, B. An integrated molecular landscape implicates the regulation of dendritic spine formation through insulin-related signalling in obsessive-compulsive disorder. J. Psychiatry Neurosci. 2016, 41, 280–285. [Google Scholar] [CrossRef] [Green Version]
  20. Klemann, C.; Martens, G.J.M.; Sharma, M.; Martens, M.B.; Isacson, O.; Gasser, T.; Visser, J.E.; Poelmans, G. Integrated molecular landscape of Parkinson’s disease. NPJ Park. Dis. 2017, 3, 14. [Google Scholar] [CrossRef] [Green Version]
  21. Ramautar, R.; Berger, R.; van der Greef, J.; Hankemeier, T. Human metabolomics: Strategies to understand biology. Curr. Opin. Chem. Biol. 2013, 17, 841–846. [Google Scholar] [CrossRef]
  22. Hagenbeek, F.A.; Pool, R.; van Dongen, J.; Draisma, H.H.M.; Jan Hottenga, J.; Willemsen, G.; Abdellaoui, A.; Fedko, I.O.; den Braber, A.; Visser, P.J.; et al. Heritability estimates for 361 blood metabolites across 40 genome-wide association studies. Nat. Commun. 2020, 11, 39. [Google Scholar] [CrossRef] [PubMed] [Green Version]
  23. Shin, S.Y.; Fauman, E.B.; Petersen, A.K.; Krumsiek, J.; Santos, R.; Huang, J.; Arnold, M.; Erte, I.; Forgetta, V.; Yang, T.P.; et al. An atlas of genetic influences on human blood metabolites. Nat. Genet. 2014, 46, 543–550. [Google Scholar] [CrossRef] [PubMed] [Green Version]
  24. Matsumoto, N.; David, D.E.; Johnson, E.W.; Konecki, D.; Burmester, J.K.; Ledbetter, D.H.; Weber, J.L. Breakpoint sequences of an 1;8 translocation in a family with Gilles de la Tourette syndrome. Eur. J. Hum. Genet. 2000, 8, 875–883. [Google Scholar] [CrossRef] [PubMed] [Green Version]
  25. Petek, E.; Windpassinger, C.; Vincent, J.B.; Cheung, J.; Boright, A.P.; Scherer, S.W.; Kroisel, P.M.; Wagner, K. Disruption of a novel gene (IMMP2L) by a breakpoint in 7q31 associated with Tourette syndrome. Am. J. Hum. Genet. 2001, 68, 848–858. [Google Scholar] [CrossRef] [PubMed] [Green Version]
  26. Verkerk, A.J.; Mathews, C.A.; Joosse, M.; Eussen, B.H.; Heutink, P.; Oostra, B.A. Tourette Syndrome Association International Consortium for, G. CNTNAP2 is disrupted in a family with Gilles de la Tourette syndrome and obsessive compulsive disorder. Genomics 2003, 82, 1–9. [Google Scholar] [CrossRef]
  27. Abelson, J.F.; Kwan, K.Y.; O’Roak, B.J.; Baek, D.Y.; Stillman, A.A.; Morgan, T.M.; Mathews, C.A.; Pauls, D.L.; Rasin, M.R.; Gunel, M.; et al. Sequence variants in SLITRK1 are associated with Tourette’s syndrome. Science 2005, 310, 317–320. [Google Scholar] [CrossRef] [Green Version]
  28. Breedveld, G.J.; Fabbrini, G.; Oostra, B.A.; Berardelli, A.; Bonifati, V. Tourette disorder spectrum maps to chromosome 14q31.1 in an Italian kindred. Neurogenetics 2010, 11, 417–423. [Google Scholar] [CrossRef] [Green Version]
  29. Patel, C.; Cooper-Charles, L.; McMullan, D.J.; Walker, J.M.; Davison, V.; Morton, J. Translocation breakpoint at 7q31 associated with tics: Further evidence for IMMP2L as a candidate gene for Tourette syndrome. Eur. J. Hum. Genet. 2011, 19, 634–639. [Google Scholar] [CrossRef] [Green Version]
  30. Hooper, S.D.; Johansson, A.C.; Tellgren-Roth, C.; Stattin, E.L.; Dahl, N.; Cavelier, L.; Feuk, L. Genome-wide sequencing for the identification of rearrangements associated with Tourette syndrome and obsessive-compulsive disorder. BMC Med. Genet. 2012, 13, 123. [Google Scholar] [CrossRef]
  31. Bertelsen, B.; Melchior, L.; Jensen, L.R.; Groth, C.; Nazaryan, L.; Debes, N.M.; Skov, L.; Xie, G.; Sun, W.; Brondum-Nielsen, K.; et al. A t(3;9)(q25.1;q34.3) translocation leading to OLFM1 fusion transcripts in Gilles de la Tourette syndrome, OCD and ADHD. Psychiatry Res. 2015, 225, 268–275. [Google Scholar] [CrossRef]
  32. Ercan-Sencicek, A.G.; Stillman, A.A.; Ghosh, A.K.; Bilguvar, K.; O’Roak, B.J.; Mason, C.E.; Abbott, T.; Gupta, A.; King, R.A.; Pauls, D.L.; et al. L-histidine decarboxylase and Tourette’s syndrome. N. Engl. J. Med. 2010, 362, 1901–1908. [Google Scholar] [CrossRef] [Green Version]
  33. Sundaram, S.K.; Huq, A.M.; Sun, Z.; Yu, W.; Bennett, L.; Wilson, B.J.; Behen, M.E.; Chugani, H.T. Exome sequencing of a pedigree with Tourette syndrome or chronic tic disorder. Ann. Neurol. 2011, 69, 901–904. [Google Scholar] [CrossRef]
  34. Eriguchi, Y.; Kuwabara, H.; Inai, A.; Kawakubo, Y.; Nishimura, F.; Kakiuchi, C.; Tochigi, M.; Ohashi, J.; Aoki, N.; Kato, K.; et al. Identification of candidate genes involved in the etiology of sporadic Tourette syndrome by exome sequencing. Am. J. Med. Genet. B Neuropsychiatr. Genet. 2017, 174, 712–723. [Google Scholar] [CrossRef]
  35. Willsey, A.J.; Fernandez, T.V.; Yu, D.; King, R.A.; Dietrich, A.; Xing, J.; Sanders, S.J.; Mandell, J.D.; Huang, A.Y.; Richer, P.; et al. De Novo Coding Variants Are Strongly Associated with Tourette Disorder. Neuron 2017, 94, 486–499. [Google Scholar] [CrossRef] [Green Version]
  36. Sun, N.; Nasello, C.; Deng, L.; Wang, N.; Zhang, Y.; Xu, Z.; Song, Z.; Kwan, K.; King, R.A.; Pang, Z.P.; et al. The PNKD gene is associated with Tourette Disorder or Tic disorder in a multiplex family. Mol. Psychiatry 2018, 23, 1487–1495. [Google Scholar] [CrossRef] [Green Version]
  37. Wang, S.; Mandell, J.D.; Kumar, Y.; Sun, N.; Morris, M.T.; Arbelaez, J.; Nasello, C.; Dong, S.; Duhn, C.; Zhao, X.; et al. De Novo Sequence and Copy Number Variants Are Strongly Associated with Tourette Disorder and Implicate Cell Polarity in Pathogenesis. Cell Rep. 2018, 24, 3441–3454. [Google Scholar] [CrossRef] [Green Version]
  38. Carias, K.V.; Wevrick, R. Clinical and genetic analysis of children with a dual diagnosis of Tourette syndrome and autism spectrum disorder. J. Psychiatr. Res. 2019, 111, 145–153. [Google Scholar] [CrossRef]
  39. Depienne, C.; Ciura, S.; Trouillard, O.; Bouteiller, D.; Leitao, E.; Nava, C.; Keren, B.; Marie, Y.; Guegan, J.; Forlani, S.; et al. Association of Rare Genetic Variants in Opioid Receptors with Tourette Syndrome. Tremor Other Hyperkinet. Mov. 2019, 9, 1–9. [Google Scholar] [CrossRef]
  40. Vadgama, N.; Pittman, A.; Simpson, M.; Nirmalananthan, N.; Murray, R.; Yoshikawa, T.; De Rijk, P.; Rees, E.; Kirov, G.; Hughes, D.; et al. De novo single-nucleotide and copy number variation in discordant monozygotic twins reveals disease-related genes. Eur. J. Hum. Genet. 2019, 27, 1121–1133. [Google Scholar] [CrossRef]
  41. Liu, S.; Tian, M.; He, F.; Li, J.; Xie, H.; Liu, W.; Zhang, Y.; Zhang, R.; Yi, M.; Che, F.; et al. Mutations in ASH1L confer susceptibility to Tourette syndrome. Mol. Psychiatry 2020, 25, 476–490. [Google Scholar] [CrossRef]
  42. Yuan, A.; Wang, Z.; Xu, W.; Ding, Q.; Zhao, Y.; Han, J.; Sun, J. A Rare Novel CLCN2 Variation and Risk of Gilles de la Tourette Syndrome: Whole-Exome Sequencing in a Multiplex Family and a Follow-Up Study in a Chinese Population. Front. Psychiatry 2020, 11, 543911. [Google Scholar] [CrossRef] [PubMed]
  43. Zhao, X.; Wang, S.; Hao, J.; Zhu, P.; Zhang, X.; Wu, M. A Whole-Exome Sequencing Study of Tourette Disorder in a Chinese Population. DNA Cell Biol. 2020, 39, 63–68. [Google Scholar] [CrossRef] [PubMed]
  44. Cao, X.; Zhang, Y.; Abdulkadir, M.; Deng, L.; Fernandez, T.V.; Garcia-Delgar, B.; Hagstrom, J.; Hoekstra, P.J.; King, R.A.; Koesterich, J.; et al. Whole-exome sequencing identifies genes associated with Tourette’s disorder in multiplex families. Mol. Psychiatry 2021, 26, 6937–6951. [Google Scholar] [CrossRef] [PubMed]
  45. Halvorsen, M.; Szatkiewicz, J.; Mudgal, P.; Yu, D.; Psychiatric Genomics Consortium TS/OCD Working Group; Nordsletten, A.E.; Mataix-Cols, D.; Mathews, C.A.; Scharf, J.M.; Mattheisen, M.; et al. Elevated common variant genetic risk for tourette syndrome in a densely-affected pedigree. Mol. Psychiatry 2021, 26, 7522–7529. [Google Scholar] [CrossRef] [PubMed]
  46. Lawson-Yuen, A.; Saldivar, J.S.; Sommer, S.; Picker, J. Familial deletion within NLGN4 associated with autism and Tourette syndrome. Eur. J. Hum. Genet. 2008, 16, 614–618. [Google Scholar] [CrossRef] [PubMed] [Green Version]
  47. Sundaram, S.K.; Huq, A.M.; Wilson, B.J.; Chugani, H.T. Tourette syndrome is associated with recurrent exonic copy number variants. Neurology 2010, 74, 1583–1590. [Google Scholar] [CrossRef] [Green Version]
  48. Fernandez, T.V.; Sanders, S.J.; Yurkiewicz, I.R.; Ercan-Sencicek, A.G.; Kim, Y.S.; Fishman, D.O.; Raubeson, M.J.; Song, Y.; Yasuno, K.; Ho, W.S.; et al. Rare copy number variants in tourette syndrome disrupt genes in histaminergic pathways and overlap with autism. Biol. Psychiatry 2012, 71, 392–402. [Google Scholar] [CrossRef] [Green Version]
  49. Melchior, L.; Bertelsen, B.; Debes, N.M.; Groth, C.; Skov, L.; Mikkelsen, J.D.; Brøndum-Nielsen, K.; Tümer, Z. Microduplication of 15q13.3 and Xq21.31 in a family with Tourette syndrome and comorbidities. Am. J. Med. Genet. B Neuropsychiatr. Genet. 2013, 162, 825–831. [Google Scholar] [CrossRef]
  50. Nag, A.; Bochukova, E.G.; Kremeyer, B.; Campbell, D.D.; Muller, H.; Valencia-Duarte, A.V.; Cardona, J.; Rivas, I.C.; Mesa, S.C.; Cuartas, M.; et al. CNV analysis in Tourette syndrome implicates large genomic rearrangements in COL8A1 and NRXN1. PLoS ONE 2013, 8, e59061. [Google Scholar] [CrossRef] [Green Version]
  51. McGrath, L.M.; Yu, D.; Marshall, C.; Davis, L.K.; Thiruvahindrapuram, B.; Li, B.; Cappi, C.; Gerber, G.; Wolf, A.; Schroeder, F.A.; et al. Copy number variation in obsessive-compulsive disorder and tourette syndrome: A cross-disorder study. J. Am. Acad. Child Adolesc. Psychiatry 2014, 53, 910–919. [Google Scholar] [CrossRef]
  52. Prontera, P.; Napolioni, V.; Ottaviani, V.; Rogaia, D.; Fusco, C.; Augello, B.; Serino, D.; Parisi, V.; Bernardini, L.; Merla, G.; et al. DPP6 gene disruption in a family with Gilles de la Tourette syndrome. Neurogenetics 2014, 15, 237–242. [Google Scholar] [CrossRef]
  53. Huang, A.Y.; Yu, D.; Davis, L.K.; Sul, J.H.; Tsetsos, F.; Ramensky, V.; Zelaya, I.; Ramos, E.M.; Osiecki, L.; Chen, J.A.; et al. Rare Copy Number Variants in NRXN1 and CNTN6 Increase Risk for Tourette Syndrome. Neuron 2017, 94, 1101–1111. [Google Scholar] [CrossRef] [Green Version]
  54. Maccarini, S.; Cipani, A.; Bertini, V.; Skripac, J.; Salvi, A.; Borsani, G.; Marchina, E. Inherited duplication of the pseudoautosomal region Xq28 in a subject with Gilles de la Tourette syndrome and intellectual disability: A case report. Mol. Cytogenet. 2020, 13, 23. [Google Scholar] [CrossRef]
  55. Yu, D.; Sul, J.H.; Tsetsos, F.; Nawaz, M.S.; Huang, A.Y.; Zelaya, I.; Illmann, C.; Osiecki, L.; Darrow, S.M.; Hirschtritt, M.E.; et al. Interrogating the Genetic Determinants of Tourette’s Syndrome and Other Tic Disorders Through Genome-Wide Association Studies. Am. J. Psychiatry 2019, 176, 217–227. [Google Scholar] [CrossRef]
  56. Buniello, A.; MacArthur, J.A.L.; Cerezo, M.; Harris, L.W.; Hayhurst, J.; Malangone, C.; McMahon, A.; Morales, J.; Mountjoy, E.; Sollis, E.; et al. The NHGRI-EBI GWAS Catalog of published genome-wide association studies, targeted arrays and summary statistics 2019. Nucleic Acids Res. 2019, 47, D1005–D1012. [Google Scholar] [CrossRef] [Green Version]
  57. Cross-Disorder Group of the Psychiatric Genomics Consortium. Genomic Relationships, Novel Loci, and Pleiotropic Mechanisms across Eight Psychiatric Disorders. Cell 2019, 179, 1469–1482. [Google Scholar] [CrossRef] [Green Version]
  58. Reay, W.R.; Cairns, M.J. Pairwise common variant meta-analyses of schizophrenia with other psychiatric disorders reveals shared and distinct gene and gene-set associations. Transl. Psychiatry 2020, 10, 134. [Google Scholar] [CrossRef]
  59. Peyrot, W.J.; Price, A.L. Identifying loci with different allele frequencies among cases of eight psychiatric disorders using CC-GWAS. Nat. Genet. 2021, 53, 445–454. [Google Scholar] [CrossRef]
  60. Yang, Z.; Wu, H.; Lee, P.H.; Tsetsos, F.; Davis, L.K.; Yu, D.; Lee, S.H.; Dalsgaard, S.; Haavik, J.; Barta, C.; et al. Investigating Shared Genetic Basis Across Tourette Syndrome and Comorbid Neurodevelopmental Disorders Along the Impulsivity-Compulsivity Spectrum. Biol. Psychiatry 2021, 90, 317–327. [Google Scholar] [CrossRef]
  61. Tsetsos, F.; Topaloudi, A.; Jain, P.; Yang, Z.; Yu, D.; Kolovos, P.; Tumer, Z.; Rizzo, R.; Hartmann, A.; Depienne, C.; et al. Genome-wide Association Study identifies two novel loci for Gilles de la Tourette Syndrome. medRxiv 2021. [Google Scholar] [CrossRef]
  62. Zilhão, N.R.; Padmanabhuni, S.S.; Pagliaroli, L.; Barta, C.; Smit, D.J.; Cath, D.; Nivard, M.G.; Baselmans, B.M.; van Dongen, J.; Paschou, P.; et al. Epigenome-Wide Association Study of Tic Disorders. Twin Res. Hum. Genet. 2015, 18, 699–709. [Google Scholar] [CrossRef] [PubMed] [Green Version]
  63. Hildonen, M.; Levy, A.M.; Hansen, C.S.; Bybjerg-Grauholm, J.; Skytthe, A.; Debes, N.M.; Tan, Q.; Tümer, Z. EWAS of Monozygotic Twins Implicate a Role of mTOR Pathway in Pathogenesis of Tic Spectrum Disorder. Genes 2021, 12, 1510. [Google Scholar] [CrossRef] [PubMed]
  64. Lennington, J.B.; Coppola, G.; Kataoka-Sasaki, Y.; Fernandez, T.V.; Palejev, D.; Li, Y.; Huttner, A.; Pletikos, M.; Sestan, N.; Leckman, J.F.; et al. Transcriptome Analysis of the Human Striatum in Tourette Syndrome. Biol. Psychiatry 2016, 79, 372–382. [Google Scholar] [CrossRef] [Green Version]
  65. Lit, L.; Gilbert, D.L.; Walker, W.; Sharp, F.R. A subgroup of Tourette’s patients overexpress specific natural killer cell genes in blood: A preliminary report. Am. J. Med. Genet. B Neuropsychiatr. Genet. 2007, 144, 958–963. [Google Scholar] [CrossRef] [PubMed]
  66. Lit, L.; Enstrom, A.; Sharp, F.R.; Gilbert, D.L. Age-related gene expression in Tourette syndrome. J. Psychiatr. Res. 2009, 43, 319–330. [Google Scholar] [CrossRef] [Green Version]
  67. Tian, Y.; Gunther, J.R.; Liao, I.H.; Liu, D.; Ander, B.P.; Stamova, B.S.; Lit, L.; Jickling, G.C.; Xu, H.; Zhan, X.; et al. GABA- and acetylcholine-related gene expression in blood correlate with tic severity and microarray evidence for alternative splicing in Tourette syndrome: A pilot study. Brain Res. 2011, 1381, 228–236. [Google Scholar] [CrossRef]
  68. Tian, Y.; Liao, I.H.; Zhan, X.; Gunther, J.R.; Ander, B.P.; Liu, D.; Lit, L.; Jickling, G.C.; Corbett, B.A.; Bos-Veneman, N.G.; et al. Exon expression and alternatively spliced genes in Tourette Syndrome. Am. J. Med. Genet. B Neuropsychiatr. Genet. 2011, 156, 72–78. [Google Scholar] [CrossRef] [Green Version]
  69. Xi, L.; Zhou, F.; Sha, H.; Zhu, W.; Hu, X.; Ruan, J.; Huang, Y.; Zhang, Y.; Long, H. Potential Plasma Metabolic Biomarkers of Tourette Syndrome Discovery Based on Integrated Non-Targeted and Targeted Metabolomics Screening. Res. Sq. 2020, 1–21. [Google Scholar] [CrossRef]
  70. Murgia, F.; Gagliano, A.; Tanca, M.G.; Or-Geva, N.; Hendren, A.; Carucci, S.; Pintor, M.; Cera, F.; Cossu, F.; Sotgiu, S.; et al. Metabolomic Characterization of Pediatric Acute-Onset Neuropsychiatric Syndrome (PANS). Front. Neurosci. 2021, 15, 597. [Google Scholar] [CrossRef]
  71. Piras, C.; Pintus, R.; Pruna, D.; Dessì, A.; Atzori, L.; Fanos, V. Pediatric Acute-onset Neuropsychiatric Syndrome and Mycoplasma pneumoniae Infection: A Case Report Analysis with a Metabolomics Approach. Curr. Pediatr. Rev. 2020, 16, 183–193. [Google Scholar] [CrossRef]
  72. Xi, W.; Gao, X.; Zhao, H.; Luo, X.; Li, J.; Tan, X.; Wang, L.; Zhao, J.B.; Wang, J.; Yang, G.; et al. Depicting the composition of gut microbiota in children with tic disorders: An exploratory study. J. Child Psychol Psychiatry 2021, 62, 1246–1254. [Google Scholar] [CrossRef]
  73. Quagliariello, A.; Del Chierico, F.; Russo, A.; Reddel, S.; Conte, G.; Lopetuso, L.R.; Ianiro, G.; Dallapiccola, B.; Cardona, F.; Gasbarrini, A.; et al. Gut Microbiota Profiling and Gut–Brain Crosstalk in Children Affected by Pediatric Acute-Onset Neuropsychiatric Syndrome and Pediatric Autoimmune Neuropsychiatric Disorders Associated with Streptococcal Infections. Front. Microbiol. 2018, 9, 675. [Google Scholar] [CrossRef] [Green Version]
  74. Xu, X.; Nehorai, A.; Dougherty, J. Cell Type Specific Analysis of Human Brain Transcriptome Data to Predict Alterations in Cellular Composition. Syst. Biomed. 2013, 1, 151–160. [Google Scholar] [CrossRef] [Green Version]
  75. Vanderah, T.W.; Gould, D.J. Organization of the Brainstem. In Nolte’s The Human Brain, 8th ed.; Elsevier: Amsterdam, The Netherlands, 2021; pp. 258–284. [Google Scholar]
  76. Ahola-Olli, A.V.; Würtz, P.; Havulinna, A.S.; Aalto, K.; Pitkänen, N.; Lehtimäki, T.; Kähönen, M.; Lyytikäinen, L.P.; Raitoharju, E.; Seppälä, I.; et al. Genome-wide Association Study Identifies 27 Loci Influencing Concentrations of Circulating Cytokines and Growth Factors. Am. J. Hum. Genet. 2017, 100, 40–50. [Google Scholar] [CrossRef] [Green Version]
  77. Draisma, H.H.M.; Pool, R.; Kobl, M.; Jansen, R.; Petersen, A.-K.; Vaarhorst, A.A.M.; Yet, I.; Haller, T.; Demirkan, A.; Esko, T.; et al. Genome-wide association study identifies novel genetic variants contributing to variation in blood metabolite levels. Nat. Commun. 2015, 6, 7208. [Google Scholar] [CrossRef] [Green Version]
  78. Kettunen, J.; Demirkan, A.; Würtz, P.; Draisma, H.H.; Haller, T.; Rawal, R.; Vaarhorst, A.; Kangas, A.J.; Lyytikäinen, L.P.; Pirinen, M.; et al. Genome-wide study for circulating metabolites identifies 62 loci and reveals novel systemic effects of LPA. Nat. Commun. 2016, 7, 11122. [Google Scholar] [CrossRef] [Green Version]
  79. Panyard, D.J.; Kim, K.M.; Darst, B.F.; Deming, Y.K.; Zhong, X.; Wu, Y.; Kang, H.; Carlsson, C.M.; Johnson, S.C.; Asthana, S.; et al. Cerebrospinal fluid metabolomics identifies 19 brain-related phenotype associations. Commun. Biol. 2021, 4, 63. [Google Scholar] [CrossRef]
  80. Rhee, E.P.; Ho, J.E.; Chen, M.H.; Shen, D.; Cheng, S.; Larson, M.G.; Ghorbani, A.; Shi, X.; Helenius, I.T.; O’Donnell, C.J.; et al. A genome-wide association study of the human metabolome in a community-based cohort. Cell Metab. 2013, 18, 130–143. [Google Scholar] [CrossRef] [Green Version]
  81. Aramideh, J.A.; Vidal-Itriago, A.; Morsch, M.; Graeber, M.M.B. Cytokine Signalling at the Microglial Penta-Partite Synapse. Int. J. Mol. Sci. 2021, 22, 13186. [Google Scholar] [CrossRef]
  82. Ferrer-Ferrer, M.; Dityatev, A. Shaping Synapses by the Neural Extracellular Matrix. Front. Neuroanat. 2018, 12, 40. [Google Scholar] [CrossRef]
  83. Krishnaswamy, V.R.; Benbenishty, A.; Blinder, P.; Sagi, I. Demystifying the extracellular matrix and its proteolytic remodeling in the brain: Structural and functional insights. Cell. Mol. Life Sci. 2019, 76, 3229–3248. [Google Scholar] [CrossRef] [PubMed]
  84. De Luca, C.; Colangelo, A.M.; Virtuoso, A.; Alberghina, L.; Papa, M. Neurons, Glia, Extracellular Matrix and Neurovascular Unit: A Systems Biology Approach to the Complexity of Synaptic Plasticity in Health and Disease. Int. J. Mol. Sci. 2020, 21, 1539. [Google Scholar] [CrossRef] [PubMed] [Green Version]
  85. Mulligan, K.A.; Cheyette, B.N. Neurodevelopmental Perspectives on Wnt Signaling in Psychiatry. Mol. Neuropsychiatry 2017, 2, 219–246. [Google Scholar] [CrossRef] [PubMed] [Green Version]
  86. Almén, M.S.; Nordström, K.J.; Fredriksson, R.; Schiöth, H.B. Mapping the human membrane proteome: A majority of the human membrane proteins can be classified according to function and evolutionary origin. BMC Biol. 2009, 7, 50. [Google Scholar] [CrossRef] [PubMed] [Green Version]
  87. Gerber, K.J.; Squires, K.E.; Hepler, J.R. Roles for Regulator of G Protein Signaling Proteins in Synaptic Signaling and Plasticity. Mol. Pharm. 2016, 89, 273–286. [Google Scholar] [CrossRef] [Green Version]
  88. Liu, J.; Yang, L.; Li, H.; Cai, Y.; Feng, J.; Hu, Z. Conditional ablation of protein tyrosine phosphatase receptor U in midbrain dopaminergic neurons results in reduced neuronal size. J. Chem. Neuroanat. 2022, 124, 102135. [Google Scholar] [CrossRef]
  89. Daniels, M.P. The role of agrin in synaptic development, plasticity and signaling in the central nervous system. Neurochem. Int. 2012, 61, 848–853. [Google Scholar] [CrossRef] [Green Version]
  90. Hilgenberg, L.G.; Su, H.; Gu, H.; O’Dowd, D.K.; Smith, M.A. Alpha3Na+/K+-ATPase is a neuronal receptor for agrin. Cell 2006, 125, 359–369. [Google Scholar] [CrossRef] [Green Version]
  91. Xie, X.; Mahmood, S.R.; Gjorgjieva, T.; Percipalle, P. Emerging roles of cytoskeletal proteins in regulating gene expression and genome organization during differentiation. Nucleus 2020, 11, 53–65. [Google Scholar] [CrossRef] [Green Version]
  92. Herrmann, H.; Strelkov, S.V.; Burkhard, P.; Aebi, U. Intermediate filaments: Primary determinants of cell architecture and plasticity. J. Clin. Investig. 2009, 119, 1772–1783. [Google Scholar] [CrossRef]
  93. Parato, J.; Bartolini, F. The microtubule cytoskeleton at the synapse. Neurosci. Lett. 2021, 753, 135850. [Google Scholar] [CrossRef]
  94. Rapoport, S.I.; Primiani, C.T.; Chen, C.T.; Ahn, K.; Ryan, V.H. Coordinated Expression of Phosphoinositide Metabolic Genes during Development and Aging of Human Dorsolateral Prefrontal Cortex. PLoS ONE 2015, 10, e0132675. [Google Scholar] [CrossRef] [Green Version]
  95. Posor, Y.; Jang, W.; Haucke, V. Phosphoinositides as membrane organizers. Nat. Rev. Mol. Cell Biol. 2022, 23, 797–816. [Google Scholar] [CrossRef]
  96. Parthasarathy, L.K.; Ratnam, L.; Seelan, S.; Tobias, C.; Casanova, M.F.; Parthasarathy, R.N. Mammalian Inositol 3-phosphate Synthase: Its Role in the Biosynthesis of Brain Inositol and its Clinical Use as a Psychoactive Agent. In Biology of Inositols and Phosphoinositides: Subcellular Biochemistry; Majumder, A.L., Biswas, B.B., Eds.; Springer: Boston, MA, USA, 2006; pp. 293–314. [Google Scholar]
  97. Gupta, M.K.; Randhawa, P.K.; Masternak, M.M. Role of BAG5 in Protein Quality Control: Double-Edged Sword? Front. Aging 2022, 3, 844168. [Google Scholar] [CrossRef]
  98. Prashad, S.; Gopal, P.P. RNA-binding proteins in neurological development and disease. RNA Biol. 2021, 18, 972–987. [Google Scholar] [CrossRef]
  99. Aibara, S.; Singh, V.; Modelska, A.; Amunts, A. Structural basis of mitochondrial translation. eLife 2020, 9, e58362. [Google Scholar] [CrossRef]
  100. O’Leary, N.A.; Wright, M.W.; Brister, J.R.; Ciufo, S.; Haddad, D.; McVeigh, R.; Rajput, B.; Robbertse, B.; Smith-White, B.; Ako-Adjei, D.; et al. Reference sequence (RefSeq) database at NCBI: Current status, taxonomic expansion, and functional annotation. Nucleic Acids Res. 2016, 44, D733–D745. [Google Scholar] [CrossRef] [Green Version]
  101. Nguyen, N.D.; Wang, D. Multiview learning for understanding functional multiomics. PLoS Comput. Biol. 2020, 16, e1007677. [Google Scholar] [CrossRef]
  102. Carulli, D.; Laabs, T.; Geller, H.M.; Fawcett, J.W. Chondroitin sulfate proteoglycans in neural development and regeneration. Curr. Opin. Neurobiol. 2005, 15, 116–120. [Google Scholar] [CrossRef]
  103. Ebersole, B.; Petko, J.; Woll, M.; Murakami, S.; Sokolina, K.; Wong, V.; Stagljar, I.; Lüscher, B.; Levenson, R. Effect of C-Terminal S-Palmitoylation on D2 Dopamine Receptor Trafficking and Stability. PLoS ONE 2015, 10, e0140661. [Google Scholar] [CrossRef]
  104. Beck, M.; Hurt, E. The nuclear pore complex: Understanding its function through structural insight. Nat. Rev. Mol. Cell Biol 2017, 18, 73–89. [Google Scholar] [CrossRef] [PubMed]
  105. Francette, A.M.; Tripplehorn, S.A.; Arndt, K.M. The Paf1 Complex: A Keystone of Nuclear Regulation Operating at the Interface of Transcription and Chromatin. J. Mol. Biol. 2021, 433, 166979. [Google Scholar] [CrossRef] [PubMed]
  106. Sheikh, B.N.; Guhathakurta, S.; Akhtar, A. The non-specific lethal (NSL) complex at the crossroads of transcriptional control and cellular homeostasis. EMBO Rep. 2019, 20, e47630. [Google Scholar] [CrossRef] [PubMed]
  107. Colonna, M.; Butovsky, O. Microglia Function in the Central Nervous System During Health and Neurodegeneration. Annu. Rev. Immunol 2017, 35, 441–468. [Google Scholar] [CrossRef] [PubMed]
  108. Allen, N.J.; Barres, B.A. Glia—More than just brain glue. Nature 2009, 457, 675–677. [Google Scholar] [CrossRef]
  109. Eroglu, C.; Barres, B.A. Regulation of synaptic connectivity by glia. Nature 2010, 468, 223–231. [Google Scholar] [CrossRef] [Green Version]
  110. Mauch, D.H.; Nägler, K.; Schumacher, S.; Göritz, C.; Müller, E.C.; Otto, A.; Pfrieger, F.W. CNS synaptogenesis promoted by glia-derived cholesterol. Science 2001, 294, 1354–1357. [Google Scholar] [CrossRef]
  111. Dai, Y.B.; Tan, X.J.; Wu, W.F.; Warner, M.; Gustafsson, J. Liver X receptor β protects dopaminergic neurons in a mouse model of Parkinson disease. Proc. Natl. Acad. Sci. USA 2012, 109, 13112–13117. [Google Scholar] [CrossRef] [Green Version]
  112. Breschi, A.; Muñoz-Aguirre, M.; Wucher, V.; Davis, C.A.; Garrido-Martín, D.; Djebali, S.; Gillis, J.; Pervouchine, D.D.; Vlasova, A.; Dobin, A.; et al. A limited set of transcriptional programs define major cell types. Genome Res. 2020, 30, 1047–1059. [Google Scholar] [CrossRef]
  113. Caligiore, D.; Mannella, F.; Arbib, M.A.; Baldassarre, G. Dysfunctions of the basal ganglia-cerebellar-thalamo-cortical system produce motor tics in Tourette syndrome. PLoS Comput. Biol. 2017, 13, e1005395. [Google Scholar] [CrossRef]
  114. Wan, X.; Zhang, S.; Wang, W.; Su, X.; Li, J.; Yang, X.; Tan, Q.; Yue, Q.; Gong, Q. Gray matter abnormalities in Tourette Syndrome: A meta-analysis of voxel-based morphometry studies. Transl. Psychiatry 2021, 11, 287. [Google Scholar] [CrossRef]
  115. Kreitzer, A.C. Physiology and pharmacology of striatal neurons. Annu. Rev. Neurosci. 2009, 32, 127–147. [Google Scholar] [CrossRef]
  116. Smith, A.C.W.; Jonkman, S.; Difeliceantonio, A.G.; O’Connor, R.M.; Ghoshal, S.; Romano, M.F.; Everitt, B.J.; Kenny, P.J. Opposing roles for striatonigral and striatopallidal neurons in dorsolateral striatum in consolidating new instrumental actions. Nat. Commun. 2021, 12, 5121. [Google Scholar] [CrossRef]
  117. Sun, Z.; Wu, M.; Ren, W. Striatal D2: Where habits and newly learned actions meet. Learn. Behav. 2022, 50, 267–268. [Google Scholar] [CrossRef]
  118. Leckman, J.F.; Riddle, M.A. Tourette’s Syndrome: When Habit-Forming Systems Form Habits of Their Own? Neuron 2000, 28, 349–354. [Google Scholar] [CrossRef] [Green Version]
  119. Maia, T.V.; Conceicao, V.A. The Roles of Phasic and Tonic Dopamine in Tic Learning and Expression. Biol. Psychiatry 2017, 82, 401–412. [Google Scholar] [CrossRef]
  120. Delorme, C.; Salvador, A.; Valabrègue, R.; Roze, E.; Palminteri, S.; Vidailhet, M.; de Wit, S.; Robbins, T.; Hartmann, A.; Worbe, Y. Enhanced habit formation in Gilles de la Tourette syndrome. Brain 2015, 139, 605–615. [Google Scholar] [CrossRef] [Green Version]
  121. Shephard, E.; Groom, M.J.; Jackson, G.M. Implicit sequence learning in young people with Tourette syndrome with and without co-occurring attention-deficit/hyperactivity disorder. J. Neuropsychol. 2019, 13, 529–549. [Google Scholar] [CrossRef]
  122. Beste, C.; Münchau, A. Tics and Tourette syndrome—Surplus of actions rather than disorder? Mov. Disord. 2018, 33, 238–242. [Google Scholar] [CrossRef]
  123. Fründt, O.; Woods, D.; Ganos, C. Behavioral therapy for Tourette syndrome and chronic tic disorders. Neurol. Clin. Pract. 2017, 7, 148. [Google Scholar] [CrossRef]
  124. Petruo, V.; Bodmer, B.; Bluschke, A.; Münchau, A.; Roessner, V.; Beste, C. Comprehensive Behavioral Intervention for Tics reduces perception-action binding during inhibitory control in Gilles de la Tourette syndrome. Sci. Rep. 2020, 10, 1174. [Google Scholar] [CrossRef] [PubMed] [Green Version]
  125. Reynolds, L.M.; Flores, C. Mesocorticolimbic Dopamine Pathways Across Adolescence: Diversity in Development. Front. Neural Circuits 2021, 15, 735625. [Google Scholar] [CrossRef] [PubMed]
  126. Lieberman, O.J.; McGuirt, A.F.; Mosharov, E.V.; Pigulevskiy, I.; Hobson, B.D.; Choi, S.; Frier, M.D.; Santini, E.; Borgkvist, A.; Sulzer, D. Dopamine Triggers the Maturation of Striatal Spiny Projection Neuron Excitability during a Critical Period. Neuron 2018, 99, 540–554. [Google Scholar] [CrossRef] [PubMed]
  127. Haycock, J.W.; Becker, L.; Ang, L.; Furukawa, Y.; Hornykiewicz, O.; Kish, S.J. Marked disparity between age-related changes in dopamine and other presynaptic dopaminergic markers in human striatum. J. Neurochem. 2003, 87, 574–585. [Google Scholar] [CrossRef] [PubMed]
  128. Minzer, K.; Lee, O.; Hong, J.J.; Singer, H.S. Increased prefrontal D2 protein in Tourette syndrome: A postmortem analysis of frontal cortex and striatum. J. Neurol. Sci. 2004, 219, 55–61. [Google Scholar] [CrossRef]
  129. Yoon, D.Y.; Gause, C.D.; Leckman, J.F.; Singer, H.S. Frontal dopaminergic abnormality in Tourette syndrome: A postmortem analysis. J. Neurol. Sci. 2007, 255, 50–56. [Google Scholar] [CrossRef]
  130. Wolf, S.S.; Jones, D.W.; Knable, M.B.; Gorey, J.G.; Lee, K.S.; Hyde, T.M.; Coppola, R.; Weinberger, D.R. Tourette syndrome: Prediction of phenotypic variation in monozygotic twins by caudate nucleus D2 receptor binding. Science 1996, 273, 1225–1227. [Google Scholar] [CrossRef]
  131. Singer, H.S. Treatment of tics and tourette syndrome. Curr. Treat. Options Neurol. 2010, 12, 539–561. [Google Scholar] [CrossRef]
  132. Kataoka, Y.; Kalanithi, P.S.; Grantz, H.; Schwartz, M.L.; Saper, C.; Leckman, J.F.; Vaccarino, F.M. Decreased number of parvalbumin and cholinergic interneurons in the striatum of individuals with Tourette syndrome. J. Comp. Neurol. 2010, 518, 277–291. [Google Scholar] [CrossRef]
  133. Favier, M.; Janickova, H.; Justo, D.; Kljakic, O.; Runtz, L.; Natsheh, J.Y.; Pascoal, T.A.; Germann, J.; Gallino, D.; Kang, J.I.; et al. Cholinergic dysfunction in the dorsal striatum promotes habit formation and maladaptive eating. J. Clin. Investig. 2020, 130, 6616–6630. [Google Scholar] [CrossRef]
  134. Aoki, S.; Liu, A.W.; Akamine, Y.; Zucca, A.; Zucca, S.; Wickens, J.R. Cholinergic interneurons in the rat striatum modulate substitution of habits. Eur. J. Neurosci. 2018, 47, 1194–1205. [Google Scholar] [CrossRef] [Green Version]
  135. Gritton, H.J.; Howe, W.M.; Romano, M.F.; DiFeliceantonio, A.G.; Kramer, M.A.; Saligrama, V.; Bucklin, M.E.; Zemel, D.; Han, X. Unique contributions of parvalbumin and cholinergic interneurons in organizing striatal networks during movement. Nat. Neurosci. 2019, 22, 586–597. [Google Scholar] [CrossRef]
  136. Quik, M.; Boyd, J.T.; Bordia, T.; Perez, X. Potential Therapeutic Application for Nicotinic Receptor Drugs in Movement Disorders. Nicotine Tob. Res. 2019, 21, 357–369. [Google Scholar] [CrossRef]
  137. Schramm, M.; Selinger, Z. Message transmission: Receptor controlled adenylate cyclase system. Science 1984, 225, 1350–1356. [Google Scholar] [CrossRef]
  138. Taskén, K.; Skålhegg, B.S.; Taskén, K.A.; Solberg, R.; Knutsen, H.K.; Levy, F.O.; Sandberg, M.; Orstavik, S.; Larsen, T.; Johansen, A.K.; et al. Structure, function, and regulation of human cAMP-dependent protein kinases. Adv. Second Messenger Phosphoprot. Res. 1997, 31, 191–204. [Google Scholar] [CrossRef]
  139. Singer, H.S.; Hahn, I.H.; Krowiak, E.; Nelson, E.; Moran, T. Tourette’s syndrome: A neurochemical analysis of postmortem cortical brain tissue. Ann. Neurol. 1990, 27, 443–446. [Google Scholar] [CrossRef]
  140. Singer, H.S.; Hahn, I.H.; Moran, T.H. Abnormal dopamine uptake sites in postmortem striatum from patients with Tourette’s syndrome. Ann. Neurol. 1991, 30, 558–562. [Google Scholar] [CrossRef]
  141. Korff, S.; Stein, D.J.; Harvey, B.H. Cortico-striatal cyclic AMP-phosphodiesterase-4 signalling and stereotypy in the deer mouse: Attenuation after chronic fluoxetine treatment. Pharmacol. Biochem. Behav. 2009, 92, 514–520. [Google Scholar] [CrossRef]
  142. Andersen, S.L. Changes in the second messenger cyclic AMP during development may underlie motoric symptoms in attention deficit/hyperactivity disorder (ADHD). Behav. Brain Res. 2002, 130, 197–201. [Google Scholar] [CrossRef]
  143. Vendel, E.; de Lange, E.C. Functions of the CB1 and CB 2 receptors in neuroprotection at the level of the blood-brain barrier. Neuromol. Med. 2014, 16, 620–642. [Google Scholar] [CrossRef]
  144. Castillo, P.E.; Younts, T.J.; Chávez, A.E.; Hashimotodani, Y. Endocannabinoid signaling and synaptic function. Neuron 2012, 76, 70–81. [Google Scholar] [CrossRef] [PubMed] [Green Version]
  145. Szejko, N.; Fichna, J.P.; Safranow, K.; Dziuba, T.; Żekanowski, C.; Janik, P. Association of a Variant of CNR1 Gene Encoding Cannabinoid Receptor 1 With Gilles de la Tourette Syndrome. Front. Genet. 2020, 11, 125. [Google Scholar] [CrossRef] [PubMed] [Green Version]
  146. Gadzicki, D.; Müller-Vahl, K.R.; Heller, D.; Ossege, S.; Nöthen, M.M.; Hebebrand, J.; Stuhrmann, M. Tourette syndrome is not caused by mutations in the central cannabinoid receptor (CNR1) gene. Am. J. Med. Genet. B Neuropsychiatr. Genet. 2004, 127, 97–103. [Google Scholar] [CrossRef] [PubMed]
  147. Müller-Vahl, K.R.; Bindila, L.; Lutz, B.; Musshoff, F.; Skripuletz, T.; Baumgaertel, C.; Sühs, K.W. Cerebrospinal fluid endocannabinoid levels in Gilles de la Tourette syndrome. Neuropsychopharmacology 2020, 45, 1323–1329. [Google Scholar] [CrossRef] [Green Version]
  148. Watson, S.; Chambers, D.; Hobbs, C.; Doherty, P.; Graham, A. The endocannabinoid receptor, CB1, is required for normal axonal growth and fasciculation. Mol. Cell. Neurosci. 2008, 38, 89–97. [Google Scholar] [CrossRef]
  149. Martella, A.; Sepe, R.M.; Silvestri, C.; Zang, J.; Fasano, G.; Carnevali, O.; De Girolamo, P.; Neuhauss, S.C.; Sordino, P.; Di Marzo, V. Important role of endocannabinoid signaling in the development of functional vision and locomotion in zebrafish. FASEB J. 2016, 30, 4275–4288. [Google Scholar] [CrossRef] [Green Version]
  150. Gianessi, C.A.; Groman, S.M.; Taylor, J.R. The effects of fatty acid amide hydrolase inhibition and monoacylglycerol lipase inhibition on habit formation in mice. Eur. J. Neurosci. 2022, 55, 922–938. [Google Scholar] [CrossRef]
  151. Hilário, M.R.; Clouse, E.; Yin, H.H.; Costa, R.M. Endocannabinoid signaling is critical for habit formation. Front. Integr. Neurosci. 2007, 1, 6. [Google Scholar] [CrossRef] [Green Version]
  152. Wade, M.R.; Tzavara, E.T.; Nomikos, G.G. Cannabinoids reduce cAMP levels in the striatum of freely moving rats: An in vivo microdialysis study. Brain Res. 2004, 1005, 117–123. [Google Scholar] [CrossRef]
  153. Pacheco, M.; Childers, S.R.; Arnold, R.; Casiano, F.; Ward, S.J. Aminoalkylindoles: Actions on specific G-protein-linked receptors. J. Pharmacol. Exp. Ther. 1991, 257, 170–183. [Google Scholar]
  154. Glass, M.; Felder, C.C. Concurrent stimulation of cannabinoid CB1 and dopamine D2 receptors augments cAMP accumulation in striatal neurons: Evidence for a Gs linkage to the CB1 receptor. J. Neurosci. 1997, 17, 5327–5333. [Google Scholar] [CrossRef]
  155. Sandyk, R.; Awerbuch, G. Marijuana and Tourette’s syndrome. J. Clin. Psychopharmacol. 1988, 8, 444–445. [Google Scholar] [CrossRef]
  156. Artukoglu, B.B.; Bloch, M.H. The Potential of Cannabinoid-Based Treatments in Tourette Syndrome. CNS Drugs 2019, 33, 417–430. [Google Scholar] [CrossRef]
  157. Szejko, N.; Saramak, K.; Lombroso, A.; Müller-Vahl, K. Cannabis-based medicine in treatment of patients with Gilles de la Tourette syndrome. Neurol. Neurochir. Pol. 2022, 56, 28–38. [Google Scholar] [CrossRef]
  158. Fride, E. The endocannabinoid-CB receptor system: Importance for development and in pediatric disease. Neuroendocrinol. Lett 2004, 25, 24–30. [Google Scholar]
  159. Hasan, A.; Rothenberger, A.; Münchau, A.; Wobrock, T.; Falkai, P.; Roessner, V. Oral delta 9-tetrahydrocannabinol improved refractory Gilles de la Tourette syndrome in an adolescent by increasing intracortical inhibition: A case report. J. Clin. Psychopharmacol. 2010, 30, 190–192. [Google Scholar] [CrossRef]
  160. Szejko, N.; Jakubovski, E.; Fremer, C.; Kunert, K.; Mueller-Vahl, K. Delta-9-tetrahydrocannabinol for the treatment of a child with Tourette syndrome—Case report. Eur. J. Med. Case Rep. 2018, 2, 39–41. [Google Scholar] [CrossRef]
  161. Szejko, N.; Jakubovski, E.; Fremer, C.; Müller-Vahl, K.R. Vaporized Cannabis Is Effective and Well-Tolerated in an Adolescent with Tourette Syndrome. Med. Cannabis Cannabinoids 2019, 2, 60–64. [Google Scholar] [CrossRef]
  162. Wu, S.W.; Gilbert, D.L. Altered neurophysiologic response to intermittent theta burst stimulation in Tourette syndrome. Brain Stimul. 2012, 5, 315–319. [Google Scholar] [CrossRef]
  163. Suppa, A.; Belvisi, D.; Bologna, M.; Marsili, L.; Berardelli, I.; Moretti, G.; Pasquini, M.; Fabbrini, G.; Berardelli, A. Abnormal cortical and brain stem plasticity in Gilles de la Tourette syndrome. Mov. Disord. 2011, 26, 1703–1710. [Google Scholar] [CrossRef]
  164. Brandt, V.C.; Niessen, E.; Ganos, C.; Kahl, U.; Bäumer, T.; Münchau, A. Altered synaptic plasticity in Tourette’s syndrome and its relationship to motor skill learning. PLoS ONE 2014, 9, e98417. [Google Scholar] [CrossRef] [PubMed] [Green Version]
  165. Wilcken, D.E.; Wilcken, B.; Dudman, N.P.; Tyrrell, P.A. Homocystinuria—The effects of betaine in the treatment of patients not responsive to pyridoxine. N. Engl. J. Med. 1983, 309, 448–453. [Google Scholar] [CrossRef] [PubMed]
  166. McKeever, M.P.; Weir, D.G.; Molloy, A.; Scott, J.M. Betaine-homocysteine methyltransferase: Organ distribution in man, pig and rat and subcellular distribution in the rat. Clin. Sci. 1991, 81, 551–556. [Google Scholar] [CrossRef] [PubMed] [Green Version]
  167. Mentch, S.J.; Mehrmohamadi, M.; Huang, L.; Liu, X.; Gupta, D.; Mattocks, D.; Gómez Padilla, P.; Ables, G.; Bamman, M.M.; Thalacker-Mercer, A.E.; et al. Histone Methylation Dynamics and Gene Regulation Occur through the Sensing of One-Carbon Metabolism. Cell Metab. 2015, 22, 861–873. [Google Scholar] [CrossRef] [PubMed] [Green Version]
  168. Chen, N.C.; Yang, F.; Capecci, L.M.; Gu, Z.; Schafer, A.I.; Durante, W.; Yang, X.F.; Wang, H. Regulation of homocysteine metabolism and methylation in human and mouse tissues. FASEB J. 2010, 24, 2804–2817. [Google Scholar] [CrossRef] [Green Version]
  169. Wang, L.; Alachkar, A.; Sanathara, N.; Belluzzi, J.D.; Wang, Z.; Civelli, O. A Methionine-Induced Animal Model of Schizophrenia: Face and Predictive Validity. Int. J. Neuropsychopharmacol. 2015, 18, pyv054. [Google Scholar] [CrossRef] [Green Version]
  170. Taylor, M. Dietary modification of amphetamine stereotyped behaviour: The action of tryptophan, methionine, and lysine. Psychopharmacology 1979, 61, 81–83. [Google Scholar] [CrossRef]
  171. Muller, U.J.; Frick, B.; Winkler, C.; Fuchs, D.; Wenning, G.K.; Poewe, W.; Mueller, J. Homocysteine and serum markers of immune activation in primary dystonia. Mov. Disord. 2005, 20, 1663–1667. [Google Scholar] [CrossRef]
  172. Müller, T.; Woitalla, D.; Hunsdiek, A.; Kuhn, W. Elevated plasma levels of homocysteine in dystonia. Acta Neurol. Scand. 2000, 101, 388–390. [Google Scholar] [CrossRef]
  173. Ueland, P.M.; Ulvik, A.; Rios-Avila, L.; Midttun, Ø.; Gregory, J.F. Direct and Functional Biomarkers of Vitamin B6 Status. Annu. Rev. Nutr. 2015, 35, 33–70. [Google Scholar] [CrossRef]
  174. Garcia-Lopez, R.; Perea-Milla, E.; Garcia, C.R.; Rivas-Ruiz, F.; Romero-Gonzalez, J.; Moreno, J.L.; Faus, V.; Aguas Gdel, C.; Diaz, J.C. New therapeutic approach to Tourette Syndrome in children based on a randomized placebo-controlled double-blind phase IV study of the effectiveness and safety of magnesium and vitamin B6. Trials 2009, 10, 16. [Google Scholar] [CrossRef] [Green Version]
  175. García-López, R.; Romero-González, J.; Perea-Milla, E.; Ruiz-García, C.; Rivas-Ruiz, F.; de Las Mulas Béjar, M. An open study evaluating the efficacy and security of magnesium and vitamin B(6) as a treatment of Tourette syndrome in children. Med. Clin. 2008, 131, 689–691. [Google Scholar] [CrossRef]
  176. Mauri, D.N.; Ebner, R.; Montgomery, R.I.; Kochel, K.D.; Cheung, T.C.; Yu, G.L.; Ruben, S.; Murphy, M.; Eisenberg, R.J.; Cohen, G.H.; et al. LIGHT, a new member of the TNF superfamily, and lymphotoxin alpha are ligands for herpesvirus entry mediator. Immunity 1998, 8, 21–30. [Google Scholar] [CrossRef] [Green Version]
  177. Garcia-Delgar, B.; Morer, A.; Luber, M.J.; Coffey, B.J. Obsessive-Compulsive Disorder, Tics, and Autoinflammatory Diseases: Beyond PANDAS. J. Child Adolesc. Psychopharmacol. 2016, 26, 847–850. [Google Scholar] [CrossRef]
  178. Kratz, A.; Campos-Neto, A.; Hanson, M.S.; Ruddle, N.H. Chronic inflammation caused by lymphotoxin is lymphoid neogenesis. J. Exp. Med. 1996, 183, 1461–1472. [Google Scholar] [CrossRef] [Green Version]
  179. Gommerman, J.L.; Browning, J.L. Lymphotoxin/LIGHT, lymphoid microenvironments and autoimmune disease. Nat. Rev. Immunol. 2003, 3, 642–655. [Google Scholar] [CrossRef]
  180. Ying, X.; Chan, K.; Shenoy, P.; Hill, M.; Ruddle, N.H. Lymphotoxin plays a crucial role in the development and function of nasal-associated lymphoid tissue through regulation of chemokines and peripheral node addressin. Am. J. Pathol. 2005, 166, 135–146. [Google Scholar] [CrossRef] [Green Version]
  181. Park, H.S.; Francis, K.P.; Yu, J.; Cleary, P.P. Membranous cells in nasal-associated lymphoid tissue: A portal of entry for the respiratory mucosal pathogen group A streptococcus. J. Immunol. 2003, 171, 2532–2537. [Google Scholar] [CrossRef] [Green Version]
  182. Dileepan, T.; Smith, E.D.; Knowland, D.; Hsu, M.; Platt, M.; Bittner-Eddy, P.; Cohen, B.; Southern, P.; Latimer, E.; Harley, E.; et al. Group A Streptococcus intranasal infection promotes CNS infiltration by streptococcal-specific Th17 cells. J. Clin. Investig. 2016, 126, 303–317. [Google Scholar] [CrossRef] [Green Version]
  183. Hutanu, A.; Reddy, L.N.; Mathew, J.; Avanthika, C.; Jhaveri, S.; Tummala, N. Pediatric Autoimmune Neuropsychiatric Disorders Associated with Group A Streptococci: Etiopathology and Diagnostic Challenges. Cureus 2022, 14, e27729. [Google Scholar] [CrossRef]
  184. Kim, S.W.; Grant, J.E.; Kim, S.I.; Swanson, T.A.; Bernstein, G.A.; Jaszcz, W.B.; Williams, K.A.; Schlievert, P.M. A possible association of recurrent streptococcal infections and acute onset of obsessive-compulsive disorder. J. Neuropsychiatry Clin. Neurosci. 2004, 16, 252–260. [Google Scholar] [CrossRef] [PubMed]
  185. Spaulding, A.R.; Salgado-Pabón, W.; Kohler, P.L.; Horswill, A.R.; Leung, D.Y.; Schlievert, P.M. Staphylococcal and streptococcal superantigen exotoxins. Clin. Microbiol. Rev. 2013, 26, 422–447. [Google Scholar] [CrossRef] [PubMed]
  186. Schlüter, D.; Kwok, L.Y.; Lütjen, S.; Soltek, S.; Hoffmann, S.; Körner, H.; Deckert, M. Both lymphotoxin-alpha and TNF are crucial for control of Toxoplasma gondii in the central nervous system. J. Immunol. 2003, 170, 6172–6182. [Google Scholar] [CrossRef] [PubMed] [Green Version]
  187. Krause, D.; Matz, J.; Weidinger, E.; Wagner, J.; Wildenauer, A.; Obermeier, M.; Riedel, M.; Müller, N. Association between intracellular infectious agents and Tourette’s syndrome. Eur. Arch. Psychiatry Clin. Neurosci. 2010, 260, 359–363. [Google Scholar] [CrossRef] [PubMed]
  188. Akaltun, İ.; Kara, T.; Sertan Kara, S.; Ayaydın, H. Seroprevalance Anti-Toxoplasma gondii antibodies in children and adolescents with tourette syndrome/chronic motor or vocal tic disorder: A case-control study. Psychiatry Res. 2018, 263, 154–157. [Google Scholar] [CrossRef]
  189. Croze, M.L.; Soulage, C.O. Potential role and therapeutic interests of myo-inositol in metabolic diseases. Biochimie 2013, 95, 1811–1827. [Google Scholar] [CrossRef]
  190. Fisher, S.K.; Novak, J.E.; Agranoff, B.W. Inositol and higher inositol phosphates in neural tissues: Homeostasis, metabolism and functional significance. J. Neurochem. 2002, 82, 736–754. [Google Scholar] [CrossRef] [Green Version]
  191. Devito, T.J.; Drost, D.J.; Pavlosky, W.; Neufeld, R.W.J.; Rajakumar, N.; McKinlay, B.D.; Williamson, P.C.; Nicolson, R.O.B. Brain Magnetic Resonance Spectroscopy in Tourette’s Disorder. J. Am. Acad. Child Adolesc. Psychiatry 2005, 44, 1301–1308. [Google Scholar] [CrossRef]
  192. Cryns, K.; Shamir, A.; Van Acker, N.; Levi, I.; Daneels, G.; Goris, I.; Bouwknecht, J.A.; Andries, L.; Kass, S.; Agam, G.; et al. IMPA1 is essential for embryonic development and lithiu.um-like pilocarpine sensitivity. Neuropsychopharmacology 2008, 33, 674–684. [Google Scholar] [CrossRef] [Green Version]
  193. Lauritzen, L.; Hansen, H.S.; Jørgensen, M.H.; Michaelsen, K.F. The essentiality of long chain n-3 fatty acids in relation to development and function of the brain and retina. Prog. Lipid Res. 2001, 40, 1–94. [Google Scholar] [CrossRef]
  194. Carta, G.; Murru, E.; Banni, S.; Manca, C. Palmitic Acid: Physiological Role, Metabolism and Nutritional Implications. Front. Physiol. 2017, 8, 902. [Google Scholar] [CrossRef] [Green Version]
  195. Nishizaki, T.; Nomura, T.; Matsuoka, T.; Tsujishita, Y. Arachidonic acid as a messenger for the expression of long-term potentiation. Biochem. Biophys. Res. Commun. 1999, 254, 446–449. [Google Scholar] [CrossRef]
  196. Wang, B.; Wu, L.; Chen, J.; Dong, L.; Chen, C.; Wen, Z.; Hu, J.; Fleming, I.; Wang, D.W. Metabolism pathways of arachidonic acids: Mechanisms and potential therapeutic targets. Signal Transduct. Target. Ther. 2021, 6, 94. [Google Scholar] [CrossRef] [PubMed]
  197. Zhu, J.; Li, L.; Ding, J.; Huang, J.; Shao, A.; Tang, B. The Role of Formyl Peptide Receptors in Neurological Diseases via Regulating Inflammation. Front. Cell. Neurosci. 2021, 15, 753832. [Google Scholar] [CrossRef]
  198. Pamplona, F.A.; Ferreira, J.; Menezes de Lima, O., Jr.; Duarte, F.S.; Bento, A.F.; Forner, S.; Villarinho, J.G.; Bellocchio, L.; Wotjak, C.T.; Lerner, R.; et al. Anti-inflammatory lipoxin A4 is an endogenous allosteric enhancer of CB1 cannabinoid receptor. Proc. Natl. Acad. Sci. USA 2012, 109, 21134–21139. [Google Scholar] [CrossRef] [Green Version]
  199. Lands, W.E.; Libelt, B.; Morris, A.; Kramer, N.C.; Prewitt, T.E.; Bowen, P.; Schmeisser, D.; Davidson, M.H.; Burns, J.H. Maintenance of lower proportions of (n-6) eicosanoid precursors in phospholipids of human plasma in response to added dietary (n-3) fatty acids. Biochim. Biophys. Acta 1992, 1180, 147–162. [Google Scholar] [CrossRef]
  200. Rudkowska, I.; Paradis, A.M.; Thifault, E.; Julien, P.; Tchernof, A.; Couture, P.; Lemieux, S.; Barbier, O.; Vohl, M.C. Transcriptomic and metabolomic signatures of an n-3 polyunsaturated fatty acids supplementation in a normolipidemic/normocholesterolemic Caucasian population. J. Nutr. Biochem. 2013, 24, 54–61. [Google Scholar] [CrossRef]
  201. Gabbay, V.; Babb, J.S.; Klein, R.G.; Panzer, A.M.; Katz, Y.; Alonso, C.M.; Petkova, E.; Wang, J.; Coffey, B.J. A double-blind, placebo-controlled trial of ω-3 fatty acids in Tourette’s disorder. Pediatrics 2012, 129, e1493–e1500. [Google Scholar] [CrossRef]
  202. Louis, P.; Flint, H.J. Diversity, metabolism and microbial ecology of butyrate-producing bacteria from the human large intestine. FEMS Microbiol. Lett. 2009, 294, 1–8. [Google Scholar] [CrossRef] [Green Version]
  203. Louis, P.; Flint, H.J. Formation of propionate and butyrate by the human colonic microbiota. Environ. Microbiol. 2017, 19, 29–41. [Google Scholar] [CrossRef] [Green Version]
  204. Flint, H.J.; Scott, K.P.; Duncan, S.H.; Louis, P.; Forano, E. Microbial degradation of complex carbohydrates in the gut. Gut Microbes 2012, 3, 289–306. [Google Scholar] [CrossRef] [PubMed] [Green Version]
  205. Wang, Y.; Xu, H.; Jing, M.; Hu, X.; Wang, J.; Hua, Y. Gut Microbiome Composition Abnormalities Determined Using High-Throughput Sequencing in Children with Tic Disorder. Front. Pediatr. 2022, 10, 831944. [Google Scholar] [CrossRef] [PubMed]
  206. Ni, J.-J.; Xu, Q.; Yan, S.-S.; Han, B.-X.; Zhang, H.; Wei, X.-T.; Feng, G.-J.; Zhao, M.; Pei, Y.-F.; Zhang, L. Gut Microbiota and Psychiatric Disorders: A Two-Sample Mendelian Randomization Study. Front. Microbiol. 2021, 12, 737197. [Google Scholar] [CrossRef] [PubMed]
  207. Zhao, H.; Shi, Y.; Luo, X.; Peng, L.; Yang, Y.; Zou, L. The Effect of Fecal Microbiota Transplantation on a Child with Tourette Syndrome. Case Rep. Med. 2017, 2017, 6165239. [Google Scholar] [CrossRef] [PubMed] [Green Version]
  208. Vijay, N.; Morris, M.E. Role of monocarboxylate transporters in drug delivery to the brain. Curr. Pharm. Des. 2014, 20, 1487–1498. [Google Scholar] [CrossRef] [Green Version]
  209. Huuskonen, J.; Suuronen, T.; Nuutinen, T.; Kyrylenko, S.; Salminen, A. Regulation of microglial inflammatory response by sodium butyrate and short-chain fatty acids. Br. J. Pharm. 2004, 141, 874–880. [Google Scholar] [CrossRef] [Green Version]
  210. Candido, E.P.M.; Reeves, R.; Davie, J.R. Sodium butyrate inhibits histone deacetylation in cultured cells. Cell 1978, 14, 105–113. [Google Scholar] [CrossRef]
  211. Zhang, J.; Zhong, Q. Histone deacetylase inhibitors and cell death. Cell. Mol. Life Sci. 2014, 71, 3885–3901. [Google Scholar] [CrossRef]
  212. Wang, A.; Si, H.; Liu, D.; Jiang, H. Butyrate activates the cAMP-protein kinase A-cAMP response element-binding protein signaling pathway in Caco-2 cells. J. Nutr. 2012, 142, 1–6. [Google Scholar] [CrossRef] [Green Version]
  213. Vijay, A.; Kouraki, A.; Gohir, S.; Turnbull, J.; Kelly, A.; Chapman, V.; Barrett, D.A.; Bulsiewicz, W.J.; Valdes, A.M. The anti-inflammatory effect of bacterial short chain fatty acids is partially mediated by endocannabinoids. Gut Microbes 2021, 13, 1997559. [Google Scholar] [CrossRef]
  214. Rose, S.; Bennuri, S.C.; Davis, J.E.; Wynne, R.; Slattery, J.C.; Tippett, M.; Delhey, L.; Melnyk, S.; Kahler, S.G.; MacFabe, D.F.; et al. Butyrate enhances mitochondrial function during oxidative stress in cell lines from boys with autism. Transl. Psychiatry 2018, 8, 42. [Google Scholar] [CrossRef] [Green Version]
  215. Kratsman, N.; Getselter, D.; Elliott, E. Sodium butyrate attenuates social behavior deficits and modifies the transcription of inhibitory/excitatory genes in the frontal cortex of an autism model. Neuropharmacology 2016, 102, 136–145. [Google Scholar] [CrossRef]
  216. Beal, M.F.; Ferrante, R.J. Experimental therapeutics in transgenic mouse models of Huntington’s disease. Nat. Rev. Neurosci. 2004, 5, 373–384. [Google Scholar] [CrossRef]
  217. Naia, L.; Cunha-Oliveira, T.; Rodrigues, J.; Rosenstock, T.R.; Oliveira, A.; Ribeiro, M.; Carmo, C.; Oliveira-Sousa, S.I.; Duarte, A.I.; Hayden, M.R.; et al. Histone Deacetylase Inhibitors Protect Against Pyruvate Dehydrogenase Dysfunction in Huntington’s Disease. J. Neurosci. 2017, 37, 2776–2794. [Google Scholar] [CrossRef] [Green Version]
  218. St Laurent, R.; O’Brien, L.M.; Ahmad, S.T. Sodium butyrate improves locomotor impairment and early mortality in a rotenone-induced Drosophila model of Parkinson’s disease. Neuroscience 2013, 246, 382–390. [Google Scholar] [CrossRef] [Green Version]
  219. Langley, B.; Gensert, J.M.; Beal, M.F.; Ratan, R.R. Remodeling chromatin and stress resistance in the central nervous system: Histone deacetylase inhibitors as novel and broadly effective neuroprotective agents. Curr. Drug Targets CNS Neurol. Disord. 2005, 4, 41–50. [Google Scholar] [CrossRef]
  220. Sharma, S.; Taliyan, R.; Singh, S. Beneficial effects of sodium butyrate in 6-OHDA induced neurotoxicity and behavioral abnormalities: Modulation of histone deacetylase activity. Behav. Brain Res. 2015, 291, 306–314. [Google Scholar] [CrossRef]
  221. Fischer, A.; Sananbenesi, F.; Wang, X.; Dobbin, M.; Tsai, L.H. Recovery of learning and memory is associated with chromatin remodelling. Nature 2007, 447, 178–182. [Google Scholar] [CrossRef]
  222. Watson, H.; Mitra, S.; Croden, F.C.; Taylor, M.; Wood, H.M.; Perry, S.L.; Spencer, J.A.; Quirke, P.; Toogood, G.J.; Lawton, C.L.; et al. A randomised trial of the effect of omega-3 polyunsaturated fatty acid supplements on the human intestinal microbiota. Gut 2018, 67, 1974–1983. [Google Scholar] [CrossRef]
  223. Li, H.; Dong, J.; Cai, M.; Xu, Z.; Cheng, X.D.; Qin, J.J. Protein degradation technology: A strategic paradigm shift in drug discovery. J. Hematol. Oncol. 2021, 14, 138. [Google Scholar] [CrossRef]
  224. Jarome, T.J.; Helmstetter, F.J. The ubiquitin-proteasome system as a critical regulator of synaptic plasticity and long-term memory formation. Neurobiol. Learn. Mem. 2013, 105, 107–116. [Google Scholar] [CrossRef] [PubMed] [Green Version]
  225. Whartenby, K.A.; Small, D.; Calabresi, P.A. FLT3 inhibitors for the treatment of autoimmune disease. Expert Opin. Investig. Drugs 2008, 17, 1685–1692. [Google Scholar] [CrossRef] [PubMed]
  226. Liao, C.; Vuokila, V.; Catoire, H.; Akçimen, F.; Ross, J.P.; Bourassa, C.V.; Dion, P.A.; Meijer, I.A.; Rouleau, G.A. Transcriptome-wide association study reveals increased neuronal FLT3 expression is associated with Tourette’s syndrome. Commun. Biol. 2022, 5, 289. [Google Scholar] [CrossRef] [PubMed]
  227. Mataix-Cols, D.; Frans, E.; Pérez-Vigil, A.; Kuja-Halkola, R.; Gromark, C.; Isomura, K.; Fernández de la Cruz, L.; Serlachius, E.; Leckman, J.F.; Crowley, J.J.; et al. A total-population multigenerational family clustering study of autoimmune diseases in obsessive-compulsive disorder and Tourette’s/chronic tic disorders. Mol. Psychiatry 2018, 23, 1652–1658. [Google Scholar] [CrossRef] [PubMed]
  228. Fernández de la Cruz, L.; Mataix-Cols, D. General health and mortality in Tourette syndrome and chronic tic disorder: A mini-review. Neurosci. Biobehav. Rev. 2020, 119, 514–520. [Google Scholar] [CrossRef]
  229. Tylee, D.S.; Sun, J.; Hess, J.L.; Tahir, M.A.; Sharma, E.; Malik, R.; Worrall, B.B.; Levine, A.J.; Martinson, J.J.; Nejentsev, S.; et al. Genetic correlations among psychiatric and immune-related phenotypes based on genome-wide association data. Am. J. Med. Genet. B Neuropsychiatr. Genet. 2018, 177, 641–657. [Google Scholar] [CrossRef]
  230. Tang, X.; Drotar, J.; Li, K.; Clairmont, C.D.; Brumm, A.S.; Sullins, A.J.; Wu, H.; Liu, X.S.; Wang, J.; Gray, N.S.; et al. Pharmacological enhancement of <i>KCC2</i> gene expression exerts therapeutic effects on human Rett syndrome neurons and <i>Mecp2</i> mutant mice. Sci. Transl. Med. 2019, 11, eaau0164. [Google Scholar] [CrossRef]
  231. Rivat, C.; Sar, C.; Mechaly, I.; Leyris, J.P.; Diouloufet, L.; Sonrier, C.; Philipson, Y.; Lucas, O.; Mallié, S.; Jouvenel, A.; et al. Inhibition of neuronal FLT3 receptor tyrosine kinase alleviates peripheral neuropathic pain in mice. Nat. Commun. 2018, 9, 1042. [Google Scholar] [CrossRef] [Green Version]
  232. Bzdega, T.; Crowe, S.L.; Ramadan, E.R.; Sciarretta, K.H.; Olszewski, R.T.; Ojeifo, O.A.; Rafalski, V.A.; Wroblewska, B.; Neale, J.H. The cloning and characterization of a second brain enzyme with NAAG peptidase activity. J. Neurochem. 2004, 89, 627–635. [Google Scholar] [CrossRef]
  233. Ebrahimi-Fakhari, D.; Pearl, P.L. (Eds.) General Principles and a Phenomenology-Based Approach to Movement Disorders and Inherited Metabolic Disorders. In Movement Disorders and Inherited Metabolic Disorders: Recognition, Understanding, Improving Outcomes; Cambridge University Press: Cambridge, UK, 2020; pp. 1–170. [Google Scholar]
  234. Morland, C.; Nordengen, K. N-Acetyl-Aspartyl-Glutamate in Brain Health and Disease. Int. J. Mol. Sci. 2022, 23, 1268. [Google Scholar] [CrossRef]
  235. Kanaan, A.S.; Gerasch, S.; García-García, I.; Lampe, L.; Pampel, A.; Anwander, A.; Near, J.; Möller, H.E.; Müller-Vahl, K. Pathological glutamatergic neurotransmission in Gilles de la Tourette syndrome. Brain 2017, 140, 218–234. [Google Scholar] [CrossRef] [Green Version]
  236. Naaijen, J.; Forde, N.J.; Lythgoe, D.J.; Akkermans, S.E.; Openneer, T.J.; Dietrich, A.; Zwiers, M.P.; Hoekstra, P.J.; Buitelaar, J.K. Fronto-striatal glutamate in children with Tourette’s disorder and attention-deficit/hyperactivity disorder. Neuroimage Clin. 2017, 13, 16–23. [Google Scholar] [CrossRef]
  237. Mahone, E.M.; Puts, N.A.; Edden, R.A.E.; Ryan, M.; Singer, H.S. GABA and glutamate in children with Tourette syndrome: A (1)H MR spectroscopy study at 7T. Psychiatry Res. Neuroimaging 2018, 273, 46–53. [Google Scholar] [CrossRef] [Green Version]
  238. Kang, Y.; Tiziani, S.; Park, G.; Kaul, M.; Paternostro, G. Cellular protection using Flt3 and PI3Kα inhibitors demonstrates multiple mechanisms of oxidative glutamate toxicity. Nat. Commun. 2014, 5, 3672. [Google Scholar] [CrossRef] [Green Version]
  239. Zhong, C.; Zhao, X.; Van, K.C.; Bzdega, T.; Smyth, A.; Zhou, J.; Kozikowski, A.P.; Jiang, J.; O’Connor, W.T.; Berman, R.F.; et al. NAAG peptidase inhibitor increases dialysate NAAG and reduces glutamate, aspartate and GABA levels in the dorsal hippocampus following fluid percussion injury in the rat. J. Neurochem. 2006, 97, 1015–1025. [Google Scholar] [CrossRef]
  240. Olszewski, R.T.; Bukhari, N.; Zhou, J.; Kozikowski, A.P.; Wroblewski, J.T.; Shamimi-Noori, S.; Wroblewska, B.; Bzdega, T.; Vicini, S.; Barton, F.B.; et al. NAAG peptidase inhibition reduces locomotor activity and some stereotypes in the PCP model of schizophrenia via group II mGluR. J. Neurochem. 2004, 89, 876–885. [Google Scholar] [CrossRef]
  241. Olszewski, R.T.; Wegorzewska, M.M.; Monteiro, A.C.; Krolikowski, K.A.; Zhou, J.; Kozikowski, A.P.; Long, K.; Mastropaolo, J.; Deutsch, S.I.; Neale, J.H. Phencyclidine and dizocilpine induced behaviors reduced by N-acetylaspartylglutamate peptidase inhibition via metabotropic glutamate receptors. Biol. Psychiatry 2008, 63, 86–91. [Google Scholar] [CrossRef] [Green Version]
  242. Pawelec, P.; Ziemka-Nalecz, M.; Sypecka, J.; Zalewska, T. The Impact of the CX3CL1/CX3CR1 Axis in Neurological Disorders. Cells 2020, 9, 2277. [Google Scholar] [CrossRef]
  243. Limatola, C.; Ransohoff, R.M. Modulating neurotoxicity through CX3CL1/CX3CR1 signaling. Front. Cell. Neurosci. 2014, 8, 229. [Google Scholar] [CrossRef] [Green Version]
  244. Zhan, Y.; Paolicelli, R.C.; Sforazzini, F.; Weinhard, L.; Bolasco, G.; Pagani, F.; Vyssotski, A.L.; Bifone, A.; Gozzi, A.; Ragozzino, D.; et al. Deficient neuron-microglia signaling results in impaired functional brain connectivity and social behavior. Nat. Neurosci. 2014, 17, 400–406. [Google Scholar] [CrossRef]
  245. Gunner, G.; Cheadle, L.; Johnson, K.M.; Ayata, P.; Badimon, A.; Mondo, E.; Nagy, M.A.; Liu, L.; Bemiller, S.M.; Kim, K.W.; et al. Sensory lesioning induces microglial synapse elimination via ADAM10 and fractalkine signaling. Nat. Neurosci. 2019, 22, 1075–1088. [Google Scholar] [CrossRef] [PubMed]
  246. Garton, K.J.; Gough, P.J.; Blobel, C.P.; Murphy, G.; Greaves, D.R.; Dempsey, P.J.; Raines, E.W. Tumor necrosis factor-alpha-converting enzyme (ADAM17) mediates the cleavage and shedding of fractalkine (CX3CL1). J. Biol. Chem. 2001, 276, 37993–38001. [Google Scholar] [CrossRef] [PubMed]
  247. Hundhausen, C.; Misztela, D.; Berkhout, T.A.; Broadway, N.; Saftig, P.; Reiss, K.; Hartmann, D.; Fahrenholz, F.; Postina, R.; Matthews, V.; et al. The disintegrin-like metalloproteinase ADAM10 is involved in constitutive cleavage of CX3CL1 (fractalkine) and regulates CX3CL1-mediated cell-cell adhesion. Blood 2003, 102, 1186–1195. [Google Scholar] [CrossRef] [PubMed] [Green Version]
  248. Yang, L.; Su, Z.; Wang, Z.; Li, Z.; Shang, Z.; Du, H.; Liu, G.; Qi, D.; Yang, Z.; Xu, Z.; et al. Transcriptional profiling reveals the transcription factor networks regulating the survival of striatal neurons. Cell Death Dis. 2021, 12, 262. [Google Scholar] [CrossRef] [PubMed]
  249. Sheridan, G.K.; Murphy, K.J. Neuron-glia crosstalk in health and disease: Fractalkine and CX3CR1 take centre stage. Open Biol. 2013, 3, 130181. [Google Scholar] [CrossRef] [Green Version]
  250. Shan, S.; Hong-Min, T.; Yi, F.; Jun-Peng, G.; Yue, F.; Yan-Hong, T.; Yun-Ke, Y.; Wen-Wei, L.; Xiang-Yu, W.; Jun, M.; et al. New evidences for fractalkine/CX3CL1 involved in substantia nigral microglial activation and behavioral changes in a rat model of Parkinson’s disease. Neurobiol. Aging 2011, 32, 443–458. [Google Scholar] [CrossRef]
  251. Morganti, J.M.; Nash, K.R.; Grimmig, B.A.; Ranjit, S.; Small, B.; Bickford, P.C.; Gemma, C. The soluble isoform of CX3CL1 is necessary for neuroprotection in a mouse model of Parkinson’s disease. J. Neurosci. 2012, 32, 14592–14601. [Google Scholar] [CrossRef] [Green Version]
  252. Horiuchi, M.; Smith, L.; Maezawa, I.; Jin, L.W. CX(3)CR1 ablation ameliorates motor and respiratory dysfunctions and improves survival of a Rett syndrome mouse model. Brain Behav. Immun. 2017, 60, 106–116. [Google Scholar] [CrossRef] [Green Version]
  253. Wang, J.B.; Johnson, P.S.; Persico, A.M.; Hawkins, A.L.; Griffin, C.A.; Uhl, G.R. Human mu opiate receptor. cDNA and genomic clones, pharmacologic characterization and chromosomal assignment. FEBS Lett. 1994, 338, 217–222. [Google Scholar] [CrossRef] [Green Version]
  254. Law, P.Y.; Wong, Y.H.; Loh, H.H. Molecular mechanisms and regulation of opioid receptor signaling. Annu. Rev. Pharmacol. Toxicol. 2000, 40, 389–430. [Google Scholar] [CrossRef]
  255. Haber, S.N.; Kowall, N.W.; Vonsattel, J.P.; Bird, E.D.; Richardson, E.P., Jr. Gilles de la Tourette’s syndrome. A postmortem neuropathological and immunohistochemical study. J. Neurol. Sci. 1986, 75, 225–241. [Google Scholar] [CrossRef]
  256. Leckman, J.F.; Riddle, M.A.; Berrettini, W.H.; Anderson, G.M.; Hardin, M.; Chappell, P.; Bissette, G.; Nemeroff, C.B.; Goodman, W.K.; Cohen, D.J. Elevated CSF dynorphin A [1–8] in Tourette’s syndrome. Life Sci. 1988, 43, 2015–2023. [Google Scholar] [CrossRef]
  257. Sandyk, R. The effects of naloxone in Tourette’s syndrome. Ann. Neurol. 1985, 18, 367–368. [Google Scholar] [CrossRef]
  258. Sandyk, R. Naloxone withdrawal exacerbates Tourette syndrome. J. Clin. Psychopharmacol. 1986, 6, 58–59. [Google Scholar] [CrossRef]
  259. Sandyk, R. Naloxone abolishes obsessive-compulsive behavior in Tourette’s syndrome. Int. J. Neurosci. 1987, 35, 93–94. [Google Scholar] [CrossRef]
  260. Kurlan, R.; Majumdar, L.; Deeley, C.; Mudholkar, G.S.; Plumb, S.; Como, P.G. A controlled trial of propoxyphene and naltrexone in patients with Tourette’s syndrome. Ann. Neurol. 1991, 30, 19–23. [Google Scholar] [CrossRef]
  261. Emmerson, P.J.; Liu, M.R.; Woods, J.H.; Medzihradsky, F. Binding affinity and selectivity of opioids at mu, delta and kappa receptors in monkey brain membranes. J. Pharmacol. Exp. Ther. 1994, 271, 1630–1637. [Google Scholar]
  262. Chappell, P.B.; Leckman, J.F.; Riddle, M.A.; Anderson, G.M.; Listwack, S.J.; Ort, S.I.; Hardin, M.T.; Scahill, L.D.; Cohen, D.J. Neuroendocrine and behavioral effects of naloxone in Tourette syndrome. Adv. Neurol. 1992, 58, 253–262. [Google Scholar]
  263. Van Wattum, P.J.; Chappell, P.B.; Zelterman, D.; Scahill, L.D.; Leckman, J.F. Patterns of response to acute naloxone infusion in Tourette’s syndrome. Mov. Disord. 2000, 15, 1252–1254. [Google Scholar] [CrossRef]
  264. Meuldijk, R.; Colon, E.J. Methadone treatment of Tourette’s disorder. Am. J. Psychiatry 1992, 149, 139–140. [Google Scholar] [CrossRef]
  265. Sarajlija, M.; Raketic, D.; Nesic, N. Heroin Addiction in Serbian Patients with Tourette Syndrome. J. Psychiatr. Pract. 2018, 24, 424–427. [Google Scholar] [CrossRef] [PubMed]
  266. Sandyk, R.; Bamford, C.R. Opioid modulation of gonadotrophin release in Tourette’s syndrome. Int. J. Neurosci. 1988, 39, 233–234. [Google Scholar] [CrossRef] [PubMed]
  267. Grossman, A.; Moult, P.J.; Cunnah, D.; Besser, M. Different opioid mechanisms are involved in the modulation of ACTH and gonadotrophin release in man. Neuroendocrinology 1986, 42, 357–360. [Google Scholar] [CrossRef] [PubMed]
  268. Uhlen, M.; Fagerberg, L.; Hallstrom, B.M.; Lindskog, C.; Oksvold, P.; Mardinoglu, A.; Sivertsson, A.; Kampf, C.; Sjostedt, E.; Asplund, A.; et al. Proteomics. Tissue-based map of the human proteome. Science 2015, 347, 1260419. [Google Scholar] [CrossRef] [PubMed]
  269. Karagiannidis, I.; Dehning, S.; Sandor, P.; Tarnok, Z.; Rizzo, R.; Wolanczyk, T.; Madruga-Garrido, M.; Hebebrand, J.; Nöthen, M.M.; Lehmkuhl, G.; et al. Support of the histaminergic hypothesis in Tourette syndrome: Association of the histamine decarboxylase gene in a large sample of families. J. Med. Genet. 2013, 50, 760–764. [Google Scholar] [CrossRef] [Green Version]
  270. Alexander, J.; Potamianou, H.; Xing, J.; Deng, L.; Karagiannidis, I.; Tsetsos, F.; Drineas, P.; Tarnok, Z.; Rizzo, R.; Wolanczyk, T.; et al. Targeted Re-Sequencing Approach of Candidate Genes Implicates Rare Potentially Functional Variants in Tourette Syndrome Etiology. Front. Neurosci. 2016, 10, 428. [Google Scholar] [CrossRef]
  271. Cheng, Y.-H.; Zheng, Y.; He, F.; Yang, J.-H.; Li, W.-B.; Wang, M.-L.; Cui, D.-Y.; Chen, Y. Detection of Autoantibodies and Increased Concentrations of Interleukins in Plasma from Patients with Tourette’s Syndrome. J. Mol. Neurosci. 2012, 48, 219–224. [Google Scholar] [CrossRef]
  272. Yeon, S.-M.; Lee, J.H.; Kang, D.; Bae, H.; Lee, K.Y.; Jin, S.; Kim, J.R.; Jung, Y.W.; Park, T.W. A cytokine study of pediatric Tourette’s disorder without obsessive compulsive disorder. Psychiatry Res. 2017, 247, 90–96. [Google Scholar] [CrossRef]
  273. Yoshikawa, T.; Naganuma, F.; Iida, T.; Nakamura, T.; Harada, R.; Mohsen, A.S.; Kasajima, A.; Sasano, H.; Yanai, K. Molecular mechanism of histamine clearance by primary human astrocytes. Glia 2013, 61, 905–916. [Google Scholar] [CrossRef]
  274. Baldan, L.C.; Williams, K.A.; Gallezot, J.D.; Pogorelov, V.; Rapanelli, M.; Crowley, M.; Anderson, G.M.; Loring, E.; Gorczyca, R.; Billingslea, E.; et al. Histidine decarboxylase deficiency causes tourette syndrome: Parallel findings in humans and mice. Neuron 2014, 81, 77–90. [Google Scholar] [CrossRef] [Green Version]
  275. Dai, H.; Zhang, Z.; Zhu, Y.; Shen, Y.; Hu, W.; Huang, Y.; Luo, J.; Timmerman, H.; Leurs, R.; Chen, Z. Histamine protects against NMDA-induced necrosis in cultured cortical neurons through H2 receptor/cyclic AMP/protein kinase A and H3 receptor/GABA release pathways. J. Neurochem. 2006, 96, 1390–1400. [Google Scholar] [CrossRef]
  276. Liao, R.-J.; Jiang, L.; Wang, R.-R.; Zhao, H.-W.; Chen, Y.; Li, Y.; Wang, L.; Jie, L.-Y.; Zhou, Y.-D.; Zhang, X.-N.; et al. Histidine provides long-term neuroprotection after cerebral ischemia through promoting astrocyte migration. Sci. Rep. 2015, 5, 15356. [Google Scholar] [CrossRef] [Green Version]
  277. Ito, C.; Onodera, K.; Watanabe, T.; Sato, M. Effects of histamine agents on methamphetamine-induced stereotyped behavior and behavioral sensitization in rats. Psychopharmacology 1997, 130, 362–367. [Google Scholar] [CrossRef]
  278. Joshi, V.V.; Balsara, J.J.; Jadhav, J.H.; Chandorkar, A.G. Effect of L-histidine and chlorcyclizine on apomorphine-induced climbing behaviour and methamphetamine stereotypy in mice. Eur. J. Pharmacol. 1981, 69, 499–502. [Google Scholar] [CrossRef]
  279. Itoh, Y.; Nishibori, M.; Oishi, R.; Saeki, K. Neuronal histamine inhibits methamphetamine-induced locomotor hyperactivity in mice. Neurosci. Lett. 1984, 48, 305–309. [Google Scholar] [CrossRef]
  280. Clapham, J.; Kilpatrick, G.J. Thioperamide, the selective histamine H3 receptor antagonist, attenuates stimulant-induced locomotor activity in the mouse. Eur J. Pharm. 1994, 259, 107–114. [Google Scholar] [CrossRef]
  281. Kitanaka, J.; Kitanaka, N.; Tatsuta, T.; Morita, Y.; Takemura, M. Blockade of brain histamine metabolism alters methamphetamine-induced expression pattern of stereotypy in mice via histamine H1 receptors. Neuroscience 2007, 147, 765–777. [Google Scholar] [CrossRef]
  282. Kitanaka, J.; Kitanaka, N.; Hall, F.S.; Uhl, G.R.; Tatsuta, T.; Morita, Y.; Tanaka, K.; Nishiyama, N.; Takemura, M. Histamine H3 receptor agonists decrease hypothalamic histamine levels and increase stereotypical biting in mice challenged with methamphetamine. Neurochem. Res. 2011, 36, 1824–1833. [Google Scholar] [CrossRef] [Green Version]
  283. Kitanaka, N.; Hall, F.S.; Kobori, S.; Kushihara, S.; Oyama, H.; Sasaoka, Y.; Takechi, M.; Tanaka, K.I.; Tomita, K.; Igarashi, K.; et al. Metoprine, a histamine N-methyltransferase inhibitor, attenuates methamphetamine-induced hyperlocomotion via activation of histaminergic neurotransmission in mice. Pharmacol. Biochem. Behav. 2021, 209, 173257. [Google Scholar] [CrossRef]
  284. Moro, J.; Tomé, D.; Schmidely, P.; Demersay, T.C.; Azzout-Marniche, D. Histidine: A Systematic Review on Metabolism and Physiological Effects in Human and Different Animal Species. Nutrients 2020, 12, 1414. [Google Scholar] [CrossRef]
  285. Yamakami, J.; Sakurai, E.; Sakurada, T.; Maeda, K.; Hikichi, N. Stereoselective blood-brain barrier transport of histidine in rats. Brain Res. 1998, 812, 105–112. [Google Scholar] [CrossRef] [PubMed]
  286. Paternoster, L.; Tilling, K.; Davey Smith, G. Genetic epidemiology and Mendelian randomization for informing disease therapeutics: Conceptual and methodological challenges. PLoS Genet. 2017, 13, e1006944. [Google Scholar] [CrossRef] [PubMed] [Green Version]
  287. Ferguson, C.; Araújo, D.; Faulk, L.; Gou, Y.; Hamelers, A.; Huang, Z.; Ide-Smith, M.; Levchenko, M.; Marinos, N.; Nambiar, R.; et al. Europe PMC in 2020. Nucleic Acids Res. 2021, 49, D1507–D1514. [Google Scholar] [CrossRef] [PubMed]
  288. Morer, A.; Lázaro, L.; Sabater, L.; Massana, J.; Castro, J.; Graus, F. Antineuronal antibodies in a group of children with obsessive-compulsive disorder and Tourette syndrome. J. Psychiatr. Res. 2008, 42, 64–68. [Google Scholar] [CrossRef] [PubMed]
  289. Dupont, C.; Armant, D.R.; Brenner, C.A. Epigenetics: Definition, mechanisms and clinical perspective. Semin. Reprod. Med. 2009, 27, 351–357. [Google Scholar] [CrossRef] [Green Version]
  290. Sharon, G.; Sampson, T.R.; Geschwind, D.H.; Mazmanian, S.K. The Central Nervous System and the Gut Microbiome. Cell 2016, 167, 915–932. [Google Scholar] [CrossRef] [Green Version]
  291. Bulik-Sullivan, B.K.; Loh, P.R.; Finucane, H.K.; Ripke, S.; Yang, J.; Patterson, N.; Daly, M.J.; Price, A.L.; Neale, B.M. LD Score regression distinguishes confounding from polygenicity in genome-wide association studies. Nat. Genet. 2015, 47, 291–295. [Google Scholar] [CrossRef] [Green Version]
  292. De Leeuw, C.A.; Mooij, J.M.; Heskes, T.; Posthuma, D. MAGMA: Generalized gene-set analysis of GWAS data. PLoS Comput. Biol. 2015, 11, e1004219. [Google Scholar] [CrossRef]
  293. Wang, X.; Tucker, N.R.; Rizki, G.; Mills, R.; Krijger, P.H.; de Wit, E.; Subramanian, V.; Bartell, E.; Nguyen, X.X.; Ye, J.; et al. Discovery and validation of sub-threshold genome-wide association study loci using epigenomic signatures. Elife 2016, 5, e10557. [Google Scholar] [CrossRef] [Green Version]
  294. Hammond, R.K.; Pahl, M.C.; Su, C.; Cousminer, D.L.; Leonard, M.E.; Lu, S.; Doege, C.A.; Wagley, Y.; Hodge, K.M.; Lasconi, C.; et al. Biological constraints on GWAS SNPs at suggestive significance thresholds reveal additional BMI loci. Elife 2021, 10, e62206. [Google Scholar] [CrossRef]
  295. Watanabe, K.; Taskesen, E.; van Bochoven, A.; Posthuma, D. Functional mapping and annotation of genetic associations with FUMA. Nat. Commun. 2017, 8, 1826. [Google Scholar] [CrossRef] [Green Version]
  296. Wang, K.; Li, M.; Hakonarson, H. ANNOVAR: Functional annotation of genetic variants from high-throughput sequencing data. Nucleic Acids Res. 2010, 38, e164. [Google Scholar] [CrossRef]
  297. Kircher, M.; Witten, D.M.; Jain, P.; O’Roak, B.J.; Cooper, G.M.; Shendure, J. A general framework for estimating the relative pathogenicity of human genetic variants. Nat. Genet. 2014, 46, 310–315. [Google Scholar] [CrossRef] [Green Version]
  298. Boyle, A.P.; Hong, E.L.; Hariharan, M.; Cheng, Y.; Schaub, M.A.; Kasowski, M.; Karczewski, K.J.; Park, J.; Hitz, B.C.; Weng, S.; et al. Annotation of functional variation in personal genomes using RegulomeDB. Genome Res. 2012, 22, 1790–1797. [Google Scholar] [CrossRef]
  299. Ernst, J.; Kellis, M. ChromHMM: Automating chromatin-state discovery and characterization. Nat. Methods 2012, 9, 215–216. [Google Scholar] [CrossRef] [Green Version]
  300. Kundaje, A.; Meuleman, W.; Ernst, J.; Bilenky, M.; Yen, A.; Heravi-Moussavi, A.; Kheradpour, P.; Zhang, Z.; Wang, J.; Ziller, M.J.; et al. Integrative analysis of 111 reference human epigenomes. Nature 2015, 518, 317–330. [Google Scholar] [CrossRef] [Green Version]
  301. Kerimov, N.; Hayhurst, J.D.; Peikova, K.; Manning, J.R.; Walter, P.; Kolberg, L.; Samovica, M.; Sakthivel, M.P.; Kuzmin, I.; Trevanion, S.J.; et al. A compendium of uniformly processed human gene expression and splicing quantitative trait loci. Nat. Genet. 2021, 53, 1290–1299. [Google Scholar] [CrossRef]
  302. Jaffe, A.E.; Straub, R.E.; Shin, J.H.; Tao, R.; Gao, Y.; Collado-Torres, L.; Kam-Thong, T.; Xi, H.S.; Quan, J.; Chen, Q.; et al. Developmental and genetic regulation of the human cortex transcriptome illuminate schizophrenia pathogenesis. Nat. Neurosci. 2018, 21, 1117–1125. [Google Scholar] [CrossRef]
  303. Schwartzentruber, J.; Foskolou, S.; Kilpinen, H.; Rodrigues, J.; Alasoo, K.; Knights, A.J.; Patel, M.; Goncalves, A.; Ferreira, R.; Benn, C.L.; et al. Molecular and functional variation in iPSC-derived sensory neurons. Nat. Genet. 2018, 50, 54–61. [Google Scholar] [CrossRef]
  304. Wang, D.; Liu, S.; Warrell, J.; Won, H.; Shi, X.; Navarro, F.C.P.; Clarke, D.; Gu, M.; Emani, P.; Yang, Y.T.; et al. Comprehensive functional genomic resource and integrative model for the human brain. Science 2018, 362, eaat8464. [Google Scholar] [CrossRef] [Green Version]
  305. Ng, B.; White, C.C.; Klein, H.U.; Sieberts, S.K.; McCabe, C.; Patrick, E.; Xu, J.; Yu, L.; Gaiteri, C.; Bennett, D.A.; et al. An xQTL map integrates the genetic architecture of the human brain’s transcriptome and epigenome. Nat. Neurosci. 2017, 20, 1418–1426. [Google Scholar] [CrossRef] [PubMed] [Green Version]
  306. Fromer, M.; Roussos, P.; Sieberts, S.K.; Johnson, J.S.; Kavanagh, D.H.; Perumal, T.M.; Ruderfer, D.M.; Oh, E.C.; Topol, A.; Shah, H.R.; et al. Gene expression elucidates functional impact of polygenic risk for schizophrenia. Nat. Neurosci. 2016, 19, 1442–1453. [Google Scholar] [CrossRef] [PubMed] [Green Version]
  307. Schmitt, A.D.; Hu, M.; Jung, I.; Xu, Z.; Qiu, Y.; Tan, C.L.; Li, Y.; Lin, S.; Lin, Y.; Barr, C.L.; et al. A Compendium of Chromatin Contact Maps Reveals Spatially Active Regions in the Human Genome. Cell Rep. 2016, 17, 2042–2059. [Google Scholar] [CrossRef] [PubMed] [Green Version]
  308. Giusti-Rodríguez, P.; Lu, L.; Yang, Y.; Crowley, C.A.; Liu, X.; Juric, I.; Martin, J.S.; Abnousi, A.; Allred, S.C.; Ancalade, N.; et al. Using three-dimensional regulatory chromatin interactions from adult and fetal cortex to interpret genetic results for psychiatric disorders and cognitive traits. bioRxiv 2019. [Google Scholar] [CrossRef]
  309. Andersson, R.; Gebhard, C.; Miguel-Escalada, I.; Hoof, I.; Bornholdt, J.; Boyd, M.; Chen, Y.; Zhao, X.; Schmidl, C.; Suzuki, T.; et al. An atlas of active enhancers across human cell types and tissues. Nature 2014, 507, 455–461. [Google Scholar] [CrossRef] [Green Version]
  310. Gusev, A.; Ko, A.; Shi, H.; Bhatia, G.; Chung, W.; Penninx, B.W.; Jansen, R.; de Geus, E.J.; Boomsma, D.I.; Wright, F.A.; et al. Integrative approaches for large-scale transcriptome-wide association studies. Nat. Genet. 2016, 48, 245–252. [Google Scholar] [CrossRef] [Green Version]
  311. Barbeira, A.N.; Dickinson, S.P.; Bonazzola, R.; Zheng, J.; Wheeler, H.E.; Torres, J.M.; Torstenson, E.S.; Shah, K.P.; Garcia, T.; Edwards, T.L.; et al. Exploring the phenotypic consequences of tissue specific gene expression variation inferred from GWAS summary statistics. Nat. Commun. 2018, 9, 1825. [Google Scholar] [CrossRef]
  312. Giambartolomei, C.; Vukcevic, D.; Schadt, E.E.; Franke, L.; Hingorani, A.D.; Wallace, C.; Plagnol, V. Bayesian test for colocalisation between pairs of genetic association studies using summary statistics. PLoS Genet. 2014, 10, e1004383. [Google Scholar] [CrossRef] [Green Version]
  313. Gusev, A.; Lawrenson, K.; Lin, X.; Lyra, P.C., Jr.; Kar, S.; Vavra, K.C.; Segato, F.; Fonseca, M.A.S.; Lee, J.M.; Pejovic, T.; et al. A transcriptome-wide association study of high-grade serous epithelial ovarian cancer identifies new susceptibility genes and splice variants. Nat. Genet. 2019, 51, 815–823. [Google Scholar] [CrossRef]
  314. Wainberg, M.; Sinnott-Armstrong, N.; Mancuso, N.; Barbeira, A.N.; Knowles, D.A.; Golan, D.; Ermel, R.; Ruusalepp, A.; Quertermous, T.; Hao, K.; et al. Opportunities and challenges for transcriptome-wide association studies. Nat. Genet. 2019, 51, 592–599. [Google Scholar] [CrossRef]
  315. Euesden, J.; Lewis, C.M.; O’Reilly, P.F. PRSice: Polygenic Risk Score software. Bioinformatics 2015, 31, 1466–1468. [Google Scholar] [CrossRef] [Green Version]
  316. Ng, E.; Lind, P.M.; Lindgren, C.; Ingelsson, E.; Mahajan, A.; Morris, A.; Lind, L. Genome-wide association study of toxic metals and trace elements reveals novel associations. Hum. Mol. Genet. 2015, 24, 4739–4745. [Google Scholar] [CrossRef] [Green Version]
  317. Purcell, S.; Neale, B.; Todd-Brown, K.; Thomas, L.; Ferreira, M.A.; Bender, D.; Maller, J.; Sklar, P.; de Bakker, P.I.; Daly, M.J.; et al. PLINK: A tool set for whole-genome association and population-based linkage analyses. Am. J. Hum. Genet. 2007, 81, 559–575. [Google Scholar] [CrossRef] [Green Version]
  318. Benjamini, Y.; Hochberg, Y. Controlling the False Discovery Rate: A Practical and Powerful Approach to Multiple Testing. J. R. Stat. Soc. Ser. B Methodol. 1995, 57, 289–300. [Google Scholar] [CrossRef]
  319. Nyholt, D.R. SECA: SNP effect concordance analysis using genome-wide association summary results. Bioinformatics 2014, 30, 2086–2088. [Google Scholar] [CrossRef] [Green Version]
  320. Oh, S.; Abdelnabi, J.; Al-Dulaimi, R.; Aggarwal, A.; Ramos, M.; Davis, S.; Riester, M.; Waldron, L. HGNChelper: Identification and correction of invalid gene symbols for human and mouse. F1000Research 2020, 9, 1493. [Google Scholar] [CrossRef]
  321. Waldron, L.; Riester, M. HGNChelper: Identify and Correct Invalid HGNC Human Gene Symbols and MGI Mouse Gene Symbols; R Rackage Version 0.8.1; R Core Team: Vienna, Austria, 2019. [Google Scholar]
  322. Carlson, M. org.Hs.eg.db: Genome Wide Annotation for Human; R Package Version 3.12.0; R Core Team: Vienna, Austria, 2020. [Google Scholar]
  323. Tweedie, S.; Braschi, B.; Gray, K.; Jones, T.E.M.; Seal, R.L.; Yates, B.; Bruford, E.A. Genenames.org: The HGNC and VGNC resources in 2021. Nucleic Acids Res. 2021, 49, D939–D946. [Google Scholar] [CrossRef]
  324. R Core Team. R: A Language and Environment for Statistical Computing; R Foundation for Statistical Computing: Vienna, Austria, 2020. [Google Scholar]
  325. Wishart, D.S.; Guo, A.; Oler, E.; Wang, F.; Anjum, A.; Peters, H.; Dizon, R.; Sayeeda, Z.; Tian, S.; Lee, B.L.; et al. HMDB 5.0: The Human Metabolome Database for 2022. Nucleic Acids Res. 2022, 50, D622–D631. [Google Scholar] [CrossRef]
  326. Kanehisa, M.; Goto, S.; Sato, Y.; Furumichi, M.; Tanabe, M. KEGG for integration and interpretation of large-scale molecular data sets. Nucleic Acids Res. 2012, 40, D109–D114. [Google Scholar] [CrossRef] [Green Version]
  327. UniProt, C. UniProt: The universal protein knowledgebase in 2021. Nucleic Acids Res. 2021, 49, D480–D489. [Google Scholar] [CrossRef]
  328. Lek, M.; Karczewski, K.J.; Minikel, E.V.; Samocha, K.E.; Banks, E.; Fennell, T.; O’Donnell-Luria, A.H.; Ware, J.S.; Hill, A.J.; Cummings, B.B.; et al. Analysis of protein-coding genetic variation in 60,706 humans. Nature 2016, 536, 285–291. [Google Scholar] [CrossRef] [PubMed] [Green Version]
  329. Bartha, I.; di Iulio, J.; Venter, J.C.; Telenti, A. Human gene essentiality. Nat. Rev. Genet. 2018, 19, 51–62. [Google Scholar] [CrossRef] [PubMed]
  330. Petrovski, S.; Wang, Q.; Heinzen, E.L.; Allen, A.S.; Goldstein, D.B. Genic intolerance to functional variation and the interpretation of personal genomes. PLoS Genet. 2013, 9, e1003709. [Google Scholar] [CrossRef]
  331. Rackham, O.J.; Shihab, H.A.; Johnson, M.R.; Petretto, E. EvoTol: A protein-sequence based evolutionary intolerance framework for disease-gene prioritization. Nucleic Acids Res. 2015, 43, e33. [Google Scholar] [CrossRef] [PubMed]
  332. Samocha, K.E.; Robinson, E.B.; Sanders, S.J.; Stevens, C.; Sabo, A.; McGrath, L.M.; Kosmicki, J.A.; Rehnström, K.; Mallick, S.; Kirby, A.; et al. A framework for the interpretation of de novo mutation in human disease. Nat. Genet. 2014, 46, 944–950. [Google Scholar] [CrossRef]
  333. Fadista, J.; Oskolkov, N.; Hansson, O.; Groop, L. LoFtool: A gene intolerance score based on loss-of-function variants in 60,706 individuals. Bioinformatics 2017, 33, 471–474. [Google Scholar] [CrossRef] [Green Version]
  334. Bartha, I.; Rausell, A.; McLaren, P.J.; Mohammadi, P.; Tardaguila, M.; Chaturvedi, N.; Fellay, J.; Telenti, A. The Characteristics of Heterozygous Protein Truncating Variants in the Human Genome. PLoS Comput. Biol. 2015, 11, e1004647. [Google Scholar] [CrossRef]
  335. Cassa, C.A.; Weghorn, D.; Balick, D.J.; Jordan, D.M.; Nusinow, D.; Samocha, K.E.; O’Donnell-Luria, A.; MacArthur, D.G.; Daly, M.J.; Beier, D.R.; et al. Estimating the selective effects of heterozygous protein-truncating variants from human exome data. Nat. Genet. 2017, 49, 806–810. [Google Scholar] [CrossRef] [Green Version]
  336. Wang, T.; Wei, J.J.; Sabatini, D.M.; Lander, E.S. Genetic screens in human cells using the CRISPR-Cas9 system. Science 2014, 343, 80–84. [Google Scholar] [CrossRef] [Green Version]
  337. Blomen, V.A.; Májek, P.; Jae, L.T.; Bigenzahn, J.W.; Nieuwenhuis, J.; Staring, J.; Sacco, R.; van Diemen, F.R.; Olk, N.; Stukalov, A.; et al. Gene essentiality and synthetic lethality in haploid human cells. Science 2015, 350, 1092–1096. [Google Scholar] [CrossRef]
  338. Hart, T.; Chandrashekhar, M.; Aregger, M.; Steinhart, Z.; Brown, K.R.; MacLeod, G.; Mis, M.; Zimmermann, M.; Fradet-Turcotte, A.; Sun, S.; et al. High-Resolution CRISPR Screens Reveal Fitness Genes and Genotype-Specific Cancer Liabilities. Cell 2015, 163, 1515–1526. [Google Scholar] [CrossRef] [Green Version]
  339. Finan, C.; Gaulton, A.; Kruger, F.A.; Lumbers, R.T.; Shah, T.; Engmann, J.; Galver, L.; Kelley, R.; Karlsson, A.; Santos, R.; et al. The druggable genome and support for target identification and validation in drug development. Sci. Transl. Med. 2017, 9, eaag1166. [Google Scholar] [CrossRef]
  340. Wells, A.; Kopp, N.; Xu, X.; O’Brien, D.R.; Yang, W.; Nehorai, A.; Adair-Kirk, T.L.; Kopan, R.; Dougherty, J.D. The anatomical distribution of genetic associations. Nucleic Acids Res. 2015, 43, 10804–10820. [Google Scholar] [CrossRef] [Green Version]
  341. Dougherty, J.D.; Schmidt, E.F.; Nakajima, M.; Heintz, N. Analytical approaches to RNA profiling data for the identification of genes enriched in specific cells. Nucleic Acids Res. 2010, 38, 4218–4230. [Google Scholar] [CrossRef]
  342. Xu, X.; Wells, A.B.; O’Brien, D.R.; Nehorai, A.; Dougherty, J.D. Cell type-specific expression analysis to identify putative cellular mechanisms for neurogenetic disorders. J. Neurosci. 2014, 34, 1420–1431. [Google Scholar] [CrossRef] [Green Version]
  343. Lonsdale, J.; Thomas, J.; Salvatore, M.; Phillips, R.; Lo, E.; Shad, S.; Hasz, R.; Walters, G.; Garcia, F.; Young, N.; et al. The Genotype-Tissue Expression (GTEx) project. Nat. Genet. 2013, 45, 580–585. [Google Scholar] [CrossRef]
  344. Miller, J.A.; Ding, S.L.; Sunkin, S.M.; Smith, K.A.; Ng, L.; Szafer, A.; Ebbert, A.; Riley, Z.L.; Royall, J.J.; Aiona, K.; et al. Transcriptional landscape of the prenatal human brain. Nature 2014, 508, 199–206. [Google Scholar] [CrossRef] [Green Version]
  345. Ingolia, N.T.; Ghaemmaghami, S.; Newman, J.R.; Weissman, J.S. Genome-wide analysis in vivo of translation with nucleotide resolution using ribosome profiling. Science 2009, 324, 218–223. [Google Scholar] [CrossRef] [Green Version]
  346. Klemann, C.; Visser, J.E.; Van Den Bosch, L.; Martens, G.J.M.; Poelmans, G. Integrated molecular landscape of amyotrophic lateral sclerosis provides insights into disease etiology. Brain Pathol. 2018, 28, 203–211. [Google Scholar] [CrossRef]
  347. Türei, D.; Korcsmáros, T.; Saez-Rodriguez, J. OmniPath: Guidelines and gateway for literature-curated signaling pathway resources. Nat. Methods 2016, 13, 966–967. [Google Scholar] [CrossRef]
  348. Luck, K.; Kim, D.K.; Lambourne, L.; Spirohn, K.; Begg, B.E.; Bian, W.; Brignall, R.; Cafarelli, T.; Campos-Laborie, F.J.; Charloteaux, B.; et al. A reference map of the human binary protein interactome. Nature 2020, 580, 402–408. [Google Scholar] [CrossRef] [PubMed]
  349. Das, J.; Yu, H. HINT: High-quality protein interactomes and their applications in understanding human disease. BMC Syst. Biol. 2012, 6, 92. [Google Scholar] [CrossRef] [PubMed] [Green Version]
  350. Kotlyar, M.; Pastrello, C.; Ahmed, Z.; Chee, J.; Varyova, Z.; Jurisica, I. IID 2021: Towards context-specific protein interaction analyses by increased coverage, enhanced annotation and enrichment analysis. Nucleic Acids Res. 2022, 50, D640–D647. [Google Scholar] [CrossRef] [PubMed]
  351. Veres, D.V.; Gyurkó, D.M.; Thaler, B.; Szalay, K.Z.; Fazekas, D.; Korcsmáros, T.; Csermely, P. ComPPI: A cellular compartment-specific database for protein-protein interaction network analysis. Nucleic Acids Res. 2015, 43, D485–D493. [Google Scholar] [CrossRef]
  352. Rachlin, J.; Cohen, D.D.; Cantor, C.; Kasif, S. Biological context networks: A mosaic view of the interactome. Mol. Syst. Biol. 2006, 2, 66. [Google Scholar] [CrossRef] [Green Version]
  353. Rouillard, A.D.; Hurle, M.R.; Agarwal, P. Systematic interrogation of diverse Omic data reveals interpretable, robust, and generalizable transcriptomic features of clinically successful therapeutic targets. PLoS Comput. Biol. 2018, 14, e1006142. [Google Scholar] [CrossRef] [Green Version]
  354. Ryaboshapkina, M.; Hammar, M. Tissue-specific genes as an underutilized resource in drug discovery. Sci. Rep. 2019, 9, 7233. [Google Scholar] [CrossRef]
  355. Plenge, R.M.; Scolnick, E.M.; Altshuler, D. Validating therapeutic targets through human genetics. Nat. Rev. Drug Discov. 2013, 12, 581–594. [Google Scholar] [CrossRef]
  356. Glassberg, E.C.; Gao, Z.; Harpak, A.; Lan, X.; Pritchard, J.K. Evidence for Weak Selective Constraint on Human Gene Expression. Genetics 2019, 211, 757–772. [Google Scholar] [CrossRef]
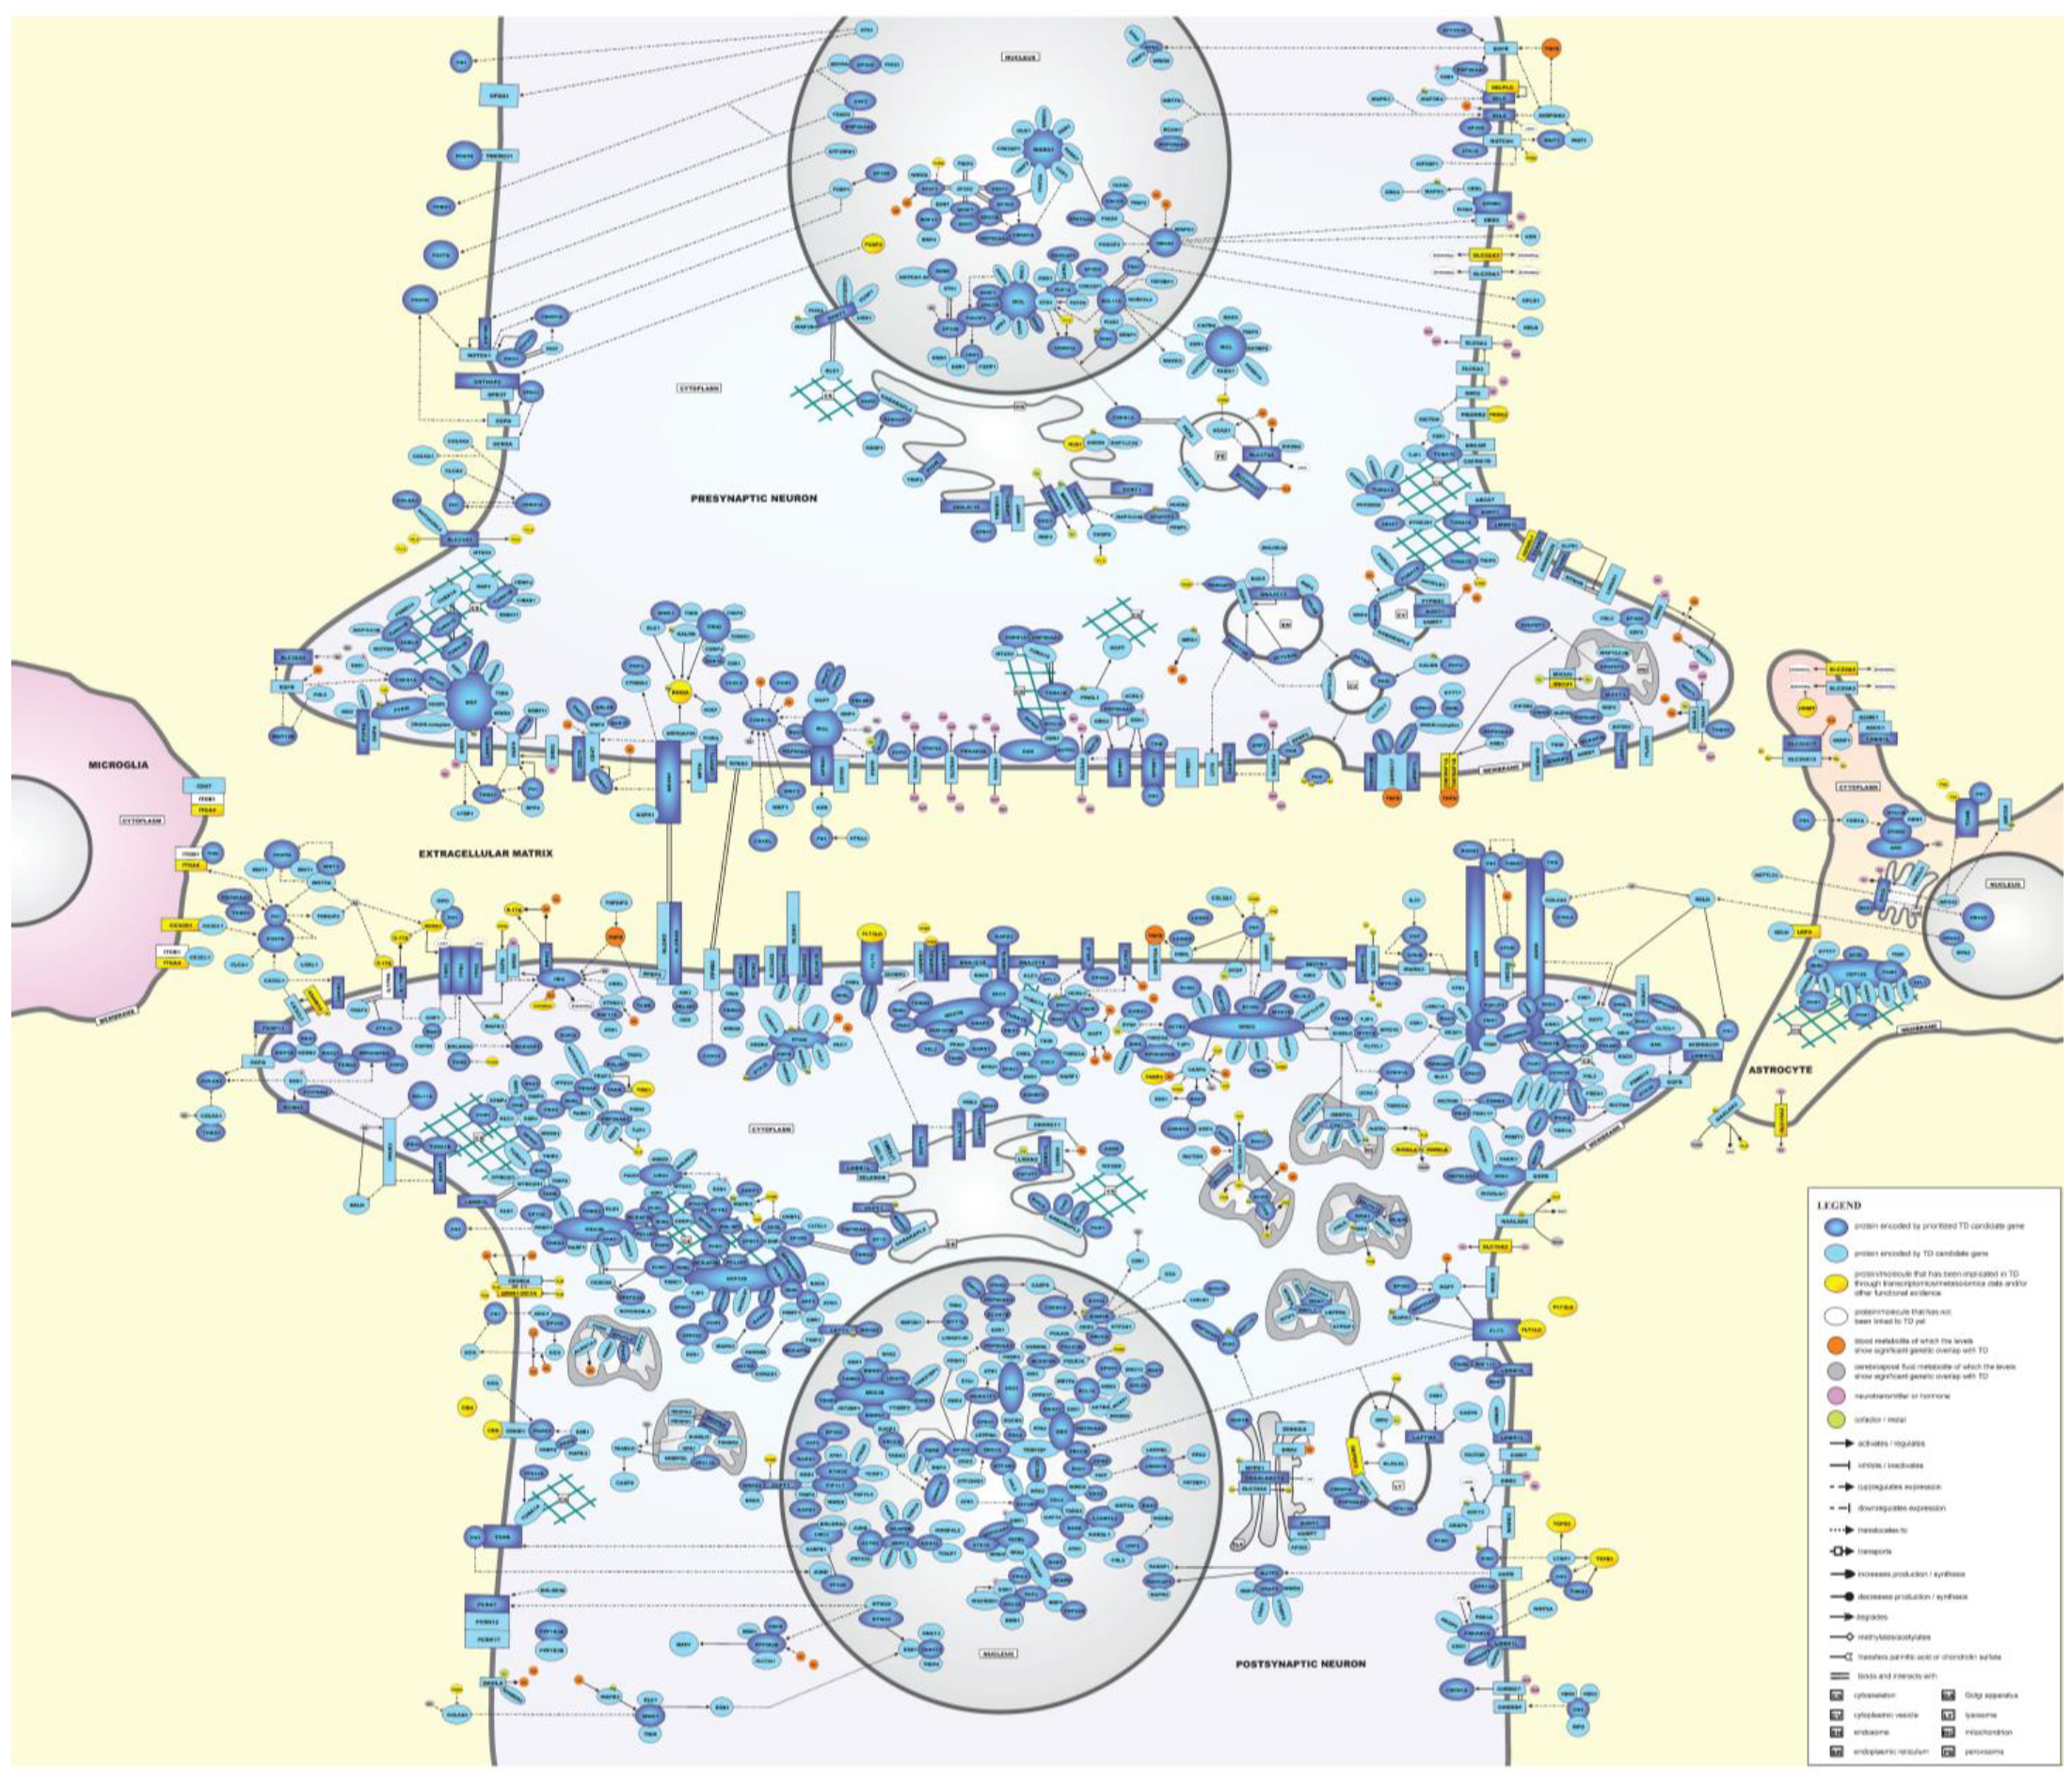
Figure 1. Molecular landscape of TD. In this landscape, the interactions between the key proteins/molecules/metabolites implicated in TD in pre- and postsynaptic neurons, astrocytes and/or microglial cells are shown. In Table S5, all interactions between the landscape proteins/molecules/metabolites are provided. In File S8, we provide a pdf version of Figure 1 that will allow interested readers to look up proteins and molecules in the landscape through using the search function.
Ijms 24 01428 g001
Table 1. Canonical Pathways enriched within the TD candidate genes.
Canonical PathwayFDR p-ValueRatioDataset Genes in the Pathway
cAMP-mediated
signaling
1.95 × 10−222/235ADCY2, AKAP9, CAMK1D, CRHR1, DRD2, DUSP6, FFAR3, FPR1, FPR2, GRK4, HRH2, MAPK3, MPPE1, OPRD1, OPRK1, OPRM1, PALM2AKAP2, PDE4A, PDE6B, PDE9A, PRKAR2A, RGS12
Endocannabinoid Neuronal Synapse Pathway2.19 × 10−216/149ADCY2, CACNA1D, CACNA1I, CACNA1S, CACNA2D3, DAGLA, DNAH1, DNAH10, DNAH3, GNB1L, GRIN2A, MAPK3, PLCH1, PRKAG1, PRKAR2A, RIMS1
Table 2. Biological functions enriched within TD candidate genes.
Molecular and Cellular FunctionsPhysiological System Development and Function
Functional AnnotationFDR p-ValueGenesFunctional AnnotationFDR p-ValueGenes
Cell movement of neurons5.73 × 10−940Cognition8.33 × 10−1272
Development of neurons *2.00 × 10−892Learning4.23 × 10−962
Neuritogenesis *2.03 × 10−848Morphology of nervous system9.54 × 10−9107
Migration of neurons *2.11 × 10−838Development of head1.32 × 10−8108
Development of neural cells *2.90 × 10−895Morphogenesis of nervous tissue1.95 × 10−876
Neurotransmission *7.57 × 10−854Development of body axis2.66 × 10−8112
Organization of cytoplasm2.01 × 10−7148Morphology of brain2.94 × 10−866
Organization of cytoskeleton4.55 × 10−7136Morphology of central nervous system4.82 × 10−870
Microtubule dynamics6.08 × 10−7121Organismal death5.02 × 10−8220
Formation of cellular protrusions9.93 × 10−738Development of central nervous system1.29 × 10−673
Migration of neural cells2.02 × 10−640Formation of brain1.54 × 10−660
Quantity of neurotransmitter5.87 × 10−627Abnormal morphology of brain1.38 × 10−550
Transport of molecule6.29 × 10−6141Spatial learning1.44 × 10−528
Synaptic transmission *2.07 × 10−541Emotional behavior2.01 × 10−538
Cell movement of brain cells3.39 × 10−518Conditioning2.17 × 10−530
Axonogenesis *3.68 × 10−537Abnormal morphology of nervous system2.23 × 10−581
Branching of cells4.59 × 10−575Morphology of head2.26 × 10−5101
Action potential of cells *4.61 × 10−523Morphology of nervous tissue2.44 × 10−572
Proliferation of neural cells *5.92 × 10−570Abnormal morphology of central nervous system2.46 × 10−553
Length of cells6.46 × 10−531Prepulse inhibition2.68 × 10−517
Morphology of neurons *7.13 × 10−538Quantity of neurons3.93 × 10−551
Sprouting1.06 × 10−499Vocalization4.81 × 10−512
Proliferation of neuronal cells *1.11 × 10−456Vertical rearing9.39 × 10−516
Length of neurons *1.83 × 10−447Movement of rodents1.35 × 10−426
Shape change of neurites2.85 × 10−420Social exploration2.34 × 10−412
Abnormal quantity of neurotransmitter3.28 × 10−49Social behavior2.61 × 10−418
Branching of neurons *3.36 × 10−418Exploratory behavior2.65 × 10−416
Length of neurites *3.52 × 10−416Abnormal morphology of body cavity3.43 × 10−4126
Migration of brain cells3.80 × 10−415Nest-building behavior4.37 × 10−48
Branching of neurites *4.15 × 10−465Abnormal morphology of head4.81 × 10−486
Organization of cells5.56 × 10−422Locomotion5.03 × 10−439
Quantity of monoamines5.90 × 10−424Morphology of body cavity6.05 × 10−4139
Quantity of catecholamine5.95 × 10−420Development of body trunk6.47 × 10−4104
Action potential of neurons *7.23 × 10−419Quantity of cells7.26 × 10−4157
Uptake of dopamine8.48 × 10−47Self-abusive behavior7.51 × 10−44
Passive avoidance learning9.72 × 10−49
Table 2 presents the enriched biological functions, the FDR p-value of overlap, and the number of genes involved in each function. * Functional annotations that are shared between the two main functional categories but are reported only once.
Table 3. Results from the PRS-based and SECA analyses for the levels of 37 blood and 2 CSF metabolites that show evidence for genetic sharing with TD at a Bonferroni-corrected p-value < 5 × 10⁻².
MetaboliteSuperpathwayPathwayPTp-ValueR2N SNPsConcordance
p-Value
Concordance with TDGWASN GWASBiofluid
Betaine aAmino acidGlycine, Serine, and Threonine Metabolism0.54.05 × 10−71.34%160,3559.99 × 10−4+Rhee1802P
Indoxyl sulfate aAmino acidTryptophan Metabolism0.57.08 × 10−61.29%160,3509.99 × 10−4-Rhee1455P
HomocitrullineAmino acidUrea cycle; Arginine and Proline Metabolism0.54.41 × 10−60.50%135,3569.99 × 10−4-Shin3950P, S
Valine aAmino acidValine, leucine, and isoleucine metabolism0.44.44 × 10−60.30%130,6259.99 × 10−4+Draaisma6538S
Pyridoxate aCofactors and vitaminsVitamin B6 Metabolism0.054.91 × 10−61.34%25,6429.99 × 10−4-Rhee1453P
Tumor necrosis factor-betaCytokineNA0.33.75 × 10−61.28%148,4619.99 × 10−4+Ahola-Olli1559P, S
Phosphatidylcholine diacyl c38:4LipidGlycerophospholipids0.41.54 × 10−80.41%130,9419.99 × 10−4+Draaisma7474S
Phosphatidylcholine 32:1 aLipidGlycerophospholipids0.52.94 × 10−71.38%160,3559.99 × 10−4-Rhee1797P
Phosphatidylcholine 38:5 aLipidGlycerophospholipids0.53.19 × 10−71.37%160,3559.99 × 10−4+Rhee1797P
1-arachidonoylglycerophosphoethanolamine *LipidGlycerophospholipids0.43.47 × 10−70.33%115,9339.99 × 10−4+Shin7350P, S
1-stearoylglycerophosphoethanolamineLipidGlycerophospholipids0.051.50 × 10−60.31%22,4679.99 × 10−4+Shin6929P, S
Phosphatidylcholine diacyl c38:6LipidGlycerophospholipids0.56.30 × 10−60.25%153,3369.99 × 10−4+Draaisma7475S
1-arachidonoylglycerophosphocholine *LipidGlycerophospholipids0.36.35 × 10−60.27%93,6889.99 × 10−4+Shin7063P, S
Phosphatidylcholine diacyl c36:4LipidGlycerophospholipids0.46.58 × 10−60.25%130,9379.99 × 10−4+Draaisma7476S
Myo-inositolLipidInositol Metabolism0.58.25 × 10−100.49%135,3809.99 × 10−4-Shin7354P, S
Total lipids in very small VLDLLipidLipid ratios0.41.73 × 10−60.11%390,0609.99 × 10−4+Shin2859P, S
Concentration of very small VLDL particlesLipidLipid ratios0.23.27 × 10−60.11%223,3059.99 × 10−4+Kettunen19,273P, S
Phospholipids in very small VLDLLipidLipid ratios0.43.37 × 10−60.11%390,0179.99 × 10−4+Kettunen19,273P, S
Sum SMLipidLipid ratios0.34.21 × 10−61.10%109,7949.99 × 10−4+Rhee1797P
Ratio total PC: total LPCLipidLipid ratios0.35.96 × 10−61.06%109,7949.99 × 10−4-Rhee1797P
Stearate (18:0)LipidLong Chain Fatty Acid0.23.46 × 10−80.39%68,5209.99 × 10−4+Shin7355P, S
X-12442—5,8-tetradecadienoateLipidLong Chain Fatty Acid0.18.00 × 10−70.31%39,5289.99 × 10−4+Shin7334P, S
Palmitate (16:0)LipidLong Chain Fatty Acid0.32.73 × 10−60.28%93,6949.99 × 10−4+Shin7352P, S
Laurate (12:0)LipidMedium Chain Fatty Acid0.13.77 × 10−70.33%39,5309.99 × 10−4+Shin7346P, S
Linoleate (18:2n6) aLipidPolyunsaturated Fatty Acid (n3 and n6)0.24.67 × 10−80.39%68,5189.99 × 10−4+Shin7333P, S
Arachidonate (20:4n6)LipidPolyunsaturated Fatty Acid (n3 and n6)0.51.09 × 10−70.36%135,3839.99 × 10−4+Shin7367P, S
Linolenate [alpha or gamma; (18:3n3 or 6)]LipidPolyunsaturated Fatty Acid (n3 and n6)0.21.38 × 10−60.30%68,5249.99 × 10−4+Shin7338P, S
Dihomo-linoleate (20:2n6)LipidPolyunsaturated Fatty Acid (n3 and n6)0.36.47 × 10−60.26%93,6969.99 × 10−4+Shin7353P, S
Sphingomyelin 18:1 aLipidSphingolipid Metabolism0.43.87 × 10−102.08%136,5969.99 × 10−4+Rhee1797P
Sphingomyelin 18:0 aLipidSphingolipid Metabolism0.34.64 × 10−71.33%109,7949.99 × 10−4+Rhee1797P
Triacylglycerol 50:2LipidTriacylglycerol0.52.52 × 10−61.15%160,3559.99 × 10−4-Rhee1797P
Triacylglycerol 48:0LipidTriacylglycerol0.55.66 × 10−61.07%160,3559.99 × 10−4-Rhee1797P
Triacylglycerol 48:1LipidTriacylglycerol0.57.18 × 10−61.04%160,3559.99 × 10−4-Rhee1797P
X-11381UnknownUnknown0.11.06 × 10−60.31%39,5279.99 × 10−4-Shin7308P, S
X-04494UnknownUnknown0.41.21 × 10−60.47%115,9169.99 × 10−4-Shin4689P, S
X-12116UnknownUnknown0.52.21 × 10−60.73%135,3509.99 × 10−4-Shin2859P, S
X-09706UnknownUnknown0.53.32 × 10−60.28%135,3789.99 × 10−4-Shin7256P, S
N-acetyl-aspartyl-glutamate (NAAG)Amino acidGlutamate Metabolism0.51.80 × 10−89.90%277,6189.99 × 10−4-Panyard291CSF
Butyrate (4:0)LipidShort Chain Fatty Acid0.52.29 × 10−66.97%277,6189.99 × 10−4-Panyard291CSF
Note: Superpathway and pathway annotations are given for metabolites with known chemical identity. Metabolites were classified as ‘Unknown’ if their chemical identity was not yet determined at the time of analysis. Abbreviations: PT—the most predictive SNP p-value threshold in the base sample (TD); R2—the variance explained in the target sample (metabolite levels); N SNPs—the number of SNPs; Concordance p-value—all concordance analyses yielded significant results (i.e., Bonferroni-corrected p-value < 0.05/39 tests = 1.28 × 10⁻³); Concordance with TD—direction of effect estimated in SECA: ‘+’ positive association, ‘-’ negative association; GWAS—source of the target sample phenotypes (metabolite traits) GWAS data—Ahola-Olli [76], Draaisma [77], Kettunen [78], Panyard [79], Rhee [80], Shin [23]; N GWAS—sample size of the target sample phenotypes (metabolite traits); *—indicates metabolites for which identities were inferred based on their fragmentation spectrum and other biochemical evidence; a metabolite was also measured in different datasets, but the results did not pass the Bonferroni-corrected p-value threshold; PC—phosphatidylcholine; LPC—lysophosphatidylcholine; VLDL—very-low-density lipoproteins; SM—sphingomyelin; NA—not available; P—plasma; S—serum; CSF—cerebrospinal fluid.
Disclaimer/Publisher’s Note: The statements, opinions and data contained in all publications are solely those of the individual author(s) and contributor(s) and not of MDPI and/or the editor(s). MDPI and/or the editor(s) disclaim responsibility for any injury to people or property resulting from any ideas, methods, instructions or products referred to in the content.

