Article

Analysis of the Toll and Spaetzle Genes Involved in Toll Pathway-Dependent Antimicrobial Gene Induction in the Red Flour Beetle, Tribolium castaneum (Coleoptera; Tenebrionidae)

1
Applied Entomology Laboratory, Graduate School of Bioagricultural Sciences, Nagoya University, Furo-cho, Chikusa, Nagoya 464-8601, Japan
2
Insect Design Technology Group, Division of Insect Advanced Technology, Institute of Agrobiological Sciences, National Agriculture and Food Research Organization (NARO), 1-2 Owashi, Tsukuba 305-8519, Japan
*
Author to whom correspondence should be addressed.
Int. J. Mol. Sci. 2023, 24(2), 1523; https://doi.org/10.3390/ijms24021523
Submission received: 29 December 2022 / Revised: 10 January 2023 / Accepted: 11 January 2023 / Published: 12 January 2023
(This article belongs to the Special Issue Antimicrobial Peptides and Immunology)

Abstract

:
Insects rely only on their innate immune system to protect themselves from pathogens. Antimicrobial peptide (AMP) production is the main immune reaction in insects. In Drosophila melanogaster, the reaction is regulated mainly by the Toll and immune deficiency (IMD) pathways. Spaetzle proteins, activated by immune signals from upstream components, bind to Toll proteins, thus, activating the Toll pathway, which in turn, induces AMP genes. Previous studies have shown the difference in immune systems related to Toll and IMD pathways between D. melanogaster and Tribolium castaneum. In T. castaneum, nine Toll and seven spaetzle (spz) genes were identified. To extend our understanding of AMP production by T. castaneum, we conducted functional assays of Toll and spaetzle genes related to Toll-pathway-dependent AMP gene expression in T. castaneum under challenge with bacteria or budding yeast. The results revealed that Toll3 and Toll4 double-knockdown and spz7 knockdown strongly and moderately reduced the Toll-pathway-dependent expression of AMP genes, respectively. Moreover, Toll3 and Toll4 double-knockdown pupae more rapidly succumbed to entomopathogenic bacteria than the control pupae, but spz7 knockdown pupae did not. The results suggest that Toll3 and Toll4 play a large role in Toll-pathway-dependent immune reactions, whereas spz7 plays a small part.

1. Introduction

Insects possess only innate immune systems, which are divided into cellular immunity and humoral immunity [1]. One of the main aspects of humoral immunity is antimicrobial peptide (AMP) production. The mechanisms of AMP production at genetic and molecular levels were investigated in Drosophila melanogaster (Diptera; Drosophilidae, Meigan, 1830) as a model insect [2]. The induction of AMP genes by microbial infection is regulated by two signaling pathways, namely, the Toll and immune deficiency (IMD) pathways [3,4]. In D. melanogaster, fungi, or yeasts are recognized by Gram-negative binding protein (GNBP) 3, whereas Gram-positive bacteria are recognized by GNBP1 and peptidoglycan recognition protein (PGRP)-SA. Through this recognition, immune signals are triggered [5,6,7]. After the signals are transduced via the serine protease cascade, spaetzle processing enzyme (SPE), which is located at the end of the serine protease cascade, is activated to cleave pro-spaetzle into activated spaetzle (spz) [8,9]. The cleaved spz binds to Toll proteins (transmembrane receptors) and activates the Toll pathway [10,11]. Consequently, Dorsal or Dif (NF-κB transcription factors), which is located at the end of the Toll pathway, is activated and induces the expression of Toll-pathway-dependent AMP genes (e.g., drosomycin) [12]. Gram-negative bacteria are mainly recognized by PGRP-LC and LE, leading to the activation of the IMD pathway. The immune signals stimulated by this recognition are transduced through intracellular components of the IMD pathway, such as IMD, DREDD, and IAP2. The signals activate Relish, a NF-κB transcription factor located at the end of the IMD pathway, which in turn, induces several AMP genes (e.g., diptericin) [13].
In our previous study, to compare AMP gene induction systems between D. melanogaster and non-Drosophila species, we investigated the AMP gene induction system of the red flour beetle Tribolium castaneum (Coleoptera; Tenebrionidae, Herbst, 1797) using T. castaneum genome data and RNA interference (RNAi), which has good knockdown effect against T. castaneum. Our results revealed that 18 AMPs of T. castaneum were classified into four types according to the gene induction profiles by microbes [14]. Furthermore, whether the four types of AMP were regulated by the Toll or IMD pathway or both were determined using IMD or MyD88 (representative genes of the IMD and Toll pathways, respectively) knockdown pupae. The results showed that the AMPs were classified into IMD-pathway-dependent AMP, Toll-pathway-dependent AMP, AMP dependent of both pathways, or AMP independent of either pathway. Cecropin2 (Cec2) and Cec3 are Toll-dependent AMPs with slow and sustained induction that was moderate or weak compared to IMD-dependent AMPs or AMPs dependent of both IMD and Toll pathways [15]. Furthermore, to elucidate the mechanism of the Toll and IMD pathways in T. castaneum, we determined whether orthologues of Toll and IMD pathway genes were involved in Toll- or IMD-dependent signaling. The results showed that canonical signal transductions via intracellular Toll and IMD pathway components were conserved, and both pathways were activated by both Gram-negative and -positive bacteria and yeast because PGRP-LA was mainly involved in AMP induction by both types of bacteria, which was the most distinctive difference from the AMP production system of D. melanogaster [16,17,18].
The molecular mechanisms of Toll and spz interactions during immune signaling in D. melanogaster are well understood, and they play key roles in Toll-pathway-mediated immune reactions. Toll proteins possess an ectodomain mainly composed of leucine-rich repeats and a cytosolic homology domain called the Toll/IL-1R (TIR) domain, which interacts with adaptor molecules [19,20]. Spz proteins are normally inactivated owing to the masking of the predominantly hydrophobic C-terminal spz region [8,21,22]. When immune signals are transduced, spz proteins are proteolytically cleaved by SPE and activated [9]. The activated C-terminal region of spz formed cystine knot motifs and dimers, which act as ligands of Toll. Complexes of spz and Toll proteins arrange hetero-trimers consisting of MyD88, Tube, and Pelle, which are intracellular components of the Toll pathway, leading to the expression of Toll-pathway-dependent AMPs (e.g., drosomycin) [10,11,23,24]. These involvements of Toll and spz in AMP production were reported in Bombyx mori (Lepidoptera; Bombycidae, Linnaeus, 1758), Tenebrio molitor (Coleoptera; Tenebrionidae, Linnaeus, 1758), and Manduca sexta (Lepidoptera; Sphingidae, Linnaeus, 1763) [25,26,27,28,29].
In T. castaneum, nine Toll-related genes were identified. Four of ten Toll genes form a clade next to D. melanogaster Toll1 (Tl) and are involved in Toll-dependent AMP production. Moreover, seven spz genes were identified in T. castaneum [30].
In the present study, to expand our understanding of the immune system related to the Toll pathway in T. castaneum, we assessed the function of the Toll and spz genes of T. castaneum in AMP production. We first performed sequencing analysis, which is the phylogenetic analysis and sequence aliments (only spz genes). Changes in the gene expression of T. castaneum pupae after microbe challenges were measured. Furthermore, the Toll or spz genes involved in Toll-pathway-dependent AMP production due to microbe challenge were determined using RNAi and quantitative reverse transcript PCR (qRT-PCR). Finally, we tested whether the Toll and spz genes were involved in immune reactions against two entomopathogenic bacteria.

2. Results

2.1. Functional Assay of Toll Genes

2.1.1. Phylogenetic Analysis of Toll Genes

To screen for functional T. castaneum Toll genes, phylogenetic analysis was performed using amino acid sequences of Toll genes in T. castaneum, D. melanogaster, and Aedes aegypti (Diptera: Culicidae, Linnaeus in Hasselquist, 1762). As shown in Figure 1, T. castaneum Toll1−4 (TcToll1−4) formed a clade next to the clade including DmToll1, AaToll1A, and Aa Toll1B, which is consistent with a previous finding [30]. These results suggest that Tc-Toll1−4 is involved in Toll-pathway-dependent AMP production, similar to DmToll1. Therefore, Toll1−4 were selected for further analysis.

2.1.2. Toll Gene Induction by Microbial Challenge

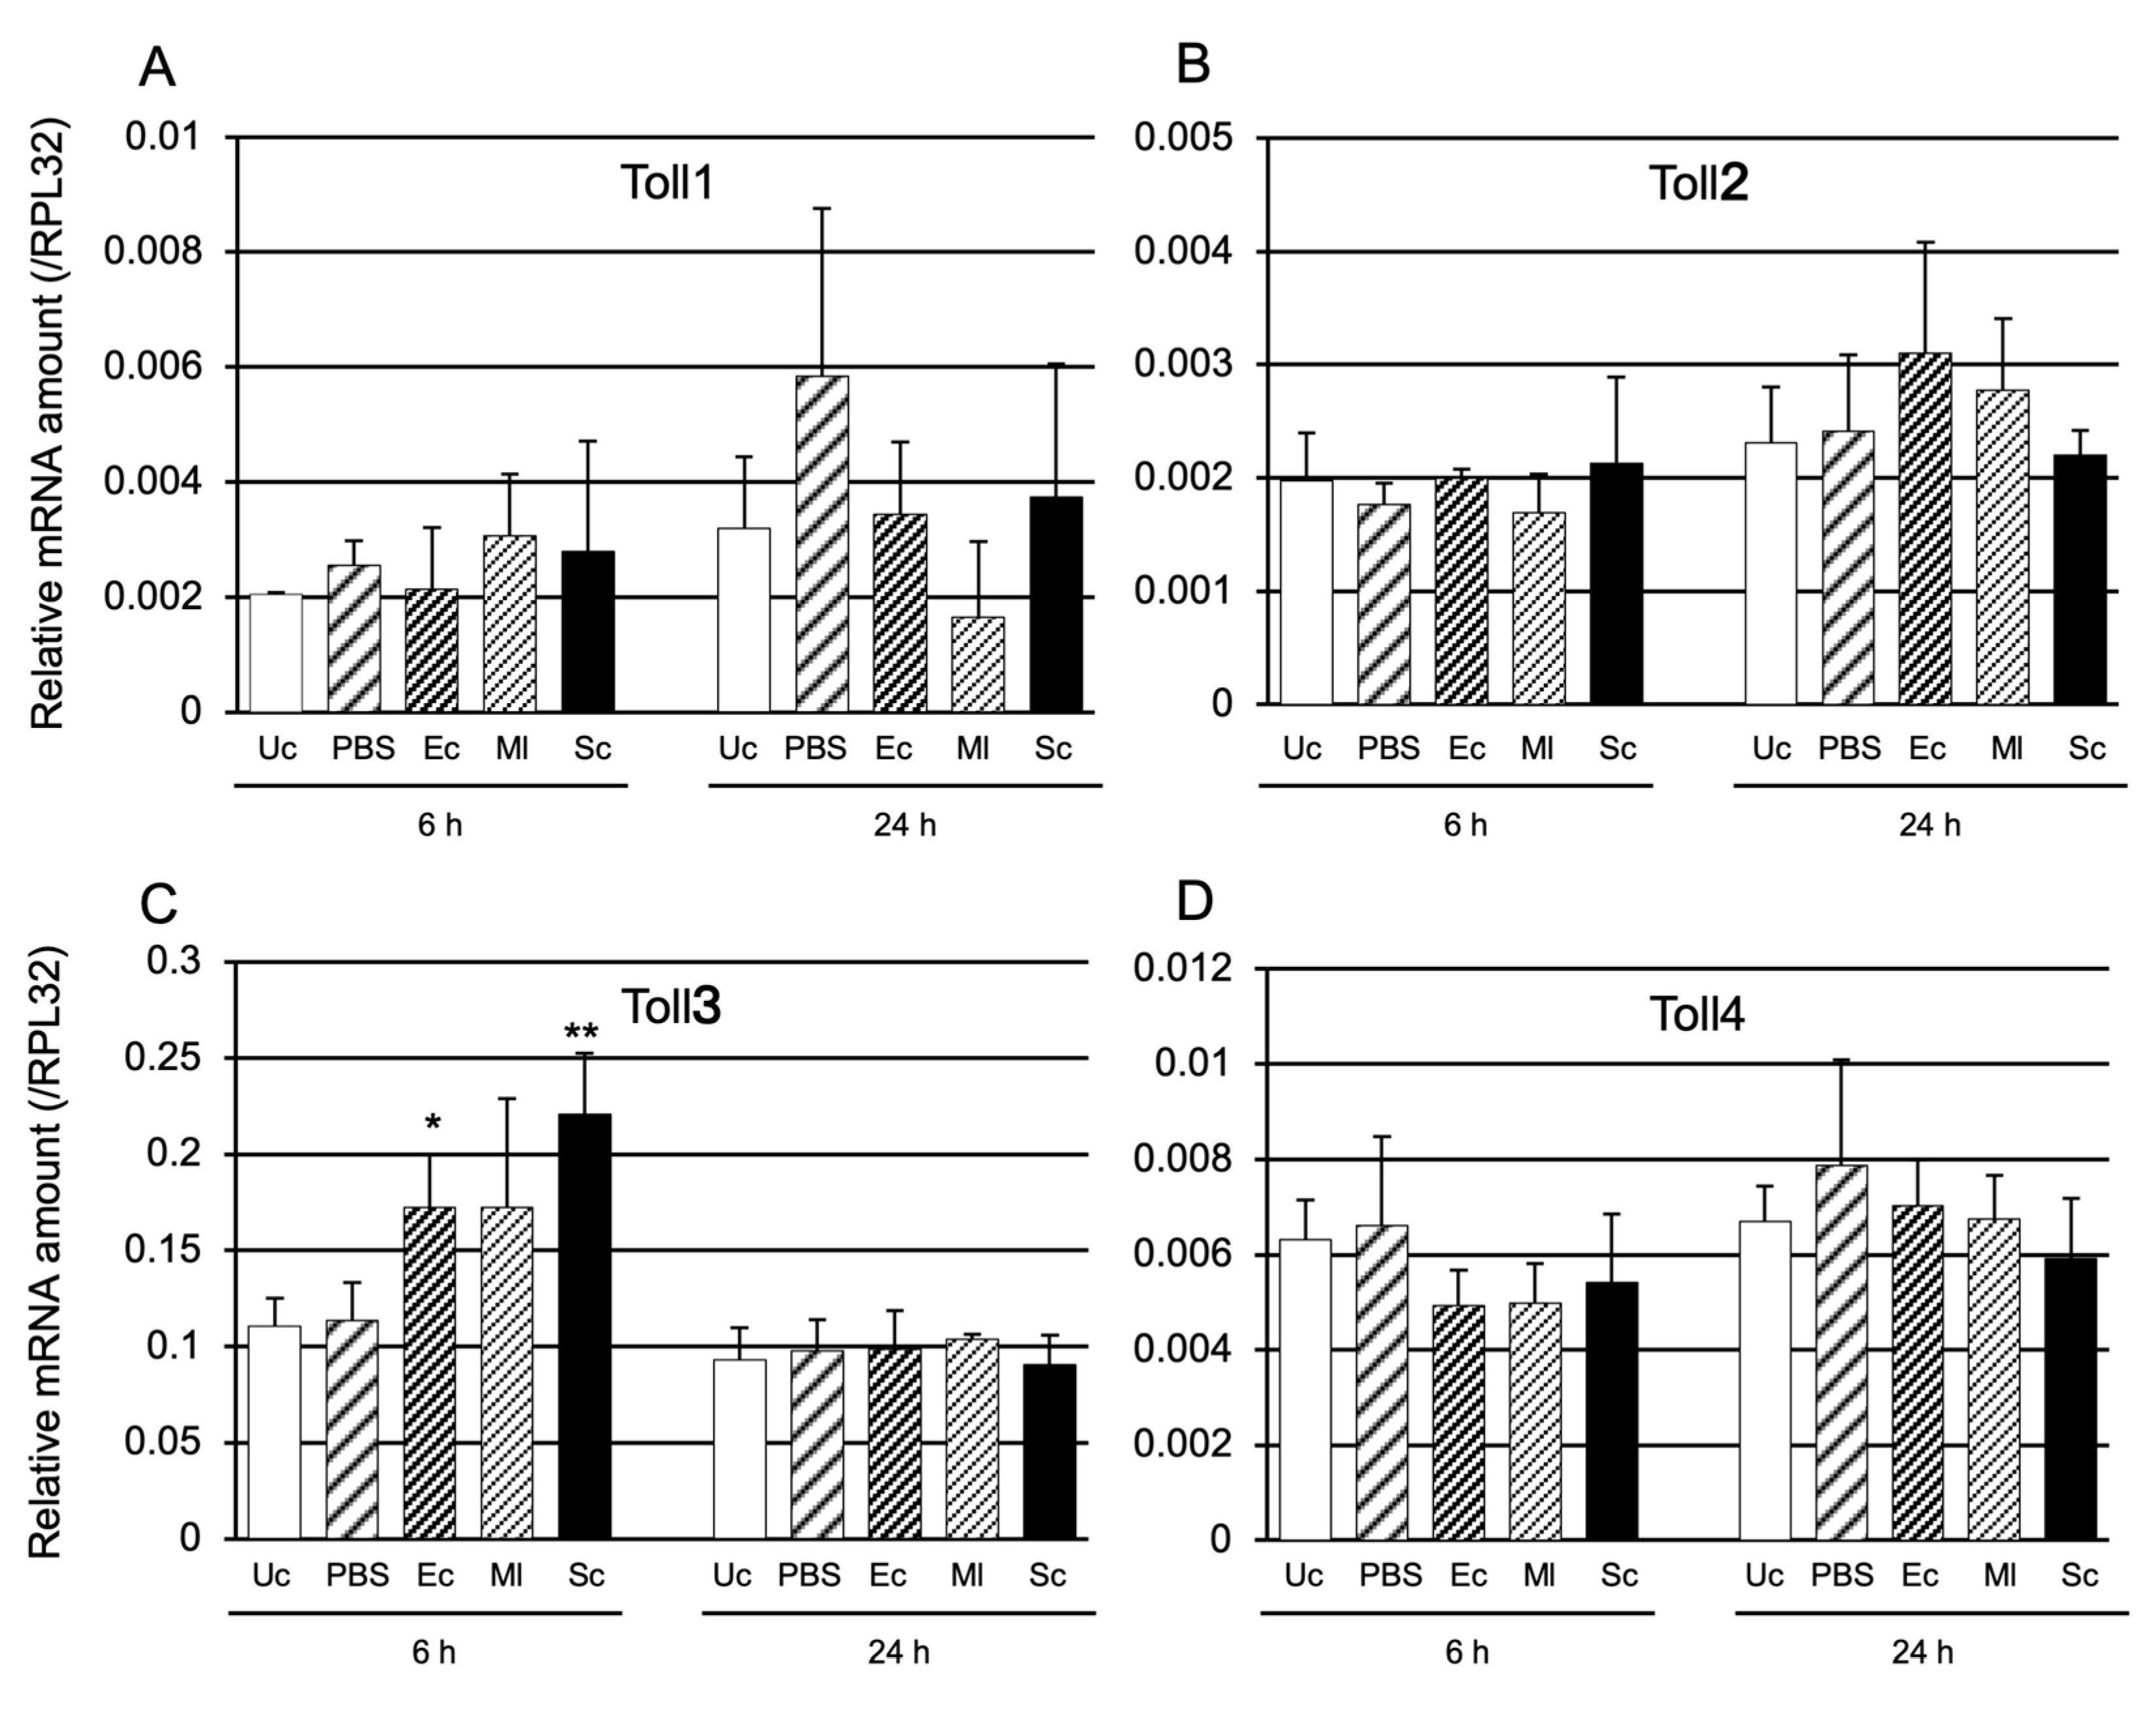
Several immune-related genes, such as AMP genes, are induced by microbial infection. Therefore, we examined whether Toll1−4 genes were induced by heat-killed Escherichia coli (Gram-negative bacteria; Ec), Micrococcus luteus (Gram-negative bacteria; Ml), and Saccharomyces cerevisiae (Eukaryote; Sc) at 6 and 24 h after injection of the microbes (the expression of AMP genes peaked at 6 or 24 h post-injection) (Figure 2). Only Toll3 was significantly induced by Ec and Sc at 6 h post-injection (Figure 2C).

2.1.3. Determination of Whether Toll1−4 Are Involved in Toll-Pathway-Dependent AMP Gene Expression

To determine whether Toll1−4 contribute to Toll-pathway-dependent AMP gene (Cec2 and Cec3) expression, pupae with single or multiple knockdown of Toll1−4 were prepared by RNAi. In the pupae injected with one or two Toll gene double-stranded RNAs (dsRNAs), the Cec2 and Cec3 mRNA levels were significantly lower than those in the control (injected with maltose binding protein E (malE) dsRNA) (Supplemental Figure S1).
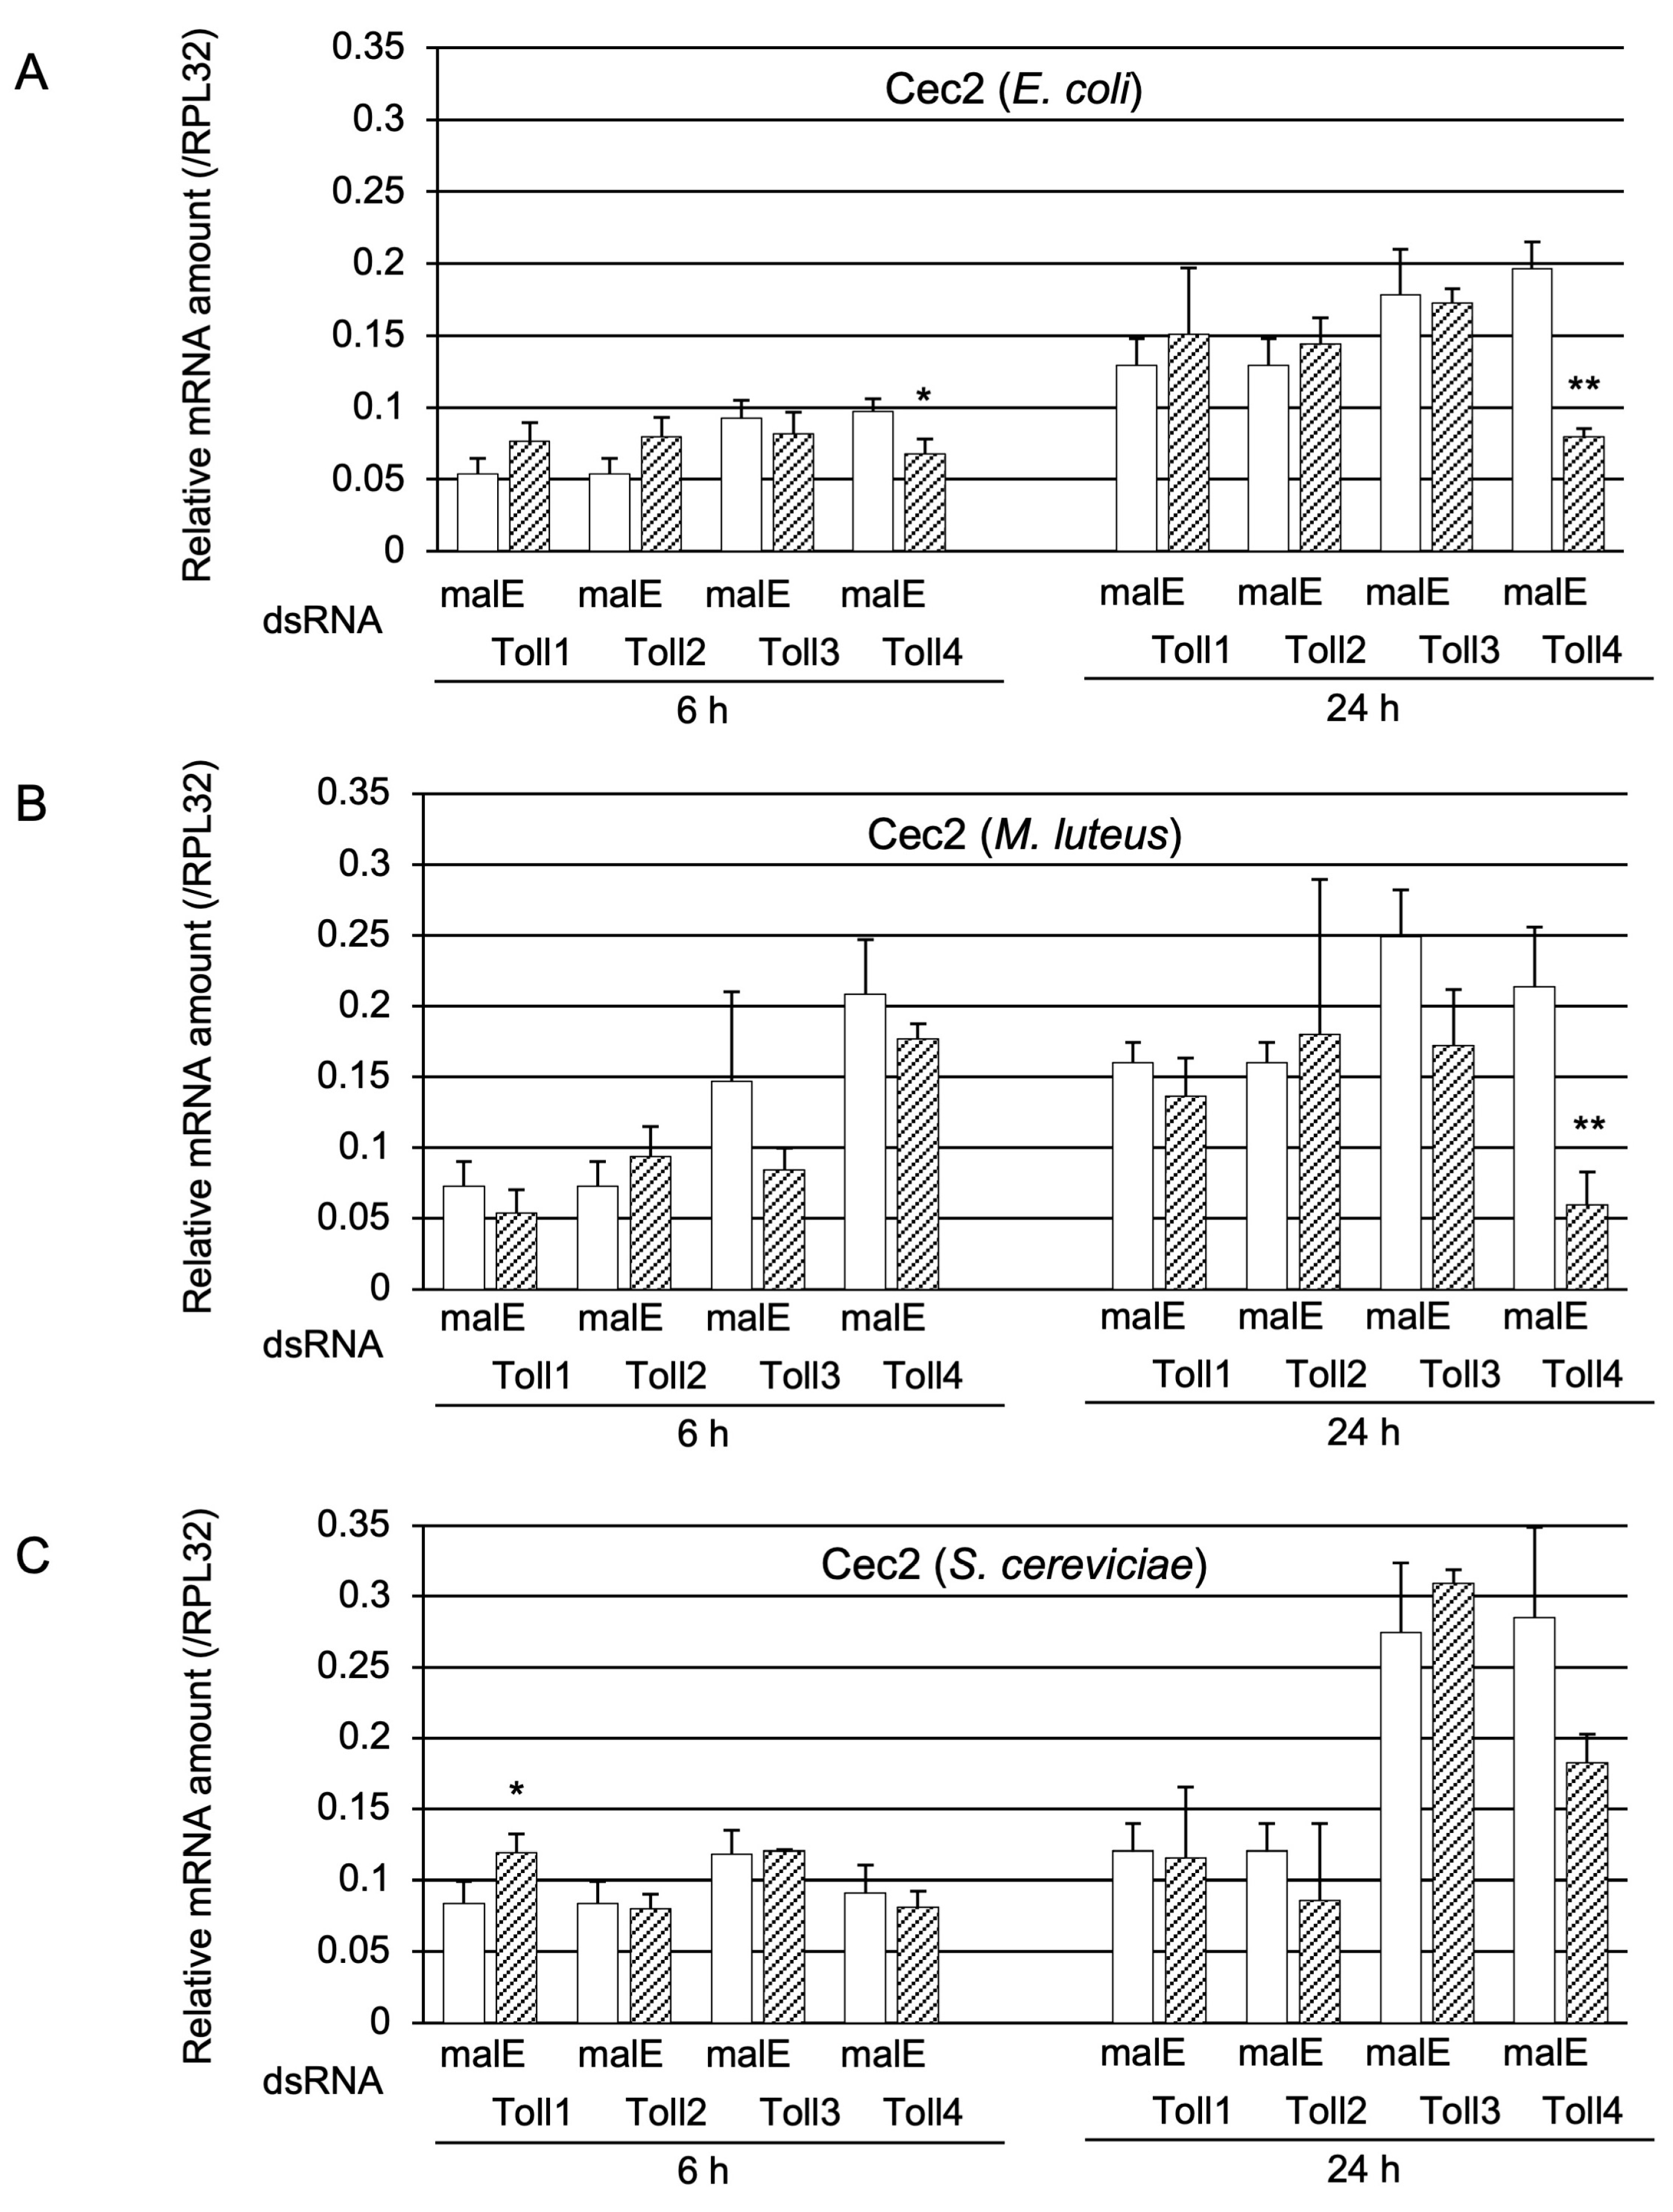
Pupae with Toll1, Toll2, Toll3, or Toll4 knockdown were challenged with either heat-killed Ec, Ml, or Sc to elucidate the role of the four Toll genes in Cec2 induction (Figure 3). Cec2 mRNA levels in Toll4 knockdown pupae at 6 and 24 h post-challenge with Ec were significantly lower than those in the control (malE dsRNA-treated pupae); moreover, the decrease in Cec2 expression in Toll4 knockdown pupae at 24 h post-challenge was greater than that at 6 h post-challenge (Figure 3A). However, the expression levels of Cec2 in other Toll knockdown pupae were not significantly lower than those in the control. After the Ml challenge, Cec2 mRNA levels in Toll4 knockdown pupae at 24 h post-challenge were significantly lower than those in the control, whereas those in the other knockdown pupae or Toll4 knockdown pupae at 6 h post-challenge were not significantly different from those in the control (Figure 3B). After the Sc challenge, Cec2 mRNA levels in either Toll1−4 knockdown pupae at 6 or 24 h post-challenge were not significantly lower than those in the control (Figure 3C).
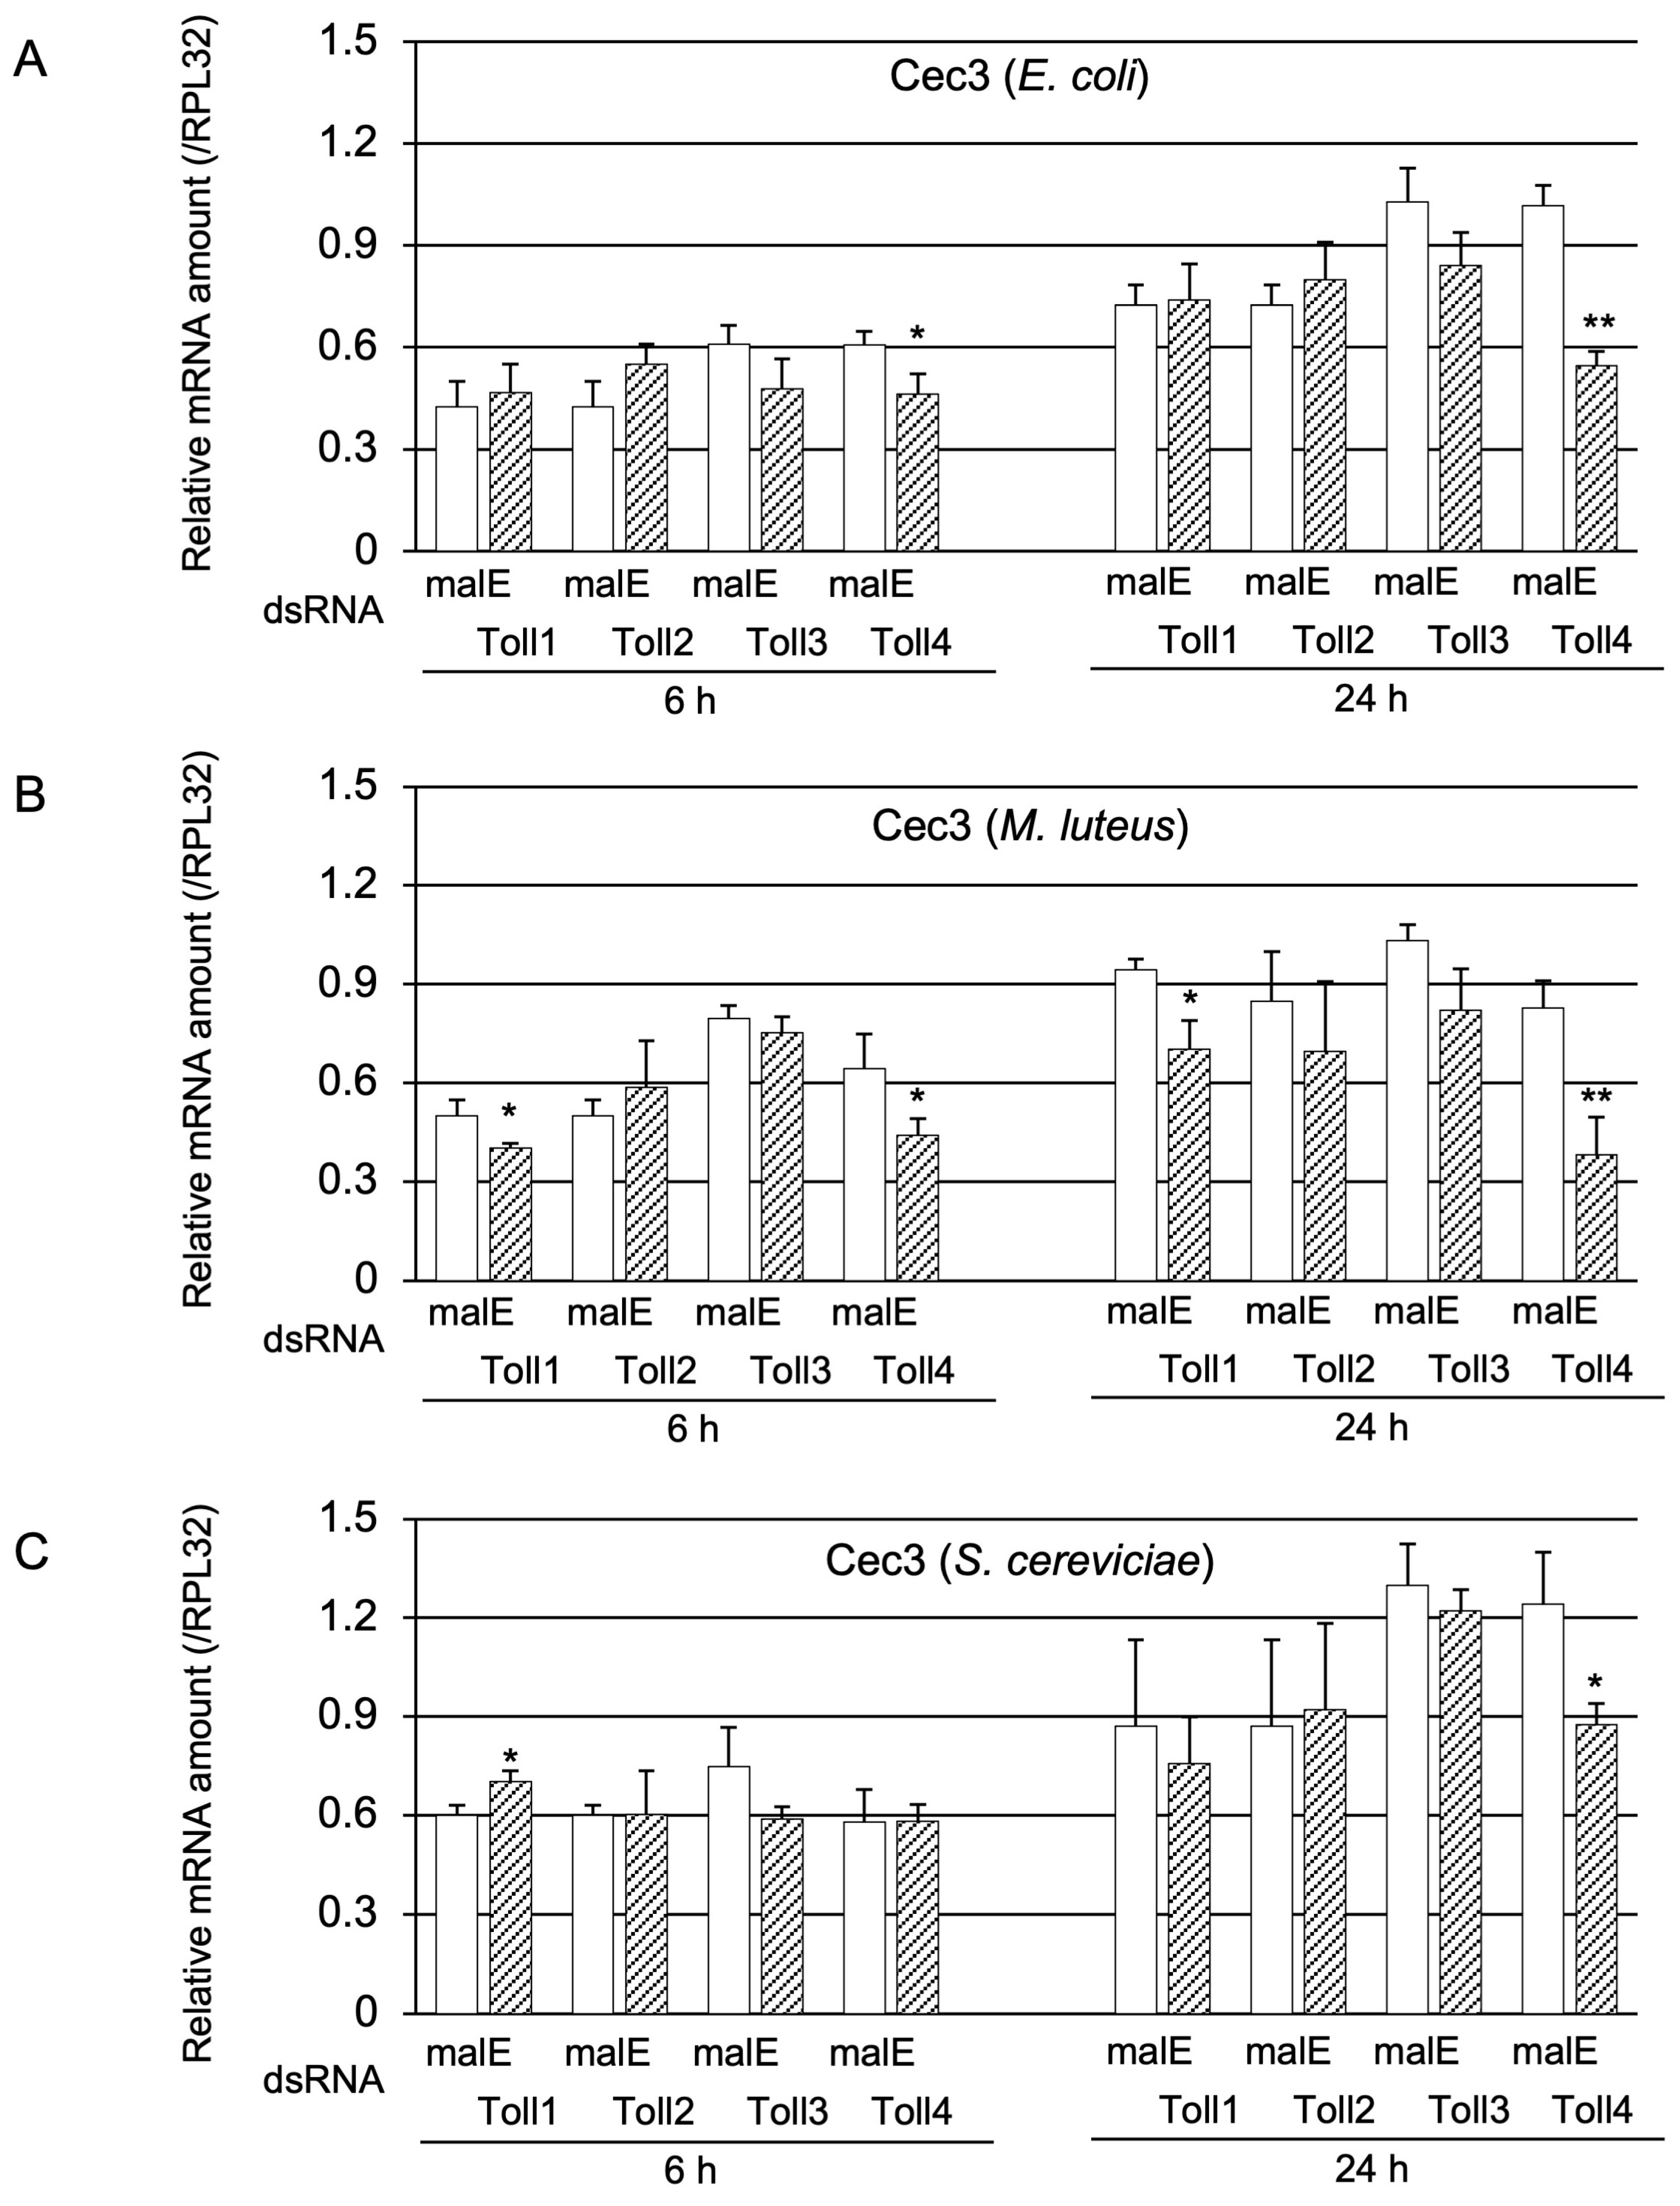
Moreover, the effect of Toll1−4 knockdown on Cec3 induction was investigated (Figure 4). Cec3 mRNA levels in Toll4 knockdown pupae at 6 or 24 h post-challenge with Ec were significantly lower than those in the control, and the decrease in Cec3 expression at 24 h post-challenge was greater than that at 6 h post-challenge, similar to the finding on Cec2 expression (Figure 4A). The induction of Cec3 at 6 and 24 h after Ml challenge was significantly altered by either Toll1 or Toll4 knockdown (Figure 4B); the greatest decrease in Cec3 expression was observed in Toll4 knockdown pupae at 24 h post-challenge. After the Sc challenge, a significant reduction in Cec3 expression was observed in Toll4 knockdown pupae at 24 h post-challenge (Figure 4C). These results suggest that Toll4 is involved in Toll-dependent AMP gene expression at 24 h post-challenge with Ec or Ml.
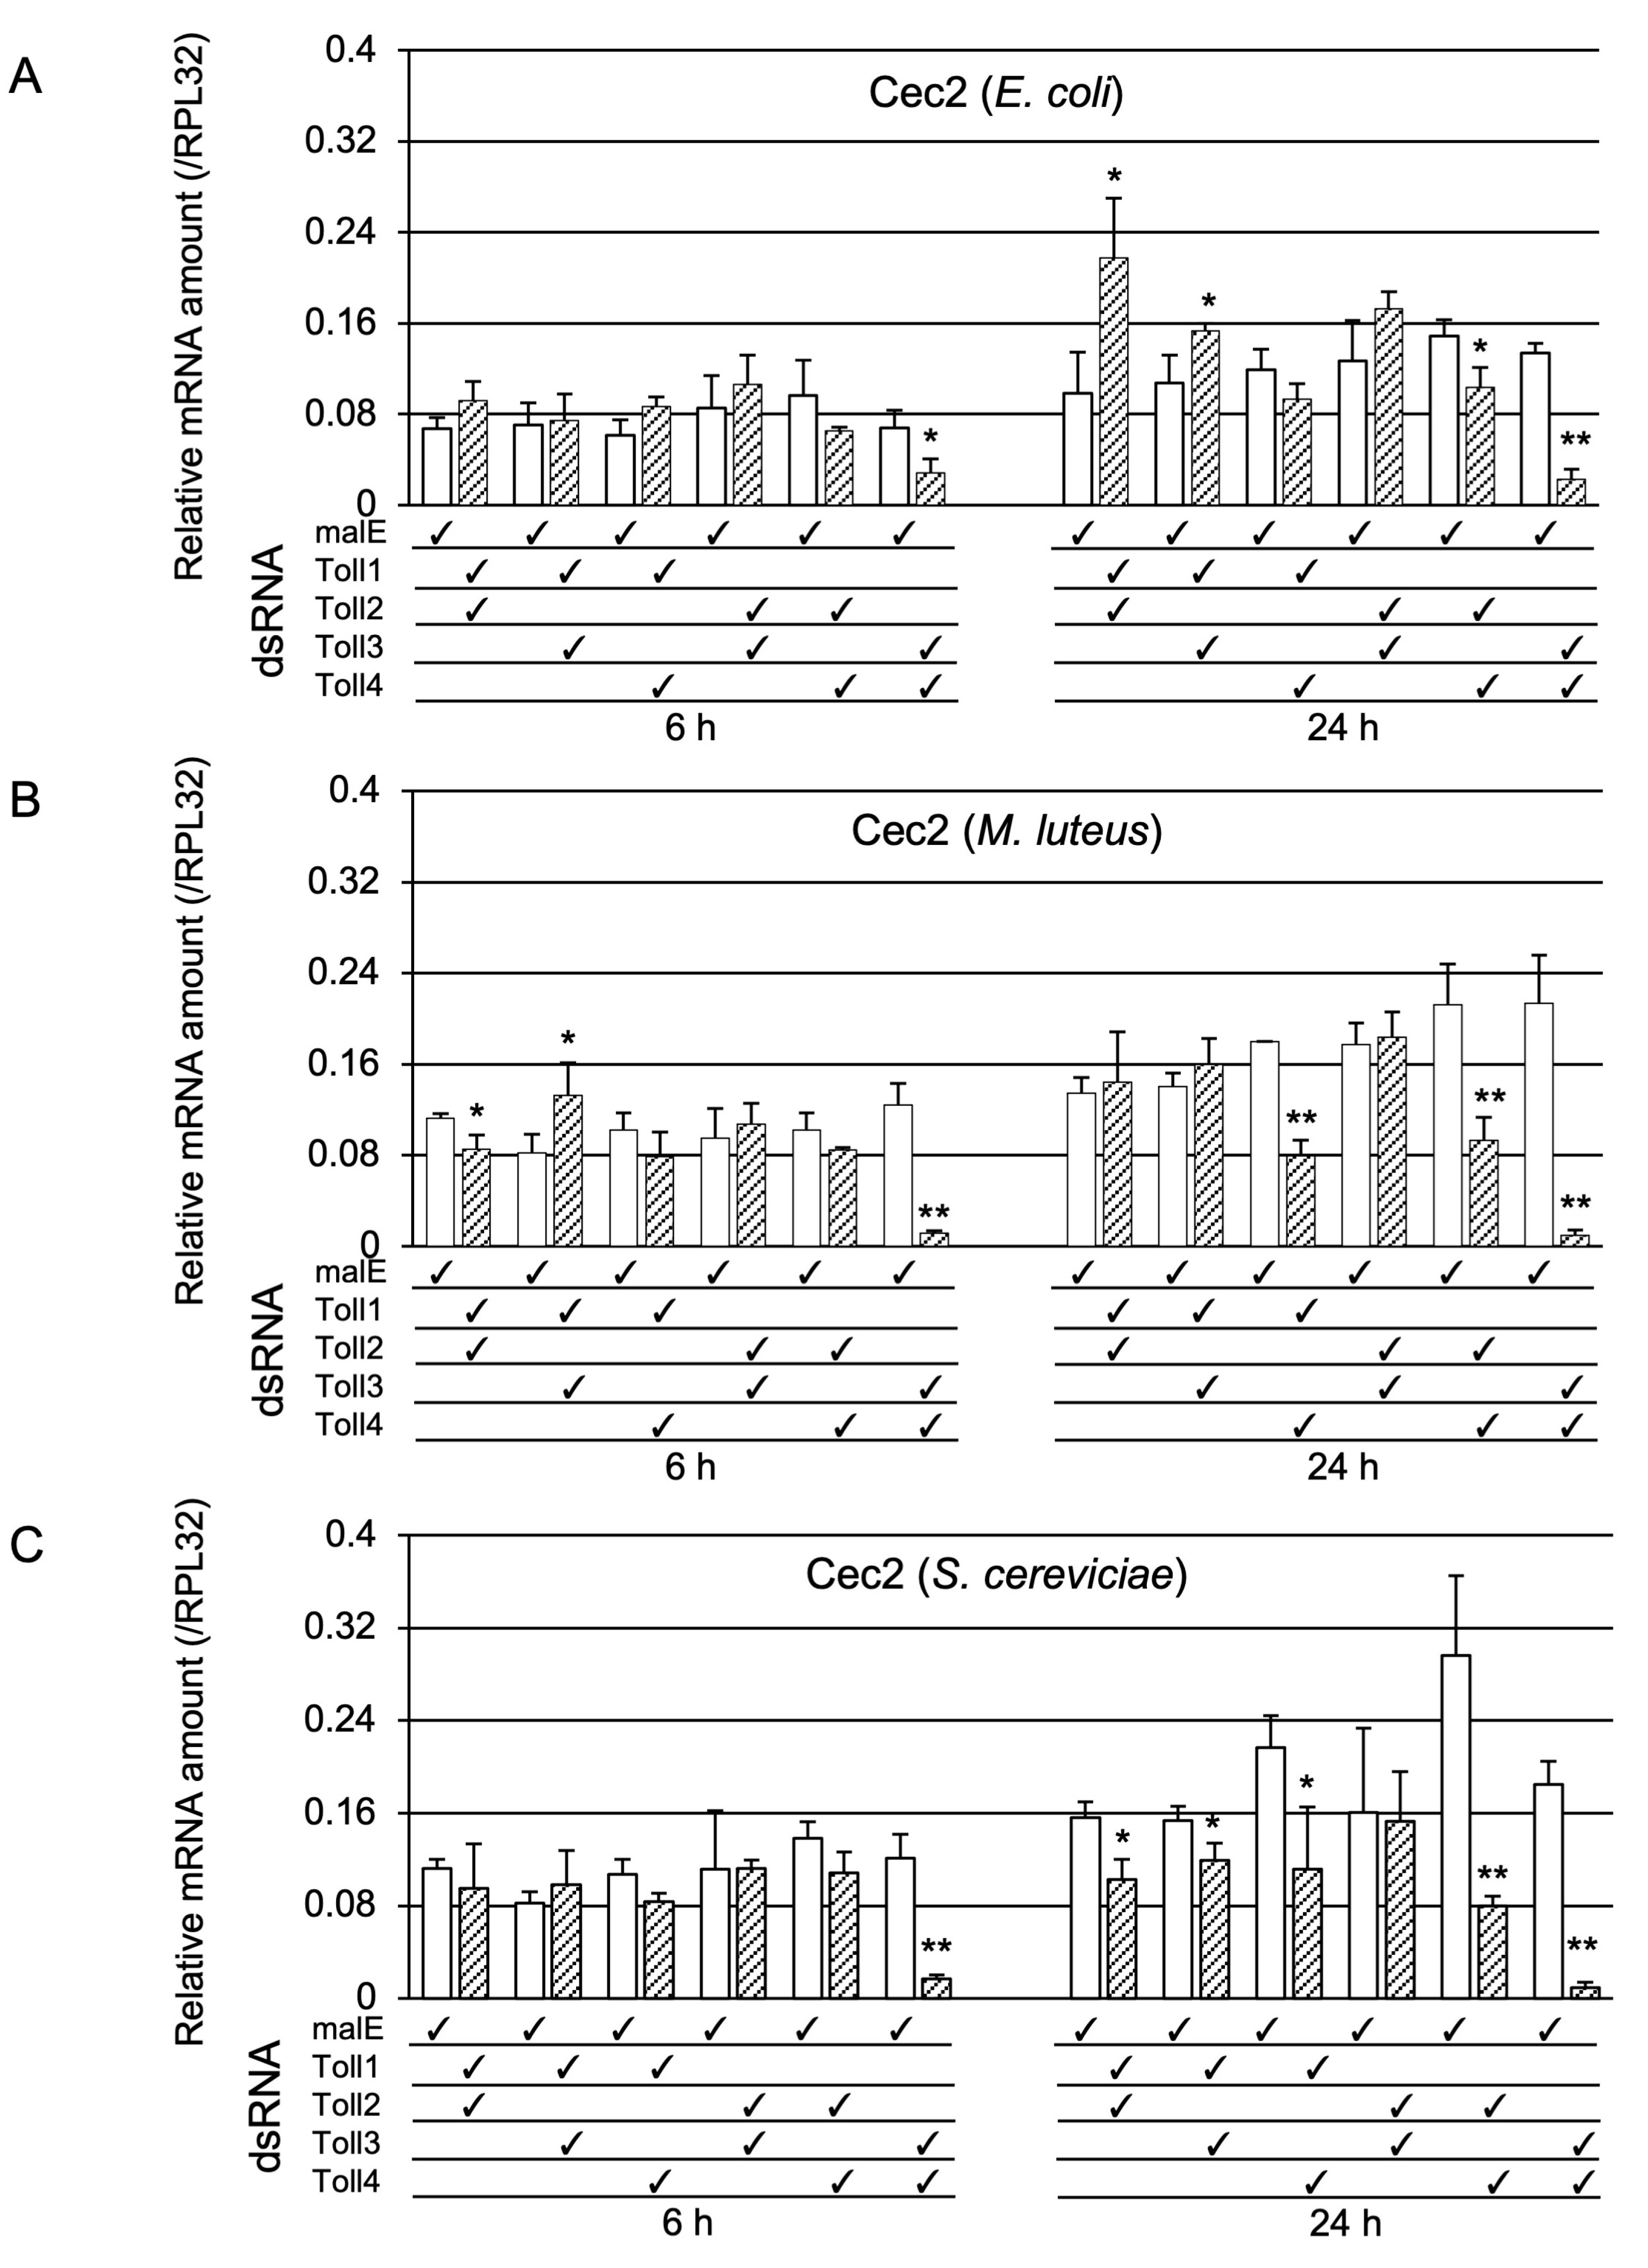
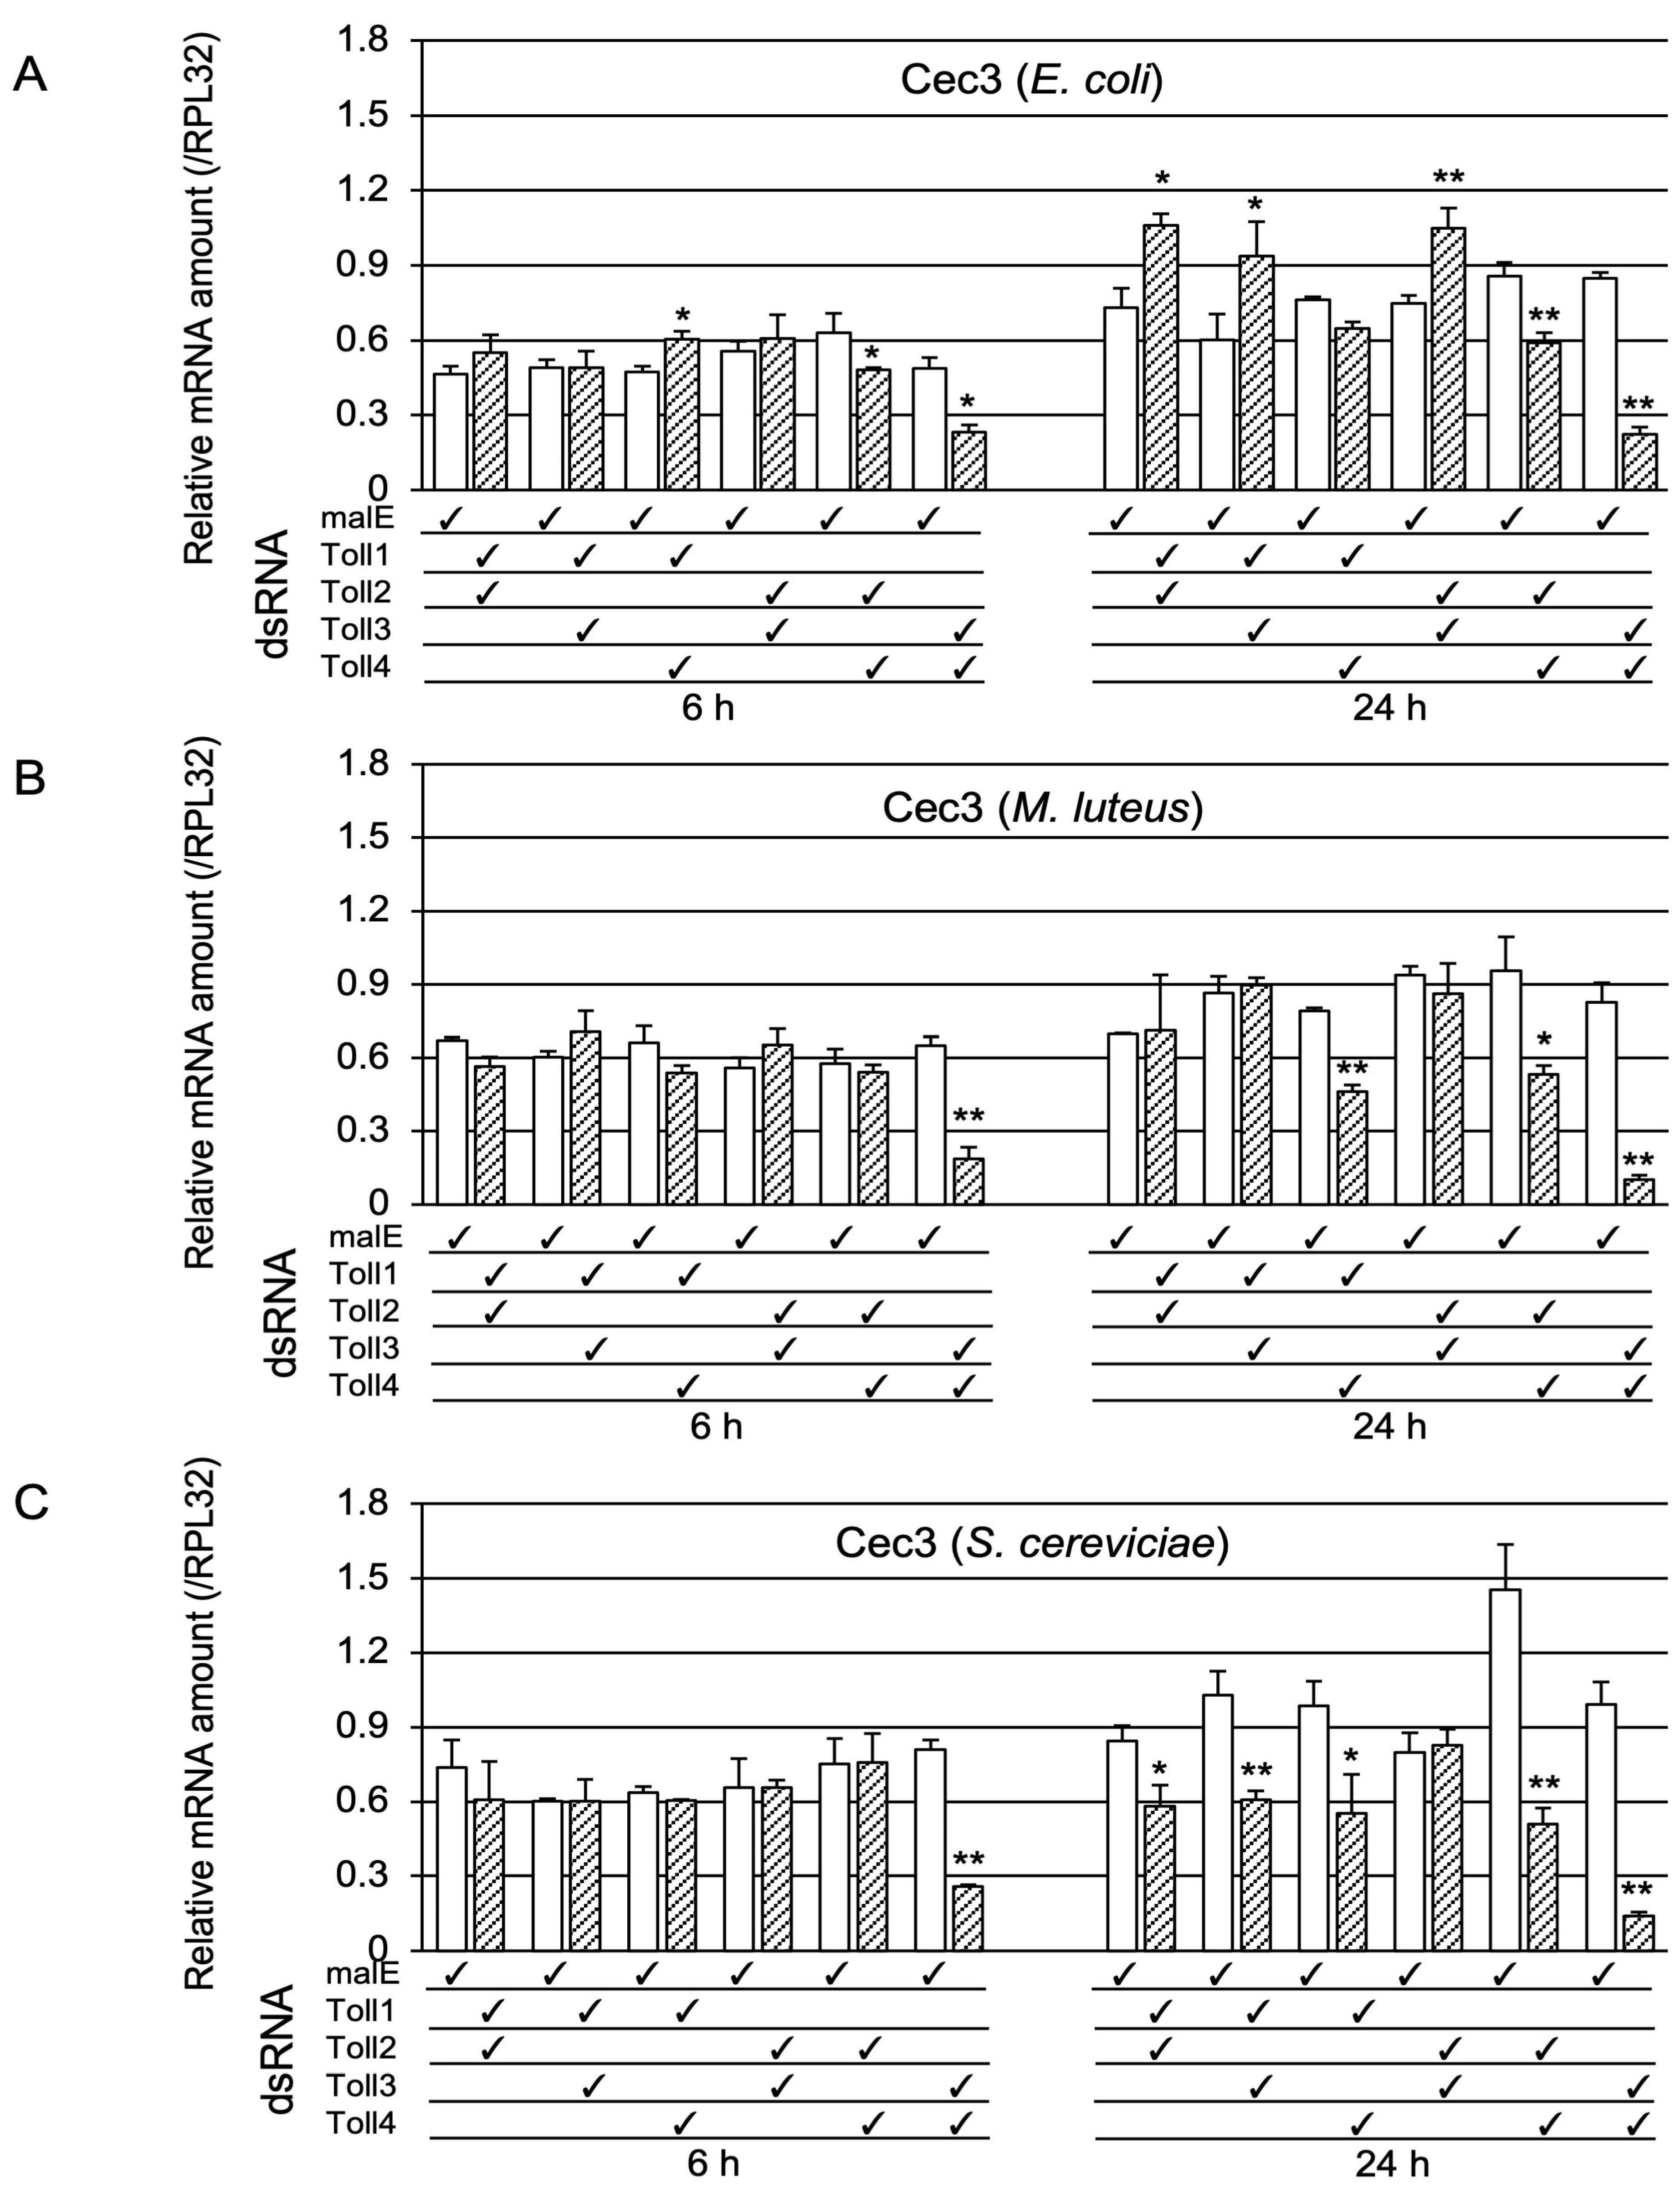
As described in the introduction, the Toll protein forms dimers when immune signals are transduced. Therefore, we examined whether Toll genes acted redundantly or synergistically in Toll-pathway-dependent AMP gene expression. For this purpose, we prepared pupae in which two out of the four Toll genes were knocked down. First, we examined whether the double-knockdown of Toll genes affected Cec2 induction by Ec, Ml, or Sc challenge (Figure 5). After the Ec challenge, the mRNA levels of Cec2 in Toll3+Toll4 double-knockdown pupae at 6 and 24 h post-challenge were strongly decreased compared with those in the control pupae; in contrast, Cec2 mRNA levels in Toll3+Toll4 double-knockdown pupae at 24 h post-challenge were only moderately lower than those in the control (Figure 5A). After the Ml challenge, the expression levels of Cec2 in Toll3+Toll4 double-knockdown pupae at 6 and 24 h post-challenge were much lower than those in the control; on the contrary, Cec2 expression levels in Toll1+Toll4 or Toll3+Toll4 knockdown pupae at 24 h post-challenge were only moderately lower than those in the control (Figure 5B). After the Sc challenge, the mRNA levels of Cec2 in Toll3+Toll4 double-knockdown pupae at 6 and 24 h post-challenge were much lower than those in the control (Figure 5C); in addition, the Cec2 level in Toll2+Toll4 double-knockdown pupae at 24 h post-challenge was dramatically lower than that in the control, whereas that in either Toll1+Toll2, Toll1+Toll3, or Toll1+Toll4 double-knockdown pupae was mildly but significantly lower than that in the control. Second, we investigated the effect of double-knockdown of two Toll genes on Cec3 induction (Figure 6). After Ec challenge, over 50% reductions in Cec3 mRNA level were observed in Toll3+Toll4 double-knockdown pupae at 6 and 24 h post-challenge compared to that in the controls, and approximately 20–30% reductions were observed in Toll2+Toll4 double-knockdown pupae at 6 and 24 h post-challenge compared to that in the control (Figure 6A). After Ml challenge, over 70% reductions in Cec3 expression levels were observed in Toll3+Toll4 double-knockdown pupae at 6 and 24 h post-challenge compared to that in the control, and approximately 50% reductions were observed in either Toll1+Toll4 or Toll2+Toll4 double-knockdown pupae at 24 h post-challenge compared to that in the control (Figure 6B). After the Sc challenge, approximately over 70% reductions in Cec3 mRNA level were observed in Toll3+Toll4 double-knockdown pupae at 6 and 24 h post-challenge and in Toll2+Toll4 double-knockdown pupae at 24 h post-challenge compared to those in the control, and approximately 20–40% reductions were observed in either Toll1+Toll2, Toll1+Toll3, or Toll1+Toll4 double-knockdown pupae compared to those in the control (Figure 6C). These results suggest that Toll3 and Toll4 redundantly play central roles in the induction of Cec2 or Cec3 by microbial challenge.

2.1.4. Survival Assay to Determine the Role of Toll3 and Toll4 in the Immune Response against the Two Entomopathogenic Bacteria

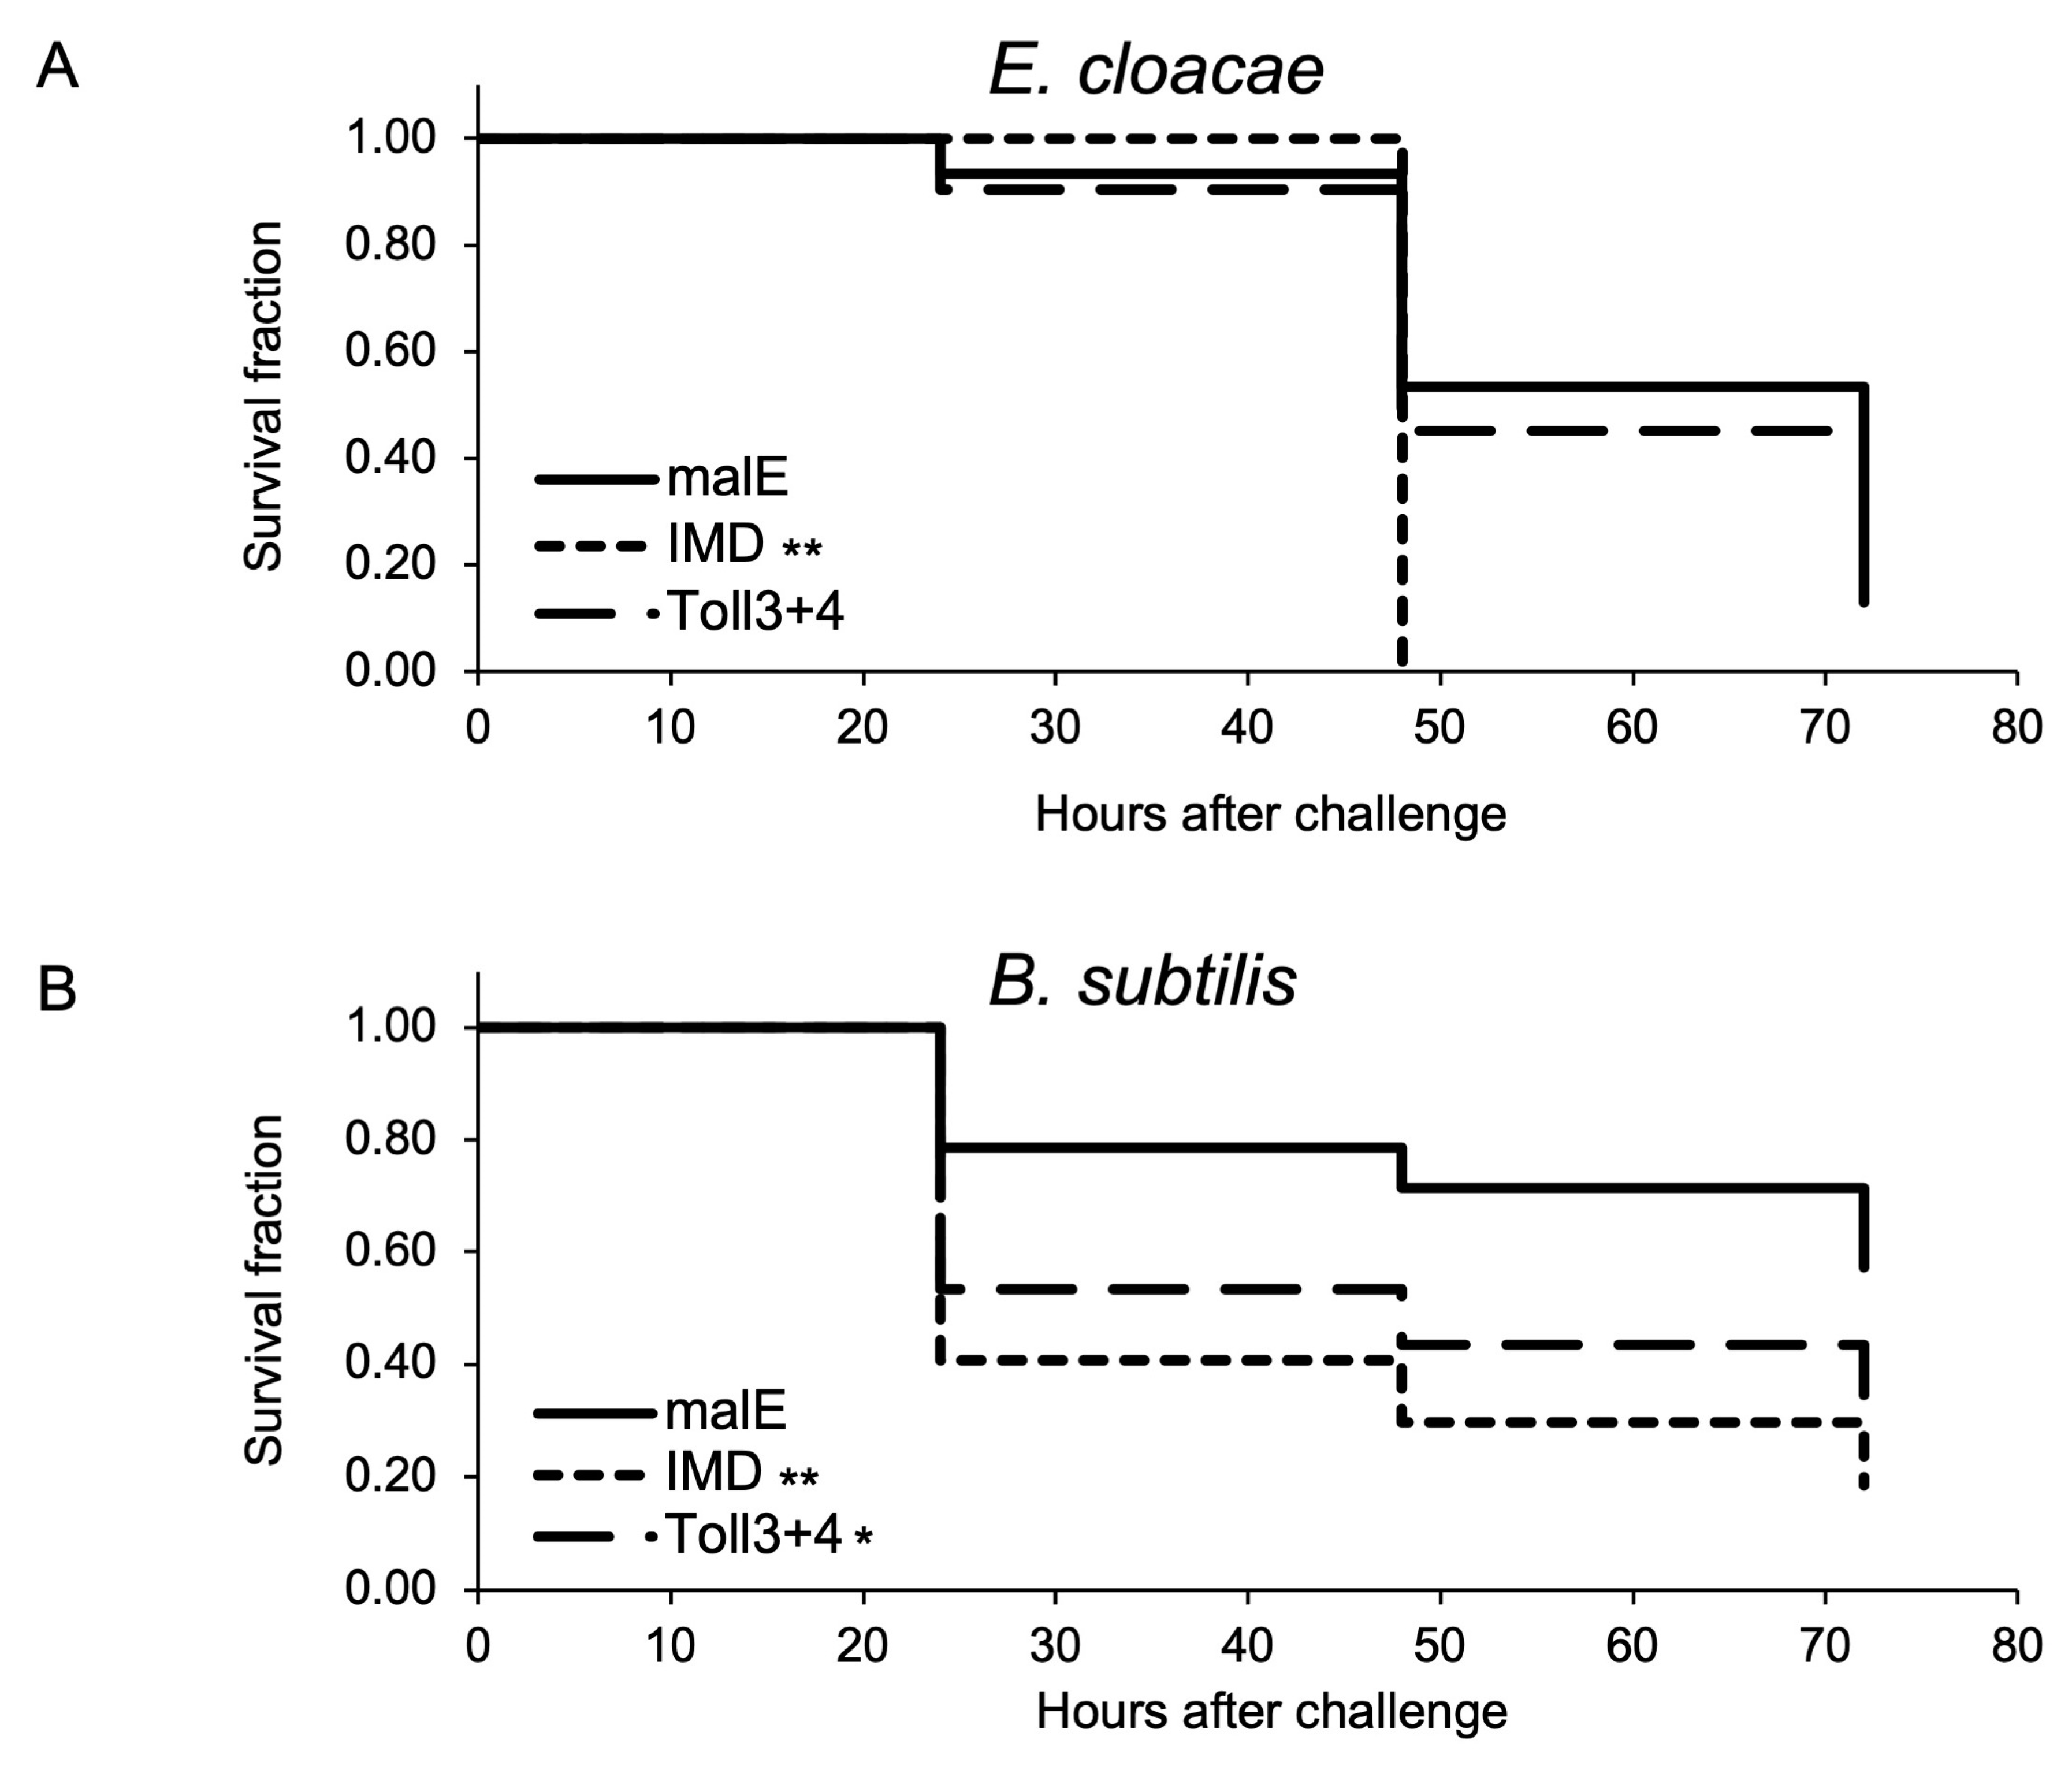
As described in the previous section, Toll3 and Toll4 were involved in the induction of Cec2 and Cec3 (Toll-pathway-dependent AMP genes). To investigate whether these genes participate in the immune response, Toll3 and Toll4 double-knockdown pupae, malE dsRNA-treated pupae (control), and IMD knockdown pupae (positive control) were injected with two entomopathogenic bacteria, Enterobacter cloacae (Gram-negative bacteria with meso-diaminopimelic acid (DAP)-type peptidoglycan) and Bacillus subtilis (Gram-positive bacteria with DAP-type peptidoglycan). The number of living pupae was counted every 24 h. After E. cloacae challenge, no significant differences in survival curves were observed between the control and Toll3+Toll4 double-knockdown pupae, whereas the survival curve of IMD knockdown pupae (positive control) was significantly different from that of the control (Figure 7A). After B. subtilis challenge, the number of dead pupae was significantly higher in the Toll3+Toll4 double-knockdown group than in the control group. However, p value of control vs. Toll3 and Toll4 knockdown pupae were not lower than that of control vs. IMD knockdown, suggesting that Toll3 and Toll4 contributed to immune defenses against B. subtilis, but the degree of Toll3 and Toll4 contributions to the defenses was not the same as that of the IMD contributions.

2.2. Functional Assay of spz Genes

2.2.1. Phylogenetic and Sequence Analyses of the spz Gene

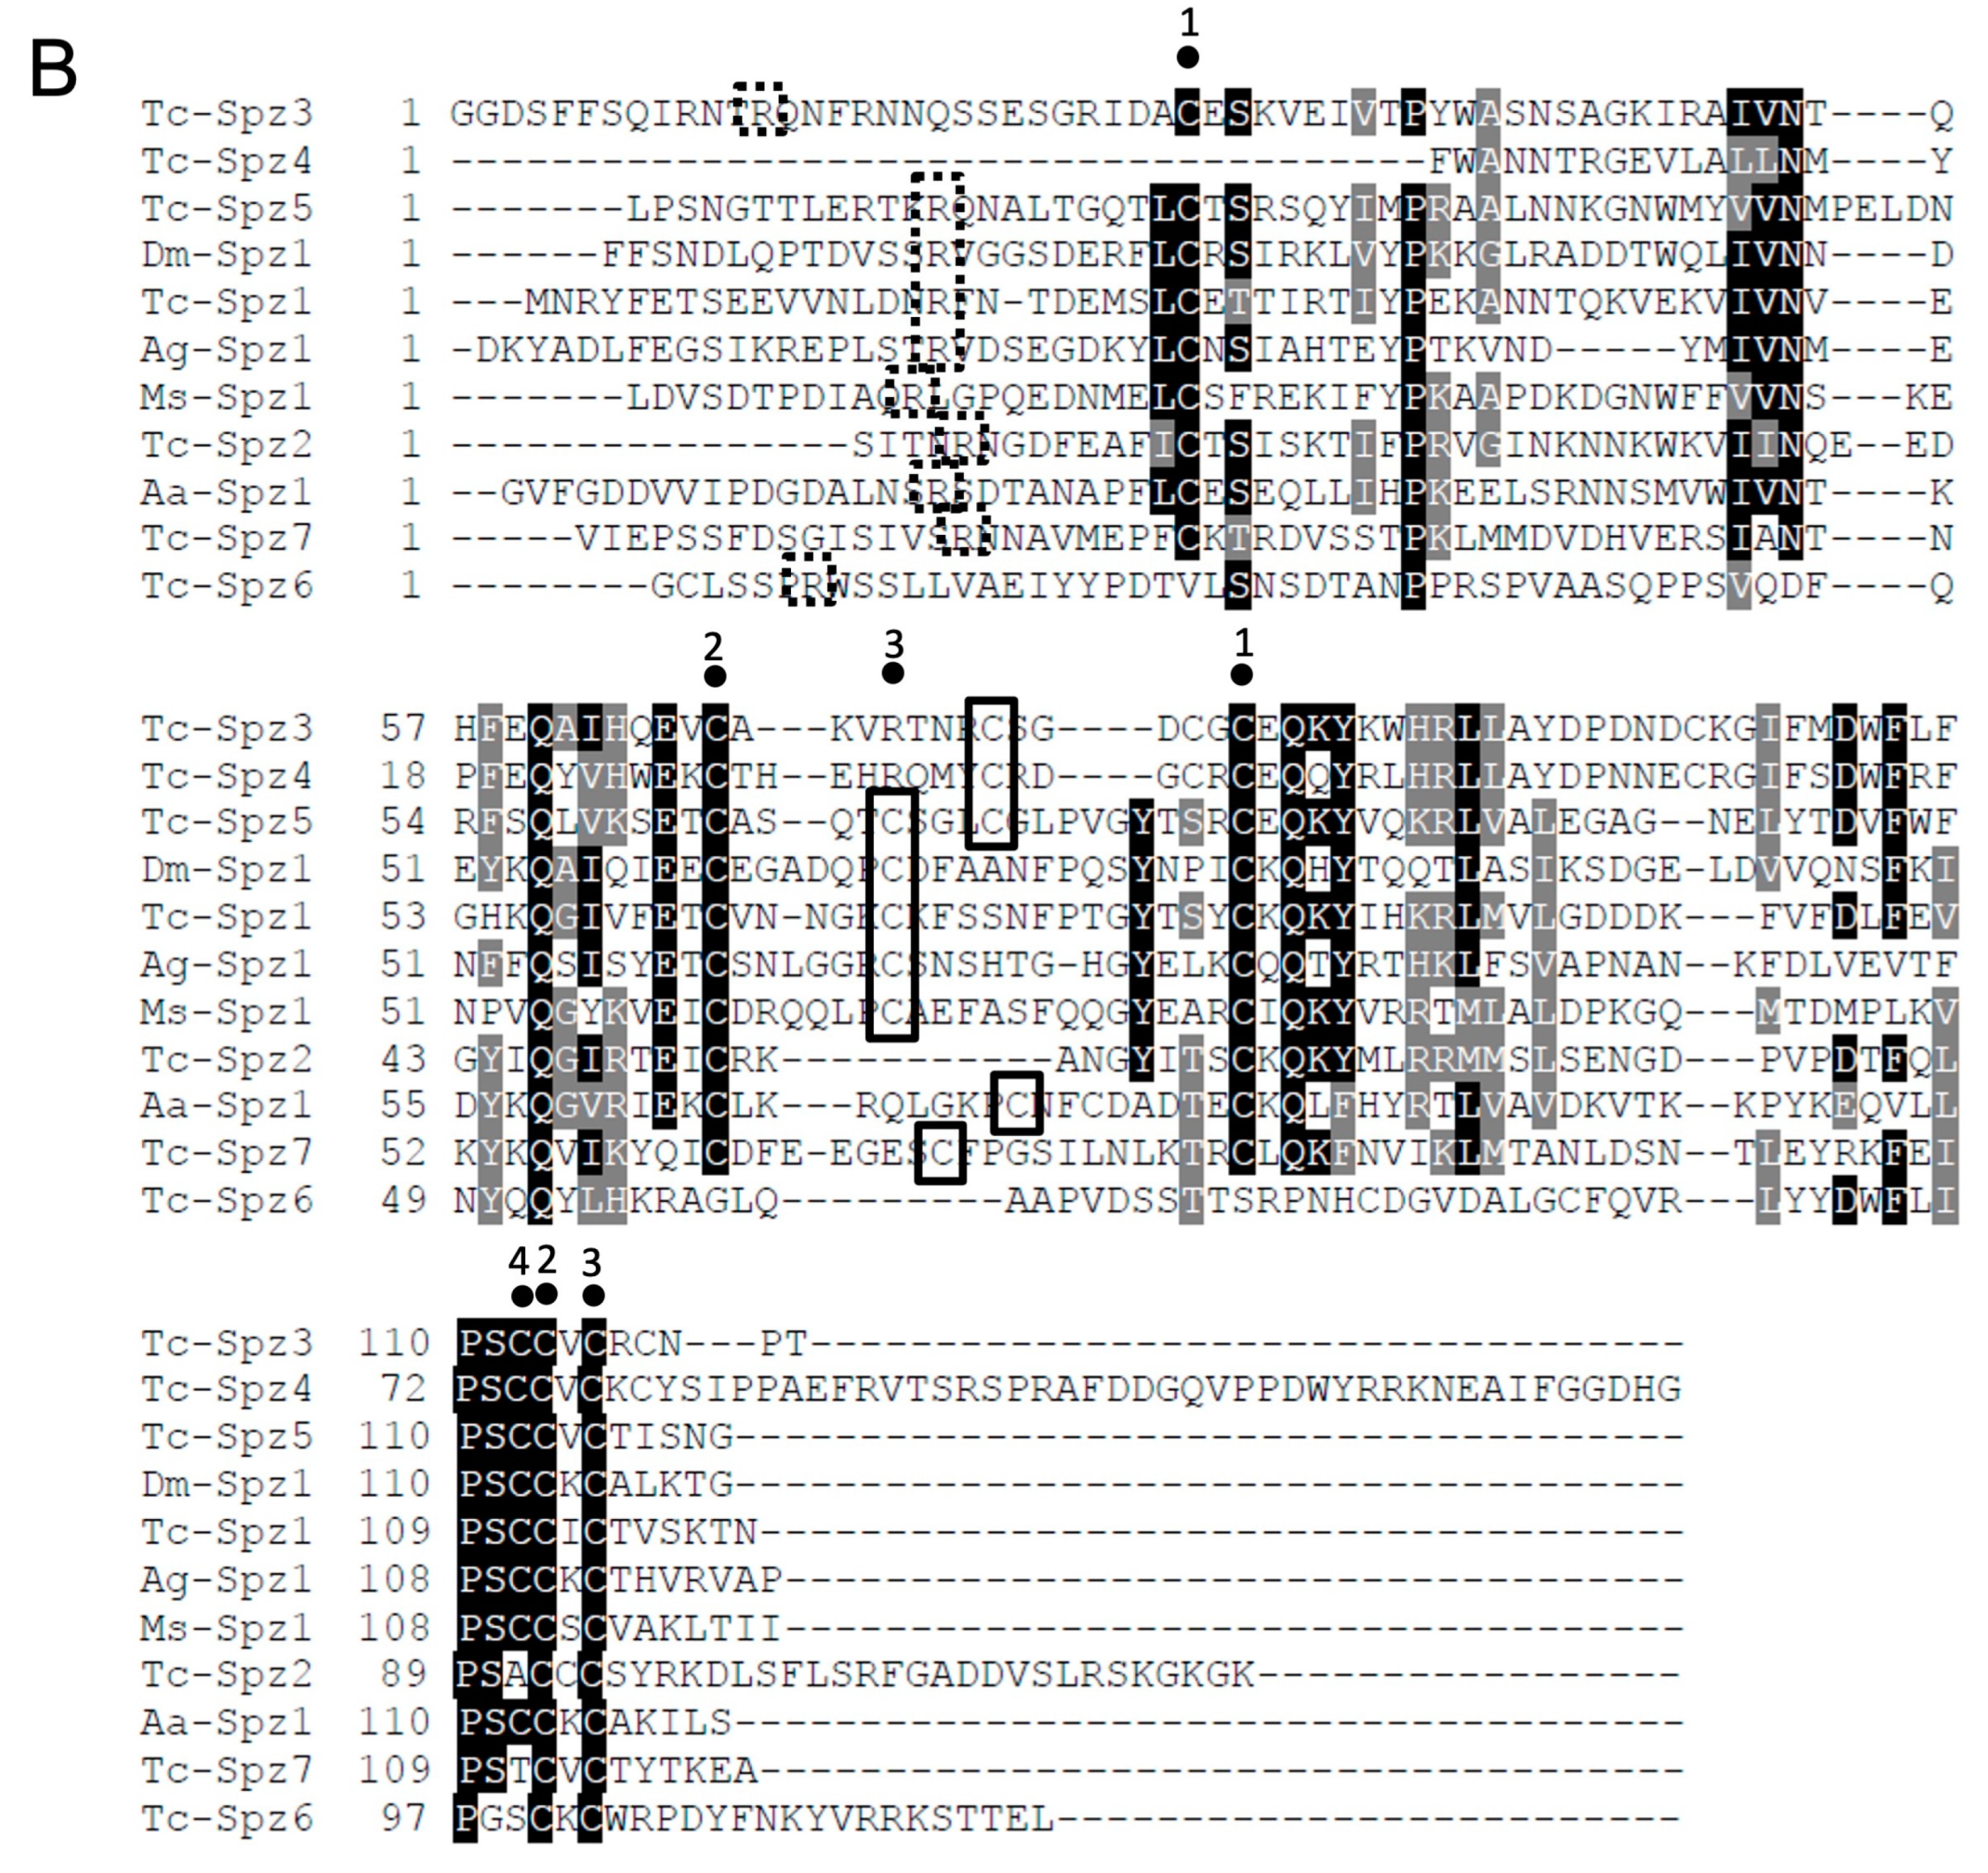
To identify the T. castaneum spz genes (Tc-spz) involved in Toll-pathway-dependent AMP gene expression, we performed phylogenetic analysis using spz sequences of various insect species, D. melanogaster (Dm-spz), Anopheles gambiae (Diptera; Culicidae, Giles, 1902) (Ag-spz), A. aegypti (Aa-spz), and M. sexta (Ms-spz) (Supplemental Table S1), because spz sequences are not similar to each other. The phylogenetic tree constructed showed that spz1 genes of the used species were scattered in the tree (Figure 8A). Furthermore, the sequence analysis of C-terminal 106 amino acid residues of the spz protein, which plays key roles for functioning as the signal transducers, was performed [21]. One hundred twenty amino acid sequences of Tc-spz1-7 and spz1 of the non-T. castaneum species from C-terminal (Supplemental Data S1) were aligned to search the arginine residues and seven cysteine residues, which are predicted proteolytic cleavage sites and are predicted to formthe cysteine knot, respectively (Figure 8B) [21,27]. The results showed that Tc-spz6 did not possess the arginine residues of the proteolytic cleavage site, and Tc-spz2, 4, 6, and 7 did not completely possess the seven cysteine residues required for the cysteine knot. In conclusion, from both in silico analyses, we did not determine that the candidate T. castaneum spz genes were involved in the immune reactions.

2.2.2. spz Gene Induction by Microbial Challenge

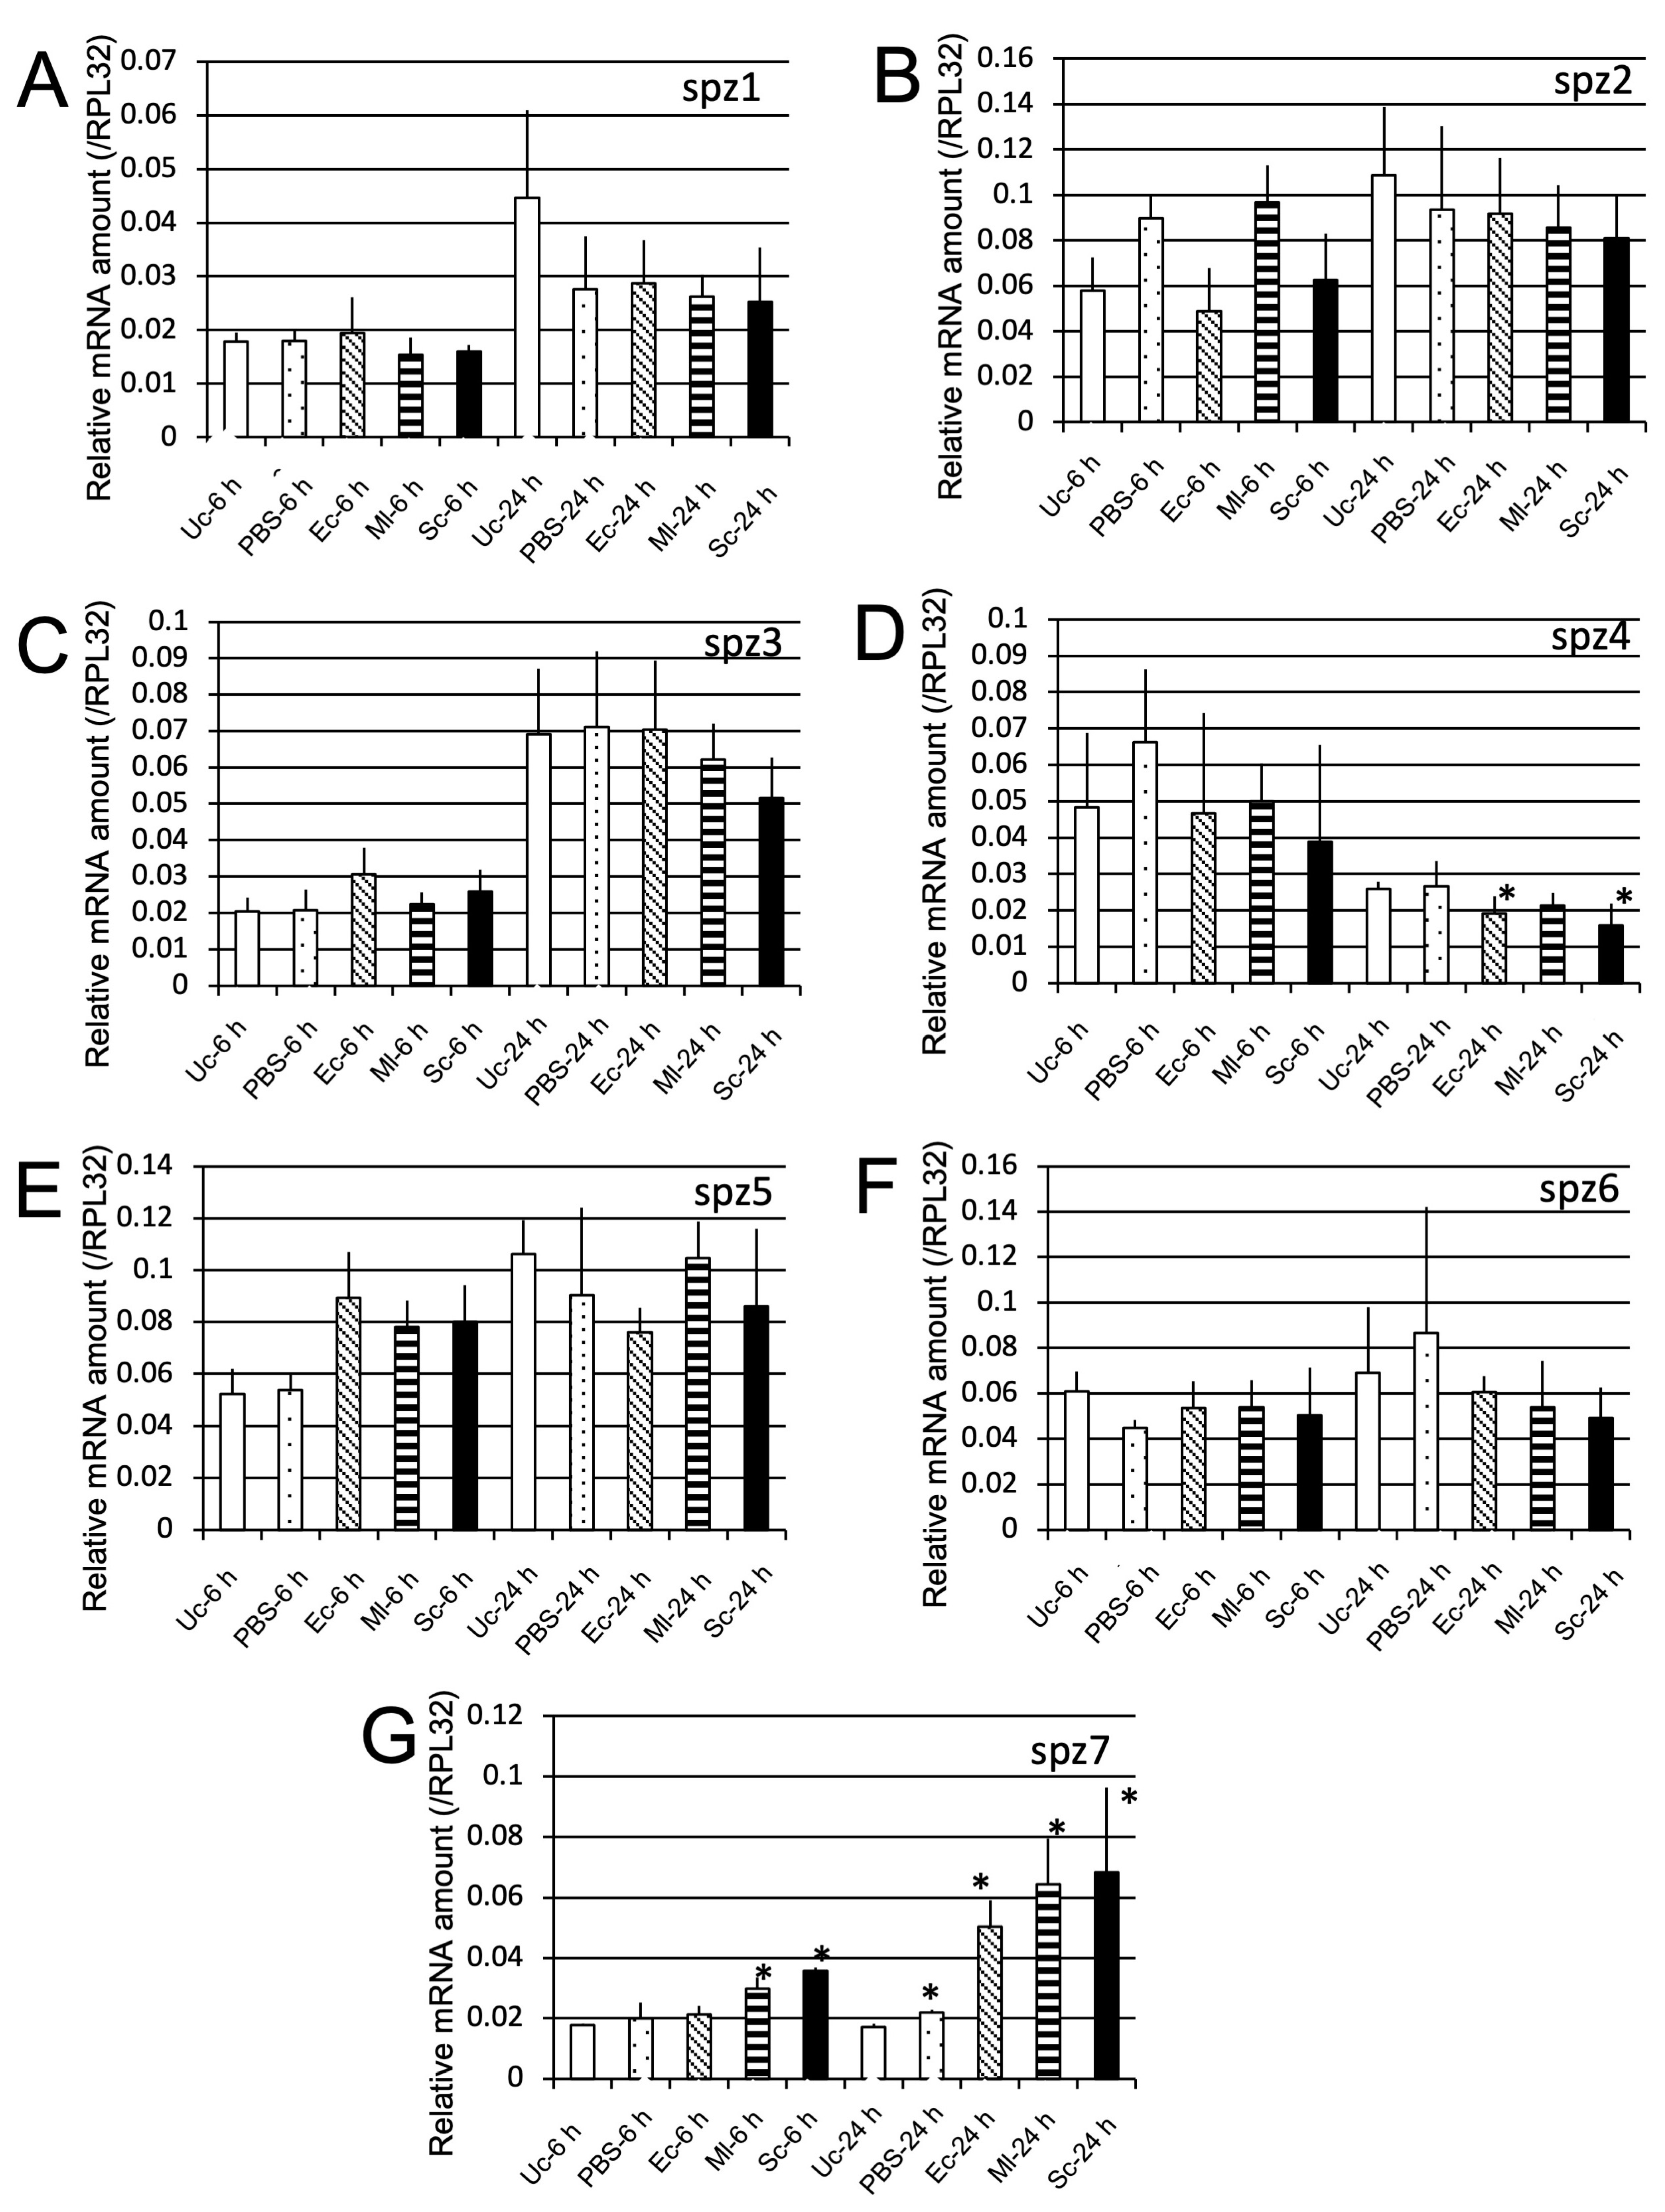
We also examined whether spz gene expression is induced by either Ec, Ml, or Sc challenges (Figure 9). Although spz4 mRNA amounts in pupae Ec or Sc post 24 h challenge were lower than Uc controls (Figure 9D), the expression levels of spz7 in pupae Ml or Sc at 6 h post-challenge and phosphate-buffered saline (PBS), Ec, Ml, or Sc at 24 h post challenge were significantly higher than those of spz7 in Uc controls. These results suggested that spz7 can be a candidate gene involved in immune reactions against the microbes (Figure 9G).

2.2.3. Determination of spz Genes Involved in Toll-Pathway-Dependent AMP Gene Expression

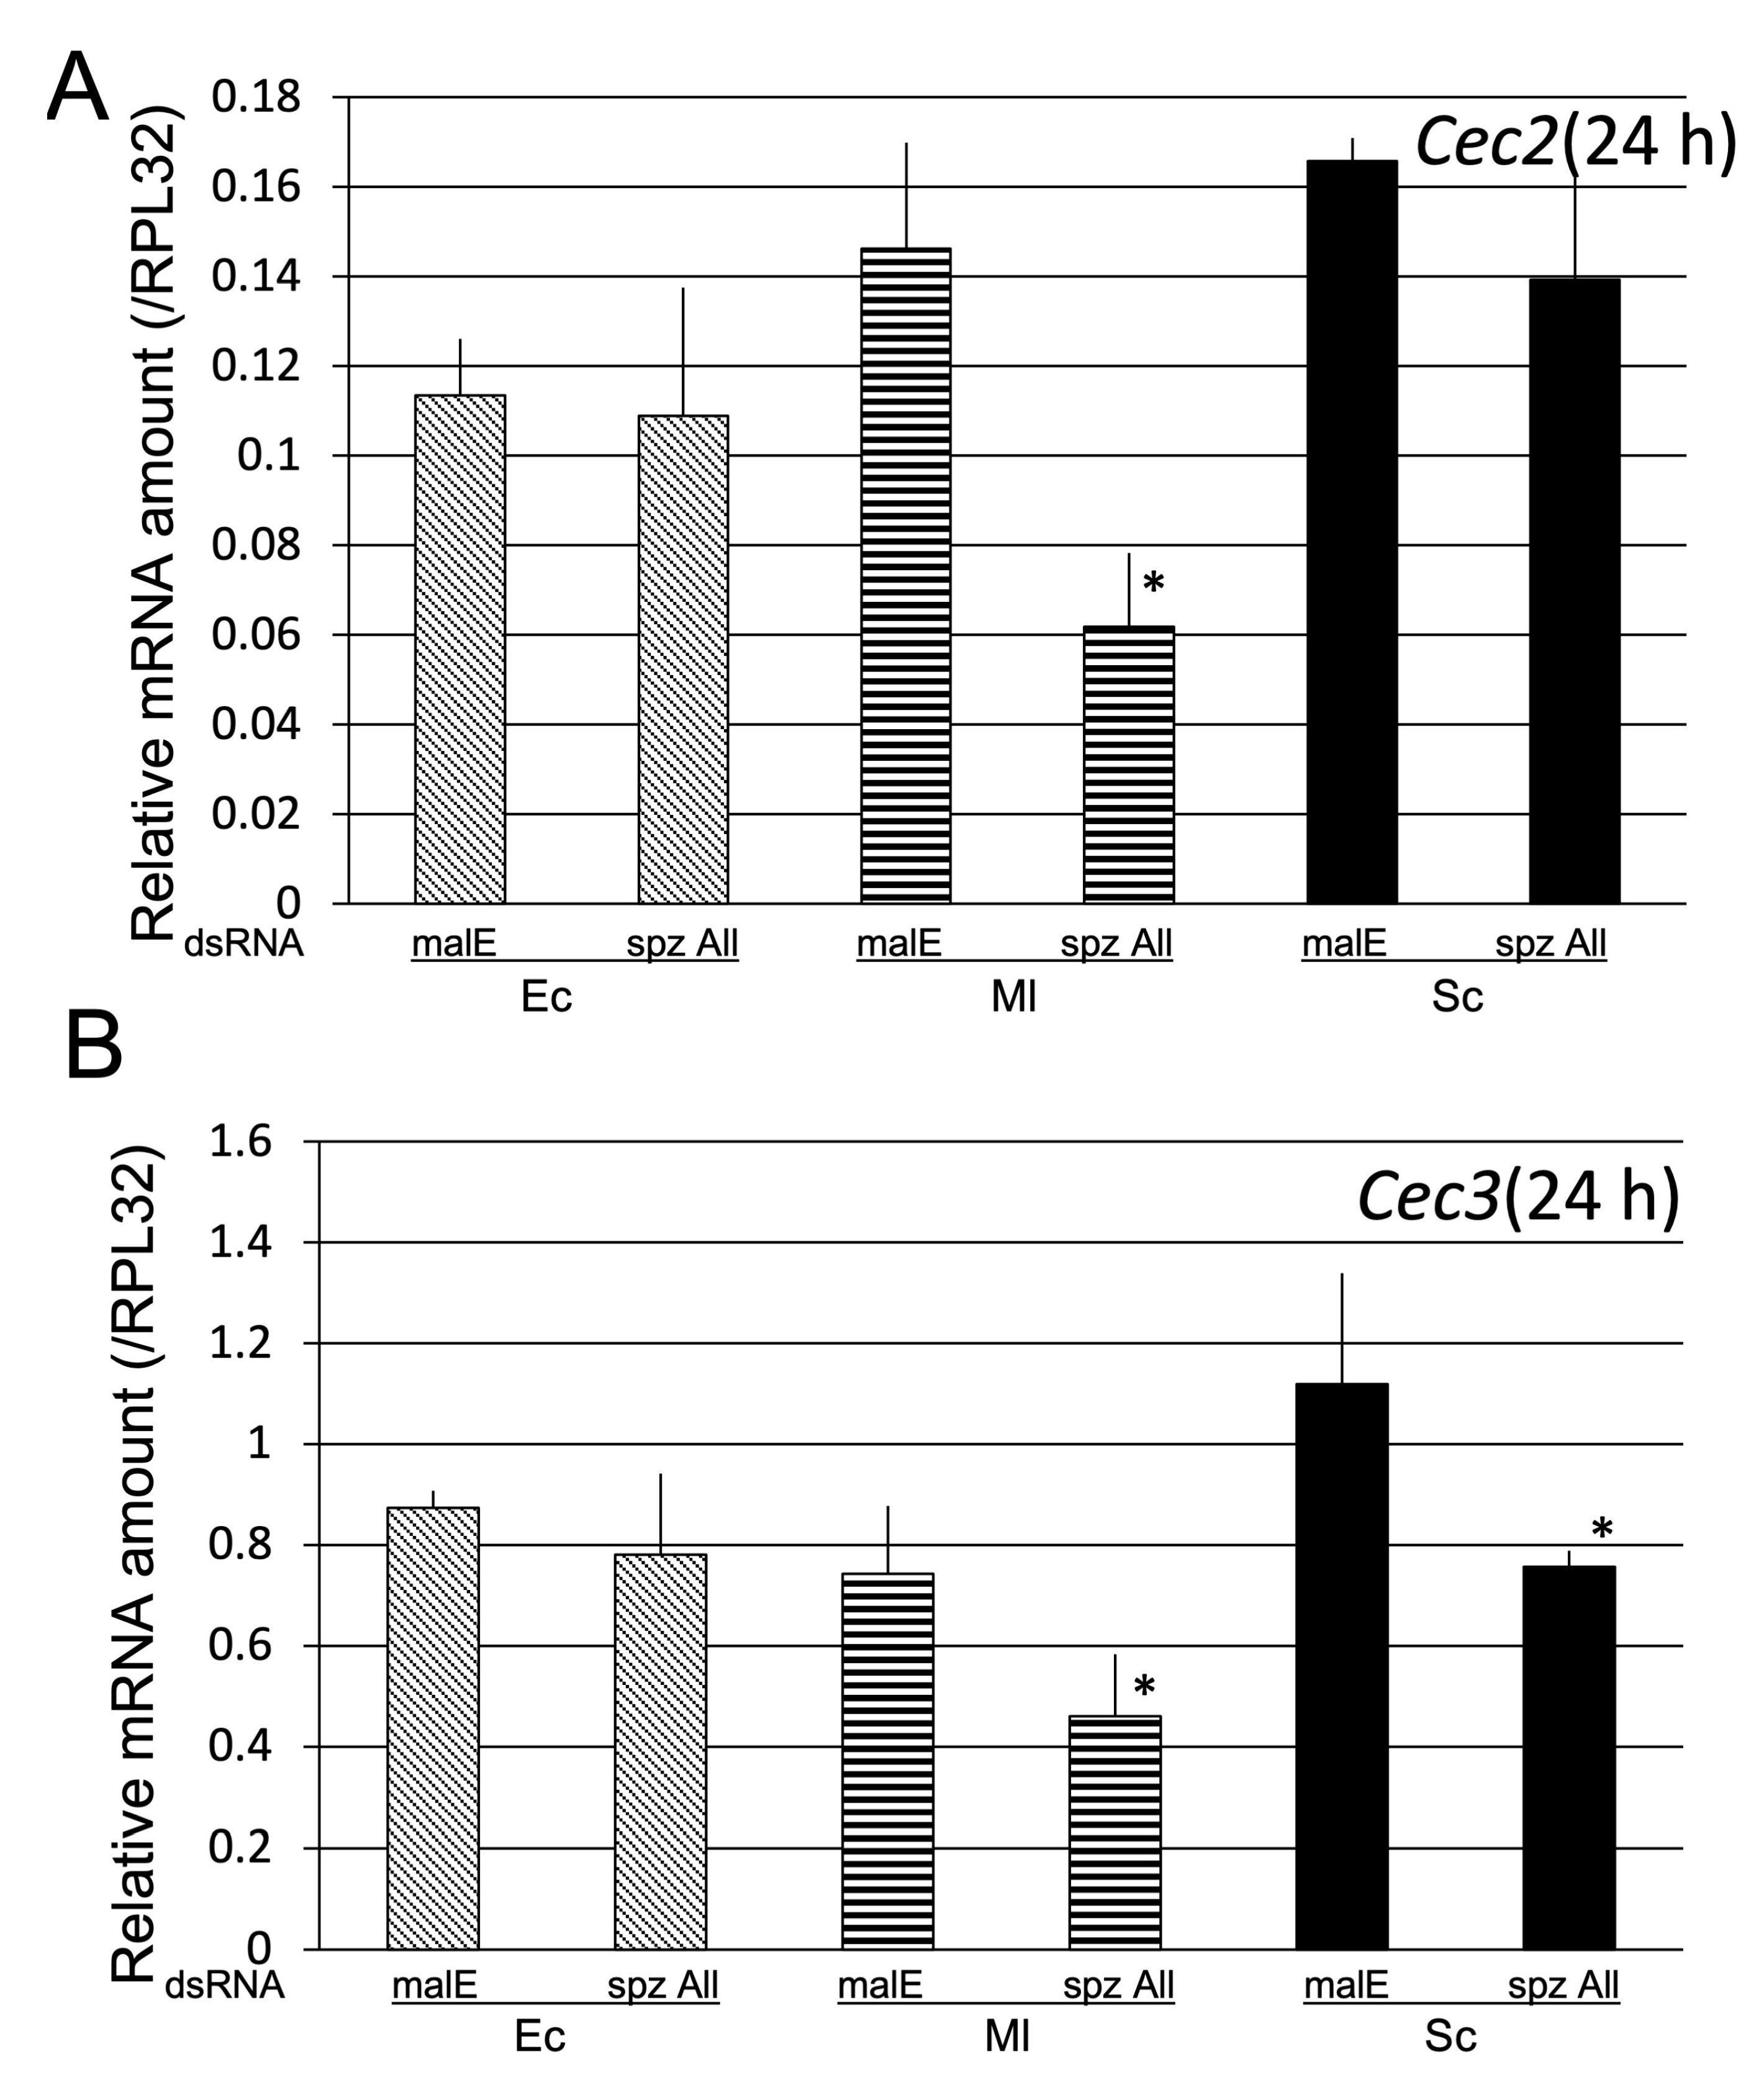
We determined whether spz genes were involved in Cec2 and Cec3 induction, as the candidate spz genes were not determined from sequencing analysis results. The mRNA levels of Cec2 and Cec3 in all spz knockdown pupae, in which the expression of all seven spz genes were significantly reduced, were compared with those in the control (Supplemental Figure S1) at 24 h post-challenge with Ec, Ml, and Sc (Figure 10). This was based on previous reports that Cec2 and Cec3 induction peaked at 24 h post-challenge [15]. Cec3 mRNA levels in all spz knockdown pupae were lower than those in the control, and both Cec2 and Cec3 mRNA levels in all spz knockdown pupae were significantly lower than those in the control, suggesting that spz genes play a role in the Toll-pathway-dependent induction of AMP genes (Cec2 and Cec3).
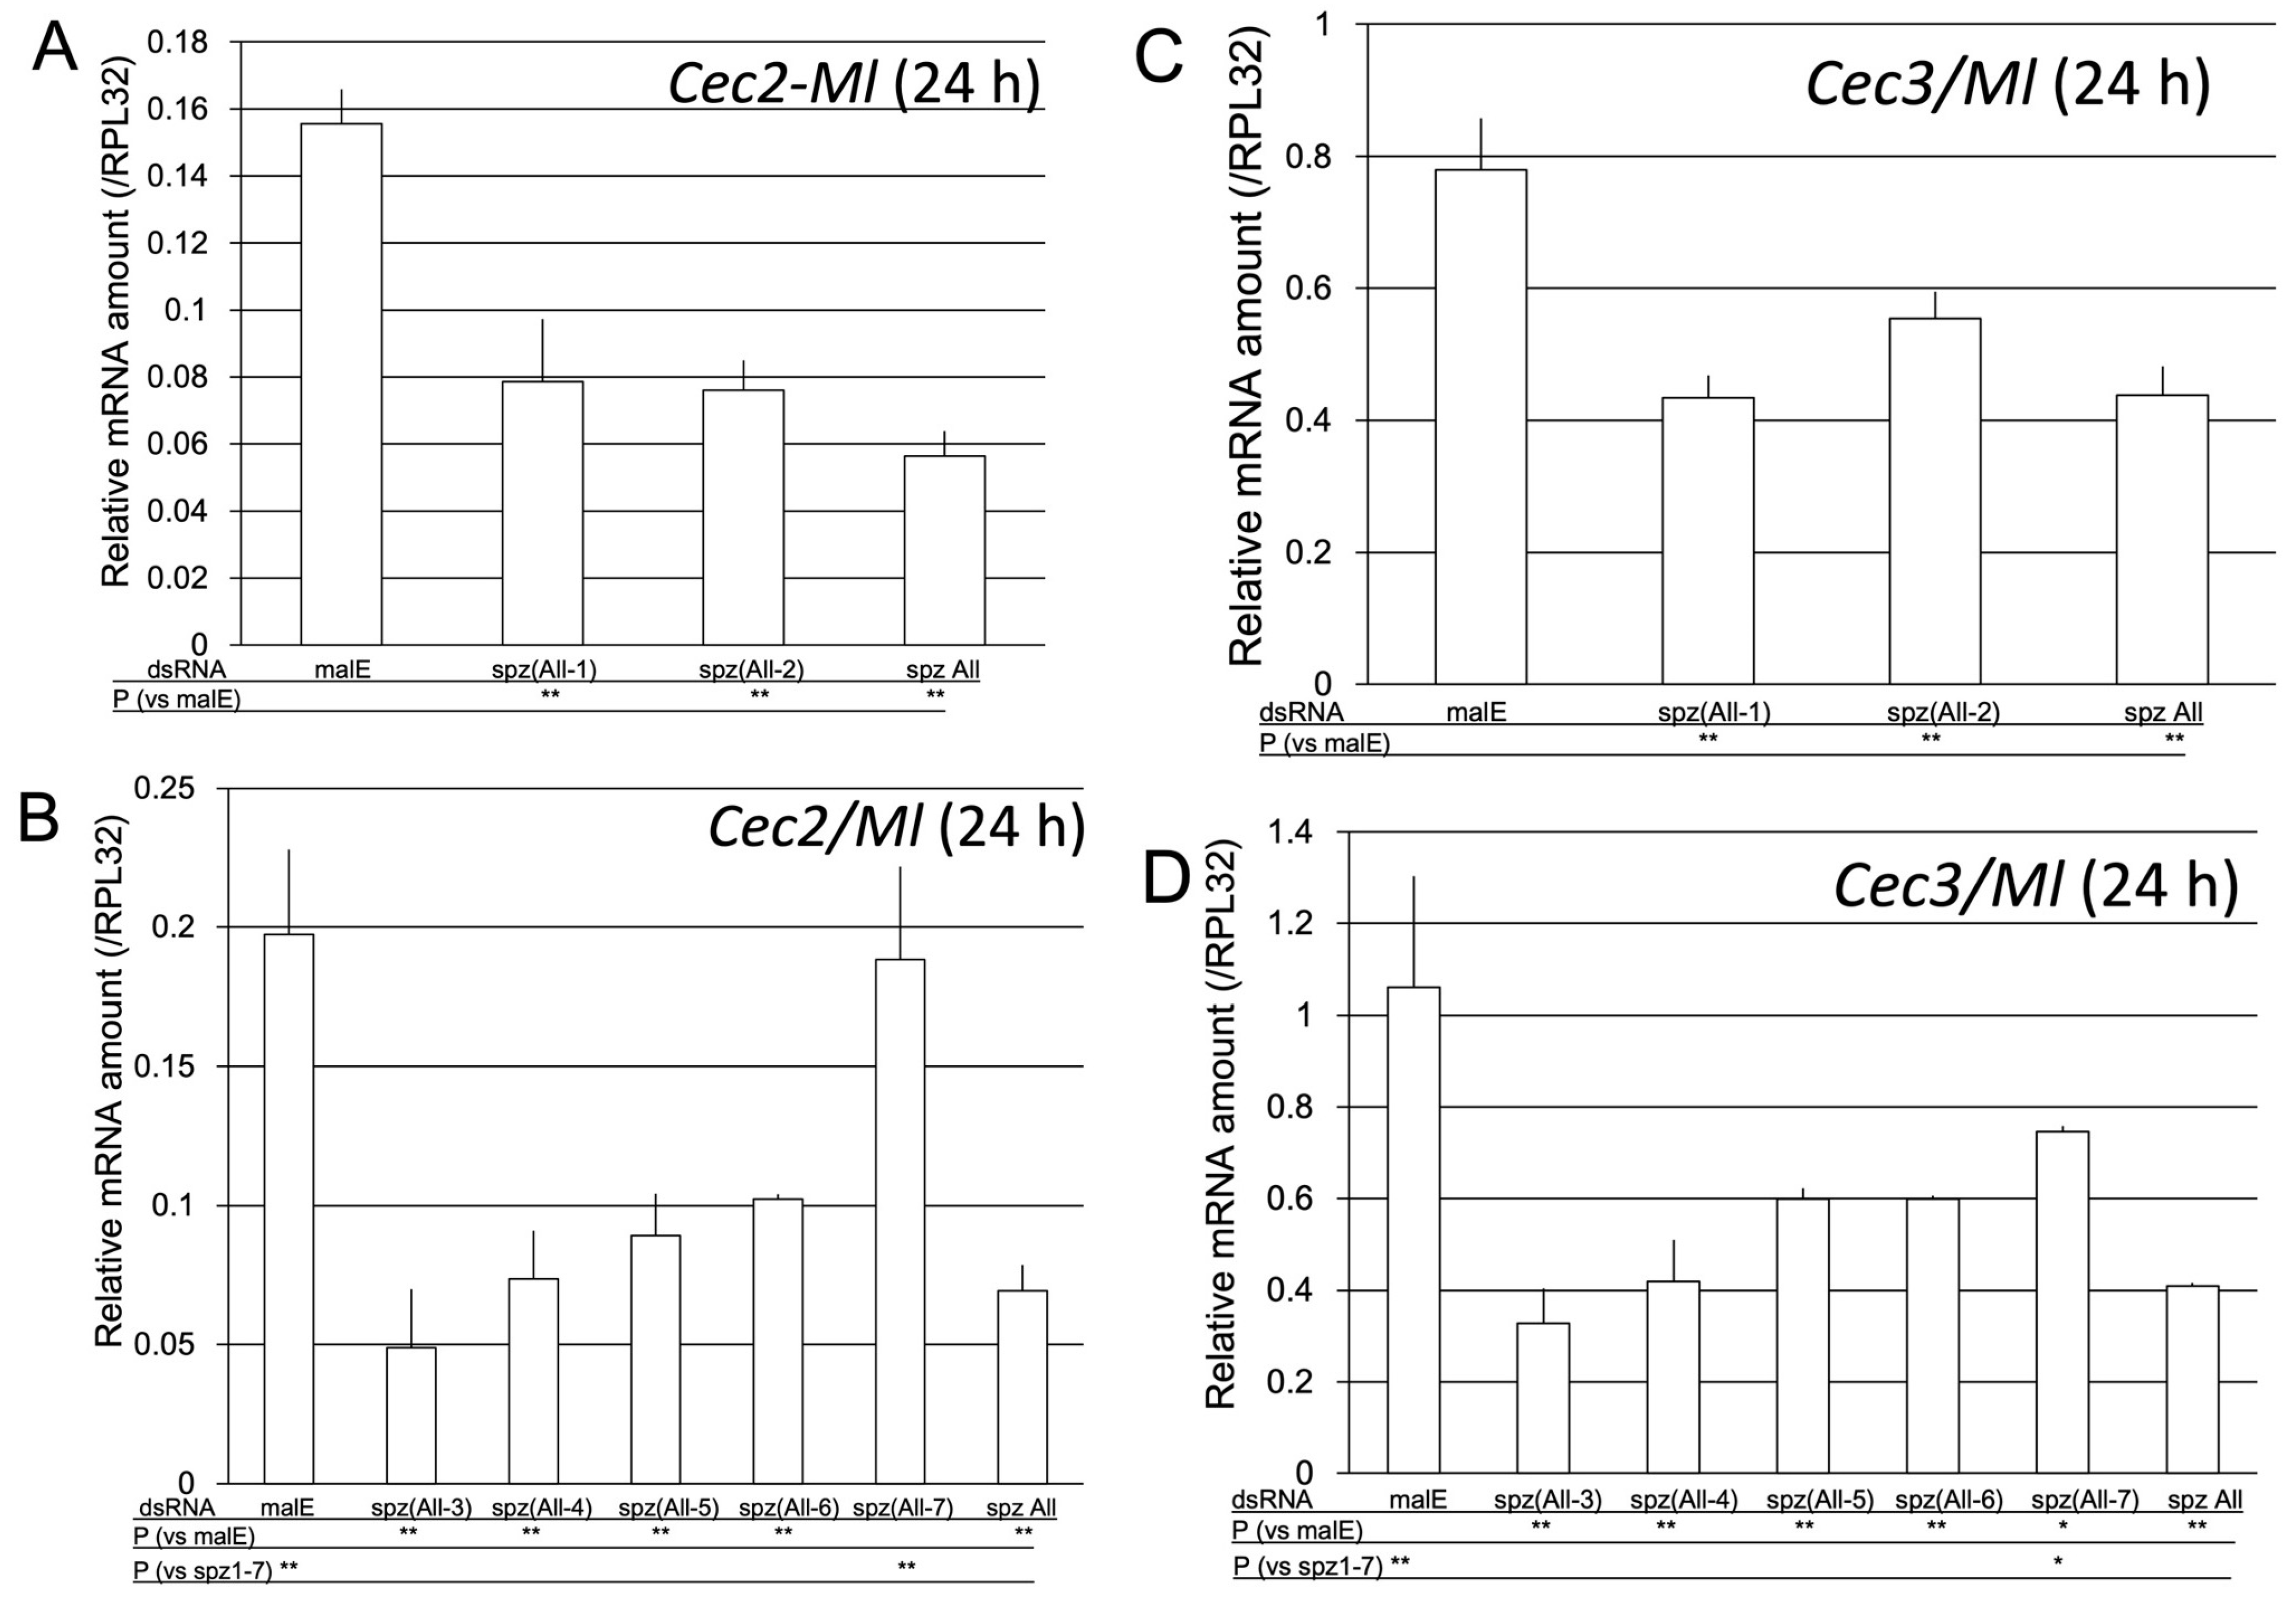
To determine the spz gene involved in the induction of AMP genes by Ml, we generated pupae in which six spz genes were knocked down (e.g., spz(All-3) indicates knockdown of spz1, 2, 4, 5, 6, and 7), and the pupae were then challenged with Ml. At 24 h post-challenge, the mRNA levels of Cec2 and Cec3 in the six spz gene knockdown pupae and the control were compared (Figure 11).
At 24 h post-Ml challenge, the level of Cec2 mRNA in the pupae possessing only the spz7 gene was significantly different from that in the pupae with knockdown of all spz genes but not different from that in the control pupae. In contrast, the mRNA level of Cec2 in the pupae possessing only the spz1, 2, 3, 4, 5, or 6 gene was significantly different from that in the control pupae, but not different from that in the pupae with knockdown of all spz genes (Figure 11A,B). The level of Cec3 mRNA in the pupae possessing only the spz7 gene was significantly different from that in the pupae with knockdown of all spz genes and the control pupae. Moreover, Cec3 mRNA level in the pupae possessing only the spz1, 2, 3, 4, 5, or 6 gene was significantly different from that in the control pupae but not different from that in the pupae with knockdown of all spz genes (Figure 11C,D). These results indicate that spz7 is involved in the Cec2 and Cec3 gene induction.
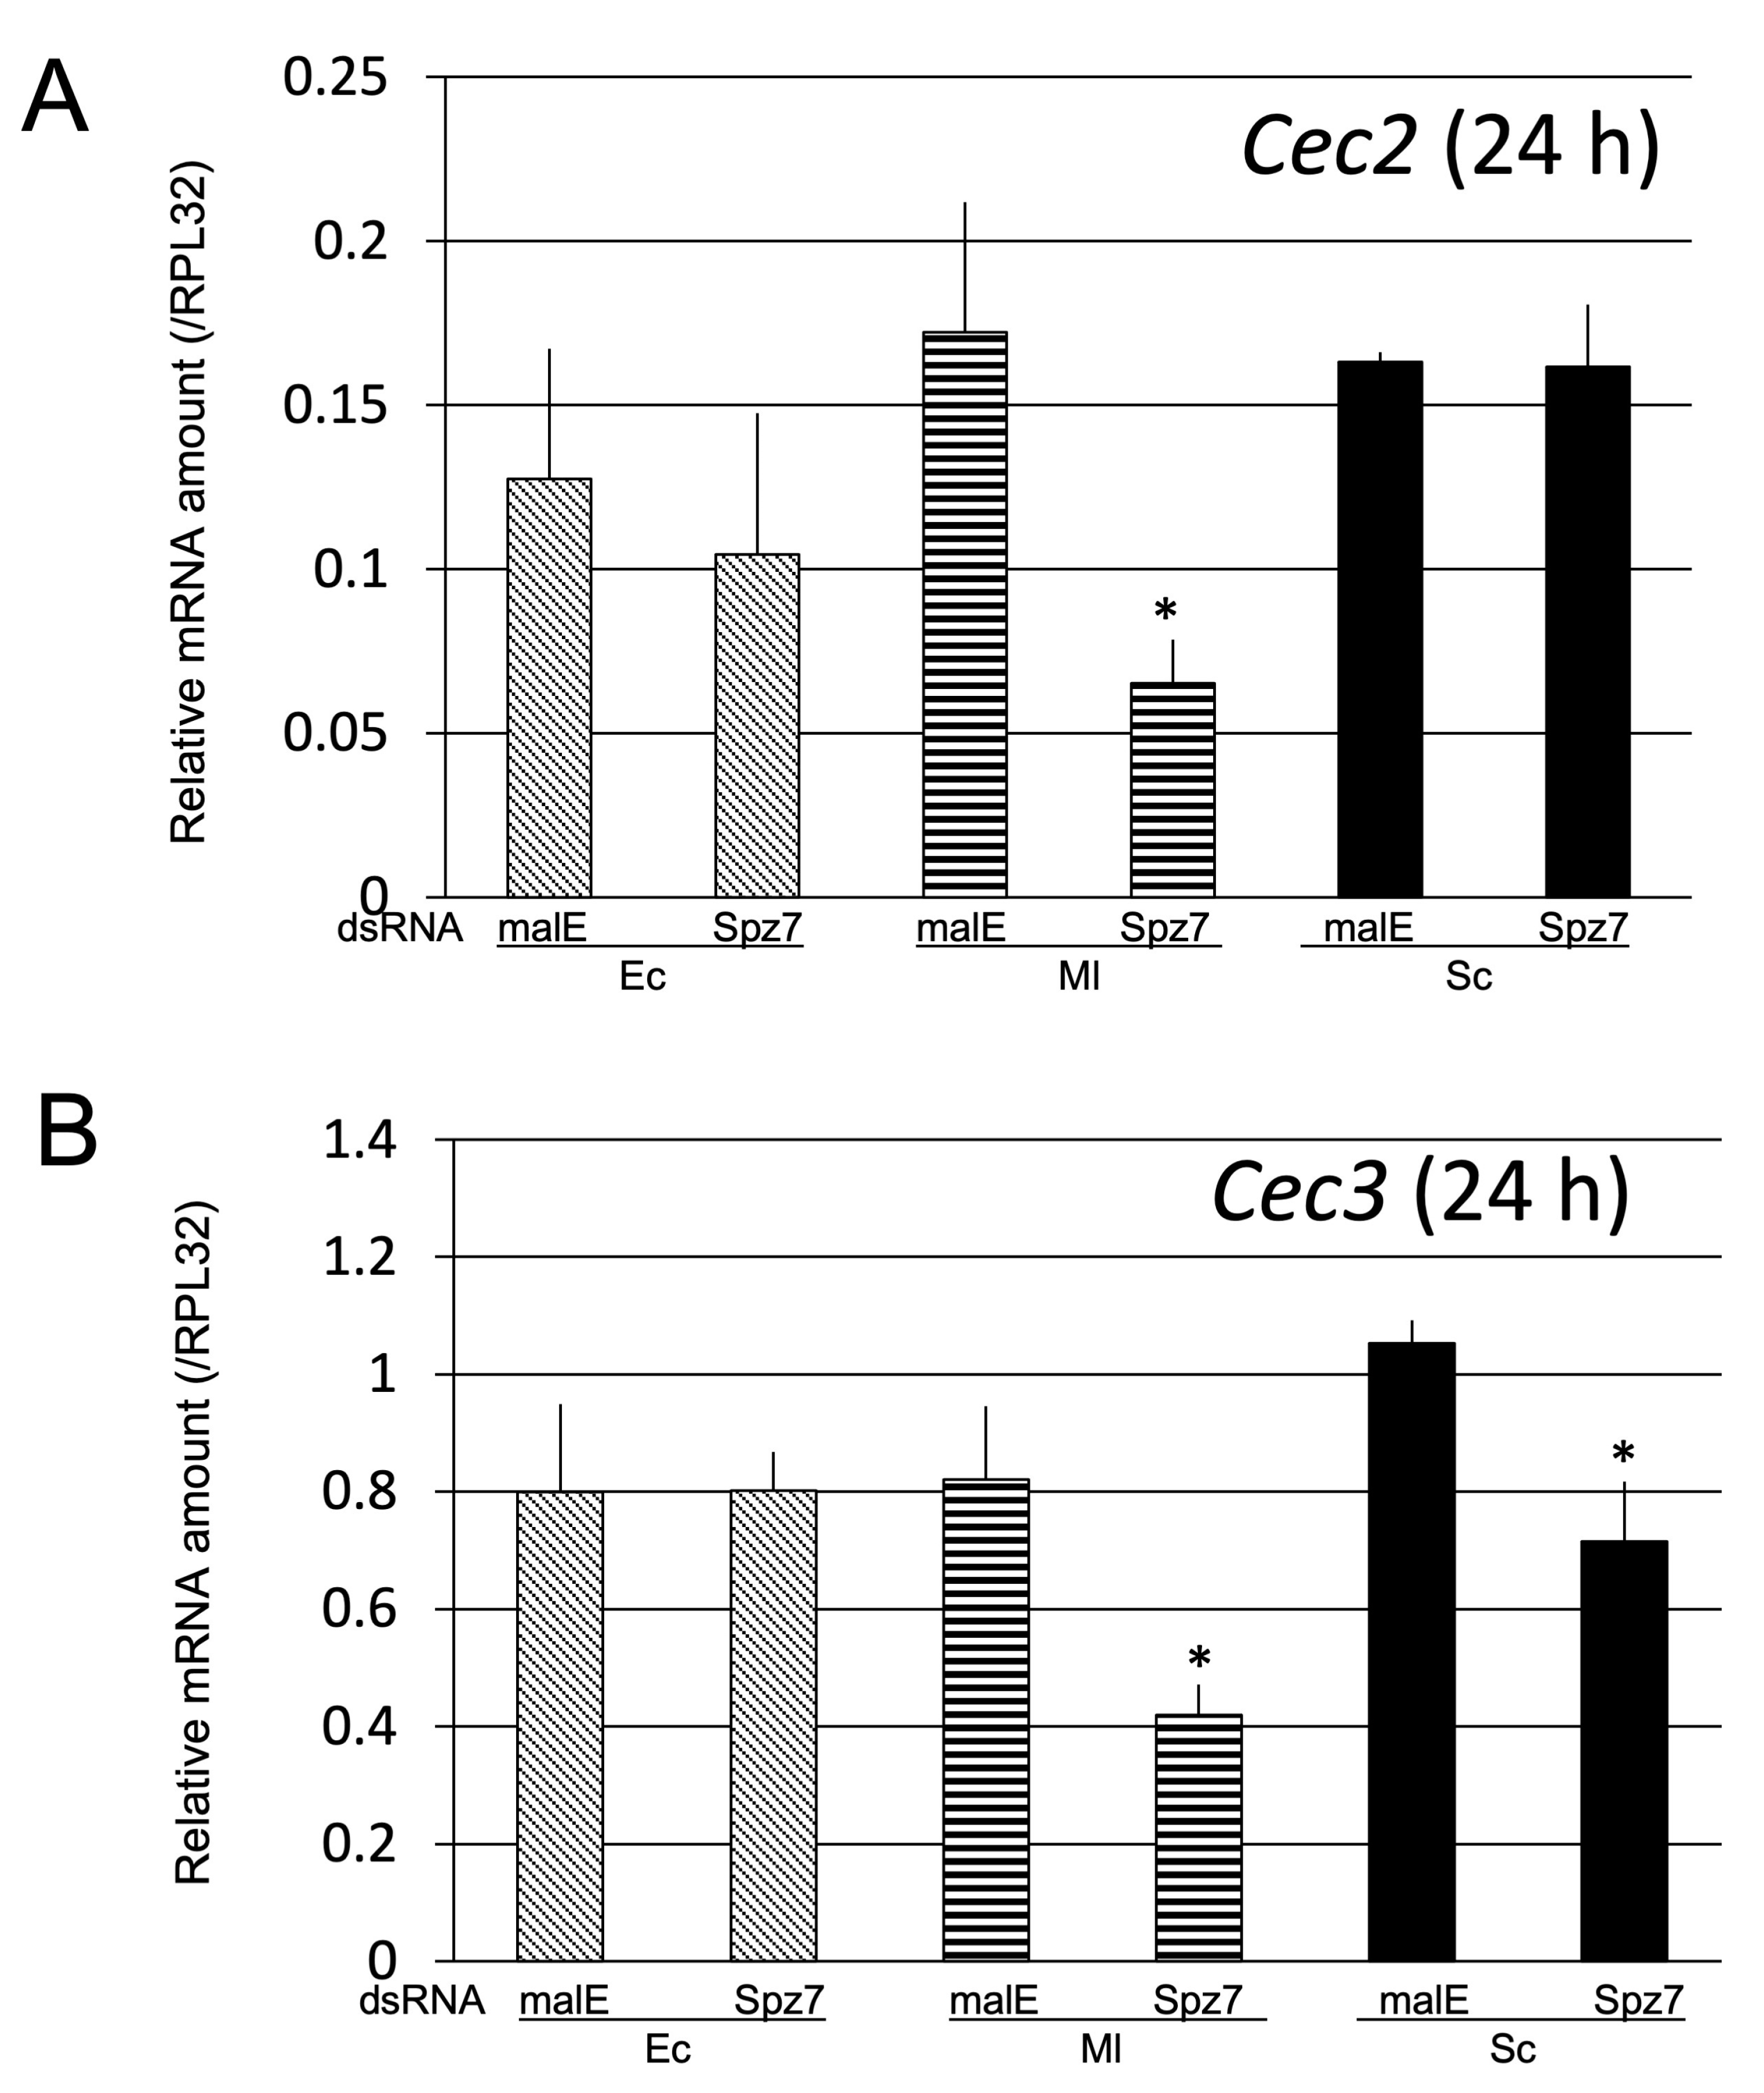
To further confirm this finding, Cec2 and Cec3 mRNA levels in spz7 knockdown pupae and control pupae at 24 h post-challenge with Ec, Ml, or Sc were compared (Figure 12). The results showed a significant reduction of approximately 65% in Cec2 mRNA level in spz7 knockdown pupae challenged with Ml compared with the control pupae. A significant reduction of 50% in Cec3 mRNA levels induced by Ml challenge was also observed in spz7 knockdown pupae compared to those in control pupae (Figure 12A,B). A significant and relatively moderate reduction (compared to Cec2 mRNA reduction.) in Cec3 mRNA level was observed in spz7 knockdown pupae challenged with Sc compared with the control pupae (Figure 12B). These results suggest that spz7 plays a role in the induction of Toll-pathway-dependent AMP genes by Ml.

2.2.4. Survival Assay to Determine the Role of spz7 in the Immune Response against Entomopathogenic Bacteria

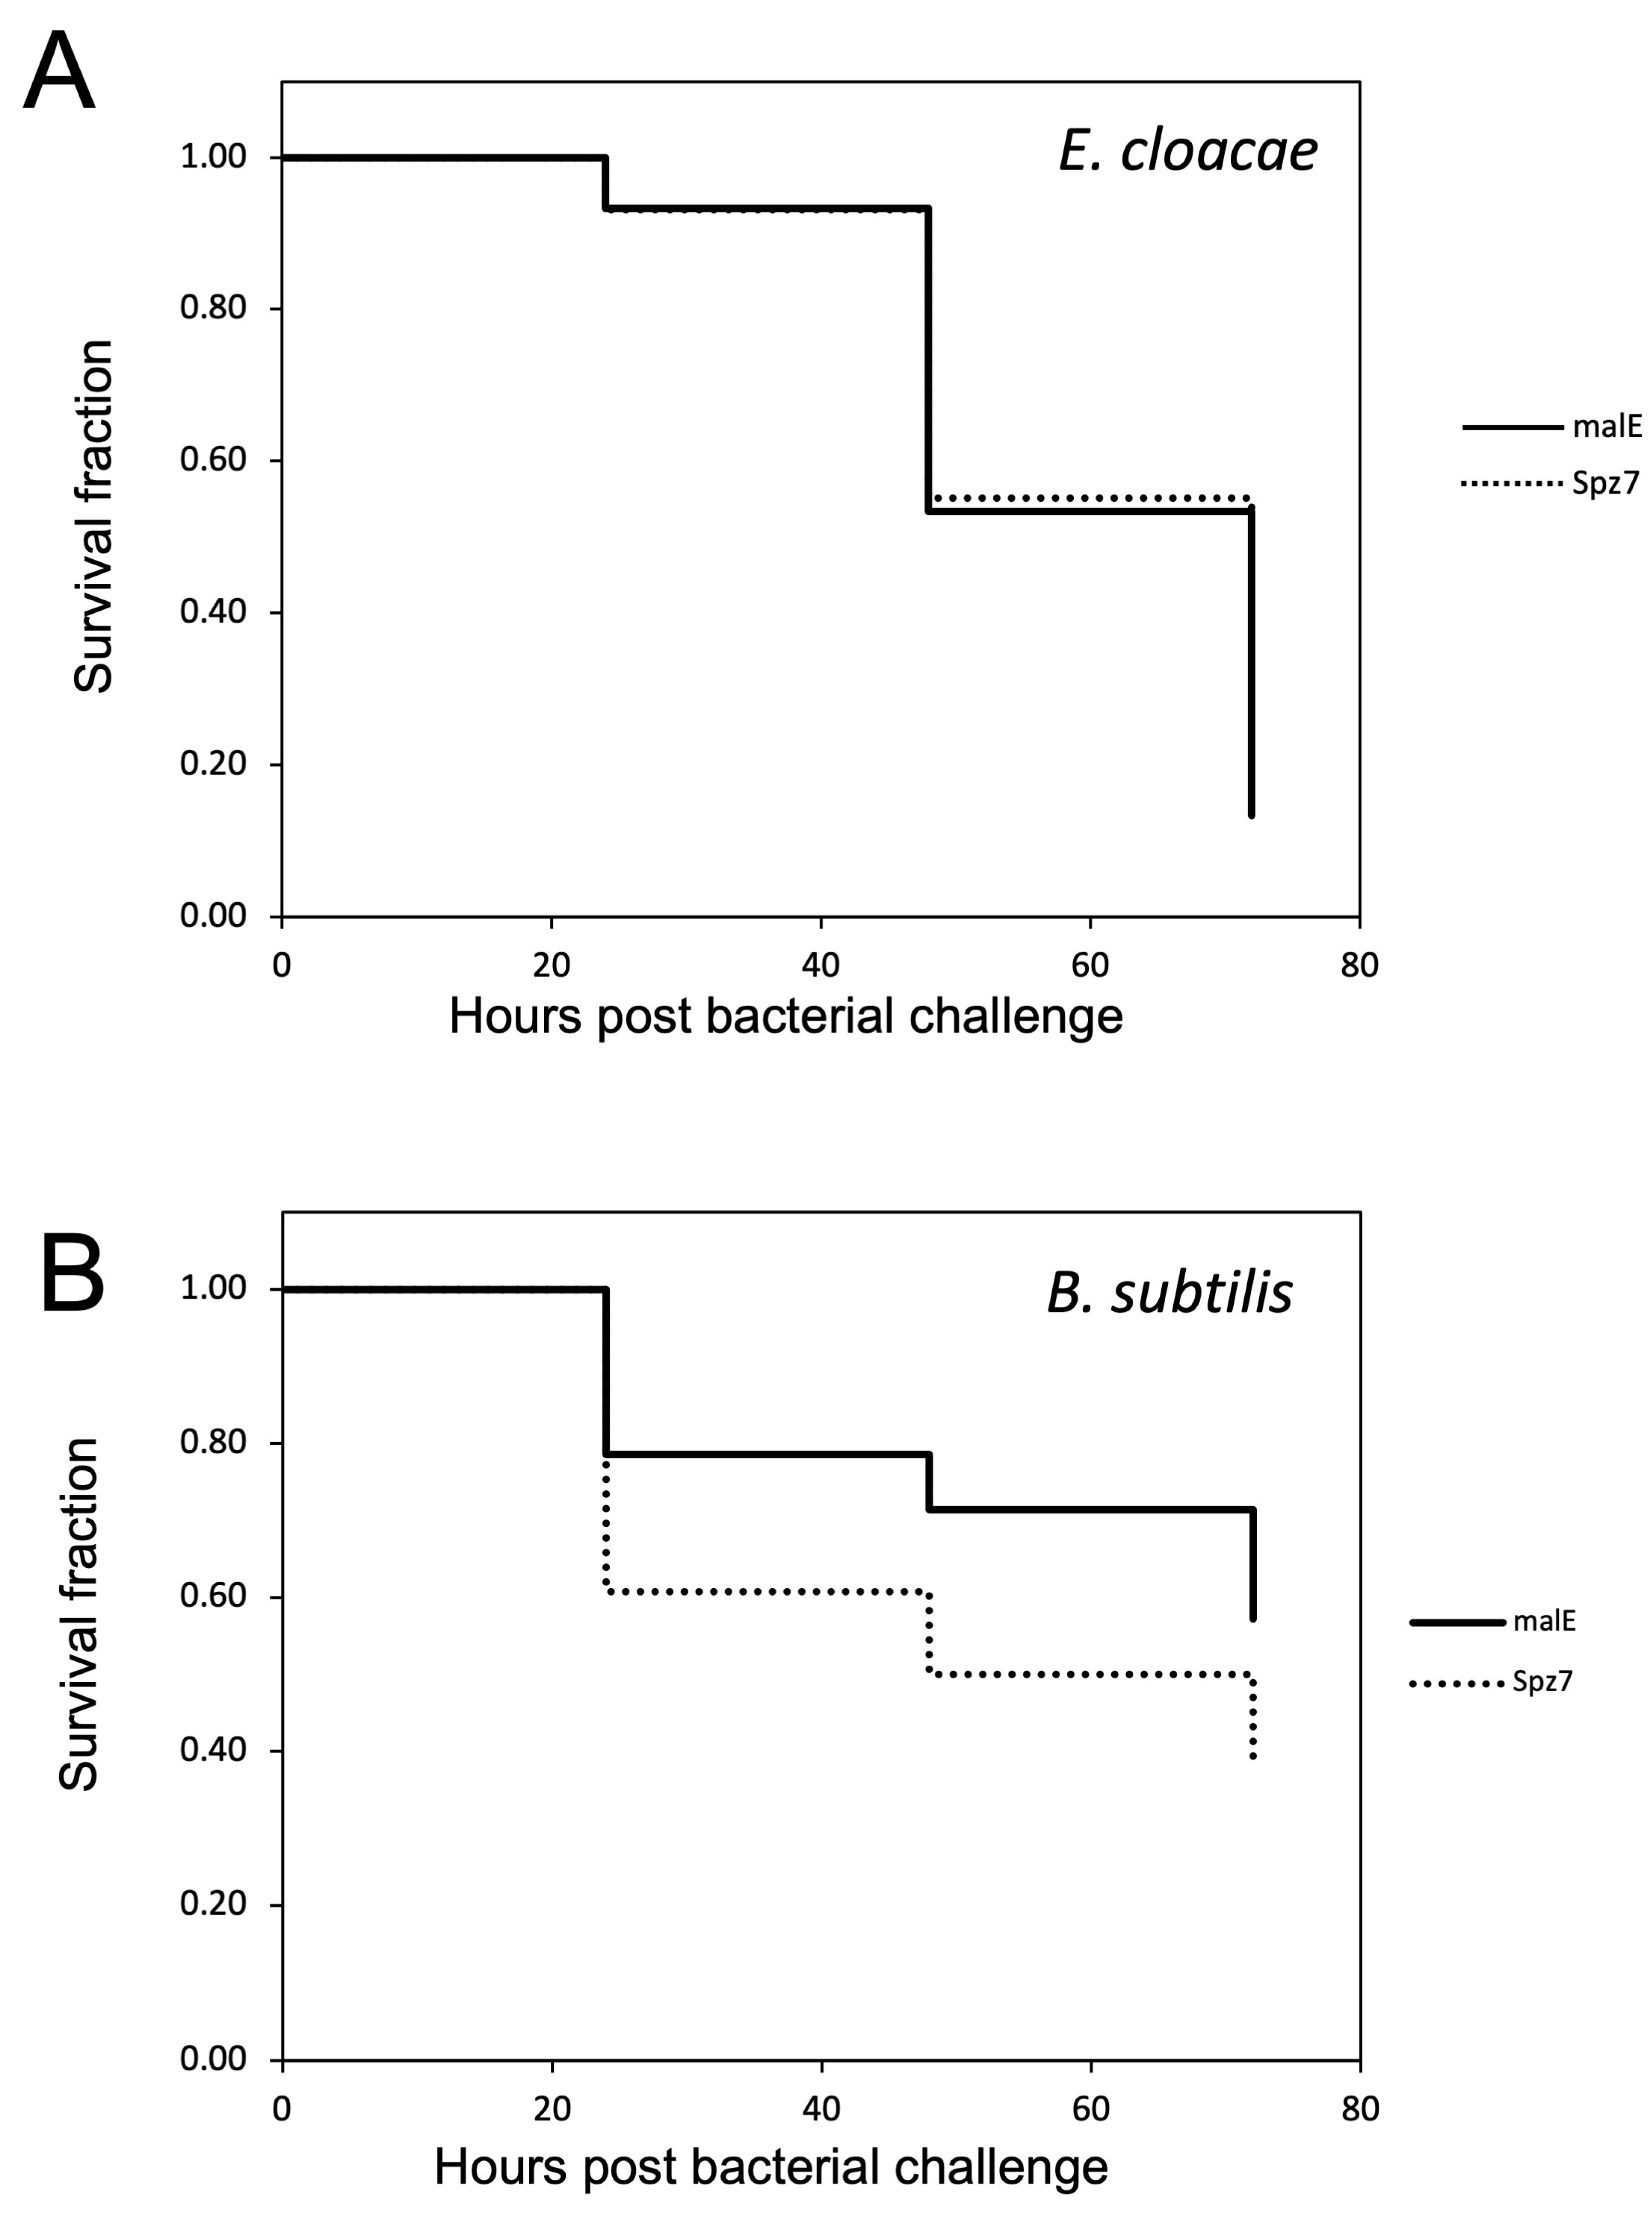
In the previous experiment, spz7 was shown to be involved in Cec2 and Cec3 induction by Ml. For further functional analysis of spz7, a survival assay using spz7 knockdown pupae was conducted as described in Section 2.1.4 (Figure 13). There was no difference in survival curves between control and spz7 knockdown pupae infected with E. cloacae (Figure 13A). In contrast, spz7 knockdown pupae infected with B. subtilis died earlier than the control pupae, but the difference was not significant (Figure 13B).

3. Discussion

In this study, to enhance our understanding of the mechanisms of immune responses in T. castaneum, especially AMP production mediated by the Toll pathway, we determined the Toll and spz genes involved in the induction of Cec2 and Cec3, which are Toll-pathway-dependent AMP genes. Through phylogenetic analysis, four candidate Toll genes were screened from seven Toll genes. Gene expression analysis showed that Toll3 and spz7 were induced by challenge with Ec, Ml, or Sc, suggesting their involvement in the immune function. Experiments in pupae subjected to RNAi revealed that Toll4 was involved in Cec2 and Cec3 induction by Ec, Ml, or Sc, whereas Toll3 acted synergistically with Toll4 in immune reactions against B. subtilis. In addition, spz7 was involved in Cec2 and Cec3 induction by Ml only, and the reduction in Cec2 and Cec3 expression was weaker in spz7 knockdown pupae than in Toll3 and Toll4 double-knockdown pupae, compared to that in the control. Furthermore, a survival assay showed that spz7 knockdown pupae succumbed to B. subtilis earlier than the control, but the difference was not significant.
Although Toll4 expression was not induced by microbial challenge, Toll4 knockdown significantly altered Cec2 and Cec3 expression levels at 24 h post-challenge with Ec, Ml, or Sc. Moreover, at 6 h post-challenge, Toll knockdown significantly reduced Cec2 induction by Ec and Cec3 induction by Ec and Ml. The reduction at 24 h post-challenge was approximately 30–70% to the control level. In addition, Toll3 and Toll4 double-knockdown severely reduced Cec2 and Cec3 induction at 6 and 24 h post-challenge with Ec, Ml, or Sc. These results suggest that Toll3 and Toll4 are mainly involved in the expression of Toll pathway-dependent AMP genes and that the two genes work redundantly. Structural analysis revealed that Toll proteins formed dimers, which in turn, function as signal transducers of Toll pathway signals [10,11,24]. We presumed that in T. castaneum, Toll3 and Toll4, homodimers redundantly participated in the signal transduction of Toll-pathway immune signals, leading to Cec2 and Cec3 induction, with Toll4 homodimers having a greater contribution than Toll3 homodimers. The survival assay showed that Toll3 and Toll4 double-knockdown pupae succumbed earlier to B. subtilis, but the degree was not as severe as that in IMD knockdown pupae. Dif1 and Dif2 double-knockdown pupae also succumbed earlier to B. subtilis, showing the same degree as that in Toll3 and Toll4 knockdown pupae, but this phenomenon was not observed in insects with knockdown of MyD88, Tule, or Pelle, which are intracellular components of the Toll pathway [15,16]. The reason may be the crosstalk between the intracellular components of the IMD and Toll pathways, which was reported in D. melanogaster and other insects [31,32].
Among the seven spz genes of T. castaneum, only spz7 was involved in Cec2 and Cec3 induction at 24 h after Ml challenge. Phylogenetic analysis showed that spz7 (Tc-spz7) was located in a clade next to Dm-spz1, which is related to Toll-pathway-dependent AMP gene expression [8]. However, the bootstrap values of the spz phylogenetic tree were lower than those of the Toll tree, suggesting that the sequences of spz genes varied. Sequence alignment results showed that the spz7 protein did not possess the cysteine residue used for the dimerization of spz proteins. A structural report of D. melanogaster spz showed that the forming cysteine-knot structure and dimerization of spz protein were indispensable for the interactions with Toll proteins to transduce immune signaling [21,22]. Considering these findings, we presumed that T. castaneum spz could function without dimerization, or there is a nucleotide sequence error in spz7, as the correct sequence should contain the cysteine residue required for dimerization.
As described above, Toll3 and Toll4 double-knockdown dramatically reduced Cec2 and Cec3 induction (over 90% reduction compared to that in the controls) at 24 h after microbial challenge (Ec, Ml, and Sc). Toll3 and Toll4 were shown to contribute to immune reactions against the two entomopathogenic bacteria to some extent. In addition, spz7 knockdown moderately reduced Cec2 and Cec3 expression (at most approximately 60% compared to that in the controls), which was induced by Ml only. Furthermore, the survival assay showed that spz7 did not contribute to the immune reaction against the two entomopathogenic bacteria. The Cec2 and Cec3 expression reduction ratio was different between Toll and spz genes. We presumed two hypotheses. One is that Toll functions as a direct recognition protein, such as the Toll-like receptor (TLR) protein [33]. TLR proteins in mammals directly bind to pathogen-derived structures, such as Gram-negative bacterial lipopolysaccharides, and viral DNA, and activate the innate immune reactions. Therefore, T. castaneum dimers consisting of Toll3 and Toll4 might function as a TLR while canonical immune signals aroused from PGRP and GNBP are transduced via spz and Toll complexes. The functional analysis of immune genes upstream of Toll and spz, such as PGRP-SA or serine proteases, could be a key for determining whether the hypothesis is true. If the upstream genes, in fact, do not function, the “Toll direct-recognition system” will function. The other hypothesis is that there are unidentified T. castaneum spz genes acting as a spz gene in D. melanogaster. As revealed by the sequence analysis of spz proteins in the present study, spz sequences might vary across species. In previous reports, seven spz genes were identified in the T. castaneum genome [30]. However, we presumed that there might be more spz genes in the T. castaneum genome. Owing to advances in sequencing devices, more accurate genome data can be constructed [34]. For example, the first genome sequence data of Apis mellifera (Hymenoptera; Apidae, Linnaeus, 1758) were published in 2006, and after several updates, the latest version of the A. mellifera genome is at chromosome level with very high continuity [35,36,37]. In comparison, the gene set data used in this study were released in 2007, and the latest version of the T. castaneum gene set was released in 2020 [30,38,39]. However, using only 2007 version gene set data, the gene set analysis focusing on immune-related genes was performed [30]. Screening and functional analysis of new spz genes in the new gene set can be conducted in future research to improve our knowledge of the immune system of T. castaneum.
In conclusion, we revealed that among nine Toll genes and seven spz genes, Toll3, Toll4, and spz7 were involved in Toll-dependent AMP gene induction by microbial challenge. Our findings also demonstrated differences in their degree of contribution to Cec2 and Cec3 induction and immune reactions against entomopathogenic bacteria. These findings improve our understanding of the immune system of non-Drosophila insect species and provide a new possible mechanism of AMP production reaction in insects.

4. Materials and Methods

4.1. Insect Rearing

T. castaneum was reared on whole wheat flour at 30 °C in the dark. For use in experiments, the pupae were staged as described in [14].

4.2. Microbes and Injections

Heat-killed E. coli DH5a, M. luteus ATCC4698, and S. cerevisiae S288C, which are representative microbes of Gram-negative bacteria, Gram-positive bacteria, and eukaryotes, respectively, were prepared as described in our previous paper [15]. Fifty nanoliters of Ec, Ml, or Sc suspension equivalent to 2.9 × 10⁸, 2.9 × 10⁷, and 6.3 × 10⁶ cells/mL in PBS, respectively, was injected using Nanoject II (Drummond Scientific Company, Broomall, PA, USA) into day-3 pupae pretreated with dsRNA or naïve day-3 pupae. For the survival assay, living E. cloacae and B. subtilis were prepared as described in our previous paper [14]. S. cerevisiae S288C was kindly gifted from Dr. T. Ushimaru of Shizuoka University. M. luteus ATCC4698 was supplied by the RIKEN Bioresource Center in Japan.

4.3. Gene Sequence Analysis

T. castaneum gene sequences used in the present study were retrieved from glean_tribolium.dna.fa and glean_tribolium.protein.fa compressed as TCGleanPrediction.tar.gz located in Tcas2.0/annotation/TCGleanPrediction data of reference genome version Tcas2.0 (able to access via FTP server, URL: ftp://ftp.hgsc.bcm.edu/Tcastaneum/ or “BCM-HGSC data” in the “Red Flour Beetle Genome Project” site (URL: https://www.hgsc.bcm.edu/arthropods/red-flour-beetle-genome-project) accessed on 10 January 2023) [30,38]. The accession IDs of the gene sequences used in the study are listed in Supplemental Table S1. Non-T. castaneum gene sequences were also retrieved from public databases using the accession IDs shown in Supplemental Table S1. Sequence alignments and phylogenetic tree construction were performed using ClustalW version 2.1 in the DNA Data Bank of Japan server (URL: https://www.ddbj.nig.ac.jp/services/clustalw-e.html; temporally halted at 27 December 2022, accessed on 10 January 2023) [40]. Alignment results of C-terminal spz were visualized using BOXSHADE with default settings (URL: http://arete.ibb.waw.pl/PL/html/boxshade.html, accessed on 10 January 2023) [41].

4.4. RNA Extraction and qRT-PCR

The total RNA extraction method was described in [14,15]. Briefly, 0.5 μg of quality checked total RNA was converted into first-strand cDNA using a PrimeScript RT Reagent Kit with gDNA Eraser (TaKaRa Bio Inc., Shiga, Japan), according to manufacturer’s instructions. qRT-PCR was performed using first-strand cDNA and a primer pair designed for target genes using the SYBR Premix Ex Taq Perfect Real Time Kit Tli RNAaseH Plus (TAKARA) and Thermal Cycler Dice Real Time System (Model TP800; TaKaRa Bio Inc.). The sequences of the primers for qRT-PCR are shown in Supplemental Table S2. The qRT-PCR conditions and the calculation method of mRNA levels of target genes are described in [14].

4.5. RNAi

RNAi was performed as described in our previous study [15]. Briefly, cDNA with T7 RNA polymerase promoter sequence, which was generated by conventional PCR, was used as a template for dsRNA synthesis using a MEGAscript RNAi Kit (Ambion, Waltham, MA, USA). Next, 100 ng of dsRNA for each target gene was used for experiments. The dsRNA was injected using Nanoject II into day-0 pupae, followed by incubation for 72 h. The incubated pupae were then examined for knockdown efficiency or challenged with microbes. dsRNA with a partial maltose binding protein E (malE) sequence was used as a negative control. The sequences of primer pairs used in the synthesis of cDNA template are shown in Supplemental Table S2.

4.6. Survival Assay

Survival assays were performed as described in our previous paper [15]. The incubated pupae pretreated with dsRNA were injected with live E. cloacae (50 nl, A600 = 0.1) or B. subtilis (100 nl, A600 = 3.0). The number of surviving pupae was counted every 24 h. Data are shown in Kaplan–Meier plots, and statistical analysis (the Gehan–Breslow–Wilcoxon test) was performed using a software package, Ekuseru-Toukei 2010 (Social Survey Research Information Co., Ltd., Tokyo, Japan). E. cloacae and B. subtilis were generous gifts from Dr. Y. Yagi of Nagoya University and by the RIKEN Bioresource Center in Japan, respectively.

4.7. List of Abbreviations

The list of all abbreviations in this study is shown in Supplemental Table S3.

Supplementary Materials

All supplemental materials are available in figshare: https://doi.org/10.6084/m9.figshare.c.6342602.

Author Contributions

Conceptualization, K.M., and K.Y.; methodology, D.K., K.M., and K.Y.; validation, D.K., K.M., and K.Y.; formal analysis, D.K., and K.Y.; resources, K.M.; data curation, D.K., K.M., and K.Y.; writing—original draft preparation, K.Y.; writing—review and editing, K.Y.; visualization, D.K., K.M., and K.Y.; supervision, K.M., and K.Y.; project administration, K.M., and K.Y.; funding acquisition, K.Y. All authors have read and agreed to the published version of the manuscript.

Funding

This work was supported by JSPS KAKENHI Grant Numbers 21K19126 to K.Y.

Institutional Review Board Statement

Not applicable.

Informed Consent Statement

Not applicable.

Data Availability Statement

All data in this study are available in figshare as described in “Supplementary Materials”.

Acknowledgments

We thank Y. Yagi, T. Ushimaru, A. Miyanoshita, and M. Murata for providing precious research materials.

Conflicts of Interest

The authors declare no conflict of interest.

References

  1. Lemaitre, B.; Hoffmann, J. The Host Defense of Drosophila melanogaster. Annu. Rev. Immunol. 2007, 25, 697–743. [Google Scholar] [CrossRef] [PubMed] [Green Version]
  2. Ferrandon, D.; Imler, J.-L.; Hetru, C.; Hoffmann, J.A. The Drosophila Systemic Immune Response: Sensing and Signalling during Bacterial and Fungal Infections. Nat. Rev. Immunol. 2007, 7, 862–874. [Google Scholar] [CrossRef]
  3. De Gregorio, E.; Spellman, P.T.; Rubin, G.M.; Lemaitre, B. Genome-Wide Analysis of the Drosophila Immune Response by Using Oligonucleotide Microarrays. Proc. Natl. Acad. Sci. USA 2001, 98, 12590–12595. [Google Scholar] [CrossRef] [Green Version]
  4. De Gregorio, E.; Spellman, P.T.; Tzou, P.; Rubin, G.M.; Lemaitre, B. The Toll and Imd Pathways Are the Major Regulators of the Immune Response in Drosophila. EMBO J. 2002, 21, 2568–2579. [Google Scholar] [CrossRef] [Green Version]
  5. Gobert, V.; Gottar, M.; Matskevich, A.A.; Rutschmann, S.; Royet, J.; Belvin, M.; Hoffmann, J.A.; Ferrandon, D. Dual Activation of the Drosophila Toll Pathway by Two Pattern Recognition Receptors. Science 2003, 302, 2126–2130. [Google Scholar] [CrossRef] [PubMed] [Green Version]
  6. Wang, L.; Weber, A.N.R.; Atilano, M.L.; Filipe, S.R.; Gay, N.J.; Ligoxygakis, P. Sensing of Gram-Positive Bacteria in Drosophila: GNBP1 Is Needed to Process and Present Peptidoglycan to PGRP-SA. EMBO J. 2006, 25, 5005–5014. [Google Scholar] [CrossRef] [PubMed] [Green Version]
  7. Gottar, M.; Gobert, V.; Matskevich, A.A.; Reichhart, J.-M.; Wang, C.; Butt, T.M.; Belvin, M.; Hoffmann, J.A.; Ferrandon, D. Dual Detection of Fungal Infections in Drosophila via Recognition of Glucans and Sensing of Virulence Factors. Cell 2006, 127, 1425–1437. [Google Scholar] [CrossRef] [PubMed] [Green Version]
  8. Weber, A.N.R.; Tauszig-Delamasure, S.; Hoffmann, J.A.; Lelièvre, E.; Gascan, H.; Ray, K.P.; Morse, M.A.; Imler, J.-L.; Gay, N.J. Binding of the Drosophila Cytokine Spätzle to Toll Is Direct and Establishes Signaling. Nat. Immunol. 2003, 4, 794–800. [Google Scholar] [CrossRef]
  9. Jang, I.-H.; Chosa, N.; Kim, S.-H.; Nam, H.-J.; Lemaitre, B.; Ochiai, M.; Kambris, Z.; Brun, S.; Hashimoto, C.; Ashida, M.; et al. A Spätzle-Processing Enzyme Required for Toll Signaling Activation in Drosophila Innate Immunity. Dev. Cell 2006, 10, 45–55. [Google Scholar] [CrossRef] [Green Version]
  10. Gangloff, M.; Murali, A.; Xiong, J.; Arnot, C.J.; Weber, A.N.; Sandercock, A.M.; Robinson, C.V.; Sarisky, R.; Holzenburg, A.; Kao, C.; et al. Structural Insight into the Mechanism of Activation of the Toll Receptor by the Dimeric Ligand Spätzle. J. Biol. Chem. 2008, 283, 14629–14635. [Google Scholar] [CrossRef]
  11. Hu, X.; Yagi, Y.; Tanji, T.; Zhou, S.; Ip, Y.T. Multimerization and Interaction of Toll and Spätzle in Drosophila. Proc. Natl. Acad. Sci. USA 2004, 101, 9369–9374. [Google Scholar] [CrossRef] [PubMed] [Green Version]
  12. Valanne, S.; Wang, J.-H.; Rämet, M. The Drosophila Toll Signaling Pathway. J. Immunol. 2011, 186, 649–656. [Google Scholar] [CrossRef] [PubMed] [Green Version]
  13. Kleino, A.; Silverman, N. The Drosophila IMD Pathway in the Activation of the Humoral Immune Response. Dev. Comp. Immunol. 2014, 42, 25–35. [Google Scholar] [CrossRef] [PubMed] [Green Version]
  14. Yokoi, K.; Koyama, H.; Minakuchi, C.; Tanaka, T.; Miura, K. Antimicrobial Peptide Gene Induction, Involvement of Toll and IMD Pathways and Defense against Bacteria in the Red Flour Beetle, Tribolium castaneum. Results Immunol. 2012, 2, 72–82. [Google Scholar] [CrossRef] [Green Version]
  15. Yokoi, K.; Koyama, H.; Ito, W.; Minakuchi, C.; Tanaka, T.; Miura, K. Involvement of NF-ΚB Transcription Factors in Antimicrobial Peptide Gene Induction in the Red Flour Beetle, Tribolium castaneum. Dev. Comp. Immunol. 2012, 38, 342–351. [Google Scholar] [CrossRef]
  16. Yokoi, K.; Kato, D.; Miura, K. Pelle and Tube Contribute to the Toll Pathway-Dependent Antimicrobial Peptide Production in the Red Flour Beetle, Tribolium castaneum (Coleoptera: Tenebrionidae). Eur. J. Entomol. 2022, 119, 111–121. [Google Scholar] [CrossRef]
  17. Koyama, H.; Kato, D.; Minakuchi, C.; Tanaka, T.; Yokoi, K.; Miura, K. Peptidoglycan Recognition Protein Genes and Their Roles in the Innate Immune Pathways of the Red Flour Beetle, Tribolium castaneum. J. Invertebr. Pathol. 2015, 132, 86–100. [Google Scholar] [CrossRef]
  18. Yokoi, K.; Ito, W.; Kato, D.; Miura, K. RNA Interference-Based Characterization of Caspar, DREDD and FADD Genes in Immune Signaling Pathways of the Red Flour Beetle, Tribolium castaneum (Coleoptera: Tenebrionidae). Eur. J. Entomol. 2022, 119, 23–35. [Google Scholar] [CrossRef]
  19. Gay, N.J.; Keith, F.J. Drosophila Toll and IL-1 Receptor. Nature 1991, 351, 355–356. [Google Scholar] [CrossRef] [PubMed]
  20. Medzhitov, R.; Preston-Hurlburt, P.; Janeway, C.A. A Human Homologue of the Drosophila Toll Protein Signals Activation of Adaptive Immunity. Nature 1997, 388, 394–397. [Google Scholar] [CrossRef]
  21. Mizuguchi, K.; Parker, J.S.; Blundell, T.L.; Gay, N.J. Getting Knotted: A Model for the Structure and Activation of Spätzle. Trends Biocheml. Sci. 1998, 23, 239–242. [Google Scholar] [CrossRef] [PubMed]
  22. Weber, A.N.R.; Gangloff, M.; Moncrieffe, M.C.; Hyvert, Y.; Imler, J.-L.; Gay, N.J. Role of the Spatzle Pro-Domain in the Generation of an Active Toll Receptor Ligand. J. Biol. Chem. 2007, 282, 13522–13531. [Google Scholar] [CrossRef] [PubMed] [Green Version]
  23. Medzhitov, R.; Preston-Hurlburt, P.; Kopp, E.; Stadlen, A.; Chen, C.; Ghosh, S.; Janeway, C.A. MyD88 Is an Adaptor Protein in the HToll/IL-1 Receptor Family Signaling Pathways. Mol. Cell 1998, 2, 253–258. [Google Scholar] [CrossRef]
  24. Weber, A.N.R.; Moncrieffe, M.C.; Gangloff, M.; Imler, J.-L.; Gay, N.J. Ligand-Receptor and Receptor-Receptor Interactions Act in Concert to Activate Signaling in the Drosophila Toll Pathway. J. Biol. Chem. 2005, 280, 22793–22799. [Google Scholar] [CrossRef] [PubMed] [Green Version]
  25. Yu, B.; Sang, Q.; Pan, G.; Li, C.; Zhou, Z. A Toll-Spätzle Pathway in the Immune Response of Bombyx mori. Insects 2020, 11, 586. [Google Scholar] [CrossRef] [PubMed]
  26. Zhong, X.; Xu, X.-X.; Yi, H.-Y.; Lin, C.; Yu, X.-Q. A Toll-Spätzle Pathway in the Tobacco Hornworm, Manduca sexta. Insect Biochem. Mol. Biol. 2012, 42, 514–524. [Google Scholar] [CrossRef] [Green Version]
  27. An, C.; Jiang, H.; Kanost, M.R. Proteolytic Activation and Function of the Cytokine Spätzle in the Innate Immune Response of a Lepidopteran Insect, Manduca sexta. FEBS J. 2010, 277, 148–162. [Google Scholar] [CrossRef] [Green Version]
  28. Jang, H.A.; Patnaik, B.B.; Ali Mohammadie Kojour, M.; Kim, B.B.; Bae, Y.M.; Park, K.B.; Lee, Y.S.; Jo, Y.H.; Han, Y.S. TmSpz-like Plays a Fundamental Role in Response to E. coli but Not S. aureus or C. albican Infection in Tenebrio molitor via Regulation of Antimicrobial Peptide Production. Int. J. Mol. Sci. 2021, 22, 10888. [Google Scholar] [CrossRef]
  29. Ali Mohammadie Kojour, M.; Edosa, T.T.; Jang, H.A.; Keshavarz, M.; Jo, Y.H.; Han, Y.S. Critical Roles of Spätzle5 in Antimicrobial Peptide Production Against Escherichia coli in Tenebrio molitor Malpighian Tubules. Front. Immunol. 2021, 12, 760475. [Google Scholar] [CrossRef]
  30. Zou, Z.; Evans, J.D.; Lu, Z.; Zhao, P.; Williams, M.; Sumathipala, N.; Hetru, C.; Hultmark, D.; Jiang, H. Comparative Genomic Analysis of the Tribolium Immune System. Genome Biol. 2007, 8, R177. [Google Scholar] [CrossRef]
  31. Nishide, Y.; Kageyama, D.; Yokoi, K.; Jouraku, A.; Tanaka, H.; Futahashi, R.; Fukatsu, T. Functional Crosstalk across IMD and Toll Pathways: Insight into the Evolution of Incomplete Immune Cascades. Proc. Biol. Sci. 2019, 286, 20182207. [Google Scholar] [CrossRef] [Green Version]
  32. Horng, T.; Medzhitov, R. Drosophila MyD88 Is an Adapter in the Toll Signaling Pathway. Proc. Natl. Acad. Sci. USA 2001, 98, 12654–12658. [Google Scholar] [CrossRef] [PubMed] [Green Version]
  33. Leulier, F.; Lemaitre, B. Toll-like Receptors—Taking an Evolutionary Approach. Nat. Rev. Genet. 2008, 9, 165–178. [Google Scholar] [CrossRef] [PubMed] [Green Version]
  34. Pervez, M.T.; ul Hasnain, M.J.; Abbas, S.H.; Moustafa, M.F.; Aslam, N.; Shah, S.S.M. A Comprehensive Review of Performance of Next-Generation Sequencing Platforms. Biomed Res. Int. 2022, 2022, 3457806. [Google Scholar] [CrossRef]
  35. Weinstock, G.M.; Robinson, G.E.; Gibbs, R.A.; Weinstock, G.M.; Weinstock, G.M.; Robinson, G.E.; Worley, K.C.; Evans, J.D.; Maleszka, R.; Robertson, H.M.; et al. Insights into Social Insects from the Genome of the Honeybee Apis mellifera. Nature 2006, 443, 931–949. [Google Scholar] [CrossRef] [Green Version]
  36. Wallberg, A.; Bunikis, I.; Pettersson, O.V.; Mosbech, M.-B.; Childers, A.K.; Evans, J.D.; Mikheyev, A.S.; Robertson, H.M.; Robinson, G.E.; Webster, M.T. A Hybrid de Novo Genome Assembly of the Honeybee, Apis mellifera, with Chromosome-Length Scaffolds. BMC Genom. 2019, 20, 275. [Google Scholar] [CrossRef] [PubMed] [Green Version]
  37. Elsik, C.G.; Worley, K.C.; Bennett, A.K.; Beye, M.; Camara, F.; Childers, C.P.; de Graaf, D.C.; Debyser, G.; Deng, J.; Devreese, B.; et al. Finding the Missing Honey Bee Genes: Lessons Learned from a Genome Upgrade. BMC Genom. 2014, 15, 86. [Google Scholar] [CrossRef] [PubMed] [Green Version]
  38. Tribolium Genome Sequencing Consortium; Richards, S.; Gibbs, R.A.; Herndon, N.; Weinstock, G.M.; Brown, S.J.; Denell, R.; Beeman, R.W.; Gibbs, R. The Genome of the Model Beetle and Pest Tribolium castaneum. Nature 2008, 452, 949–955. [Google Scholar] [CrossRef] [Green Version]
  39. Herndon, N.; Shelton, J.; Gerischer, L.; Ioannidis, P.; Ninova, M.; Dönitz, J.; Waterhouse, R.M.; Liang, C.; Damm, C.; Siemanowski, J.; et al. Enhanced Genome Assembly and a New Official Gene Set for Tribolium castaneum. BMC Genom. 2020, 21, 47. [Google Scholar] [CrossRef] [Green Version]
  40. Thompson, J.D.; Higgins, D.G.; Gibson, T.J. CLUSTAL W: Improving the Sensitivity of Progressive Multiple Sequence Alignment through Sequence Weighting, Position-Specific Gap Penalties and Weight Matrix Choice. Nucleic Acids Res. 1994, 22, 4673–4680. [Google Scholar] [CrossRef]
  41. Albà, M. Making Alignments Prettier. Genome Biol. 2000, 1, reports2047. [Google Scholar] [CrossRef]
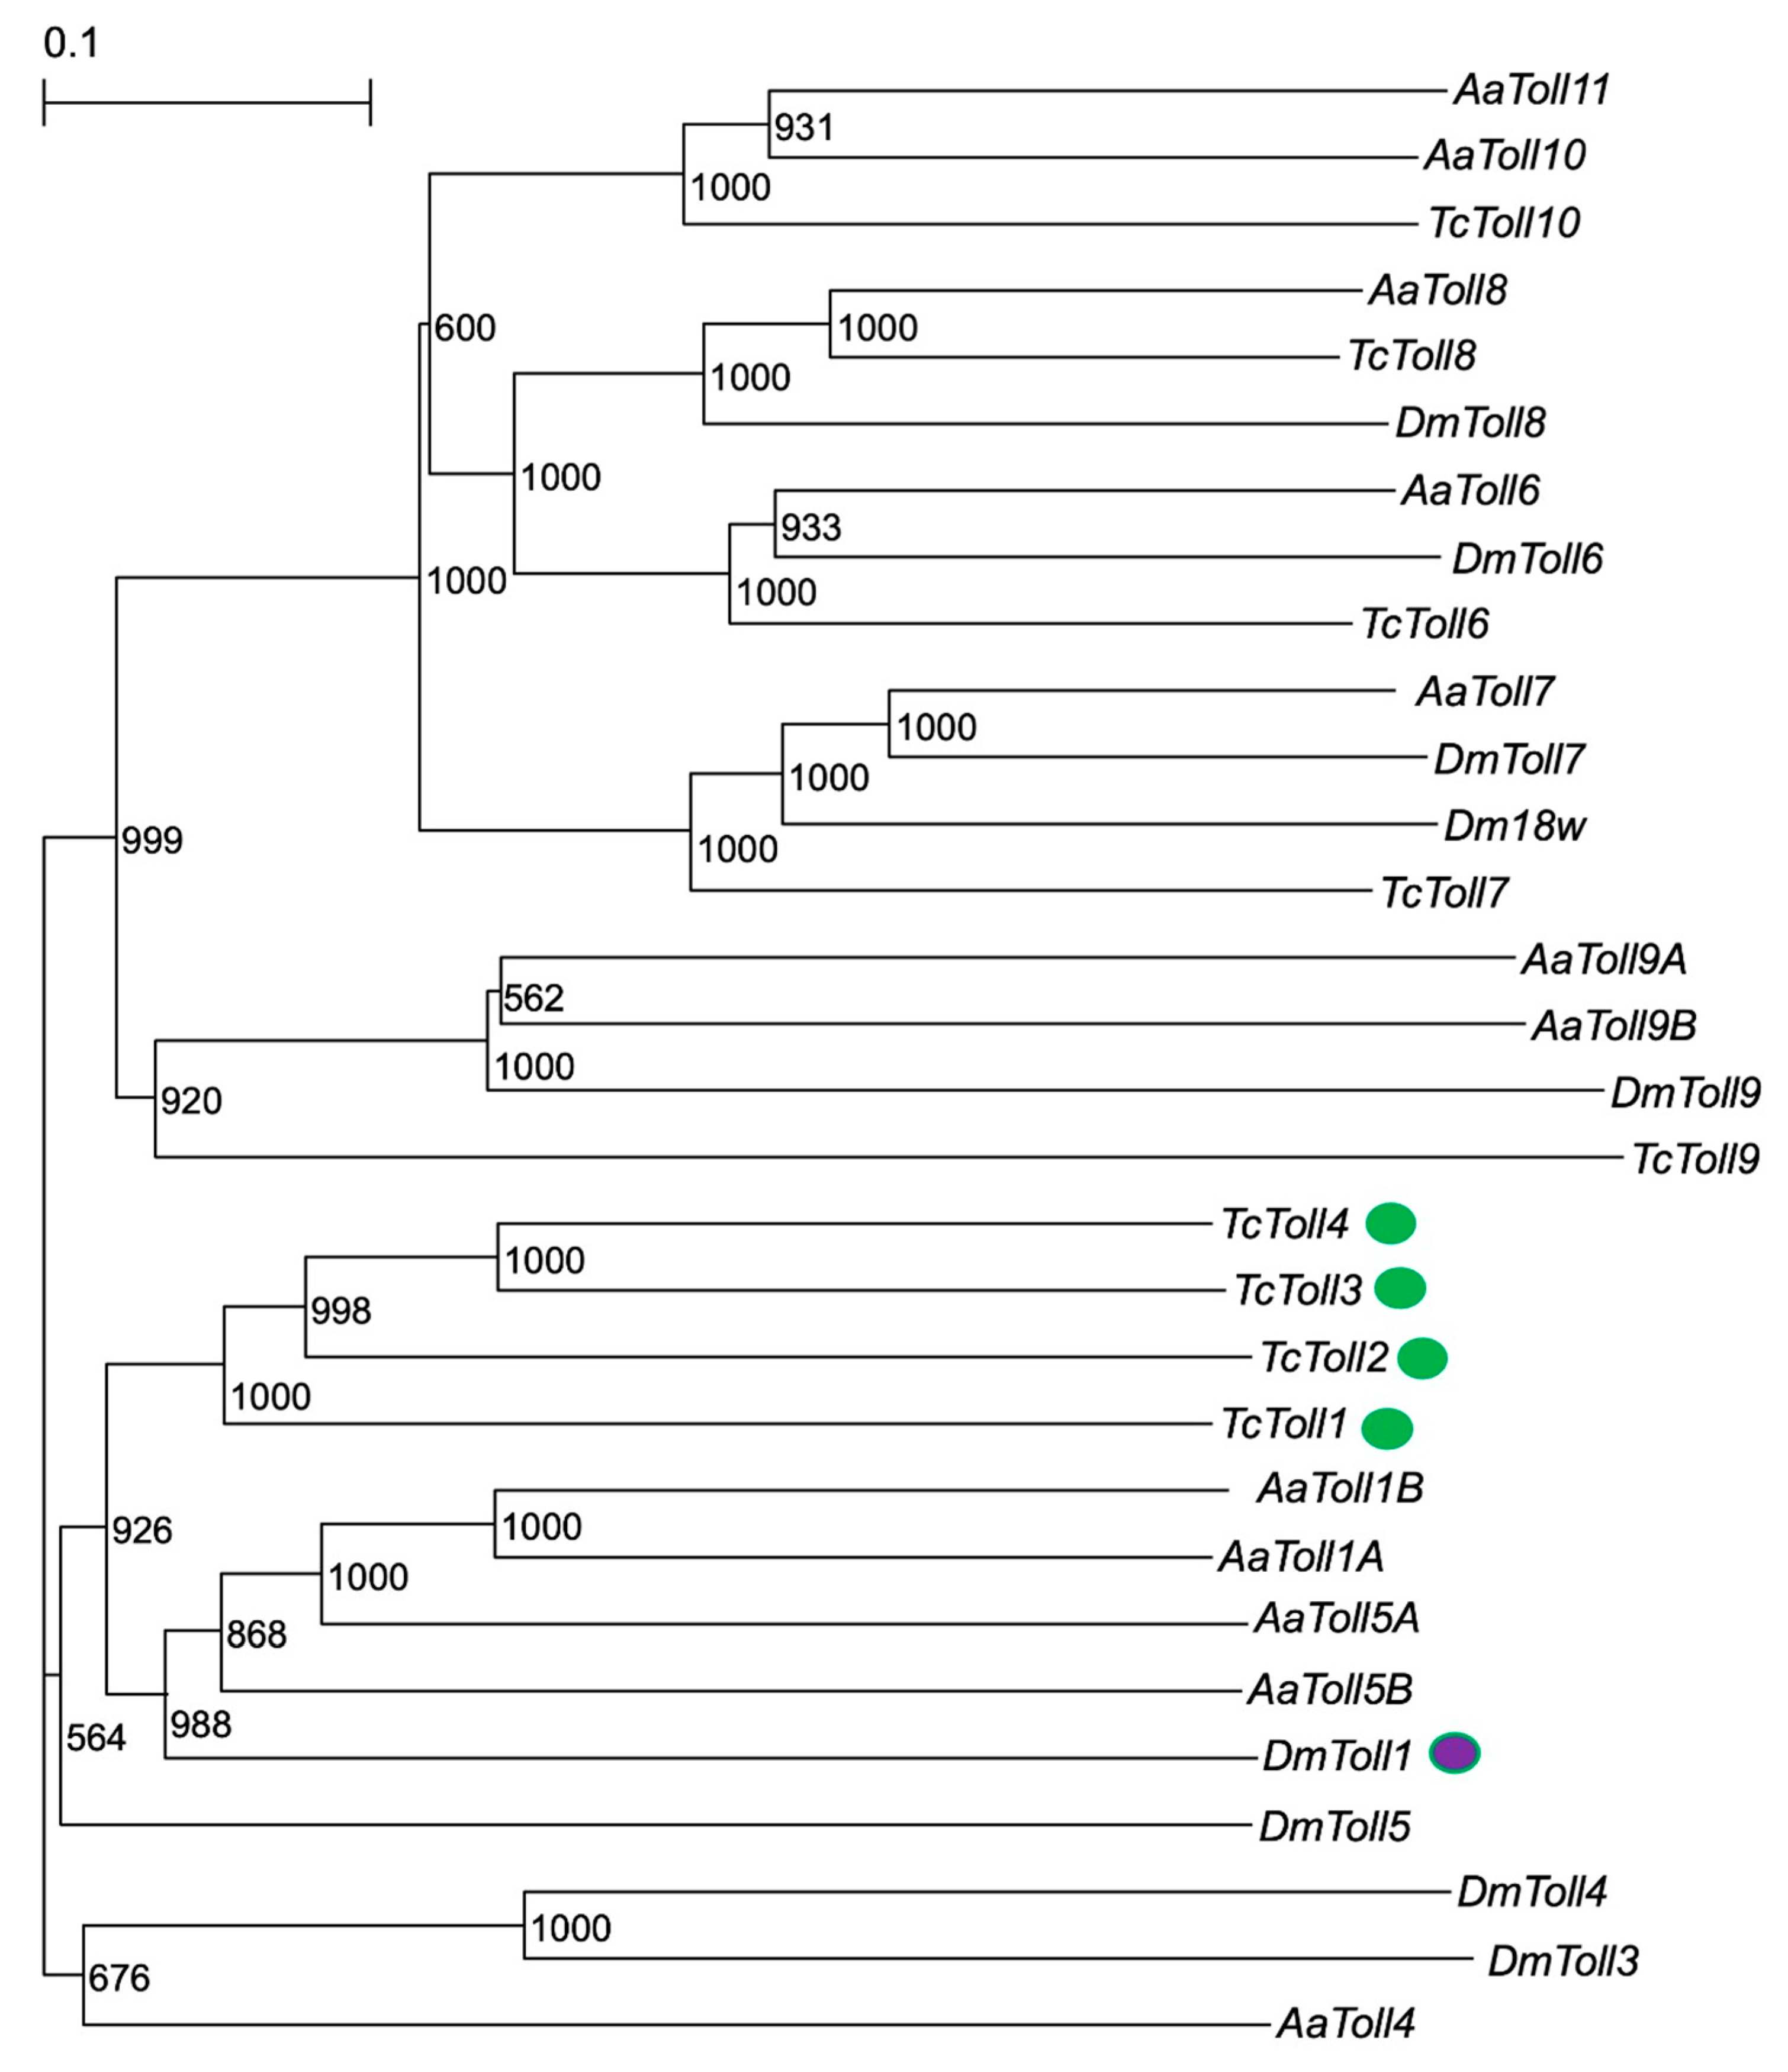
Figure 1. Phylogenetic analysis of T. castaneum Toll (TcToll), D. melanogaster Toll (DmToll), and A. aegypti Toll (AaToll). The accession IDs of the Toll sequences used in the tree are shown in Supplemental Table S1. Numbers on branches indicates bootstrap values. Purple and green objects indicate Dm-Toll1 and TcToll1−4, respectively.
Ijms 24 01523 g001
Figure 2. mRNA expression levels of Toll1 (A), Toll2 (B), Toll3 (C), and Toll4 (D) after challenge with three types of microbe. Day-3 pupae were challenged with heat-killed E. coli (Ec), M. luteus (Ml), or S. cerevisiae (Sc). The relative mRNA levels of Toll1 (A), Toll2 (B), Toll3 (C), and Toll4 (D) in the pupae were measured at 6 and 24 h post-injection. Unchallenged (Uc) and phosphate-buffered saline (PBS) injected pupae were used as negative controls. The mRNA amounts of the two genes are shown as relative values to ribosomal protein L32 (RPL32) levels in the same samples. Experiments with three animals were independently repeated three times, and each column represents the mean ± S.D. Asterisks and double-asterisks indicate p < 0.05 and p < 0.01 of Student’s t-test compared to Uc samples, respectively.
Ijms 24 01523 g002
Figure 3. Effect of Toll knockdown on Cec2 induction. mRNA amount of Cec2 in pupae pre-treated with either malE dsRNA (open bars, control) or Toll1, Toll2, Toll3, or Toll4 dsRNA (shaded bars) after challenge with either (A) E. coli (Ec), (B) M. luteus (Ml), or (C) S. cerevisiae (Sc). Day-3 pupae were challenged with heat-killed Ec, Ml, or Sc. The relative mRNA levels of Cec2 in the pupae at 6 or 24 h post injection were measured. The mRNA levels of the genes are shown as relative values to RPL32 levels in the same samples. Experiments involving three animals were independently repeated three times, and each column represents the mean ± S.D. Asterisks and double-asterisks indicate p < 0.05 and p < 0.01 compared to Uc samples, respectively, according to Student’s t-test.
Ijms 24 01523 g003
Figure 4. Effect of Toll gene knockdown on Cec3 induction. mRNA level of Cec3 in pupae treated with either malE dsRNA (open bars, control) or Toll1, Toll2, Toll3, or Toll4 dsRNA (shaded bars) after challenge with either Ec (A), Ml (B), or Sc (C). The methods of sample preparation and mRNA level measurement were the same as those described in Figure 3. Experiments with three animals were independently repeated three times, and each column represents the mean ± S.D. Asterisks and double-asterisks indicate p < 0.05 and p < 0.01 compared to Uc samples, respectively, according to Student’s t-test.
Ijms 24 01523 g004
Figure 5. Effect of double knockdown of two Toll genes on Cec2 induction. mRNA levels of Cec2 in pupae treated with malE dsRNA (open bars, control) and pupae with double knockdown (check marked) of Toll1−4 genes (shaded bars) after challenge with either Ec (A), Ml (B), or Sc (C). The methods of sample preparation and mRNA level measurement were the same as those described in Figure 3. Experiments with three animals were independently repeated three times, and each column represents the mean ± S.D. Asterisks and double-asterisks indicate p < 0.05 and p < 0.01 compared to Uc samples, respectively, according to Student’s t-test.
Ijms 24 01523 g005
Figure 6. Effect of double knockdown of Toll genes on Cec3 induction. mRNA levels of Cec3 in pupae treated with malE dsRNA (open bars, control) and pupae with double knockdown (check marked) of Toll1−4 genes (shaded bars) after challenge with either Ec (A), Ml (B), or Sc (C). The methods of sample preparation and mRNA level measurement were the same as those described in Figure 3. Experiments with three animals were independently repeated three times, and each column represents the mean ± S.D. Asterisks and double-asterisks indicate p < 0.05 and p < 0.01 compared to Uc samples, respectively, according to Student’s t-test.
Ijms 24 01523 g006
Figure 7. Effects of Toll3 and Toll4 double knockdown on host defenses against two model bacterial pathogens. On day 0, day-3 pupae pre-injected with the respective dsRNAs (malE dsRNA-treated pupae and IMD dsRNA-treated pupae were used as controls) were challenged with E. cloacae (A) or B. subtilis (B), and the survival of the pupae was monitored and recorded every 24 h. Results are shown in Kaplan–Meier plots. Asterisks and double-asterisks indicate p < 0.05 and p < 0.01, respectively, according to the Gehan–Breslow–Wilcoxon test.
Ijms 24 01523 g007
Figure 8. Phylogenetic analysis of spz protein and sequence alignments of spz C terminal sequences. (A) A phylogenetic tree was constructed using spz protein sequences of T. castaneum (Tc-spz), D. melanogaster (Dm-spz), A. gambiae (Ag-spz), A. aegypti (Aa-spz), and M. sexta (Ms-spz) (the accession IDs are listed in Supplemental Table S1). Numbers on branches indicate bootstrap values. (B) Sequence alignment results of 120 amino acid sequences from spz C-terminal (Supplemental Data S1) are shown using BoxShade. White letters in black and gray indicate completely matched or similar residues among the sequences, respectively. Dashed squares indicate proteolytic cleavage sites of arginine residues. The numbers 1, 2, and 3 (bold boxes) above cysteine residues indicate the residues predicted to form the disulfide bond essential for cysteine binding, whereas the number 4 indicates the residue predicted to form dimers of spz proteins.
Ijms 24 01523 g008aIjms 24 01523 g008b
Figure 9. mRNA levels of spzl1 (A), spz2 (B), spz3 (C), spz4 (D), spz5 (E), spz6 (F), and spz7 (G) after challenge with three microbial species. The mRNA levels of the genes are shown as relative values to RPL32 mRNA levels in the same samples. Experiments with three animals were independently repeated three times, and each column represents the mean ± S.D. Asterisks indicate p < 0.05 compared to Uc samples, according to Student’s t-test.
Ijms 24 01523 g009
Figure 10. Effect of knockdown of all seven spz genes on Cec2 (A) and Cec3 (B) induction by Ec, Ml and, Sc. mRNA levels of Cec2 (A) and Cec3 (B) in pupae pretreated with malE dsRNA (control) and all seven spz dsRNAs (spz All) at 24 h post-challenge with Ec, Ml, or Sc. The mRNA levels of the genes are shown as relative values to RPL32 mRNA levels in the same samples. Experiments with three animals were independently repeated three times, and each column represents the mean ± S.D. Asterisks indicate p < 0.05 compared to malE dsRNA-treated control samples, according to Student’s t-test.
Ijms 24 01523 g010
Figure 11. Effect of knockdown of six spz genes on Cec2 (A) and Cec3 (B) induction by M. luteus (Ml). The mRNA levels of Cec2 (A,B) and Cec3 (C,D) were measured in pupae pretreated with malE dsRNA (control), all seven spz dsRNAs (spz All, control), or six spz dsRNAs (e.g., spz(All-3) indicates knockdown of spz1, 2, 4, 5, 6, and 7) at 24 h after Ml challenge. The mRNA levels of the genes are shown as relative values to RPL32 mRNA levels in the same samples. Experiments with three animals were independently repeated three times, and each column represents the mean ± S.D. Asterisks and double-asterisks indicate p < 0.05 and p < 0.01 (simultaneous confidence interval) compared to malE dsRNA-treated samples (P (vs. malE)) or spzAll samples (P (vs. spz1–7)), respectively, according to Tukey’s honestly significant difference test. The P (vs. spz1–7) row was omitted in (A,C) because the Cec2 or Cec3 mRNA level in spz(All-1) and spz(All-2) pupae was not significantly different from that in spz All pupae.
Ijms 24 01523 g011
Figure 12. Effect of Spz7 knockdown on Cec2 (A) and Cec3 (B) induction at 24 h post-challenge. The mRNA levels of Cec2 (A) and Cec3 (B) in spz7 knockdown or control (malE dsRNA-treated) pupae were measured. The detailed procedure was the same as that described in Figure 10. Experiments with three animals were independently repeated three times, and each column represents the mean ± S.D. Asterisks indicate p < 0.05 compared to malE dsRNA-treated control samples, according to Student’s t-test.
Ijms 24 01523 g012
Figure 13. Effects of spz7 knockdown on host defense against two model bacterial pathogens, E. cloacae (A) or B. subtilis (B). The survival of pupae was monitored and recorded every 24 h. The procedure of the assay was the same as that presented in Figure 7. There was no significant difference in survival between control (malE dsRNA-treated) and spz7 knockdown pupae (p > 0.05, according to the Gehan–Breslow–Wilcoxon test).
Ijms 24 01523 g013
Disclaimer/Publisher’s Note: The statements, opinions and data contained in all publications are solely those of the individual author(s) and contributor(s) and not of MDPI and/or the editor(s). MDPI and/or the editor(s) disclaim responsibility for any injury to people or property resulting from any ideas, methods, instructions or products referred to in the content.