
The Molecular Docking of MAX Fungal Effectors with Plant HMA Domain-Binding Proteins


Abstract
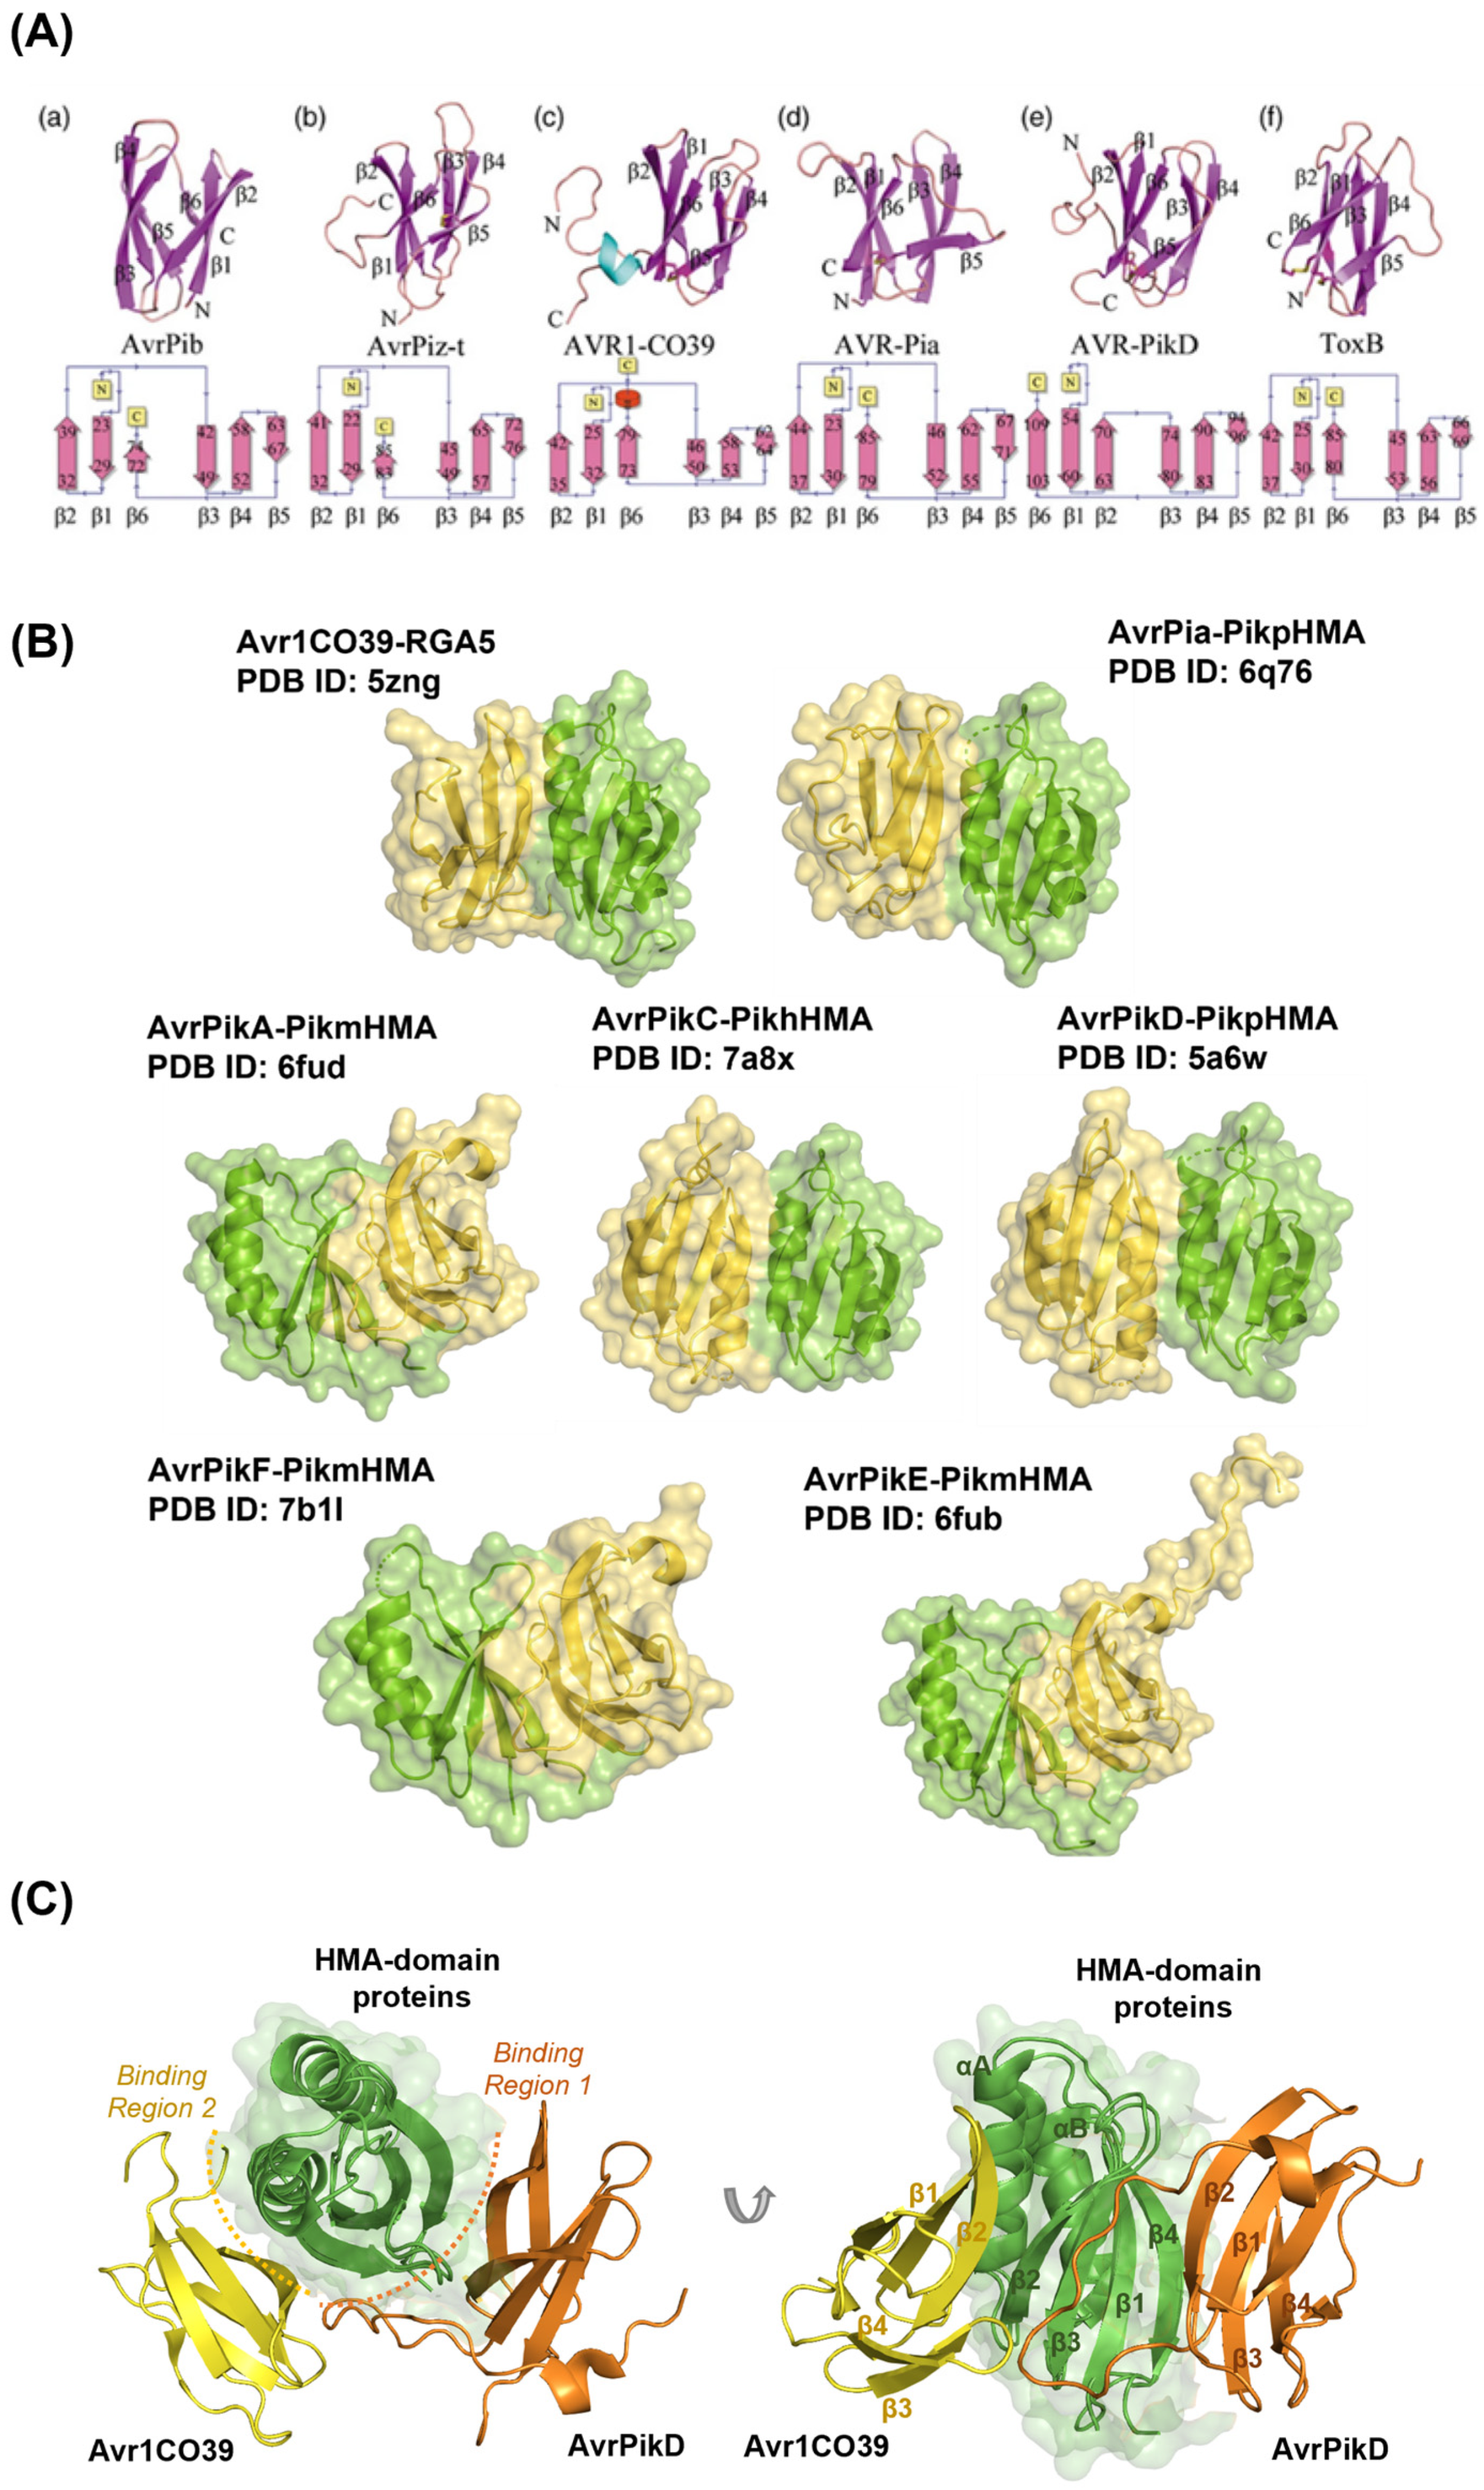
:1. Introduction
2. Results
2.1. Benchmarking of Bound Complexes
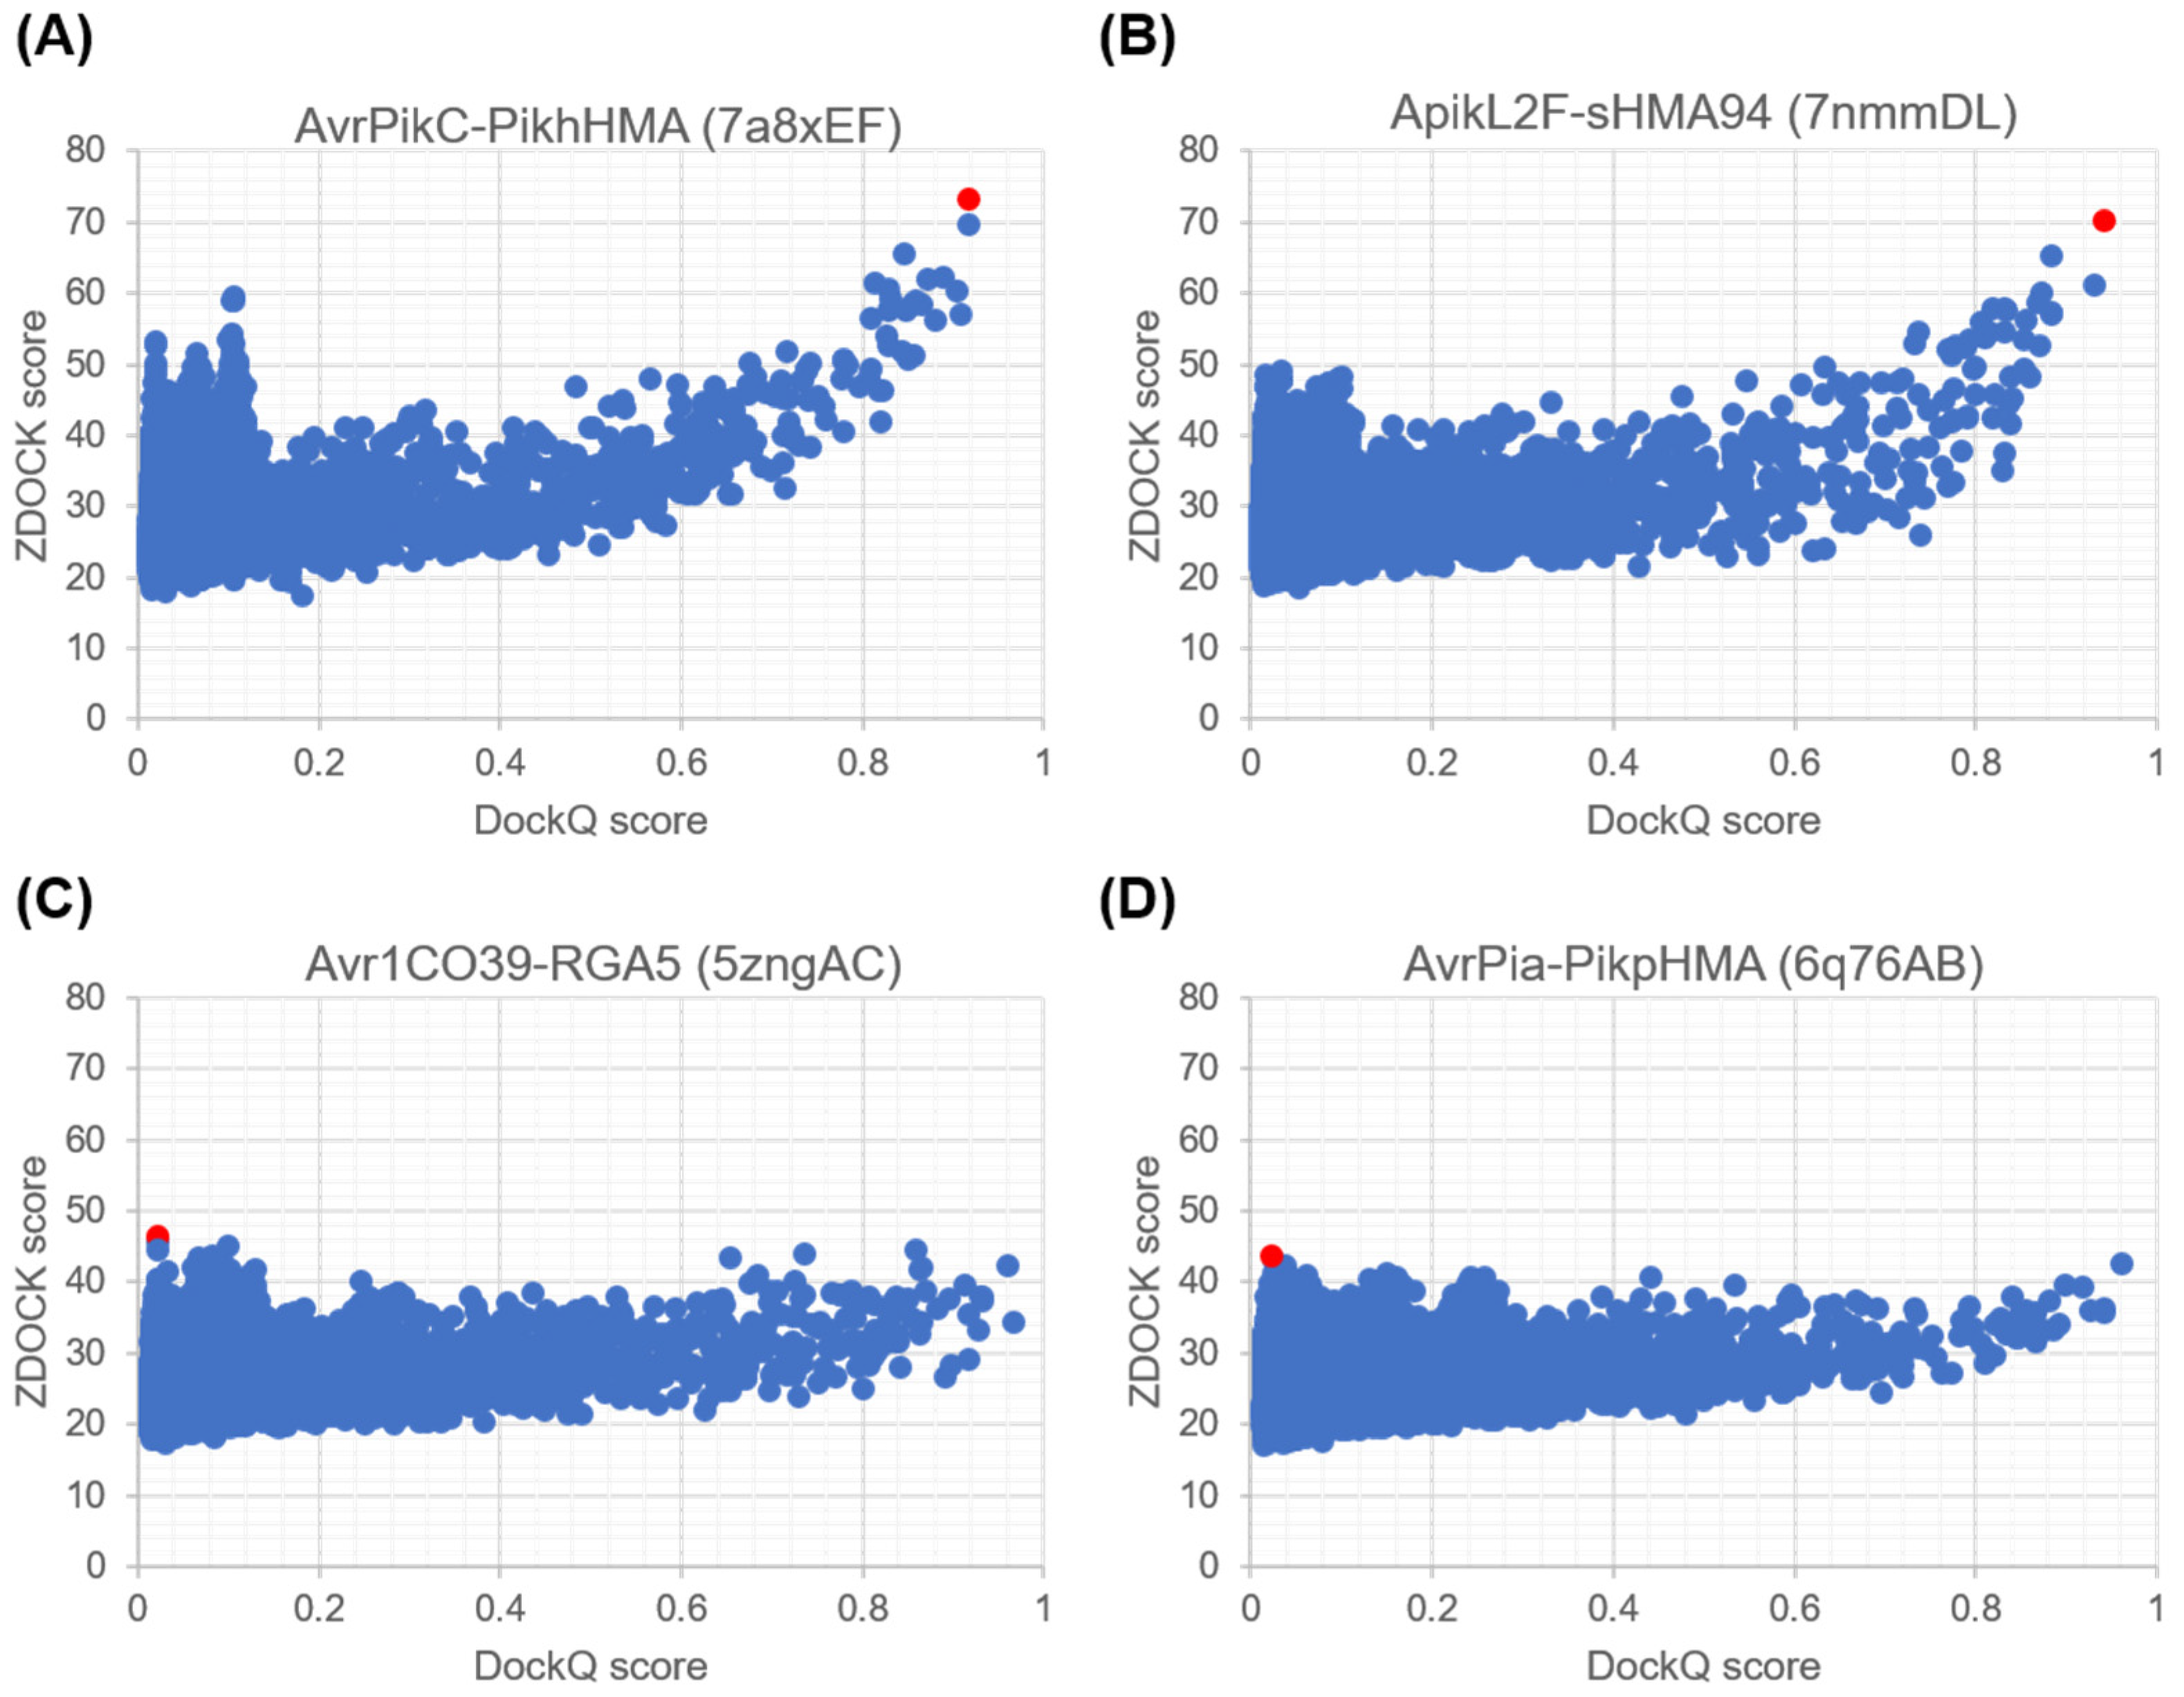
2.1.1. Evaluation of Docking Output Using DockQ
2.1.2. Re-Scoring and Re-Ranking with ZRANK
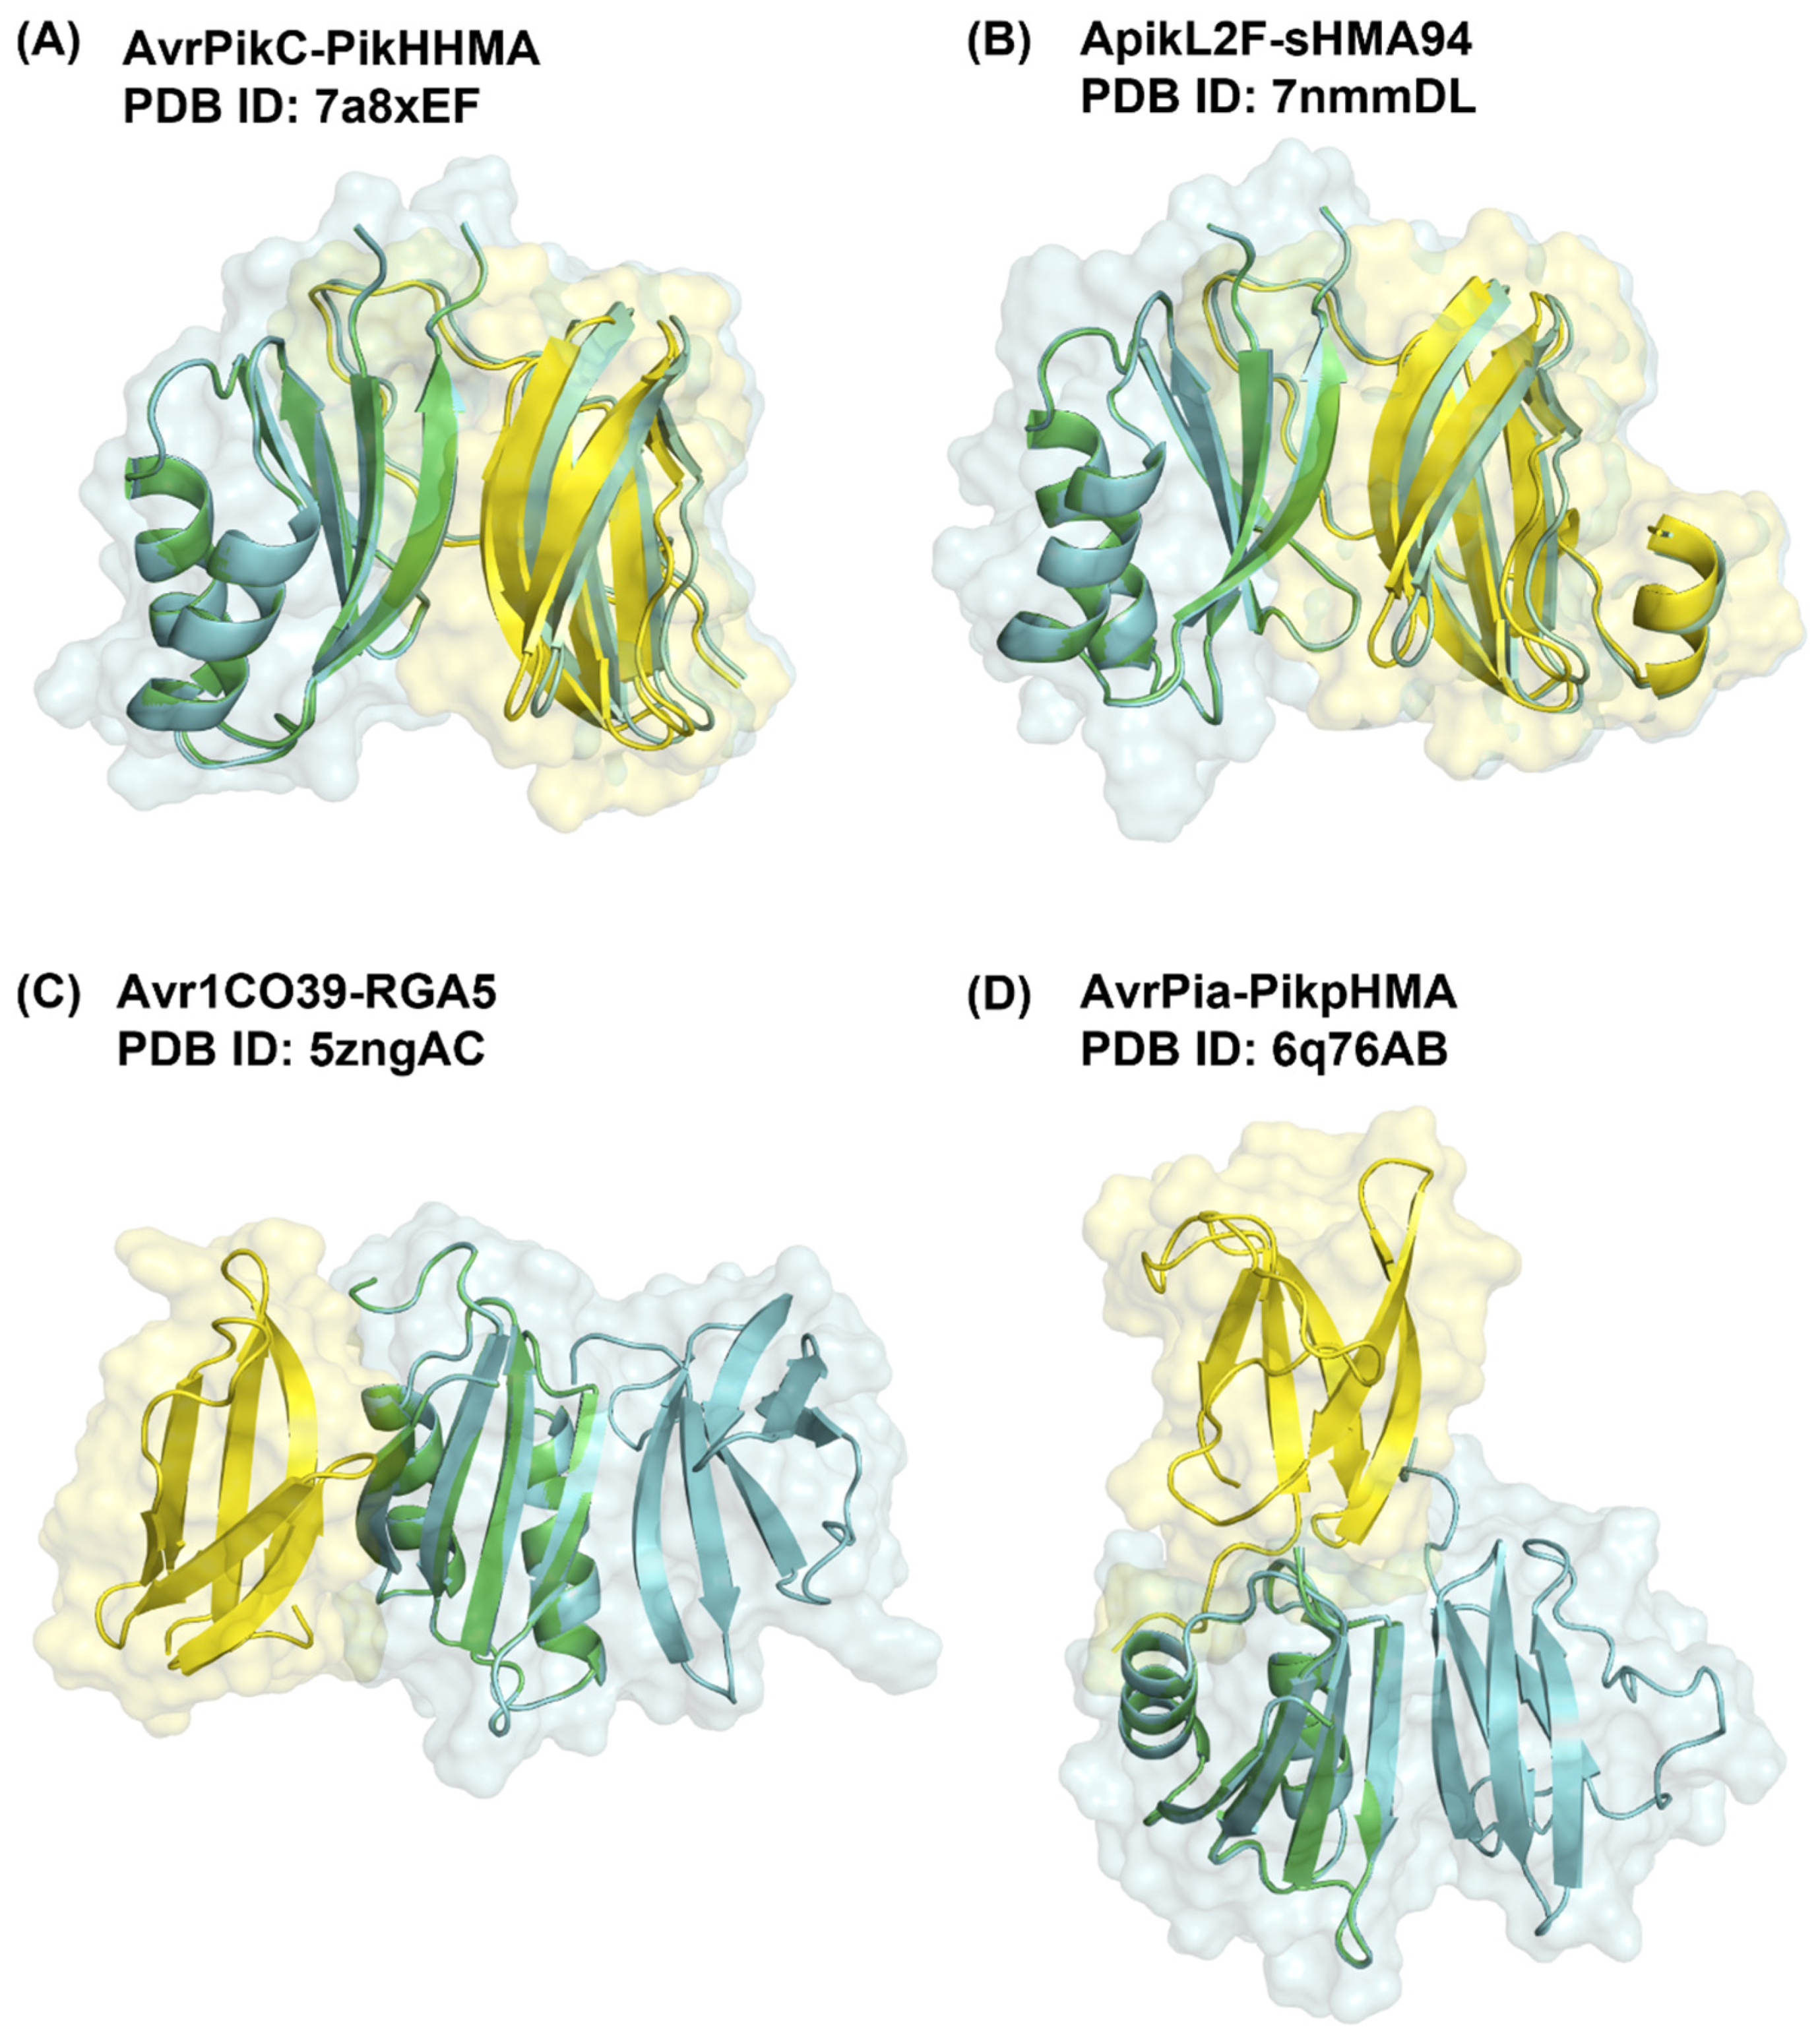
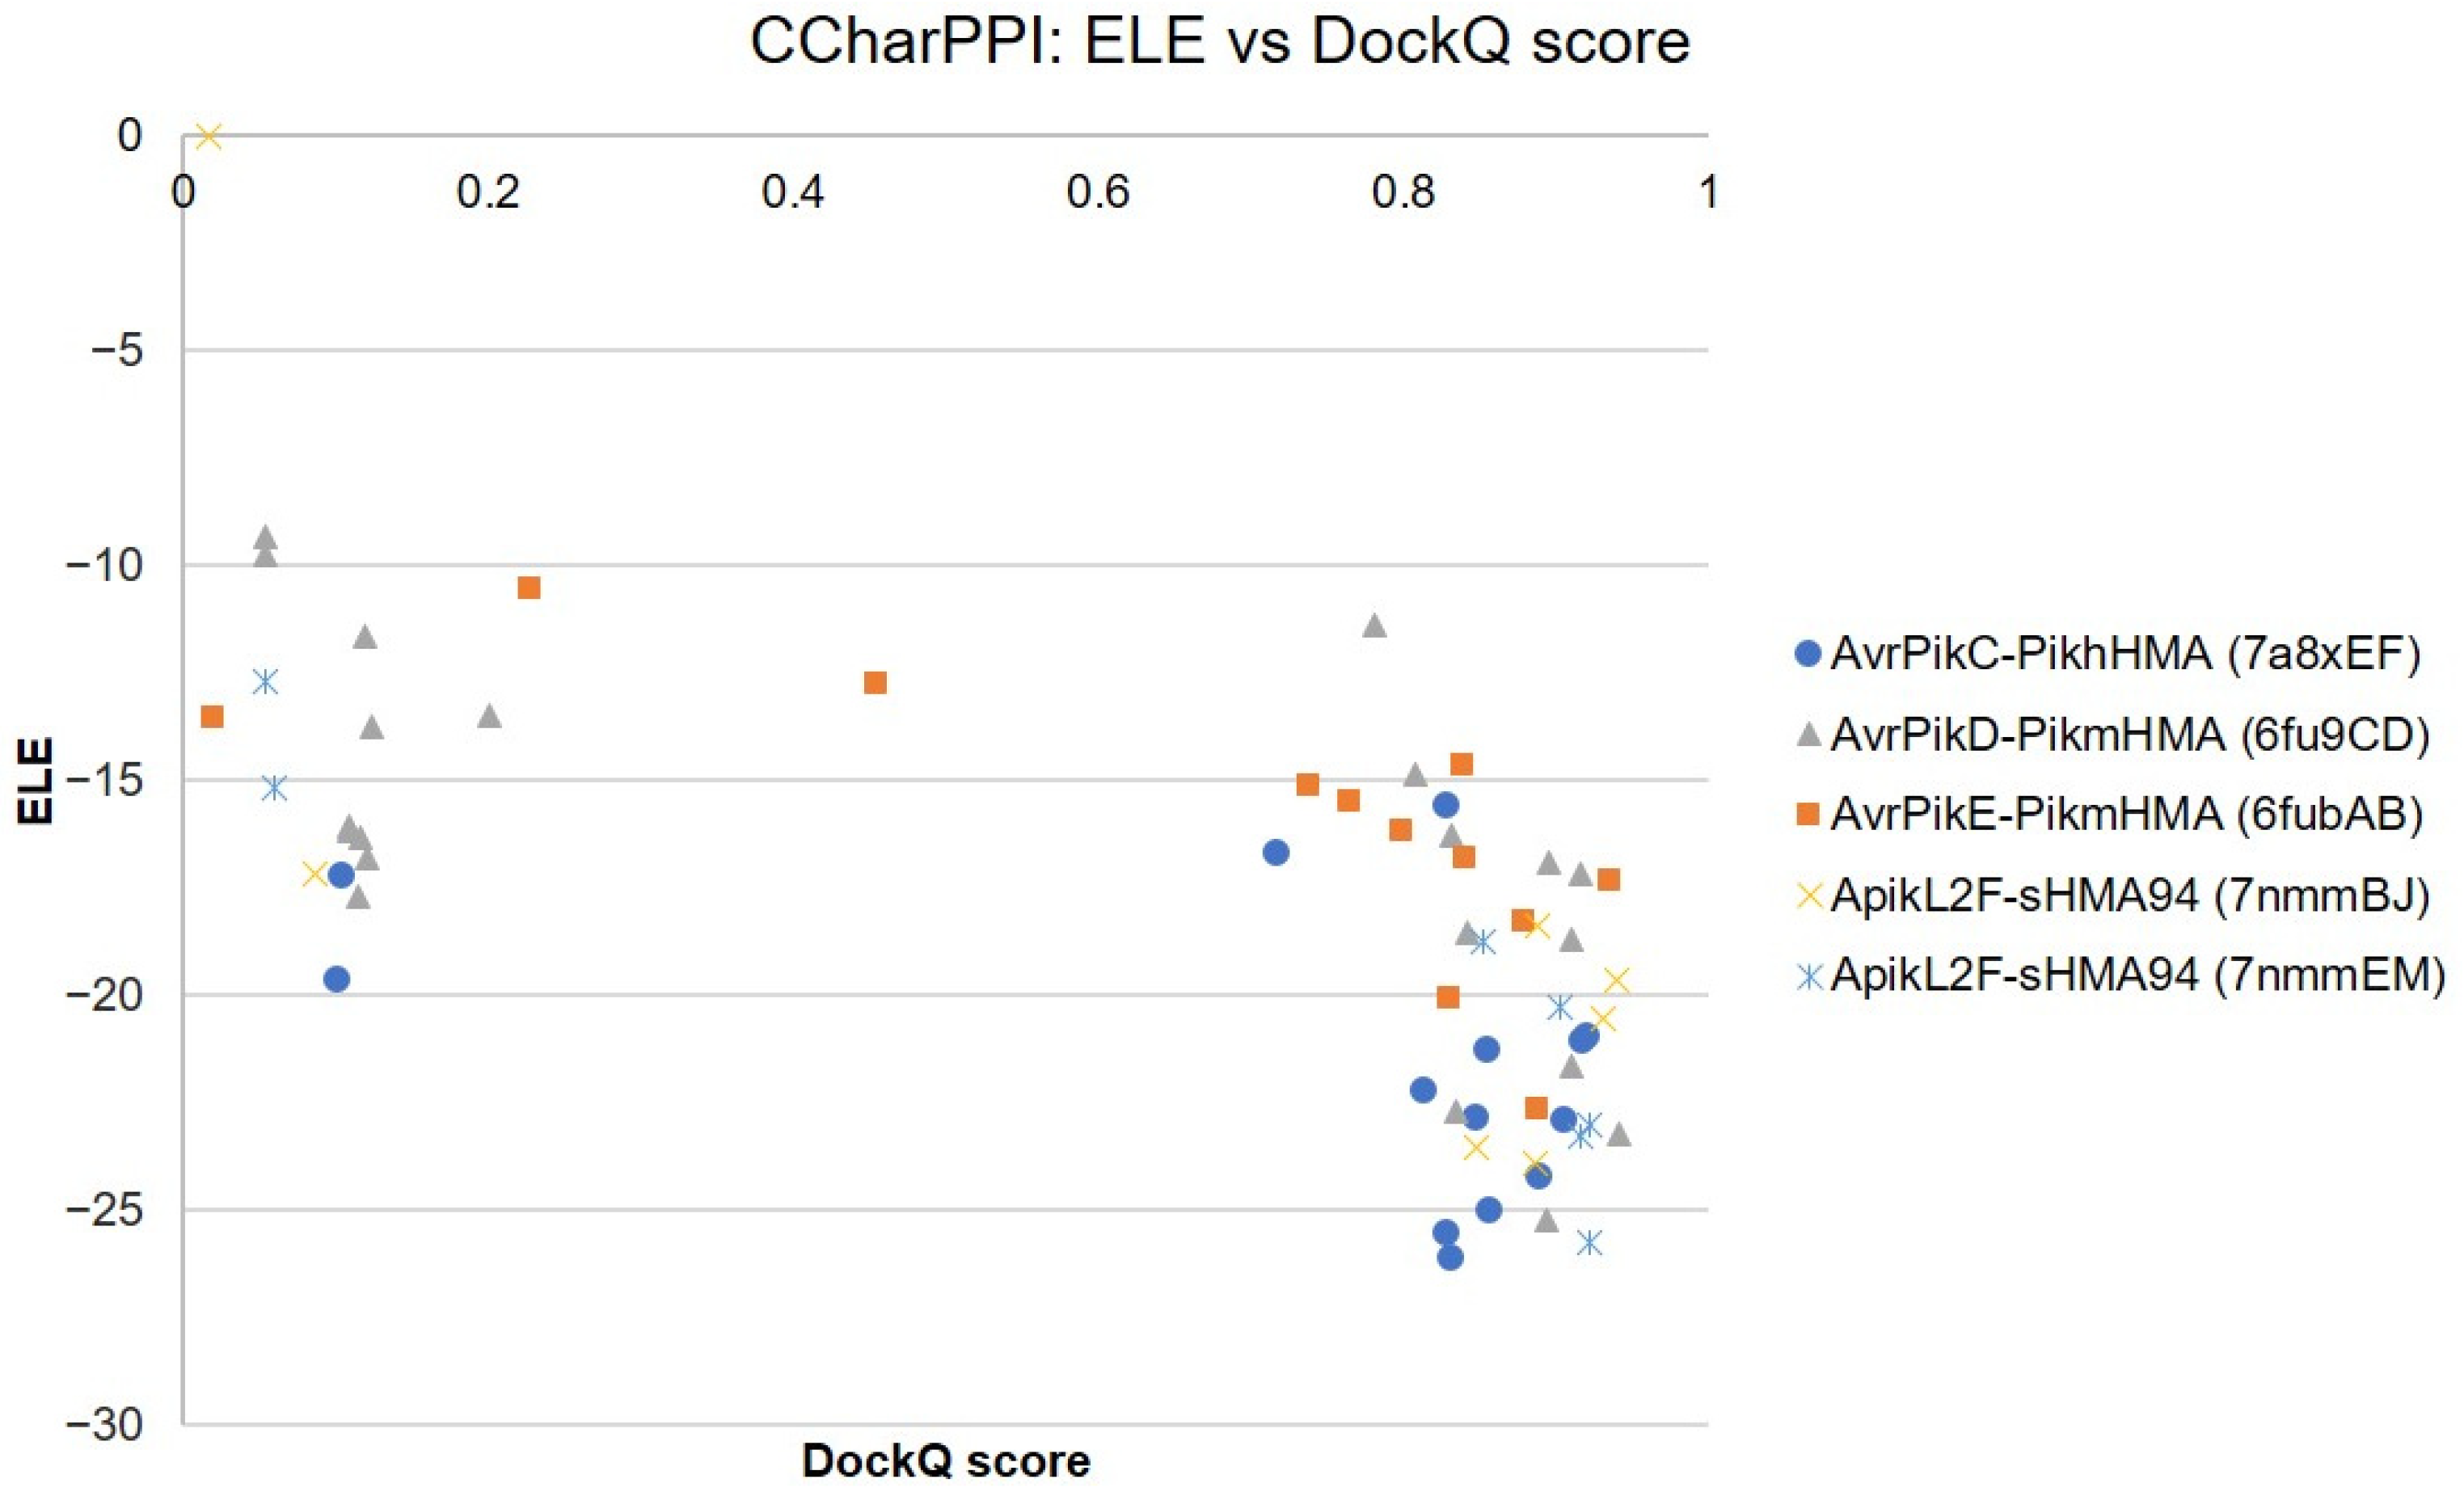
2.1.3. Comparison of Docking Predictions with ZDOCK and ZRANK Scores
2.1.4. Assessment of Docking Output with and without Residue Restraints
2.2. Optimisation of Parameters for the Prediction of Near-Native Docking Poses
2.2.1. Docking Parameters
2.2.2. Unbound Docking Results
3. Discussion
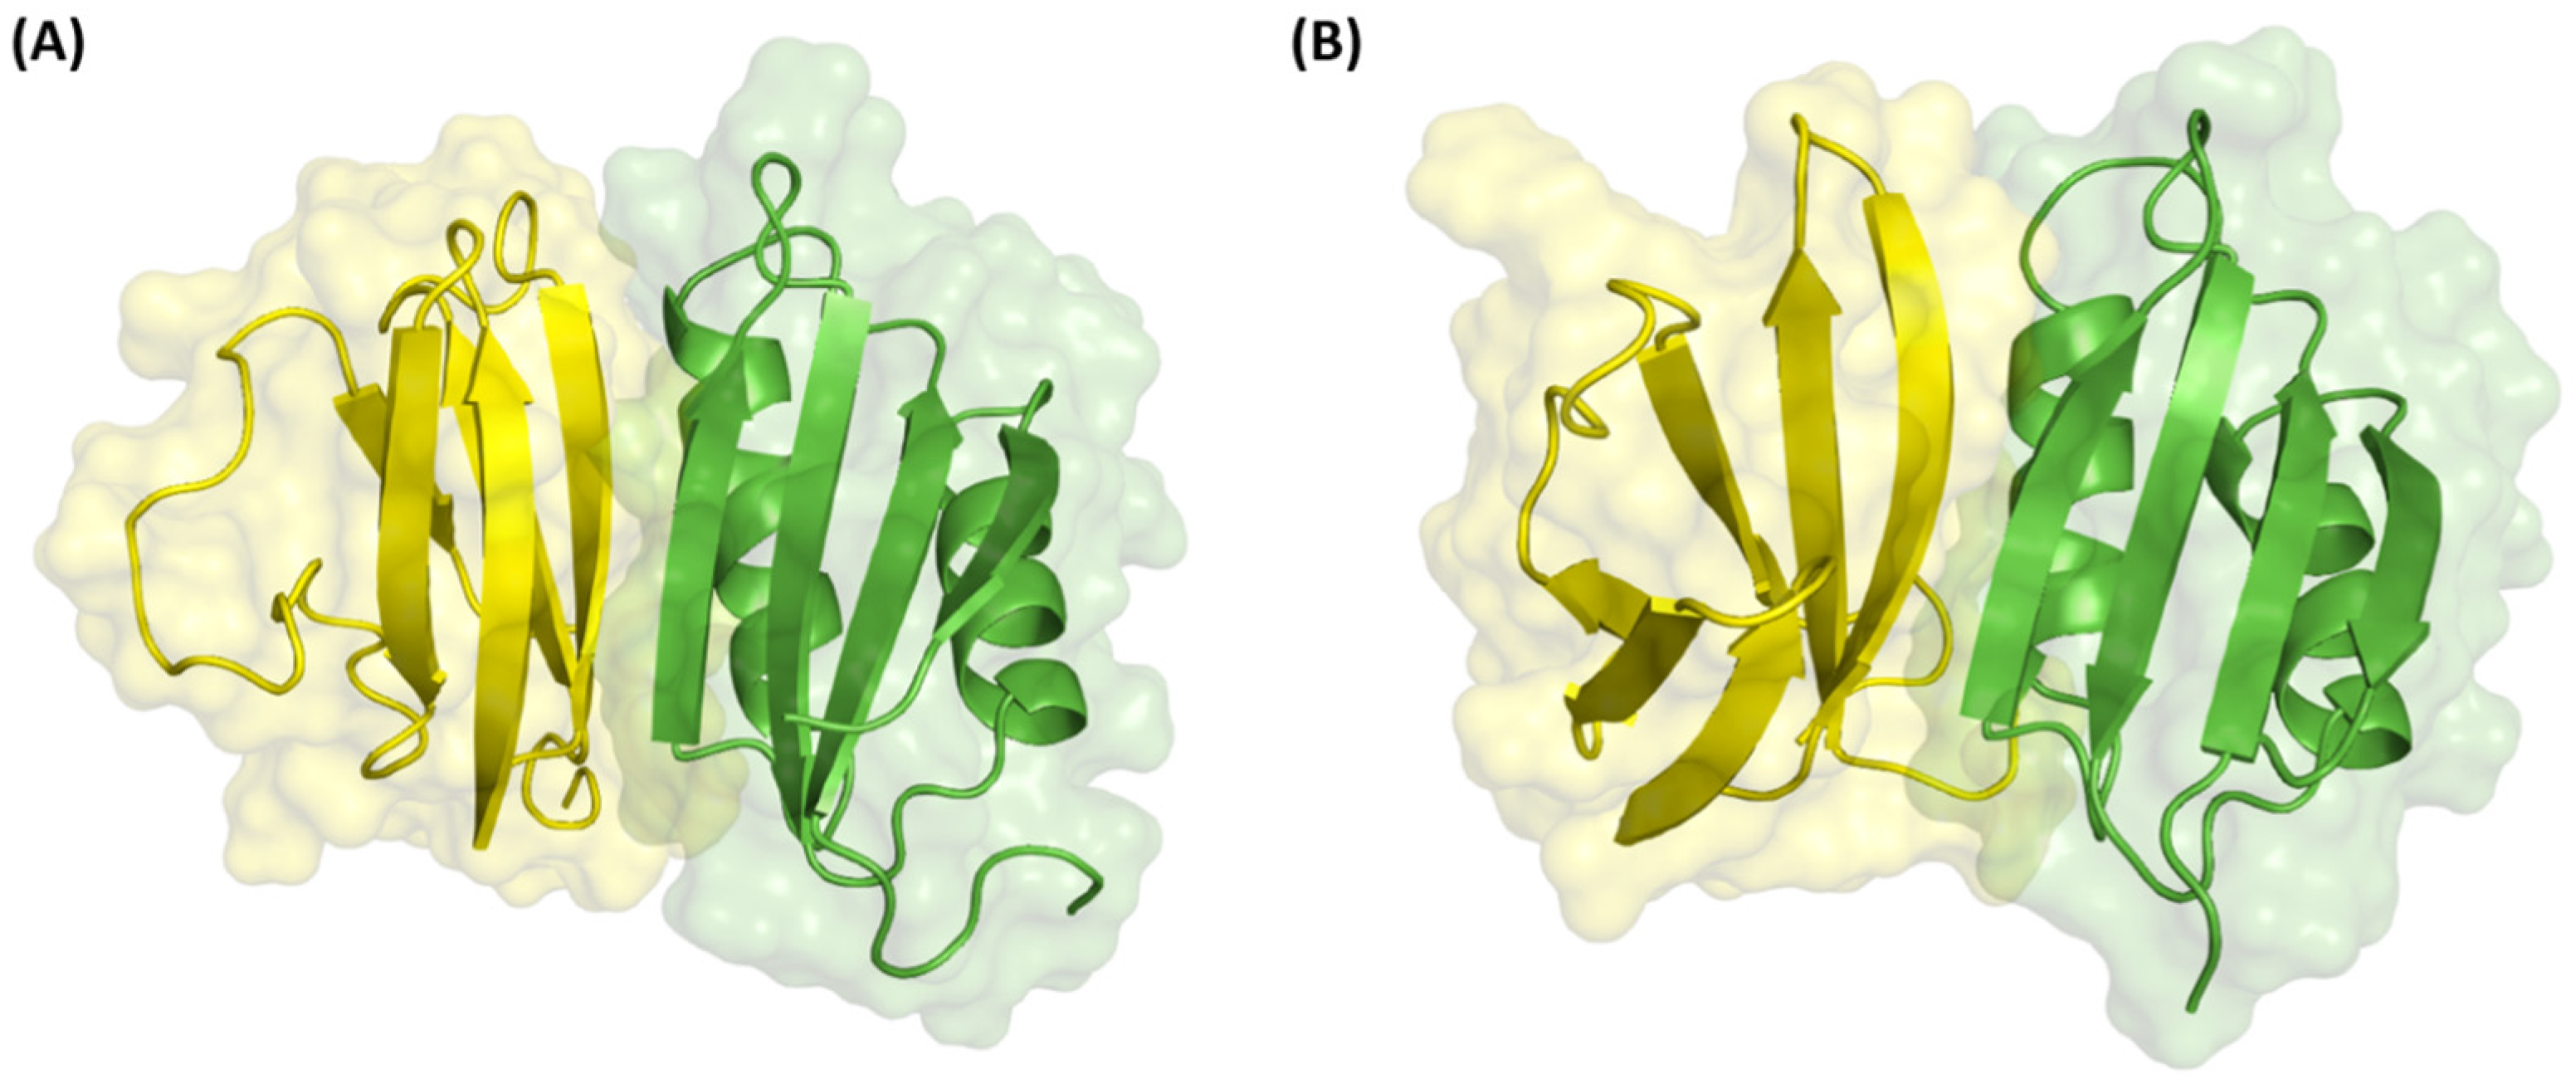
3.1. Interactions with MAX Regions 1 and 2
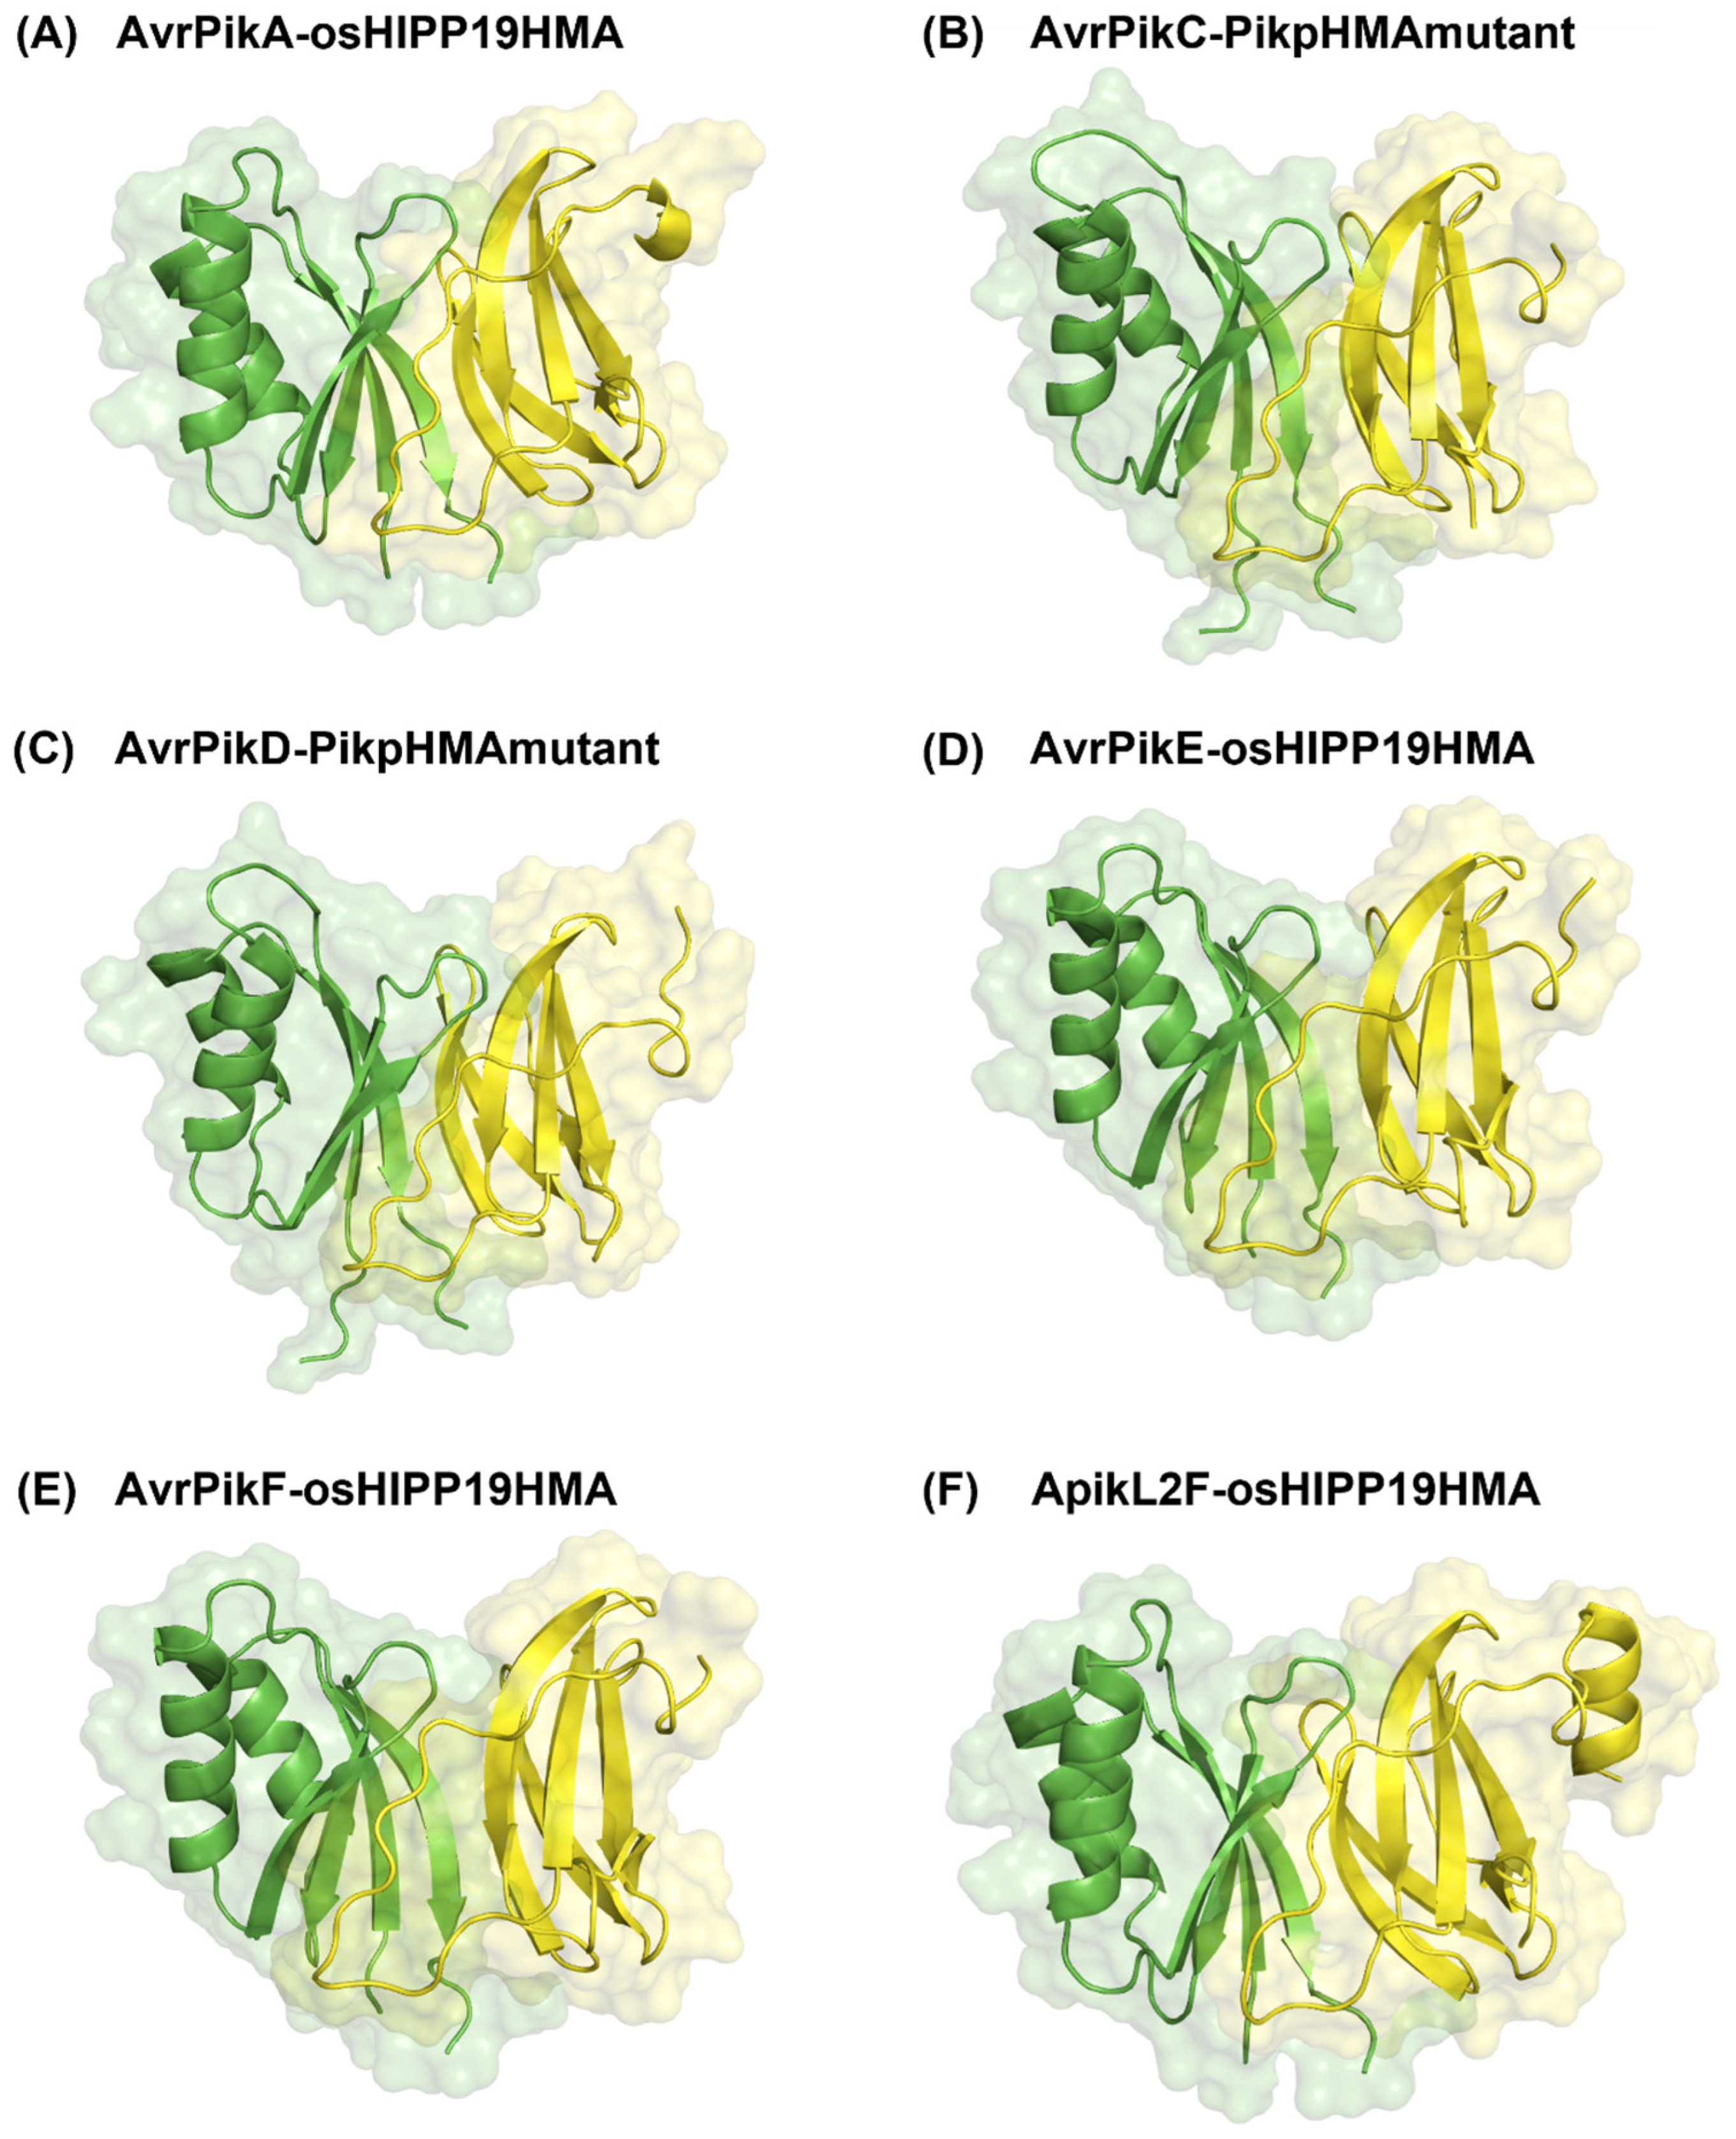
3.2. Polymorphic Residues and Engineered Plant HMA Domain Proteins
3.3. Best Scoring Function for MAX Regions 1 and 2
3.4. Limitations of Molecular Docking and Future Improvements
4. Materials and Methods
4.1. Experimental 3D Structures
4.2. Protein Structure Modelling
4.3. Protein Structure Processing
4.4. Protein–Protein Docking
4.5. Re-Scoring and Re-Ranking
5. Conclusions
Supplementary Materials
Author Contributions
Funding
Institutional Review Board Statement
Informed Consent Statement
Data Availability Statement
Acknowledgments
Conflicts of Interest
References
- Hane, J.K.; Paxman, J.; Jones, D.A.B.; Oliver, R.P.; de Wit, P. “CATAStrophy,” a Genome-Informed Trophic Classification of Filamentous Plant Pathogens—How Many Different Types of Filamentous Plant Pathogens Are There? Front. Microbiol. 2020, 10, 3088. [Google Scholar] [CrossRef] [PubMed]
- Jones, J.D.G.; Dangl, J.L. The plant immune system. Nature 2006, 444, 323–329. [Google Scholar] [CrossRef] [PubMed]
- Zhang, S.; Wang, L.; Wu, W.; He, L.; Yang, X.; Pan, Q. Function and evolution of Magnaporthe oryzae avirulence gene AvrPib responding to the rice blast resistance gene Pib. Sci. Rep. 2015, 5, 11642. [Google Scholar] [CrossRef] [PubMed]
- Di, X.; Cao, L.; Takken, F.L.W.; Hughes, R.K.; Tintor, N. Structure-function analysis of the Fusarium oxysporum Avr2 effector allows uncoupling of its immune-suppressing activity from recognition. New Phytol. 2017, 216, 897–914. [Google Scholar] [CrossRef] [PubMed]
- Houterman, P.M.; Ma, L.; van Ooijen, G.; de Vroomen, M.J.; Cornelissen, B.J.C.; Takken, F.L.W.; Rep, M. The effector protein Avr2 of the xylem-colonizing fungus Fusarium oxysporum activates the tomato resistance protein I-2 intracellularly. Plant J. 2009, 58, 970–978. [Google Scholar] [CrossRef]
- Nyarko, A.; Singarapu, K.K.; Figueroa, M.; Manning, V.A.; Pandelova, I.; Wolpert, T.J.; Ciuffetti, L.M.; Barbar, E. Solution NMR structures of Pyrenophora tritici-repentis ToxB and its inactive homolog reveal potential determinants of toxin activity. J. Biol. Chem. 2014, 289, 25946–25956. [Google Scholar] [CrossRef]
- Betts, M.F.; Manning, V.A.; Cardwell, K.B.; Pandelova, I.; Ciuffetti, L.M. The importance of the N-terminus for activity of Ptr ToxB, a chlorosis-inducing host-selective toxin produced by Pyrenophora tritici-repentis. Physiol. Mol. Plant Pathol. 2011, 75, 138–145. [Google Scholar] [CrossRef]
- Friesen, T.L.; Faris, J.D. Molecular mapping of resistance to Pyrenophora tritici-repentis race 5 and sensitivity to Ptr ToxB in wheat, Theor. Appl. Genet. 2004, 109, 464–471. [Google Scholar] [CrossRef]
- Zhang, X.; Farah, N.; Rolston, L.; Ericsson, D.J.; Catanzariti, A.M.; Bernoux, M.; Ve, T.; Bendak, K.; Chen, C.; Mackay, J.P.; et al. Crystal structure of the Melampsora lini effector AvrP reveals insights into a possible nuclear function and recognition by the flax disease resistance protein P. Mol. Plant Pathol. 2017, 19, 1196–1209. [Google Scholar] [CrossRef]
- Dodds, P.; Thrall, P. Recognition events and host-pathogen co-evolution in gene-for-gene resistance to flax rust. Funct. Plant Biol. 2009, 36, 395–408. [Google Scholar] [CrossRef]
- Cesari, S.; Thilliez, G.; Ribot, C.; Chalvon, V.; Michel, C.; Jauneau, A.; Rivas, S.; Alaux, L.; Kanzaki, H.; Okuyama, Y.; et al. The rice resistance protein pair RGA4/RGA5 recognizes the Magnaporthe oryzae effectors AVR-Pia and AVR1-CO39 by direct binding. Plant Cell 2013, 25, 1463–1481. [Google Scholar] [CrossRef] [PubMed]
- Wang, R.; Ning, Y.; Shi, X.; He, F.; Zhang, C.; Fan, J.; Jiang, N.; Zhang, Y.; Zhang, T.; Hu, Y.; et al. Immunity to Rice Blast Disease by Suppression of Effector-Triggered Necrosis. Curr. Biol. 2016, 26, 2399–2411. [Google Scholar] [CrossRef] [PubMed]
- de Guillen, K.; Ortiz-Vallejo, D.; Gracy, J.; Fournier, E.; Kroj, T.; Padilla, A. Structure Analysis Uncovers a Highly Diverse but Structurally Conserved Effector Family in Phytopathogenic Fungi. PLoS Pathog. 2015, 11, e1005228. [Google Scholar] [CrossRef] [PubMed]
- De la Concepcion, J.C.; Franceschetti, M.; Maqbool, A.; Saitoh, H.; Terauchi, R.; Kamoun, S.; Banfield, M.J. Polymorphic residues in rice NLRs expand binding and response to effectors of the blast pathogen. Nat. Plants 2018, 4, 576–585. [Google Scholar] [CrossRef]
- Vleeshouwers, V.G.A.A.; Oliver, R.P. Effectors as Tools in Disease Resistance Breeding Against Biotrophic, Hemibiotrophic, and Necrotrophic Plant Pathogens. Mol. Plant-Microbe Interact. 2014, 27, 196–206. [Google Scholar] [CrossRef] [PubMed]
- Kearsey, M.J.; Farquhar, A.G.L. QTL analysis in plants; where are we now? Heredity 1998, 80, 137–142. [Google Scholar] [CrossRef]
- Cortes, L.T.; Zhang, Z.; Yu, J. Status and prospects of genome-wide association studies in plants. Plant Genome 2021, 14, e20077. [Google Scholar] [CrossRef]
- Sperschneider, J.; Dodds, P.N. EffectorP 3.0: Prediction of Apoplastic and Cytoplasmic Effectors in Fungi and Oomycetes. Mol. Plant-Microbe Interact. 2022, 35, 146–156. [Google Scholar] [CrossRef]
- Jones, D.A.B.; Moolhuijzen, P.M.; Hane, J.K. Remote homology clustering identifies lowly conserved families of effector proteins in plant-pathogenic fungi. Microb. Genom. 2021, 7, 000637. [Google Scholar] [CrossRef]
- Jones, D.A.B.; Rozano, L.; Debler, J.W.; Mancera, R.L.; Moolhuijzen, P.M.; Hane, J.K. An automated and combinative method for the predictive ranking of candidate effector proteins of fungal plant pathogens. Sci. Rep. 2021, 11, 19731. [Google Scholar] [CrossRef]
- Wiehe, K.; Pierce, B.; Mintseris, J.; Tong, W.W.; Anderson, R.; Chen, R.; Weng, Z. ZDOCK and RDOCK Performance in CAPRI Rounds 3, 4, and 5. Proteins Struct. Funct. Bioinform. 2005, 60, 207–213. [Google Scholar] [CrossRef] [PubMed]
- Comeau, S.R.; Gatchell, D.W.; Vajda, S.; Camacho, C.J. ClusPro: A fully automated algorithm for protein-protein docking. Nucleic Acids Res. 2004, 32, W96–W99. [Google Scholar] [CrossRef] [PubMed]
- Dominguez, C.; Boelens, R.; Bonvin, A.M.J.J. HADDOCK: A protein-protein docking approach based on biochemical or biophysical information. J. Am. Chem. Soc. 2003, 125, 1731–1737. [Google Scholar] [CrossRef]
- JGarzon, I.; Lopéz-Blanco, J.R.; Pons, C.; Kovacs, J.; Abagyan, R.; Fernandez-Recio, J.; Chacon, P. FRODOCK: A new approach for fast rotational protein-protein docking. Bioinformatics 2009, 25, 2544–2551. [Google Scholar] [CrossRef] [PubMed]
- Torchala, M.; Moal, I.H.; Chaleil, R.A.G.; Fernandez-Recio, J.; Bates, P.A. SwarmDock: A server for flexible protein-protein docking. Bioinformatics 2013, 29, 807–809. [Google Scholar] [CrossRef]
- Berman, H.M.; Westbrook, J.; Feng, Z.; Gilliland, G.; Bhat, T.N.; Weissig, H.; Shindyalov, I.N.; Bourne, P.E. The Protein Data Bank. Nucleic Acids Res. 2000, 28, 235–242. [Google Scholar] [CrossRef]
- Ortiz, D.; de Guillen, K.; Cesari, S.; Chalvon, V.; Gracy, J.; Padilla, A.; Kroj, T. Recognition of the Magnaporthe oryzae Effector AVR-Pia by the Decoy Domain of the Rice NLR Immune Receptor RGA5. Plant Cell 2017, 29, 156–168. [Google Scholar] [CrossRef]
- Guo, L.; Cesari, S.; de Guillen, K.; Chalvon, V.; Mammri, L.; Ma, M.; Meusnier, I.; Bonnot, F.; Padilla, A.; Peng, Y.L.; et al. Specific recognition of two MAX effectors by integrated HMA domains in plant immune receptors involves distinct binding surfaces. Proc. Natl. Acad. Sci. USA 2018, 115, 11637–11642. [Google Scholar] [CrossRef]
- Zhang, Z.M.; Zhang, X.; Zhou, Z.R.; Hu, H.Y.; Liu, M.; Zhou, B.; Zhou, J. Solution structure of the Magnaporthe oryzae avirulence protein AvrPiz-t. J. Biomol. NMR 2013, 55, 219–223. [Google Scholar] [CrossRef]
- Park, C.H.; Shirsekar, G.; Bellizzi, M.; Chen, S.; Songkumarn, P.; Xie, X.; Shi, X.; Ning, Y.; Zhou, B.; Suttiviriya, P.; et al. The E3 Ligase APIP10 Connects the Effector AvrPiz-t to the NLR Receptor Piz-t in Rice. PLoS Pathog. 2016, 12, e1005529. [Google Scholar] [CrossRef]
- Tang, M.; Ning, Y.; Shu, X.; Dong, B.; Zhang, H.; Wu, D.; Wang, H.; Wang, G.L.; Zhou, B. The Nup98 Homolog APIP12 Targeted by the Effector AvrPiz-t is Involved in Rice Basal Resistance Against Magnaporthe oryzae. Rice 2017, 10, 5. [Google Scholar] [CrossRef] [PubMed]
- Rozano, L.; Mukuka, Y.M.; Hane, J.K.; Mancera, R.L. Ab initio modelling of the structure of ToxA-like and MAX fungal effector proteins. Int. J. Mol. Sci. 2023, 24, 6262. [Google Scholar] [CrossRef] [PubMed]
- Cesari, S.; Xi, Y.; Declerck, N.; Chalvon, V.; Mammri, L.; Pugnière, M.; Henriquet, C.; de Guillen, K.; Chochois, V.; Padilla, A.; et al. New recognition specificity in a plant immune receptor by molecular engineering of its integrated domain. Nat. Commun. 2022, 21, 1524. [Google Scholar] [CrossRef] [PubMed]
- Maqbool, A.; Saitoh, H.; Franceschetti, M.; Stevenson, C.E.; Uemura, A.; Kanzaki, H.; Kamoun, S.; Terauchi, R.; Banfield, M.J. Structural basis of pathogen recognition by an integrated HMA domain in a plant NLR immune receptor. eLife 2015, 4, e08709. [Google Scholar] [CrossRef]
- Varden, F.A.; Saitoh, H.; Yoshino, K.; Franceschetti, M.; Kamoun, S.; Terauchi, R.; Banfield, M.J. Cross-reactivity of a rice NLR immune receptor to distinct effectors from the rice blast pathogen Magnaporthe oryzae provides partial disease resistance. J. Biol. Chem. 2019, 294, 13006–13016. [Google Scholar] [CrossRef] [PubMed]
- De la Concepcion, J.C.; Maidment, J.H.R.; Longya, A.; Xiao, G.; Franceschetti, M.; Banfield, M.J. The allelic rice immune receptor Pikh confers extended resistance to strains of the blast fungus through a single polymorphism in the effector binding interface. PLoS Pathog. 2021, 17, e1009368. [Google Scholar] [CrossRef] [PubMed]
- Maidment, J.H.; Franceschetti, M.; Maqbool, A.; Saitoh, H.; Jantasuriyarat, C.; Kamoun, S.; Terauchi, R.; Banfield, M.J. Multiple variants of the fungal effector AVR-Pik bind the HMA domain of the rice protein OsHIPP19, providing a foundation to engineer plant defense. J. Biol. Chem. 2021, 296, 100371. [Google Scholar] [CrossRef]
- Bentham, A.R.; Petit-Houdenot, Y.; Win, J.; Chuma, I.; Terauchi, R.; Banfield, M.J.; Kamoun, S.; Langner, T. A single amino acid polymorphism in a conserved effector of the multihost blast fungus pathogen expands host-target binding spectrum. PLoS Pathog. 2021, 17, e1009957. [Google Scholar] [CrossRef]
- Basu, S.; Wallner, B. DockQ: A Quality Measure for Protein-Protein Docking Models. PLoS ONE 2016, 11, e0161879. [Google Scholar] [CrossRef]
- Chen, R.; Li, L.; Weng, Z. ZDOCK: An initial-stage protein-docking algorithm, Proteins Struct. Funct. Genet. 2003, 52, 80–87. [Google Scholar] [CrossRef]
- Pierce, B.; Weng, Z. ZRANK: Reranking protein docking predictions with an optimized energy function, Proteins Struct. Funct. Genet. 2007, 67, 1078–1086. [Google Scholar] [CrossRef]
- Cheng, T.M.K.; Blundell, T.L.; Fernandez-Recio, J. pyDock: Electrostatics and desolvation for effective scoring of rigid-body protein–protein docking, Proteins Struct. Funct. Bioinforma. 2007, 68, 503–515. [Google Scholar] [CrossRef] [PubMed]
- Ravikant, D.V.S.; Elber, R. Pie—Efficient filters and coarse grained potentials for unbound protein–protein docking. Proteins Struct. Funct. Bioinform. 2010, 78, 400–419. [Google Scholar] [CrossRef]
- Zhou, H.; Skolnick, J. GOAP: A generalized orientation-dependent, all-atom statistical potential for protein structure prediction. Biophys. J. 2011, 101, 2043–2052. [Google Scholar] [CrossRef] [PubMed]
- Lu, M.; Dousis, A.D.; Ma, J. OPUS-PSP: An orientation-dependent statistical all-atom potential derived from side-chain packing. J. Mol. Biol. 2008, 376, 288–301. [Google Scholar] [CrossRef] [PubMed]
- Pokarowski, P.; Kloczkowski, A.; Jernigan, R.L.; Kothari, N.S.; Pokarowska, M.; Kolinski, A. Inferring ideal amino acid interaction forms from statistical protein contact potentials. Proteins 2005, 59, 49–57. [Google Scholar] [CrossRef] [PubMed]
- Feng, Y.; Kloczkowski, A.; Jernigan, R.L. Potentials ‘R’ Us web-server for protein energy estimations with coarse-grained knowledge-based potentials. BMC Bioinform. 2010, 11, 92. [Google Scholar] [CrossRef]
- Feliu, E.; Aloy, P.; Oliva, B. On the analysis of protein-protein interactions via knowledge-based potentials for the prediction of protein-protein docking. Protein Sci. A Publ. Protein Soc. 2011, 20, 529–541. [Google Scholar] [CrossRef]
- De La Concepcion, J.C.; Franceschetti, M.; Maclean, D.; Terauchi, R.; Kamoun, S.; Banfield, M.J. Protein engineering expands the effector recognition profile of a rice NLR immune receptor. eLife 2019, 8, e47713. [Google Scholar] [CrossRef]
- Chen, R.; Weng, Z. A novel shape complementarity scoring function for protein-protein docking, Proteins Struct. Funct. Genet. 2003, 51, 397–408. [Google Scholar] [CrossRef]
- de Vries, S.J.; van Dijk, M.; Bonvin, A.M.J.J. The HADDOCK web server for data-driven biomolecular docking. Nat. Protoc. 2010, 5, 883–897. [Google Scholar] [CrossRef]
- Matsuzaki, Y.; Uchikoga, N.; Ohue, M.; Akiyama, Y. Rigid-docking approaches to explore protein–protein interaction space. In Advances in Biochemical Engineering/Biotechnology; Springer: Cham, Switzerland, 2017; pp. 33–55. [Google Scholar] [CrossRef]
- Quignot, C.; Postic, G.; Bret, H.; Rey, J.; Granger, P.; Murail, S.; Chacón, P.; Andreani, J.; Tufféry, P.; Guerois, R. InterEvDock3: A combined template-based and free docking server with increased performance through explicit modeling of complex homologs and integration of covariation-based contact maps. Nucleic Acids Res. 2021, 49, W277–W284. [Google Scholar] [CrossRef]
- Jung, Y.; Geng, C.; Bonvin, A.M.J.J.; Xue, L.C.; Honavar, V.G. MetaScore: A Novel Machine-Learning-Based Approach to Improve Traditional Scoring Functions for Scoring Protein–Protein Docking Conformations. Biomolecules 2023, 13, 121. [Google Scholar] [CrossRef] [PubMed]
- Rozano, L.; Jones, D.; Hane, J.; Mancera, R. Template-based modelling of the structure of fungal effector proteins. Mol. Biotechnol. 2023. [Google Scholar] [CrossRef] [PubMed]
- Chen, R.; Weng, Z. Docking unbound proteins using shape complementarity, desolvation, and electrostatics, Proteins Struct. Funct. Genet. 2002, 47, 281–294. [Google Scholar] [CrossRef]
- Moal, I.H.; Jimenez-Garcia, B.; Fernandez-Recio, J. CCharPPI web server: Computational characterization of protein-protein interactions from structure. Bioinformatics 2015, 31, 123–125. [Google Scholar] [CrossRef]


| Effector–Host Receptor Binding Partner Complex | PDB ID | Pose with Best DockQ Score | Pose with Best ZDOCK Score | ||||
|---|---|---|---|---|---|---|---|
| DockQ Score | ZDOCK | ZDOCK Score | DockQ | ||||
| Score | Rank | Score | Rank | ||||
| Avr1CO39-RGA5 | 5zngAC | 0.967 | 34.19 | 756 | 46.35 | 0.022 | 1480 |
| AvrPia-PikpHMA | 6q76AB | 0.962 | 42.47 | 3 | 43.46 | 0.024 | 1605 |
| AvrPikC-PikhHMA | 7a8xBC | 0.971 | 60.16 | 2 | 61.74 | 0.910 | 2 |
| 7a8xEF | 0.919 | 73.13 | 1 | 73.13 | 0.919 | 1 | |
| AvrPikD-PikmHMA | 6fu9AB | 0.942 | 59.69 | 9 | 69.34 | 0.833 | 13 |
| 6fu9CD | 0.941 | 62.21 | 3 | 63.39 | 0.915 | 2 | |
| AvrPikE-PikmHMA | 6fubAB | 0.935 | 58.90 | 4 | 64.49 | 0.925 | 2 |
| AvrPikE-PikpHMA | 6g11BC | 0.908 | 51.14 | 29 | 65.69 | 0.885 | 5 |
| 6g11EF | 0.947 | 58.82 | 4 | 62.28 | 0.753 | 34 | |
| 6r8mFG | 0.924 | 63.82 | 2 | 67.90 | 0.901 | 2 | |
| AvrPikF-OsHIPP19 | 7b1iBC | 0.928 | 63.75 | 9 | 75.98 | 0.887 | 8 |
| ApikL2F-sHMA94 | 7nmmAI | 0.952 | 62.99 | 3 | 68.51 | 0.922 | 2 |
| 7nmmBJ | 0.940 | 53.48 | 12 | 59.6 | 0.876 | 8 | |
| 7nmmCK | 0.933 | 61.34 | 3 | 65.57 | 0.858 | 9 | |
| 7nmmDL | 0.943 | 70.17 | 1 | 70.17 | 0.943 | 1 | |
| 7nmmEM | 0.922 | 59.95 | 5 | 62.04 | 0.831 | 18 | |
| 7nmmFN | 0.933 | 61.17 | 4 | 66.76 | 0.866 | 9 | |
| 7nmmGO | 0.941 | 64.19 | 2 | 64.39 | 0.913 | 2 | |
| 7nmmHP | 0.914 | 57.23 | 8 | 63.64 | 0.890 | 5 | |
| Effector–Host Receptor Binding Partner Complex. | PDB ID | Pose with Best DockQ Score | Pose with Best ZRANK Score | ||||
|---|---|---|---|---|---|---|---|
| DockQ Score | ZRANK | ZRANK Score | DockQ | ||||
| Score | Rank | Score | Rank | ||||
| Avr1CO39-RGA5 | 5zngAC | 0.967 | −74.5563 | 35 | −89.5292 | 0.912 | 8 |
| AvrPia-PikpHMA | 6q76AB | 0.962 | −64.0926 | 212 | −95.9139 | 0.24 | 204 |
| AvrPikC-PikhHMA | 7a8xBC | 0.971 | −88.0183 | 1 | −88.0183 | 0.971 | 1 |
| 7a8xEF | 0.919 | −85.0809 | 25 | −109.556 | 0.904 | 4 | |
| AvrPikD-PikmHMA | 6fu9AB | 0.942 | −92.2094 | 19 | −120.033 | 0.833 | 13 |
| 6fu9CD | 0.941 | −100.436 | 14 | −129.325 | 0.12 | 296 | |
| AvrPikE-PikmHMA | 6fubAB | 0.935 | −90.305 | 15 | −106.179 | 0.162 | 239 |
| AvrPikE-PikpHMA | 6g11BC | 0.908 | −76.3809 | 31 | −110.703 | 0.892 | 4 |
| 6g11EF | 0.947 | −79.1564 | 22 | −96.3179 | 0.875 | 6 | |
| 6r8mFG | 0.924 | −61.0644 | 254 | −112.655 | 0.807 | 13 | |
| AvrPikF-OsHIPP19 | 7b1iBC | 0.928 | −66.7719 | 94 | −125.125 | 0.88 | 10 |
| ApikL2F-sHMA94 | 7nmmAI | 0.952 | −103.174 | 1 | −103.174 | 0.952 | 1 |
| 7nmmBJ | 0.94 | −102.48 | 1 | −102.48 | 0.94 | 1 | |
| 7nmmCK | 0.933 | −88.5095 | 14 | −102.381 | 0.834 | 15 | |
| 7nmmDL | 0.943 | −100.989 | 3 | −104.301 | 0.931 | 2 | |
| 7nmmEM | 0.922 | −89.2384 | 14 | −98.7345 | 0.065 | 413 | |
| 7nmmFN | 0.933 | −107.157 | 1 | −107.157 | 0.933 | 1 | |
| 7nmmGO | 0.941 | −96.1059 | 4 | −107.128 | 0.901 | 5 | |
| 7nmmHP | 0.914 | −91.2643 | 10 | −103.77 | 0.061 | 522 | |
| Effector–Host Receptor Binding Partner Complex | PDB ID | DockQ Score | |
|---|---|---|---|
| Best Docking Pose ZDOCK Score 54k and 2k | Best Docking Pose ZRANK Score 2k | ||
| Avr1CO39-RGA5 | 5zngAC | 0.022 | 0.912 |
| AvrPia-PikpHMA | 6q76AB | 0.024 | 0.240 |
| AvrPikC-PikhHMA | 7a8xBC | 0.910 | 0.971 |
| 7a8xEF | 0.919 | 0.904 | |
| AvrPikD-PikmHMA | 6fu9AB | 0.833 | 0.833 |
| 6fu9CD | 0.915 | 0.120 | |
| AvrPikE-PikmHMA | 6fubAB | 0.925 | 0.162 |
| AvrPikE-PikpHMA | 6g11BC | 0.885 | 0.892 |
| 6g11EF | 0.753 | 0.875 | |
| 6r8mFG | 0.901 | 0.807 | |
| AvrPikF-OsHIPP19 | 7b1iBC | 0.887 | 0.880 |
| ApikL2F-sHMA94 | 7nmmAI | 0.922 | 0.952 |
| 7nmmBJ | 0.876 | 0.940 | |
| 7nmmCK | 0.858 | 0.834 | |
| 7nmmDL | 0.943 | 0.931 | |
| 7nmmEM | 0.831 | 0.065 | |
| 7nmmFN | 0.866 | 0.933 | |
| 7nmmGO | 0.913 | 0.901 | |
| 7nmmHP | 0.890 | 0.061 | |
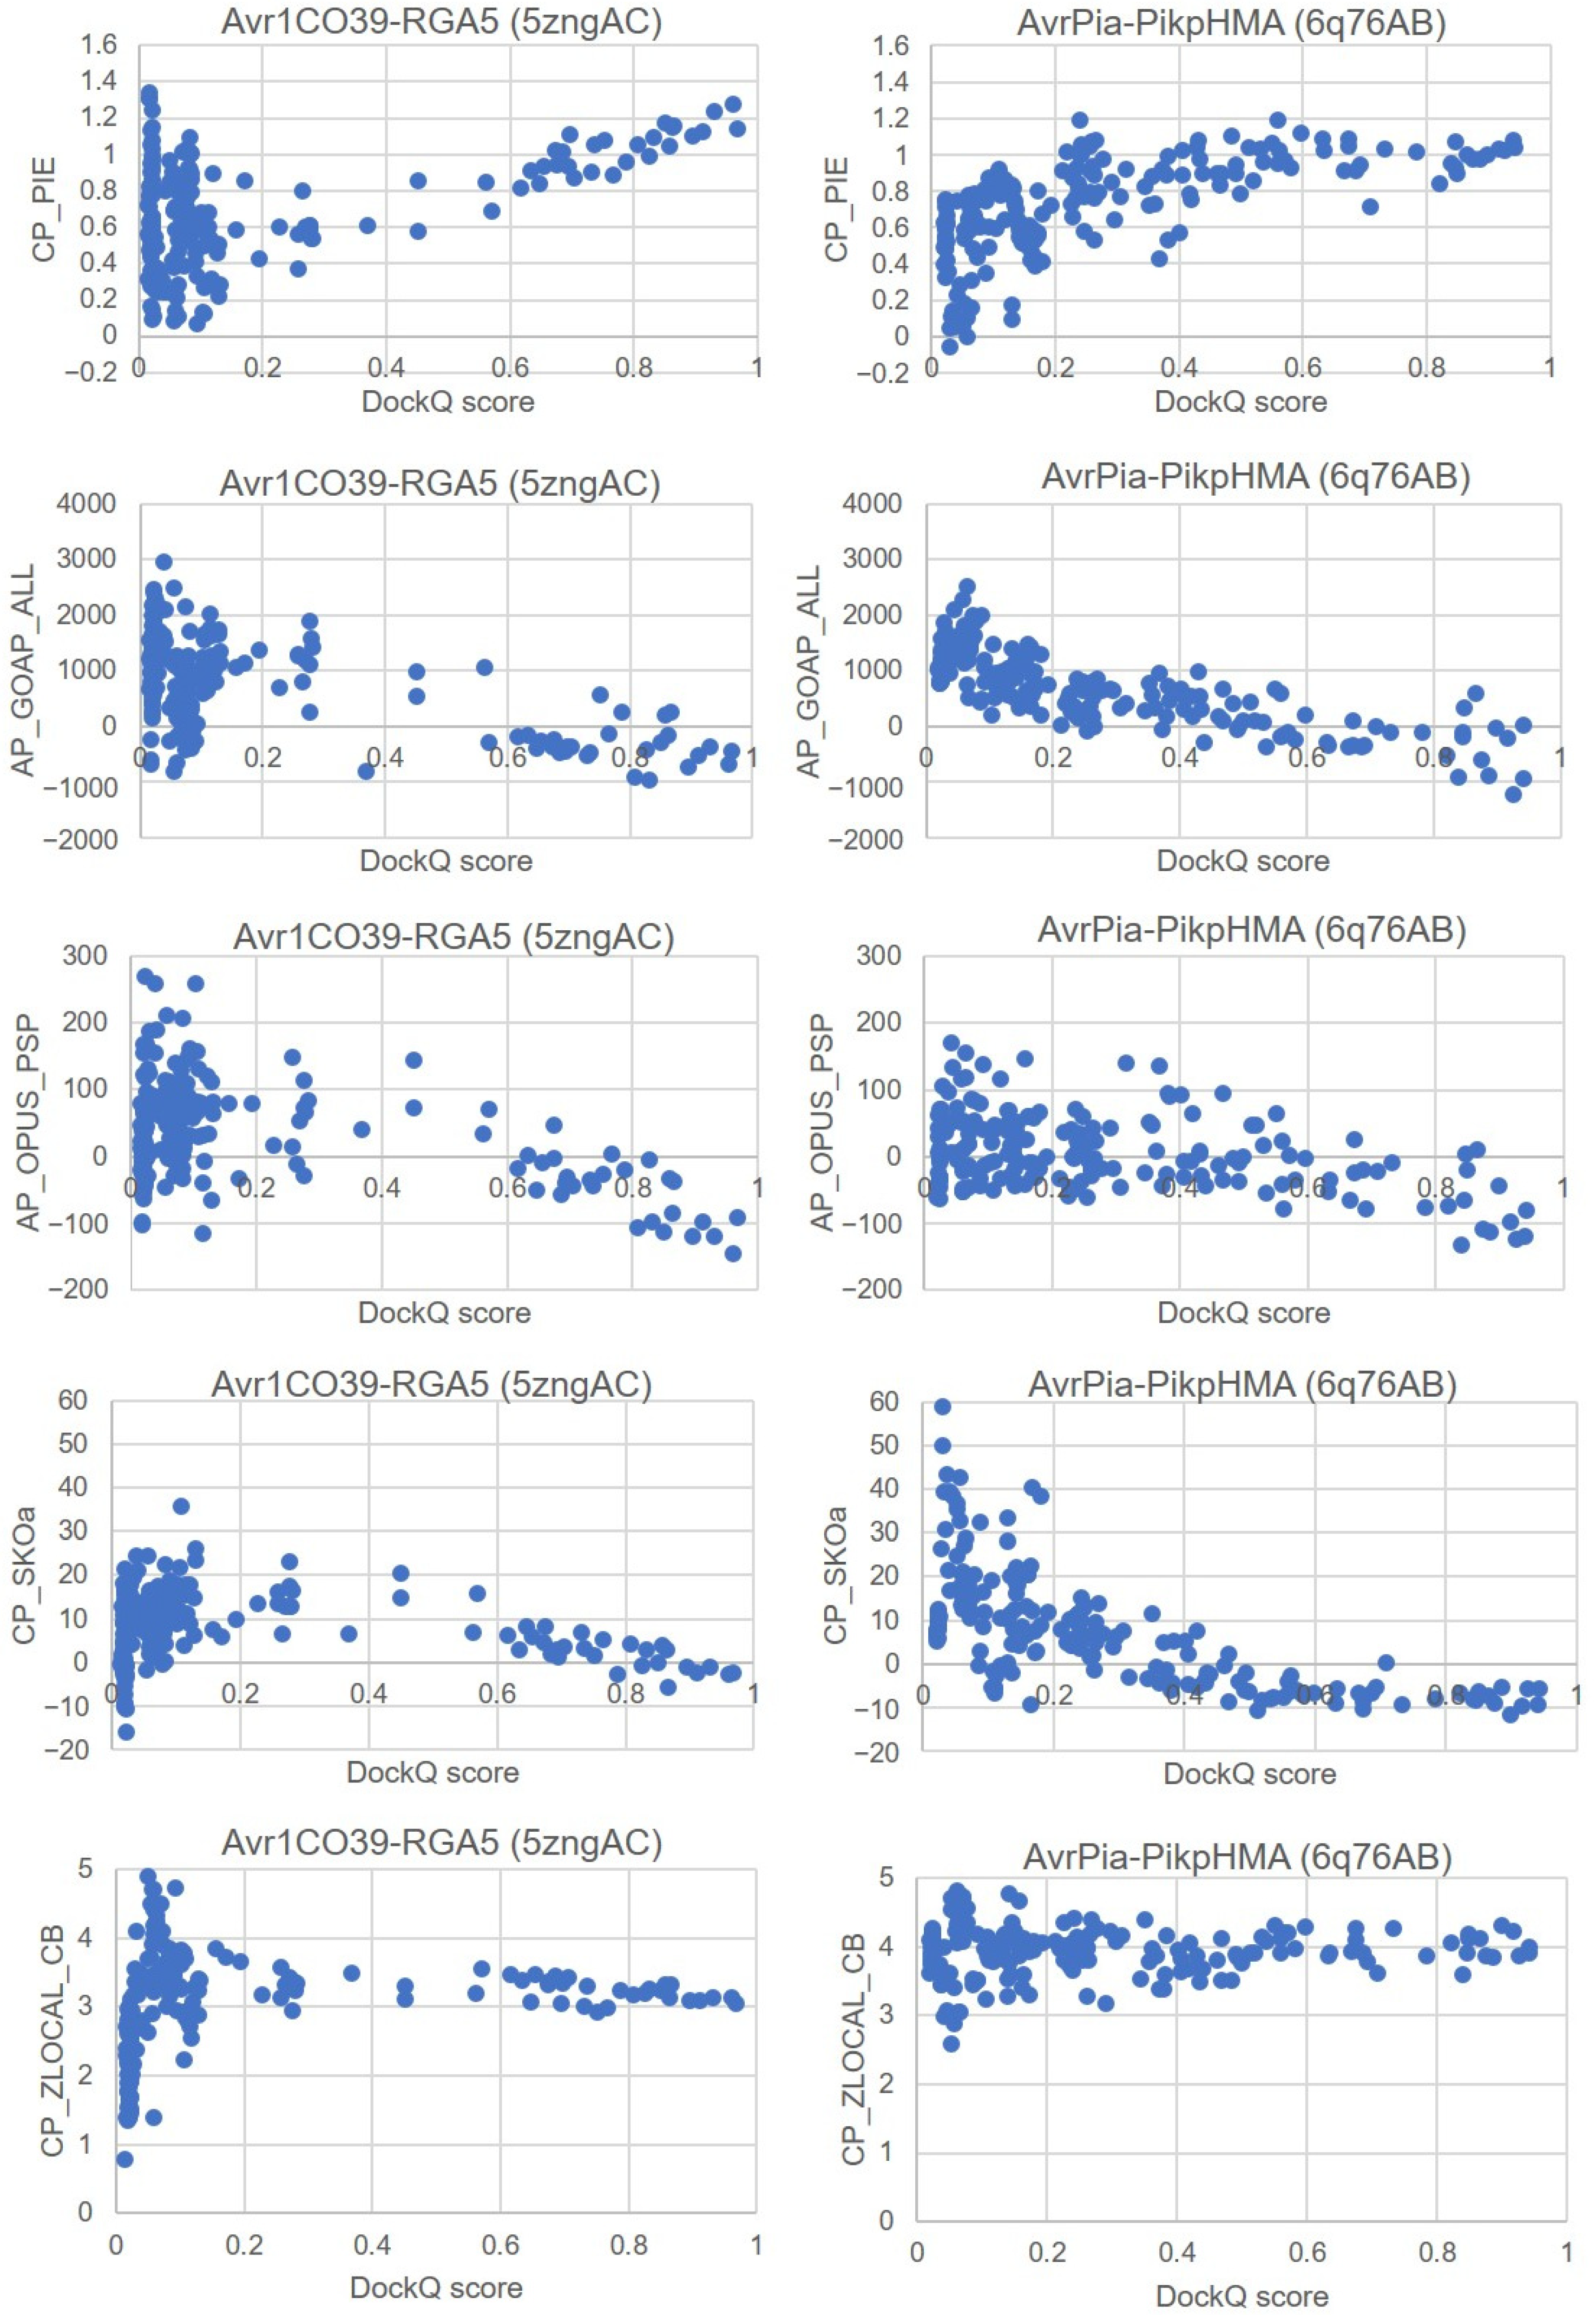
| CCharPPI Scoring Functions | Avr1CO39-RGA5 (5zngAC) | AvrPia-PikpHMA (6q76AB) | |||||
|---|---|---|---|---|---|---|---|
| Total Poses | DockQ < 0.5 | DockQ > 0.5 | Total Poses | DockQ < 0.5 | DockQ > 0.5 | ||
| Positive filter | (1) CP_PIE > 0.8 | 76 | 48 | 28 | 81 | 48 | 33 |
| (2) AP_GOAP_ALL < 0 | 39 | 15 | 23 | 29 | 5 | 23 | |
| (3) AP_OPUS_PSP < −100 | 7 | 1 | 6 | 5 | 0 | 5 | |
| Negative filter | (4) CP_SKOa > 0 | 6 | 0 | 6 | 5 | 0 | 5 |
| (5) CP_ZLOCAL_CB < 3 | 6 | 0 | 6 | 5 | 0 | 5 | |
| Host Receptor Binding Partner/Effector | AvrPikA (6fubD) | AvrPikC (7a8xC) | ||||||
|---|---|---|---|---|---|---|---|---|
| Rank | ZDOCK Score | Rank | ZRANK Score | Rank | ZDOCK Score | Rank | ZRANK Score | |
| PikmHMA/6fu9 | 3 | 60.52 | 2 | −106.805 | 22 | 51.30 | 14 | −88.187 |
| PikhHMA/7a8x | 10 | 51.64 | 21 | −79.4618 | 15 | 54.24 | 1 | −114.65 |
| PikpHMA/5a6w | 16 | 51.31 | 1 | −91.1659 | 10 | 51.82 | 3 | −87.068 |
| PikpHMA-mut/6r8m | 3 | 61.01 | 3 | −92.2020 | 1 | 63.85 | 1 | −111.540 |
| ancHMA/7bnt | 8 | 51.34 | 5 | −92.3646 | 4 | 53.23 | 89 | −67.468 |
| osHIPP19/7b1i | 1 | 71.15 | 2 | −107.887 | 11 | 57.32 | 5 | −94.782 |
| sHMA94/7nmm | 19 | 50.38 | 39 | −81.2881 | 5 | 54.58 | 4 | −93.776 |
| ApikL2F (7nmmI) | AvrPikD (5a6wC) | |||||||
| PikmHMA/6fu9 | 3 | 57.53 | 17 | −82.0646 | 5 | 62.53 | 2 | −101.76 |
| PikhHMA/7a8x | 2 | 54.29 | 1 | −92.6857 | 9 | 55.61 | 2 | −113.11 |
| PikpHMA/5a6w | 1 | 56.14 | 13 | −78.5247 | 13 | 56.28 | 1 | −116.840 |
| PikpHMA-mut/6r8m | 11 | 51.88 | 6 | −81.2988 | 1 | 71.46 | 1 | −115.93 |
| ancHMA/7bnt | 1 | 55.86 | 3 | −96.2088 | 1 | 65.07 | 3 | −104.54 |
| osHIPP19/7b1i | 2 | 69.92 | 1 | −100.196 | 12 | 60.54 | 1 | −116.76 |
| sHMA94/7nmm | 1 | 66.00 | 1 | −100.020 | 2 | 68.34 | 1 | −112.6 |
| AvrPikE (6g11C) | AvrPikF (7b1iC) | |||||||
| PikmHMA/6fu9 | 53 | 50.43 | 1 | −113.286 | 8 | 57.30 | 1 | −103.87 |
| PikhHMA/7a8x | 2 | 57.46 | 1 | −104.541 | 4 | 55.99 | 19 | −76.509 |
| PikpHMA/5a6w | 12 | 52.19 | 1 | −98.2134 | 15 | 51.03 | 1 | −92.64 |
| PikpHMA-mut 6r8m | 8 | 62.33 | 1 | −112.241 | 6 | 61.70 | 1 | −102.24 |
| ancHMA/7bnt | 6 | 54.53 | 1 | −94.1270 | 7 | 52.77 | 4 | −83.268 |
| osHIPP19/7b1i | 3 | 72.65 | 1 | −128.358 | 4 | 70.92 | 1 | −125.13 |
| sHMA94/7nmm | 4 | 61.76 | 1 | −104.071 | 4 | 62.12 | 1 | −96.3480 |
| Unbound Complexes | Number of Interacting Residues on the Effector | Number of Interacting Residues on the Host Receptor Binding Partner | ||
|---|---|---|---|---|
| Known | Predicted | Known | Predicted | |
| AvrPikA-osHIPP19 | 28 | 27 (87.5%) | 21 | 21 (100%) |
| AvrPikC-PikpHMAmutant | 21 | 21 (100%) | 23 | 23 (100%) |
| AvrPikD-PikpHMAmutant | 30 | 26 (86.6%) | 21 | 21 (100%) |
| AvrPikE-osHIPP19 | 27 | 25 (92.5%) | 24 | 24 (100%) |
| AvrPikF-osHIPP19 | 29 | 29 (100%) | 21 | 20 (95%) |
| ApikL2F-osHIPP19 | 24 | 24 (100%) | 21 | 21 (100%) |
| Unbound Complexes (PDB ID) | Number of Interacting Residues on the Effector | Number of Interacting Residues on the Host Receptor Binding Partner | ||
|---|---|---|---|---|
| Known | Predicted | Known | Predicted | |
| AvrPia (6q76B)-RGA5 (5zngA) | 10 | 10 (100%) | 13 | 10 (76.9%) |
| Avr1CO39 (5zngC)-PikpHMA (6q76A) | 8 | 8 (100%) | 11 | 11 (100%) |
Disclaimer/Publisher’s Note: The statements, opinions and data contained in all publications are solely those of the individual author(s) and contributor(s) and not of MDPI and/or the editor(s). MDPI and/or the editor(s) disclaim responsibility for any injury to people or property resulting from any ideas, methods, instructions or products referred to in the content. |
© 2023 by the authors. Licensee MDPI, Basel, Switzerland. This article is an open access article distributed under the terms and conditions of the Creative Commons Attribution (CC BY) license (https://creativecommons.org/licenses/by/4.0/).
Share and Cite
Rozano, L.; Hane, J.K.; Mancera, R.L. The Molecular Docking of MAX Fungal Effectors with Plant HMA Domain-Binding Proteins. Int. J. Mol. Sci. 2023, 24, 15239. https://doi.org/10.3390/ijms242015239
Rozano L, Hane JK, Mancera RL. The Molecular Docking of MAX Fungal Effectors with Plant HMA Domain-Binding Proteins. International Journal of Molecular Sciences. 2023; 24(20):15239. https://doi.org/10.3390/ijms242015239
Chicago/Turabian StyleRozano, Lina, James K. Hane, and Ricardo L. Mancera. 2023. "The Molecular Docking of MAX Fungal Effectors with Plant HMA Domain-Binding Proteins" International Journal of Molecular Sciences 24, no. 20: 15239. https://doi.org/10.3390/ijms242015239
APA StyleRozano, L., Hane, J. K., & Mancera, R. L. (2023). The Molecular Docking of MAX Fungal Effectors with Plant HMA Domain-Binding Proteins. International Journal of Molecular Sciences, 24(20), 15239. https://doi.org/10.3390/ijms242015239