Article

Unlocking the Potential of Carbon Quantum Dots for Cell Imaging, Intracellular Localization, and Gene Expression Control in Arabidopsis thaliana (L.) Heynh.

1
Fujian Academy of Agricultural Sciences Biotechnology Institute, Fuzhou 350003, China
2
College of Horticulture, Fujian Agriculture and Forestry University, Fuzhou 350002, China
*
Author to whom correspondence should be addressed.
Int. J. Mol. Sci. 2023, 24(21), 15700; https://doi.org/10.3390/ijms242115700
Submission received: 26 September 2023 / Revised: 25 October 2023 / Accepted: 26 October 2023 / Published: 28 October 2023
(This article belongs to the Special Issue Advances in Molecular Plant Sciences)

Abstract

:
Utilizing carbon quantum dots (CQDs) as biomaterials for delivering small substances has gained significant attention in recent research. However, the interactions and mechanisms of action of CQDs on plants have received relatively little focus. Herein, we investigated the transportation of CQDs into various organs of Arabidopsis thaliana (L.) Heynh. via the vessel system, leading to the epigenetic inheritance of Argonaute family genes. Our findings reveal that CQDs may interact with microRNAs (miRNAs), leading to the repression of post-transcriptional regulation of target genes in the cytoplasm. Transcriptome and quantitative PCR analyses demonstrated consistent gene expression levels in offspring. Moreover, microscopic observations illustrated rapid CQD localization on cell membranes and nuclei, with increased nuclear entry at higher concentrations. Notably, our study identified an alternative regulatory microRNA, microRNA172D, for the Argonaute family genes through methylation analysis, shedding light on the connection between CQDs and microRNAs.

1. Introduction

Nanotechnology and nanomaterials have seen extensive utilization in recent years [1,2]. Ever since the breakthrough discovery of carbon quantum dots in 2014, they have found applications across various domains, including biomedicine, sensor technology, optics, and catalysis [3,4]; the ability to penetrate cells; and rapid distribution in organisms [5]. Carbon-based quantum dots (CQDs) are generally classified as bright fluorescent carbon dots (FCDs) and graphene quantum dots (GQDs) [6,7]. CQDs are characterized by low toxicity, low cost, and chemical inertness, especially biocompatibility. So far, nanotechnology research has mainly been used to provide new methods for using nanoparticles as tools for gene delivery [8] and their applications in cell and animal biology [9]. Lately, CQDs have garnered attention for their potential role as regulators of plant growth in agriculture [10,11,12,13]. Nevertheless, there remains a scarcity of research investigating the interactions and mechanisms through which nanomaterials affect plants [14]. The remarkable attributes of CQDs offer a fresh perspective on the connections between plants and nanomaterials. In this context, transcriptome profiling emerges as a crucial method for comprehending the functional components of the genome, shedding light on alterations in the expression levels of various transcripts, including mRNAs, non-coding RNAs, and small RNAs, as detailed in reference [15].
Arabidopsis thaliana (L.) Heynh., a compact cruciferous plant, serves as an excellent choice for conducting research in the realms of plant molecular genetics, development, physiology, and biochemistry [16,17,18]. In the context of plant research, it is essential to understand the various RNA interference (RNAi) silencing pathways [19]. These pathways include cytoplasmic siRNA silencing [20], endogenous messenger RNAs by miRNAs [21], and DNA (deoxyribonucleic acid) methylation and transcriptional repression [22]. When mature small RNAs (smRNAs) are incorporated into the RNA-induced silencing complex (RISC), it participates in the regulation of the target gene expression at transcriptional or post-transcriptional levels [23].
Argonaute (AGO) proteins have been identified in plants, animals, and fungi [24,25]. Studies have consistently demonstrated that AGO proteins, acting as a central component of RISCs, play a pivotal role in mediating the RNA interference (RNAi) process [26], and are associated with three pathways of RNA silencing [19]. Arabidopsis contains 10 AGO proteins but mainly encodes 9 functional AGO proteins [27]. Arabidopsis AGOs are divided into three clades: AGO1, AGO5, and AGO10 are classified in the first clade; AGO2, AGO3, and AGO7 are classified in the second clade; AGO4, AGO6, AGO8, and AGO9 are classified in the third clade [28]. LBD21-1, as a transcription factor, promotes the transcriptional expression level of AGO10 protein by binding to the promoter region of AGO10 under salt stress conditions [29]. HOS1 acts as a regulator of miRNA, and it can regulate the AGO1 expression levels by affecting the transcription of MIR168b [30]. The 4′,6-diamidino-2-phenylindole (DAPI) was first synthesized in 1971 and binds to AT-rich DNA [31], and it has been used as a fluorochrome for mitochondrial or nuclear DNA [32].
The investigation into the intracellular localization and tracking of CQDs within plant cells and their impact on plant gene expression mechanisms is relatively scarce. The objectives of this study were to investigate the transport of CQDs within Arabidopsis thaliana, their influence on the inheritance of Argonaute family genes, and their potential role in microRNA-mediated gene regulation. Additionally, the study aimed to assess the stability of gene expression in the offspring; observe the cellular localization of CQDs, particularly under high concentrations; and identify a regulatory microRNA, microRNA172D, through methylation analysis. This research not only offers a theoretical foundation for potential applications of carbon nanomaterials in plants, but also lays the groundwork for enhancing the precise targeting of carbon nanomaterials within plant systems in the future.

2. Results

2.1. Characterization of CQDs

According to the transmission electron microscopy (TEM) (Figure 1A,B) and its corresponding size distribution image (Figure 1C), the CQDs synthesized were at a homogeneous and narrow distribution with an average size of 3.5 nm. The lattice spacing (marked by white arrows) corresponded to (100) facets of CQDs, demonstrating the crystallinity and formation of the materials, as depicted in Figure 1B [33,34]. The UV–VIS absorption spectra of CQDs (in Figure 1C) illustrate a distinct excitonic absorption band centered at 351 nm, indicating the high conjugation and quality of CQDs [35]. The photoluminescence (PL) emission of the CQD peak with an emissive peak was centered at about 458 nm with an excitation wavelength of 405 nm (Figure 1D). The Fourier transform infrared (FT-IR) spectra are shown in Figure 1E. The absorption peaks located at 3410 and 3280 cm−1 were assigned to the strong stretching vibration bands of O-H and N-H, respectively. The observed strong bands at 1560, 1380, and 1659 cm−1 were ascribed to C=N, C-N, and -COO- stretching vibrations, respectively [36,37]. The X-ray powder diffraction (XRD) pattern of the CQDs exhibited a broad (002) characteristic peak centered at around 24° (Figure 1F). The X-ray photoelectron spectroscopy (XPS) surveys confirmed the FT-IR data further (Figure 1G), in which the three prominent peaks were attributed to C 1s, O 1s, and N 1s, demonstrating that the primary compositions of CQDs were C, O, and N. The C 1s XPS spectrum in Figure 1H was deconvoluted into four peaks at 288.1, 286.6, 285.3, and 284.2 eV, which represent the C 1s states in C=O, C-O, C-N, and C-C, respectively [38]. The four deconvoluted peaks in Figure 1I belong to the N 1s states in pyridine N, amino N, pyridine N, and graphite N structure [39]. Many functional groups, such as -COOH, -OH, and -NH2-passivating the surface of the CQDs, as certified by the FTIR along with XPS, indicated meaningful application in hydrogen bonding with biomolecules.

2.2. Cell Localization of CQDs in Arabidopsis thaliana

We investigated the intracellular distribution of CQDs by employing leaf injection as our experimental method. The findings indicated that the distribution pattern of CQDs within cellular organelles exhibited a concentration-dependent relationship. Specifically, at lower concentrations, such as 80 mg/mL, CQDs predominantly accumulated within the cell membrane (Figure 2A). However, at high concentrations, i.e., 100 mg/mL, CQDs appeared significantly enriched in the nucleus in addition to the cell membrane (Figure 2B). The results of the repeated experiments are provided in Figure S1. Water-soluble CQDs have been shown to move freely through the organelles of Arabidopsis due to their small nanoparticle size.

2.3. Co-Localization Analyzation of AGO3/GFP Fusion Proteins and CQDs

To further verify the localization of CQDs in plant cells, we used Nicotiana benthamiana as a test material. Using DAPI as an internal reference, the results indicate that AtAGO3 was a nuclear-localized gene (Figure 3A). Co-localization of the AtAGO3 protein with CQDs showed that they tended to cluster in the nucleus. The experimental results show that the CQDs were negatively charged, whereas the GFP proteins were positively charged. Therefore, under the influence of an electric field, CQDs tended to accumulate around the nucleus (Figure 3B,C). Thus, further experiments showed that the range of motion of CQDs was closely related to their concentration.

2.4. The Moving Trail of CQDs in Arabidopsis thaliana

The entry of CQDs into Arabidopsis plants was demonstrated in two different ways. It is shown that CQDs were taken up by Arabidopsis roots via transmembrane transport, mainly from the root tip margin or root cell-by-cell delivery pathway (Figure 4A). When injected from the leaves, the CQDs were mainly transported by the phloem (Figure 4B). Confocal observations revealed that CQDs could be transported into different organs of Arabidopsis, including the Apical (Figure 4C), stem (Figure 4D), leaf (Figure 4E), flower stalk (Figure 4F), leaf pubescence (Figure 4G), and stomata (Figure 4H). The fluorescence of pollen grains shows that CQDs can entered not only anther tissue, but also pollen grains, providing epistasis for their influence on gene expression in Arabidopsis.

2.5. Transcriptome Analysis

Heatmap analysis of the transcriptomic data was carried out for the two experimental groups, i.e., CQDs and CK (control) (Figure S2A). Among all of the differentially expressed genes, we focused on the Argonaute family gene, AtAGO3, which was significantly differentially expressed between the two groups (Figure S2B).
The classification from the GO (Gene Ontology) enrichment showed that the main differentially expressed genes (DEGs) were clustered into three major categories: biological processes, cellular components, and molecular functions (Figure S2C), including cells, receptors, enzymes, etc. The results suggest that CQDs could stimulate changes in the transcription level of genes at a cellular or molecular level. The top 44 enriched KEGG (Kyoto Encyclopedia of Genes and Genomes) pathways associated with DEGs showed that the effects were focused on environmental information processing, cellular processes, genetic information processing, metabolism, and organismal systems. The “Environmental information processing” contained the largest numbers of DEGs comparatively different between CQDs and CK (Figure S2D).

2.6. Gene Expression Validation through RT-qPCR

To validate the expression profiling results, we selected nine genes of Arabidopsis thaliana that were significantly up- and down-regulated between CK and CQDs groups for further analysis (Figure 5A). The results of RT-qPCR confirmed that the expressions of the aforementioned genes, including AtAGO3, were altered. As most of the genes in the Argonaute family were expressed in the nucleus and belonged to the functional organelles of the cell, this was an advantage for our subsequent studies. One of the up-regulated genes from the Argonaute family was further selected as a target to analyze the mechanism of CQD influence.
In Arabidopsis thaliana, the Argonaute family gene consisted of a total of nine genes. The RT-qPCR analysis results showed that AtAGO1, AtAGO2, AtAGO3, AtAGO4, AtAGO7, and AtAGO10 were up-regulated, and AtAGO5, AtAGO6, and AtAGO9 were down-regulated by CQDs (Figure 5B). This suggests they were affected differently by CQDs in Arabidopsis.

2.7. Analysis of Genetic Properties of Targeted Genes

Quantitative expression analysis revealed that in the second generation (T1) of Arabidopsis thaliana, seven genes within the Argonaute family, namely AtAGO1, AtAGO3, AtAGO4, AtAGO6, AtAGO7, AtAGO9, and AtAGO10, exhibited consistent gene expression levels when compared to the control (CK). In the leaves, except for AtAGO7, the other six genes were down-regulated compared with the control (Figure 6A). In the stems, except for AtAGO10, the other six genes were down-regulated compared with the control (Figure 6B). However, the expression patterns in the seeds were quite specific, the AtAGO7 gene was down-regulated and the other six genes were up-regulated (Figure 6C). Interestingly, AtAGO2 and AtAGO5 had no detectable expression in the leaves, which may be related to their tissue-specific expression. All of this suggests that the effects of CQDs on the genes of Arabidopsis will continue to occur in the next generation as well.

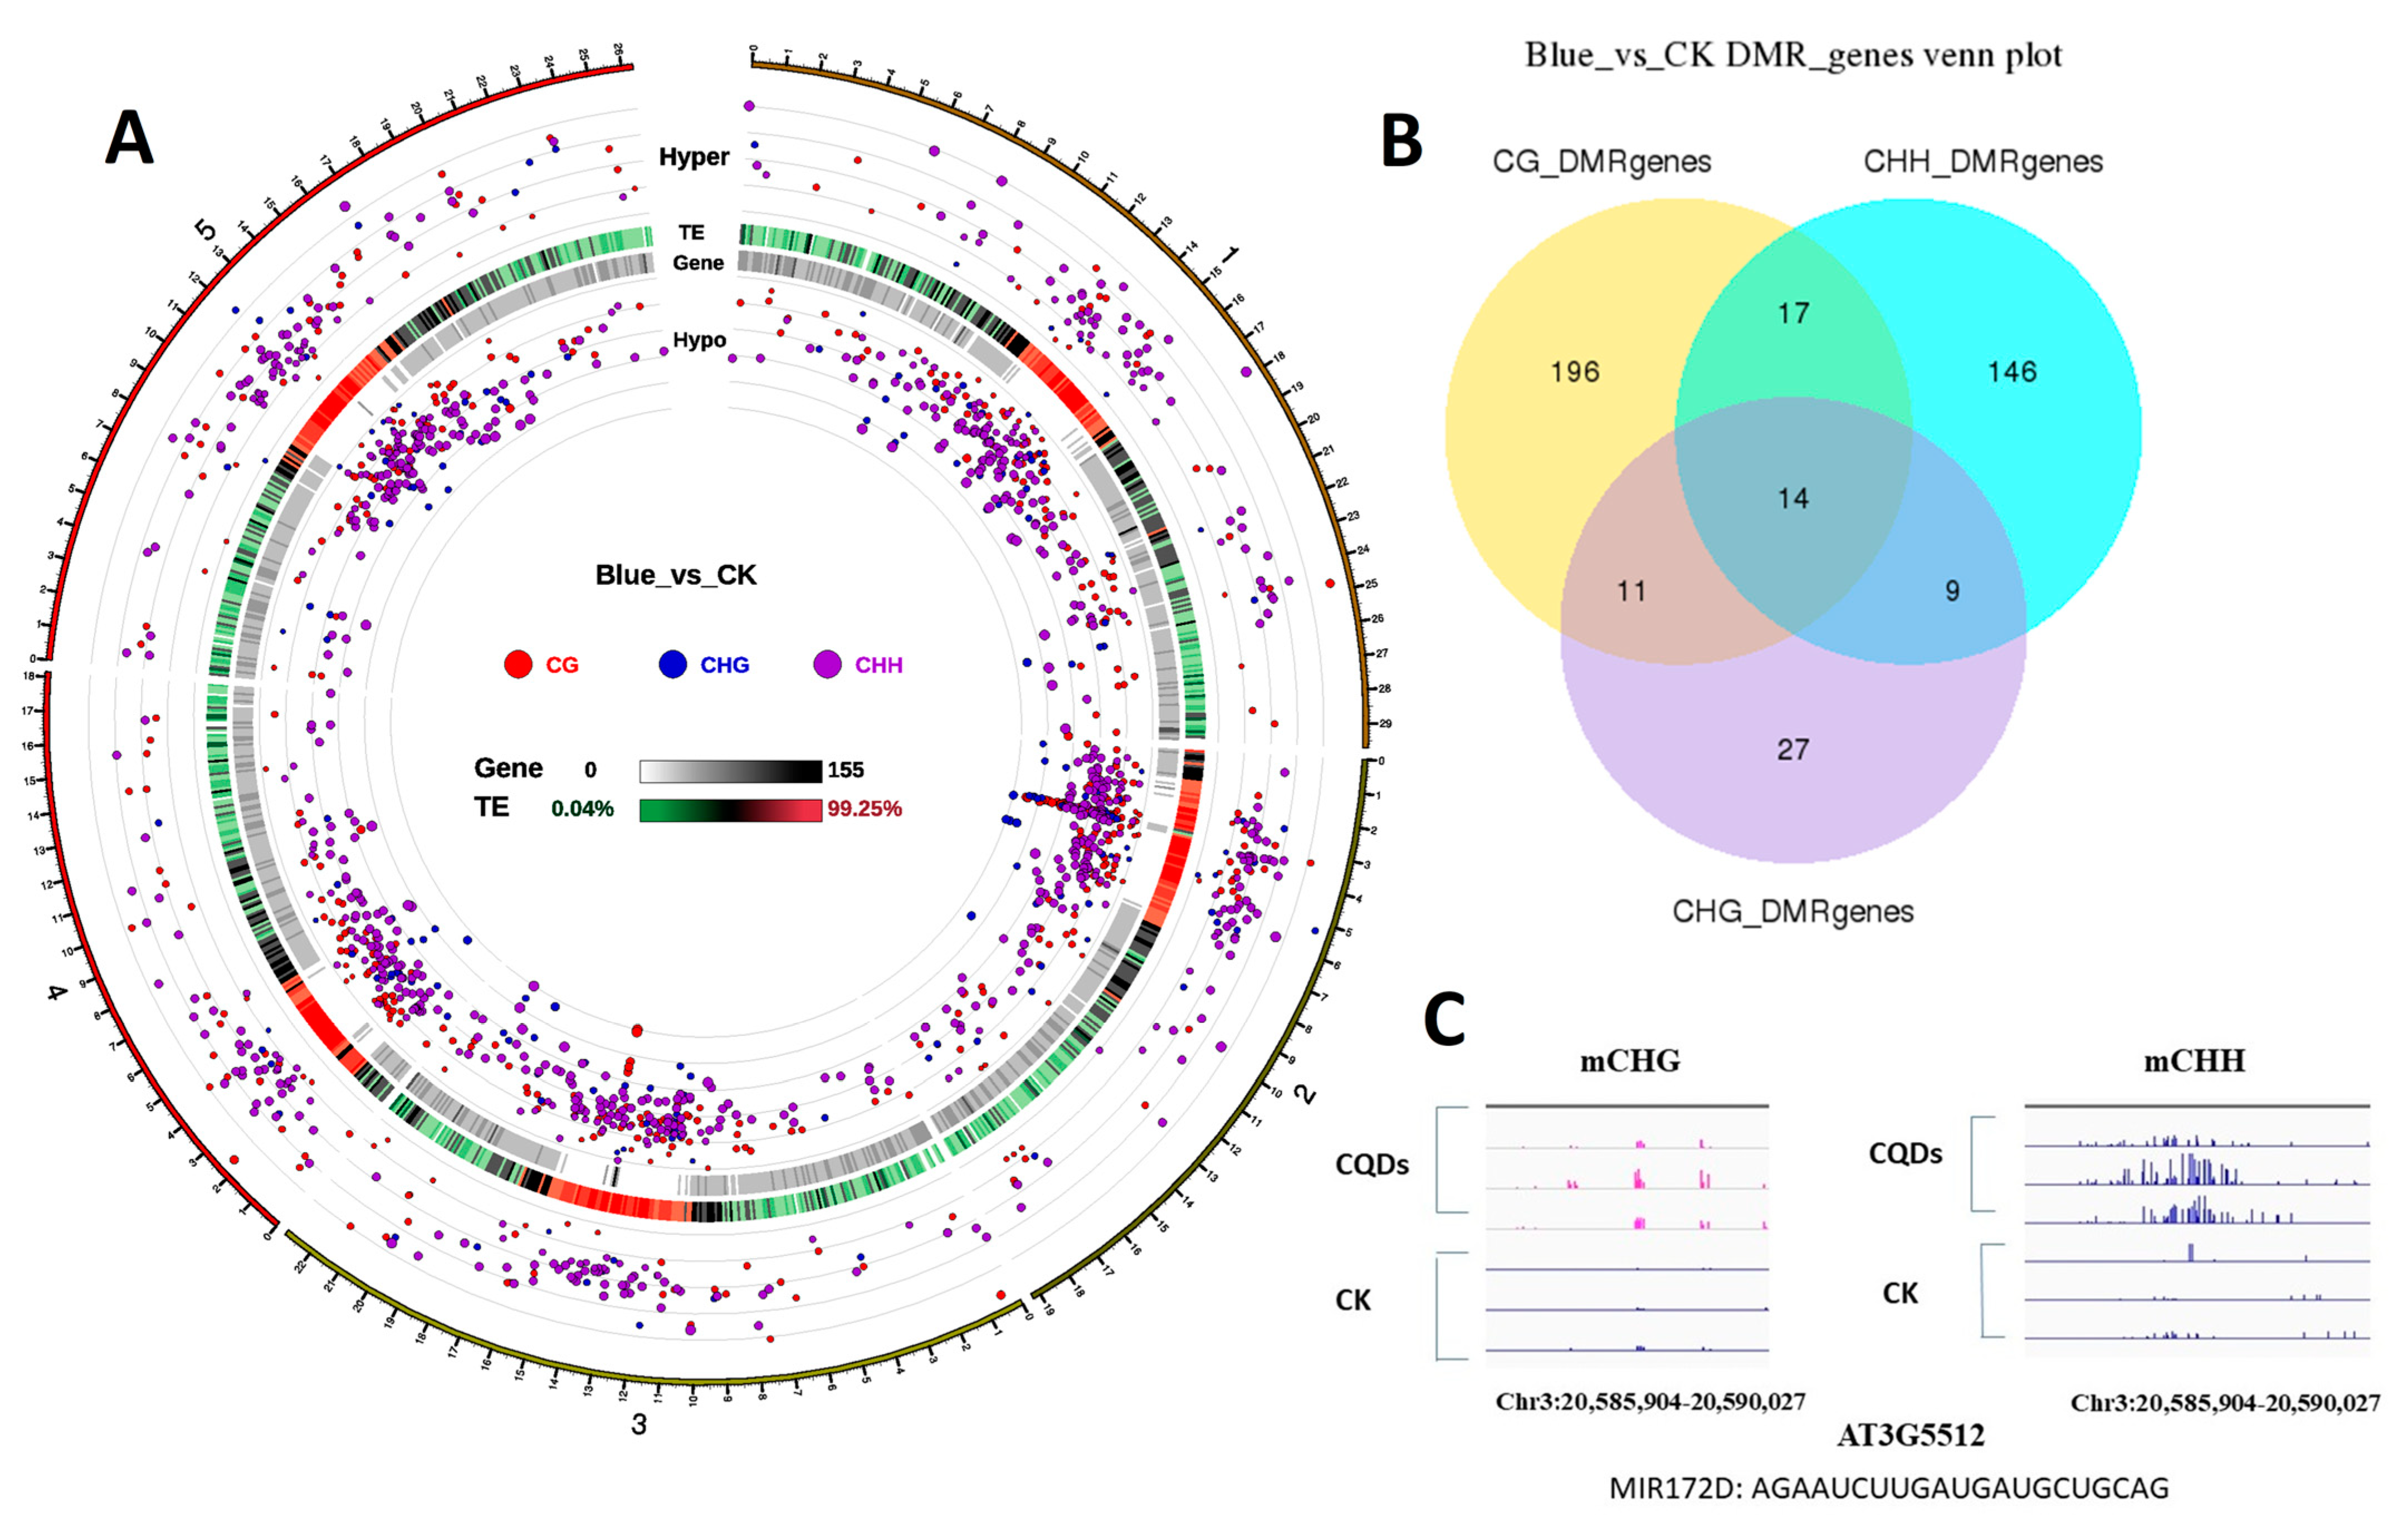
2.8. DNA Methylation

The methylation analysis revealed a large number of gene methylations between CQDs and CK, including CG, CHG, and CHH (Figure 7A,B). We detected microRNA172D using differential genes between CQDs and CK through DNA methylation analysis (Figure 7C). The Venn diagram shows that the methylation distribution of CQDs was found on CG, CHH, and CHG compared with CK, but there were relatively few methylated genes in CHG. Through gene analysis, we selected our nine genes of interest distributed between CHH and CHG in microRNA172D. The methylation analysis showed that mCHG and mCHH in the region between 20,585,904-20,590,027 on chromosome 3 were significantly increased in methylation between CQDs and CK.

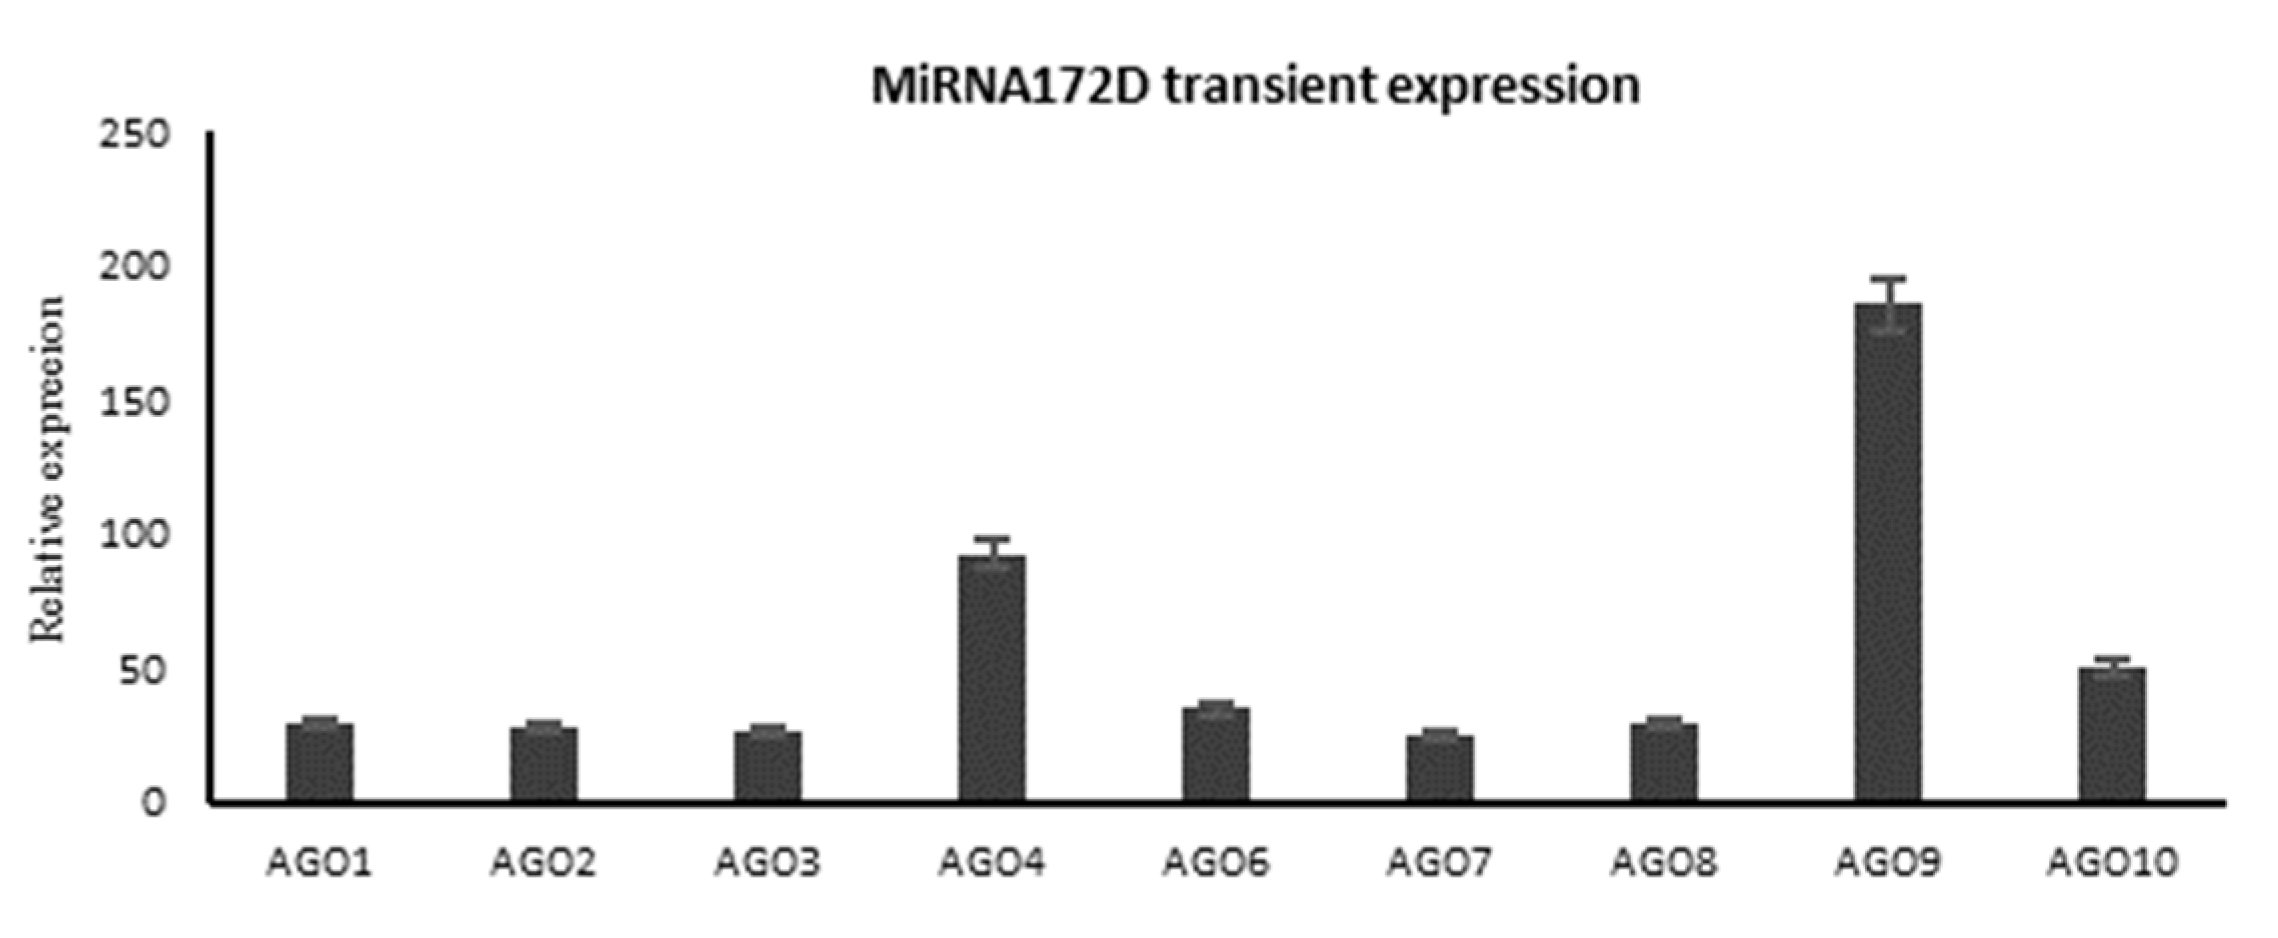
2.9. Transient Overexpression of microRNA172D in Arabidopsis

To further verify the true relationship between microRNA172D and Argonaute genes, we cloned the precursor of microRNA172D and A. tumefaciens-mediated transient expression of microRNA172D driven by the 35S promoter injected into Arabidopsis leaves. The results of RT-qPCR verified that the transient overexpression of microRNA172D induced a response in the Argonaute family genes, with the exception of AtAGO5 (Figure 8).

2.10. Hypothetical Model of CQDs in Plant Bodies and Cells

CQDs itself is hydrophilic and negatively charged, and the characteristics of plant cells create favorable conditions for CQDs (Figure 9A). So, this also allows CQDs to quickly reach every organ in the plant. Once CQDs enter the plant, they are transported by two main routes i.e., from the roots and vascular bundles. The CQDs are then localized in organelles such as the cell membranes or nucleus, depending on the concentration of CQDs (Figure 9B,C). Meanwhile, the results show that when the CQDs were in a low concentration (80 mg/mL), they were mainly located on the cell membrane (Figure 10A), then partially moved into the cells, including the nucleus, but they could not be observed by confocal observation. When the CQDs were at a high concentration (100 mg/mL), they were mainly located in the cell membrane and nucleus (Figure 10B).

3. Discussion

In the context of this research, the CQDs were synthesized with an average size of 3.5 nm. To render these CQDs water soluble, multiple hydrophobic groups were introduced [40,41,42,43]. The design helped the CQDs to easily enter the plant cell due to their hydrophilic property. In addition, the blue emission of CQDs was convenient for observation when multiple fluorescent emissions were used in a single sample.
The mechanism of transport through the cell membrane is usually divided into two categories: passive transport and active transport. Non-polar molecules penetrate more easily than polar ones, and small molecules without polarity can pass through a lipid bilayer, but it is impermeable to charged materials such as ions [44]. CQDs bind to the surface of the cell’s outer membrane due to their hydrophilic and negatively charged properties. CQDs pass through the cell membrane into the cell using their hydrophilicity, and once inside the cell, the two properties of hydrophilicity and charge play a role in guiding the CQDs to penetrate the cytoplasm/nucleus. Currently, most nanomaterials, especially CQDs, are mainly used as gene-delivery tools [45]. In this study, we used Arabidopsis thaliana and Nicotiana benthamiana as plant materials. After injecting the CQD-water solution into their leaves, the results revealed the presence of CQDs within plant cells and provided insights into how they affect plant genes. The main finding lies in the predominant transport pathways of CQDs within cells, primarily involving two routes: apoplast and transmembrane transport. When CQDs were introduced into the plant leaves, they quickly distributed themselves within the cell membrane and nucleus in a matter of minutes. In addition, the high concentration could obviously improve the ability of CQDs to localize in the nucleus. As the concentration increased, the amount that moved into the nucleus was more obvious. In addition, transcriptome analysis revealed its regulatory impact on genes in Arabidopsis responsible for encoding proteins localized in the nucleus and membrane, with a particular focus on stress- and disease-resistance-related genes (Figure 5A).
Importantly, the influence of CQDs on the expression of plant genes is heritable. Quantitative analysis of the AGO family genes in T1 leaves, stems, and seeds showed that most of these genes continued to be regulated at different expression levels, especially in seeds (Figure 5B). The methylation sequencing results showed that CQDs entering plant cells directly caused methylation of the plant genes, including small RNAs, e.g., microRNA172D was significantly methylated compared with the control (Figure 7C). Not many studies have shown that CQDs cause gene methylation in plants. The only research is on how to modify the CQDs to detect the methylation level of genes [46].
DAPI-DNA complexes emit maximum blue fluorescence at around 450 nm [47]. CQDs have the same blue emission characteristics as DAPI at 405 nm but are non-toxic to plant cells compared with DAPI. Therefore, CQDs or their improvements can be developed to replace DAPI in plant cell co-localization. In addition, unlike the widely used Q-point, the C-point itself contains no heavy metal components, so it can remain low or non-toxic to plant or animal tissues and organs [48]. Some metals that are toxic to plants, such as arsenic, can be effectively reduced by the combined use of point C and As for bio-toxic applications of arsenic, thus promoting plant growth [49]. In addition, amino CQDs synthesized from amino and carboxyl groups have shown stable fluorescence parameters in both dilute alkali metal solutions and seawater [50]. The unique properties of quantum dots, nanocrystals with high brightness and transformable fluorescence properties, have led to their widespread use in plant research, biomedicine, and industry, and thus research into the mechanism of action of quantum dots in cells, tissues, and organisms is essential [51]. In conclusion, although many nanomaterials inhibit plant growth, disrupt plant cell structure, and cause damage to plants, they have been widely used in various fields and in-depth research into their mechanisms is important for the environment and human health [52].

4. Materials and Methods

4.1. Experiment Material, Instruments, and Chemical Reagents

The CQDs (CAS:7440-44-0) were obtained from Jiangsu Xianfeng Nanomaterials Technology Co., Ltd. (Nanjing, China) Arabidopsis Columbia-0 (Col-0) ecotype and Nicotiana benthamiana were cultured in a greenhouse under long-day (16/8 h) conditions. These were grown at about 25–26 °C for four weeks. The optimum light intensity in the growth chamber was approximately 120–150 μmol/m2/s.
The morphology characterization of CQDs was achieved using a transmission electron microscope (Tecnai G2 F20). Photoluminescence (PL) spectra were recorded with a Hitachi F-4600 fluorescence spectrophotometer. The UV-VIS absorption spectra were tested with a UV/VIS/NIR spectrophotometer (Shimadzu, Columbia, MD, USA, UV-3600). X-ray diffraction (XRD) spectra were collected with an X’Pert PRO diffractometer (PANalytical). Fourier transform infrared spectroscopy (Nicolet is 50) was used to collect Fourier transform infrared (FT-IR) spectra by dropping CQDs on KBr transparent substrates in transmission mode [53].
CQDs (100 mg/mL, 80 mg/mL and 10 mg/mL), 1 μg liner DNA, 1 μg circular DNA, CQDs + 1 μg liner DNA, and CQDs + 1 μg circular DNA were prepared. All of these were electrophoresed in a 1.5% (w/v) agarose gel (Biowest, Riverside, MO, USA) at 100 V for 30 min, and photographed under UV conditions (Figure S3). TAE (Tris-acetate-EDTA) buffer containing 40 mM Tris, 20 mM acetic acid, and 1 mM EDTA was used for both the running buffer and agarose gel preparation.
CQDs were introduced into the plants using a standard syringe, benefiting from their water-soluble properties for easy integration with DNA. The DNA, selected randomly from conventional plasmids, was blended with CQDs to confirm that CQDs do not form bonds with DNA, but instead maintain their free dispersion within plant cells. It is worth noting that CQDs exhibit blue light emission at 405 nm, a distinctive feature absent in DNA. The objective was to underscore both the compatibility of CQDs with DNA and the unique optical properties of CQDs in comparison with DNA within the plant cell environment.

4.2. Transcriptome Analysis

The 3 days following the injection of CQDs into Arabidopsis leaves were used for cDNA library construction. Plants that were not subjected to injection served as the control (CK). Illumina 280 bp read pair technology was used to sequence the cDNA libraries. Low quality data with a qual value of less than 20 and consisting of short reads (length < 35 bp) were filtered from the raw data. Clean reads were aligned to the Arabidopsis genome using bowtie2 and tophat 2.0.14, htseq-count was then used to calculate the expected fragments per kilobase of mapped FPKM, and the edge R package in R was applied to identify DEGs with fold-change ≥2.0 or ≤2.0 (log2FC ≥ 1) and Benjamini-Hochberg corrected False Discovery Rate (FDR) ≤ 0.01. We used AgriGO (http://bioinfo.cau.edu.cn/agriGO/, accessed on 23 January 2023) and KOBAS 3.0 (http://kobas.cbi.pku.edu.cn, accessed on 23 January 2023) to perform GO functional enrichment analysis and KEGG enrichment analysis with default parameters.

4.3. Identification of DEGs

Clean reads were mapped to the unigenes library using Bowtie and the read count of each gene was derived by mapping the results using RSEM. Fragments per kilobase of transcript per million mapped reads (FPKMs) values were calculated for each of the unigenes to determine the expression profiles, and the differences in gene expression between CK and carbon treatments were analysed using DESeq using the FDR method. DEGs were identified using FDR < 0.01 and fold change (FC) ≥ 2 as thresholds, and cluster analysis was performed based on the differential expression of unigenes across samples. Unigenes expression was analysed in CK and CQDs treatment using Bowtie and RSEM software (version 0.6) and normalized to FPKM. Differential gene expression was assigned when (i) FDR values were <0.01 and (ii) fold-change (FC) was ≥2. The expression character of DEGs in Arabidopsis thaliana was defined as up-regulated or down-regulated according to their high or low levels, respectively [54]. DEGs expressed at higher levels in Arabidopsis were defined as up-regulated and DEGs expressed at lower levels in Arabidopsis were defined as down-regulated.

4.4. Subcellular Localization Analysis

The fluorescence emanating from the green fluorescent protein (GFP) and carbon quantum dots (CQDs) within transfected cells of either Arabidopsis or Nicotiana benthamiana was examined 48 h post-transfection, utilizing a Leica confocal microscope (TCSSP8, Leica Geosystems, Switzerland). DAPI, a fluorescent stain with a strong affinity for DNA, and CQDs were stimulated under ultraviolet (UV) illumination at a wavelength of 405 nm. Conversely, GFP was stimulated at 488 nm. For the purposes of fluorescence microscopy, DAPI was dissolved within a 0.025 M Tris-HCI buffer with a pH of 7.0. Subsequently, it was blended with other constituents on microscope slides to attain a final concentration of 50 pg/mL [55].

4.5. DNA Methylation

The DNeasy Plant Mini Kit (QIAGEN, Hilden, Germany) was used for DNA extraction. The genomic DNA was randomly interrupted at 200–300 bp using S220 Focused-ultrasonicator (Covaris, Brighton, UK); the interrupted DNA fragments were end-repaired, A-tailed, and ligated to sequencing junctions with all cytosines modified by methylation. After bisulfite treatment (using EZ DNA Methylation Gold Kit, Zymo Research, Beijing, China), the unmethylated C became U (T after PCR amplification), while the methylated C remained unchanged, and the final DNA library was amplified by PCR. Quantitative assays were then performed. Initial quantification was performed using Qubit 2.0 Fluorometer (Thermo Fisher Scientific, Shanghai, China), diluting the library to 1 ng/μL, followed by detection of the library insert length using a 2100 Bioanalyzer (Agilent, Santa Clara, CA, USA). Different libraries were pooled according to the effective concentration and the target downstream data volume required for Illumina HiSeq/MiSeq sequencing. For methylation site detection, many kinds of analyses were performed, including methylation site IGV (Integrative Genomics Viewer) visualization, methylation density circos plot, functional region heat map, differential methylation level circos plot, DMR (differentially methylated region) anchored region distribution, DMR-related gene GO enrichment, KEGG enrichment, etc. Methylation sequencing was performed by Novozymes Biotechnology Co., Ltd., Beijing, China.

4.6. Vector Construction and Transient Transformation

For miRNA overexpression, the precursor microRNA172D or MIR172D was amplified by PCR using primers miF2 and miR2. The PCR product was cloned into pCXUN containing the maize ubiquitin promoter to construct the overexpression vector by TA cloning (Figure S4). Agrobacterium tumefaciens ((Smith and Townsend) Conn.) G3101 was transformed and injected into tobacco. A single microRNA172D overexpressing colony was picked and incubated overnight at 250 rpm/min on LB medium with 50 μg/mL of kanamycin and 100 μg/mL of rifampicin, centrifuged to collect the organisms, lysed in infection medium (4.88 g MES, 2.5 g glucose, 0.2 g NaH2PO4), allowed to stand for 2 h at room temperature, and injected into tobacco leaves.

4.7. RNA Extraction and RT-qPCR Analysis

The total RNA was extracted from 100 mg of frozen plant tissue using an RNAprep pure Plant Kit (Tiangen, Beijing, China). The cDNA was synthesized using a FastQuant RT Kit with gDNase (Tiangen, China). Each 20 μL reaction mixture was prepared using SYBR Premix Ex TaqTMII (Takara, Kusatsu, Japan) on an ABI 7500 (ABI, Los Angeles, CA, USA). The RT-qPCR process was as 95 °C for 2 min and 40 cycles of 95 °C for 15 s and 60 °C for 30 s. The gene expression changes were calculated using the 2−ΔΔCT method [56]. At least three independent experiments were performed with three technical replicates for each reaction. The primers used for RT-qPCR analysis are listed in Table S1, using a housekeeping gene (Actin 2) in Arabidopsis thaliana as the internal references.

5. Conclusions and Future Prospects

Carbon-based nanomaterials have always been a hot area of research in plant applications, including for the construction of gene delivery platforms and the promotion of plant growth [57,58,59]. In our study, we chose a carbon dot and found that it localized well in plant cells and could be efficiently enriched in the cell membrane or nucleus within a few minutes. However, the cell membrane and nucleus are important functional organelles in plants, and the subcellular localization of several functional genes occurs in these two organelles. So, CQDs can be used in the future to achieve the delivery function of bio-regulatory elements by adding groups. Secondly, our comparison of CQDs with DAPI shows that CQDs of a high concentration can replace DAPI as an indicator label for subcellular localization of the nucleus in biological research, even with a low toxicity and high efficiency. Furthermore, it has been shown that the CQDs can be transported through the phloem vessels of Arabidopsis thaliana, which can be used in the future for fertilization and water transport. Importantly, we have observed that they can enter the floral organs of Arabidopsis thaliana, suggesting that the effect on the reproductive development of the plant provides a plasticity for genetic improvement. Of course, the most important aspect of this study is that through the interaction of CQDs with plants, we have shown, using transcriptomics and methylation sequencing, that CQDs cause methylation of the plant genes, which changes the transcription levels of the genes. This is well demonstrated by the influence of the Argonaute gene family. In particular, in the relationship between microRNAs and Argonaute genes, we have used CQDs to uncover a potential new mechanism, namely that the methylation of microRNA172D may directly regulate the expression of the Argonaute gene family.
Taken together, our results suggest that CQDs can freely enter plant organelles, and the data on gene influence may provide a theoretical basis for further modification of CQDs in the future.

Supplementary Materials

The following supporting information can be downloaded at: https://www.mdpi.com/article/10.3390/ijms242115700/s1.

Author Contributions

Conceptualization, Z.L. and F.C.; methodology, M.M.A., X.Y., L.Z. and S.W.; software, Z.L. and M.M.A.; validation, M.M.A. and F.C.; formal analysis, M.M.A., X.Y., and L.Z.; investigation, M.M.A., X.Y., and L.Z.; resources, Z.L. and F.C.; data curation, Z.L. and M.M.A.; writing—original draft preparation, Z.L. and M.M.A.; writing—review and editing, X.Y., L.Z., S.W. and F.C.; visualization, M.M.A.; supervision, Z.L.; project administration, Z.L.; funding acquisition, Z.L. All authors have read and agreed to the published version of the manuscript.

Funding

This research was funded by Fujian Forestry Science and Technology Project, grant number (ZMGG-0711) and the Science and Technology Innovation Platform Project of Fujian Academy of Agricultural Sciences, grant number (CXPT202204).

Institutional Review Board Statement

Not applicable.

Informed Consent Statement

Not applicable.

Data Availability Statement

The data presented in this study are available upon request from the corresponding author.

Conflicts of Interest

The authors declare no conflict of interest.

References

  1. Javed, T.; Shabbir, R.; Hussain, S.; Naseer, M.A.; Ejaz, I.; Ali, M.M.; Ahmar, S.; Yousef, A.F. Nanotechnology for Endorsing Abiotic Stresses: A Review on the Role of Nanoparticles and Nanocompositions. Funct. Plant Biol. 2022. [Google Scholar] [CrossRef] [PubMed]
  2. Abdelghany, A.M.; El-Banna, A.A.A.; Salama, E.A.A.; Ali, M.M.; Al-Huqail, A.A.; Ali, H.M.; Paszt, L.S.; El-Sorady, G.A.; Lamlom, S.F. The Individual and Combined Effect of Nanoparticles and Biofertilizers on Growth, Yield, and Biochemical Attributes of Peanuts (Arachis Hypogea L.). Agronomy 2022, 12, 398. [Google Scholar] [CrossRef]
  3. Das, R.; Bandyopadhyay, R.; Pramanik, P. Carbon Quantum Dots from Natural Resource: A Review. Mater. Today Chem. 2018, 8, 96–109. [Google Scholar] [CrossRef]
  4. Lim, S.Y.; Shen, W.; Gao, Z. Carbon Quantum Dots and Their Applications. Chem. Soc. Rev. 2015, 44, 362–381. [Google Scholar] [CrossRef]
  5. Khodakovskaya, M.V.; de Silva, K.; Biris, A.S.; Dervishi, E.; Villagarcia, H. Carbon Nanotubes Induce Growth Enhancement of Tobacco Cells. ACS Nano 2012, 6, 2128–2135. [Google Scholar] [CrossRef] [PubMed]
  6. Sun, Y.-P.; Zhou, B.; Lin, Y.; Wang, W.; Fernando, K.A.S.; Pathak, P.; Meziani, M.J.; Harruff, B.A.; Wang, X.; Wang, H.; et al. Quantum-Sized Carbon Dots for Bright and Colorful Photoluminescence. J. Am. Chem. Soc. 2006, 128, 7756–7757. [Google Scholar] [CrossRef] [PubMed]
  7. Pan, D.; Zhang, J.; Li, Z.; Wu, M. Hydrothermal Route for Cutting Graphene Sheets into Blue-Luminescent Graphene Quantum Dots. Adv. Mater. 2010, 22, 734–738. [Google Scholar] [CrossRef]
  8. Torney, F.; Trewyn, B.G.; Lin, V.S.-Y.; Wang, K. Mesoporous Silica Nanoparticles Deliver DNA and Chemicals into Plants. Nat. Nanotechnol. 2007, 2, 295–300. [Google Scholar] [CrossRef]
  9. Michalet, X.; Pinaud, F.F.; Bentolila, L.A.; Tsay, J.M.; Doose, S.; Li, J.J.; Sundaresan, G.; Wu, A.M.; Gambhir, S.S.; Weiss, S. Quantum Dots for Live Cells, in Vivo Imaging, and Diagnostics. Science 2005, 307, 538–544. [Google Scholar] [CrossRef]
  10. Tripathi, S.; Sarkar, S. Influence of Water Soluble Carbon Dots on the Growth of Wheat Plant. Appl. Nanosci. 2015, 5, 609–616. [Google Scholar] [CrossRef]
  11. Park, S.Y.; Lee, H.U.; Park, E.S.; Lee, S.C.; Lee, J.-W.; Jeong, S.W.; Kim, C.H.; Lee, Y.-C.; Huh, Y.S.; Lee, J. Photoluminescent Green Carbon Nanodots from Food-Waste-Derived Sources: Large-Scale Synthesis, Properties, and Biomedical Applications. ACS Appl. Mater. Interfaces 2014, 6, 3365–3370. [Google Scholar] [CrossRef] [PubMed]
  12. Li, W.; Zheng, Y.; Zhang, H.; Liu, Z.; Su, W.; Chen, S.; Liu, Y.; Zhuang, J.; Lei, B. Phytotoxicity, Uptake, and Translocation of Fluorescent Carbon Dots in Mung Bean Plants. ACS Appl. Mater. Interfaces 2016, 8, 19939–19945. [Google Scholar] [CrossRef] [PubMed]
  13. Nair, R.; Poulose, A.C.; Nagaoka, Y.; Yoshida, Y.; Maekawa, T.; Kumar, D.S. Uptake of FITC Labeled Silica Nanoparticles and Quantum Dots by Rice Seedlings: Effects on Seed Germination and Their Potential as Biolabels for Plants. J. Fluoresc. 2011, 21, 2057–2068. [Google Scholar] [CrossRef]
  14. Azeem, I.; Adeel, M.; Ahmad, M.A.; Shakoor, N.; Jiangcuo, G.D.; Azeem, K.; Ishfaq, M.; Shakoor, A.; Ayaz, M.; Xu, M.; et al. Uptake and Accumulation of Nano/Microplastics in Plants: A Critical Review. Nanomaterials 2021, 11, 2935. [Google Scholar] [CrossRef] [PubMed]
  15. Wang, Z.; Gerstein, M.; Snyder, M. RNA-Seq: A Revolutionary Tool for Transcriptomics. Nat. Rev. Genet. 2009, 10, 57–63. [Google Scholar] [CrossRef]
  16. Steinitz-Sears, L.M. Chromosome Studies in Arabidopsis Thaliana. Genetics 1963, 48, 483–490. [Google Scholar] [CrossRef]
  17. Röbbelen, G. Arabidopsis Research. Science 1965, 150, 1192. [Google Scholar] [CrossRef]
  18. Meyerowitz, E.M. Arabidopsis Thaliana. Annu. Rev. Genet. 1987, 21, 93–111. [Google Scholar] [CrossRef]
  19. Baulcombe, D. RNA Silencing in Plants. Nature 2004, 431, 356–363. [Google Scholar] [CrossRef]
  20. Hamilton, A.J.; Baulcombe, D.C. A Species of Small Antisense RNA in Posttranscriptional Gene Silencing in Plants. Science 1999, 286, 950–952. [Google Scholar] [CrossRef]
  21. Bartel, D.P. MicroRNAs: Genomics, Biogenesis, Mechanism, and Function. Cell 2004, 116, 281–297. [Google Scholar] [CrossRef] [PubMed]
  22. Wassenegger, M.; Heimes, S.; Riedel, L.; Sänger, H.L. RNA-Directed de Novo Methylation of Genomic Sequences in Plants. Cell 1994, 76, 567–576. [Google Scholar] [CrossRef] [PubMed]
  23. Vaucheret, H. Plant ARGONAUTES. Trends Plant Sci. 2008, 13, 350–358. [Google Scholar] [CrossRef] [PubMed]
  24. Mallory, A.; Vaucheret, H. Form, Function, and Regulation of ARGONAUTE Proteins. Plant Cell 2010, 22, 3879–3889. [Google Scholar] [CrossRef]
  25. Li, Z.; Li, W.; Guo, M.; Liu, S.; Liu, L.; Yu, Y.; Mo, B.; Chen, X.; Gao, L. Origin, Evolution and Diversification of Plant ARGONAUTE Proteins. Plant J. 2022, 109, 1086–1097. [Google Scholar] [CrossRef]
  26. Wang, H.; Zhang, X.; Liu, J.; Kiba, T.; Woo, J.; Ojo, T.; Hafner, M.; Tuschl, T.; Chua, N.; Wang, X. Deep Sequencing of Small RNAs Specifically Associated with Arabidopsis AGO1 and AGO4 Uncovers New AGO Functions. Plant J. 2011, 67, 292–304. [Google Scholar] [CrossRef]
  27. Zhang, Z.; Liu, X.; Guo, X.; Wang, X.-J.; Zhang, X. Arabidopsis AGO3 Predominantly Recruits 24-Nt Small RNAs to Regulate Epigenetic Silencing. Nat. Plants 2016, 2, 16049. [Google Scholar] [CrossRef]
  28. Gan, D.; Zhan, M.; Yang, F.; Zhang, Q.; Hu, K.; Xu, W.; Lu, Q.; Zhang, L.; Liang, D. Expression Analysis of Argonaute, Dicer-like, and RNA-Dependent RNA Polymerase Genes in Cucumber (Cucumis Sativus L.) in Response to Abiotic Stress. J. Genet. 2017, 96, 235–249. [Google Scholar] [CrossRef]
  29. Ma, W.; Wu, F.; Sheng, P.; Wang, X.; Zhang, Z.; Zhou, K.; Zhang, H.; Hu, J.; Lin, Q.; Cheng, Z.; et al. The LBD12-1 Transcription Factor Suppresses Apical Meristem Size by Repressing Argonaute 10 Expression. Plant Physiol. 2017, 173, 801–811. [Google Scholar] [CrossRef]
  30. Wang, B.; Duan, C.; Wang, X.; Hou, Y.; Yan, J.; Gao, C.; Kim, J.; Zhang, H.; Zhu, J. HOS1 Regulates Argonaute1 by Promoting Transcription of the MicroRNA Gene MIR168b in Arabidopsis. Plant J. 2015, 81, 861–870. [Google Scholar] [CrossRef]
  31. Schweizer, D. Reverse Fluorescent Chromosome Banding with Chromomycin and DAPI. Chromosoma 1976, 58, 307–324. [Google Scholar] [CrossRef]
  32. Williamson, D.H.; Fennell, D.J. The Use of Fluorescent DNA-Binding Agent for Detecting and Separating Yeast Mitochondrial DNA. In Methods in Cell Biology; Academic Press: Cambridge, MA, USA, 1975; pp. 335–351. [Google Scholar]
  33. Li, H.; Shi, W.; Huang, W.; Yao, E.-P.; Han, J.; Chen, Z.; Liu, S.; Shen, Y.; Wang, M.; Yang, Y. Carbon Quantum Dots/TiO x Electron Transport Layer Boosts Efficiency of Planar Heterojunction Perovskite Solar Cells to 19%. Nano Lett. 2017, 17, 2328–2335. [Google Scholar] [CrossRef]
  34. Dong, Y.; Chen, C.; Lin, J.; Zhou, N.; Chi, Y.; Chen, G. Electrochemiluminescence Emission from Carbon Quantum Dot-Sulfite Coreactant System. Carbon N. Y. 2013, 56, 12–17. [Google Scholar] [CrossRef]
  35. Ai, L.; Song, Z.; Nie, M.; Yu, J.; Liu, F.; Song, H.; Zhang, B.; Waterhouse, G.I.N.; Lu, S. Solid-state Fluorescence from Carbon Dots Widely Tunable from Blue to Deep Red through Surface Ligand Modulation. Angew. Chem. Int. Ed. 2023, 62, e202217822. [Google Scholar] [CrossRef] [PubMed]
  36. Qu, S.; Zhou, D.; Li, D.; Ji, W.; Jing, P.; Han, D.; Liu, L.; Zeng, H.; Shen, D. Toward Efficient Orange Emissive Carbon Nanodots through Conjugated Sp 2 -Domain Controlling and Surface Charges Engineering. Adv. Mater. 2016, 28, 3516–3521. [Google Scholar] [CrossRef] [PubMed]
  37. Xu, Q.; Pu, P.; Zhao, J.; Dong, C.; Gao, C.; Chen, Y.; Chen, J.; Liu, Y.; Zhou, H. Preparation of Highly Photoluminescent Sulfur-Doped Carbon Dots for Fe (III) Detection. J. Mater. Chem. A 2015, 3, 542–546. [Google Scholar] [CrossRef]
  38. Yang, G.; Wan, X.; Liu, Y.; Li, R.; Su, Y.; Zeng, X.; Tang, J. Luminescent Poly(Vinyl Alcohol)/Carbon Quantum Dots Composites with Tunable Water-Induced Shape Memory Behavior in Different PH and Temperature Environments. ACS Appl. Mater. Interfaces 2016, 8, 34744–34754. [Google Scholar] [CrossRef] [PubMed]
  39. Yuan, F.; Wang, Z.; Li, X.; Li, Y.; Tan, Z.; Fan, L.; Yang, S. Bright Multicolor Bandgap Fluorescent Carbon Quantum Dots for Electroluminescent Light-Emitting Diodes. Adv. Mater. 2017, 29, 1604436. [Google Scholar] [CrossRef]
  40. Zheng, B.; Liu, X.; Hu, J.; Wang, F.; Hu, X.; Zhu, Y.; Lv, X.; Du, J.; Xiao, D. Construction of Hydrophobic Interface on Natural Biomaterials for Higher Efficient and Reversible Radioactive Iodine Adsorption in Water. J. Hazard. Mater. 2019, 368, 81–89. [Google Scholar] [CrossRef]
  41. Hsu, P.-C.; Chang, H.-T. Synthesis of High-Quality Carbon Nanodots from Hydrophilic Compounds: Role of Functional Groups. Chem. Commun. 2012, 48, 3984. [Google Scholar] [CrossRef]
  42. Yan, M.; Zhou, M.; Chen, J.; Zhao, T.; Tang, L.; Bi, H. Fluorescent CDs@PCL Hybrids via Tartaric Acid, CDs-Cocatalyzed Polymerization. Mater. Sci. Eng. C 2017, 79, 76–83. [Google Scholar] [CrossRef]
  43. Wiśniewski, M. The Consequences of Water Interactions with Nitrogen-Containing Carbonaceous Quantum Dots—The Mechanistic Studies. Int. J. Mol. Sci. 2022, 23, 14292. [Google Scholar] [CrossRef]
  44. Stillwell, W. Membrane Transport. In An Introduction to Biological Membranes; Elsevier: Amsterdam, The Netherlands, 2016; pp. 423–451. [Google Scholar]
  45. You, S.; Cai, Q.; Zheng, Y.; He, B.; Shen, J.; Yang, W.; Yin, M. Perylene-Cored Star-Shaped Polycations for Fluorescent Gene Vectors and Bioimaging. ACS Appl. Mater. Interfaces 2014, 6, 16327–16334. [Google Scholar] [CrossRef]
  46. Dong, D.; Zhang, J.; Zhang, R.; Li, F.; Li, Y.; Jia, Y. Multiprobe Assay for Clinical SEPT9 Methylation Based on the Carbon Dot-Modified Liquid-Exfoliated Graphene Field Effect Transistor with a Potential to Present a Methylation Panorama. ACS Omega 2020, 5, 16228–16237. [Google Scholar] [CrossRef] [PubMed]
  47. Gomes, F.M.; Ramos, I.B.; Wendt, C.; Girard-Dias, W.; De Souza, W.; Machado, E.A.; Miranda, K. New Insights into the in Situ Microscopic Visualization and Quantification of Inorganic Polyphosphate Stores by 4′,6-Diamidino-2-Phenylindole (DAPI)-Staining. Eur. J. Histochem. 2013, 57, 34. [Google Scholar] [CrossRef]
  48. Loukanov, A.; Mladenova, P.; Toshev, S.; Karailiev, A.; Ustinovich, E.; Nakabayashi, S. Real Time Monitoring and Quantification of Uptake Carbon Nanodots in Eukaryotic Cells. Microsc. Res. Tech. 2018, 81, 1541–1547. [Google Scholar] [CrossRef]
  49. Chandrakar, V.; Yadu, B.; Korram, J.; Satnami, M.L.; Dubey, A.; Kumar, M.; Keshavkant, S. Carbon Dot Induces Tolerance to Arsenic by Regulating Arsenic Uptake, Reactive Oxygen Species Detoxification and Defense-Related Gene Expression in Cicer Arietinum L. Plant Physiol. Biochem. 2020, 156, 78–86. [Google Scholar] [CrossRef] [PubMed]
  50. Yakusheva, A.; Aly-Eldeen, M.; Gusev, A.; Zakharova, O.; Kuznetsov, D. Cyan Fluorescent Carbon Quantum Dots with Amino Derivatives for the Visual Detection of Copper (II) Cations in Sea Water. Nanomaterials 2023, 13, 1004. [Google Scholar] [CrossRef] [PubMed]
  51. Le, N.; Zhang, M.; Kim, K. Quantum Dots and Their Interaction with Biological Systems. Int. J. Mol. Sci. 2022, 23, 10763. [Google Scholar] [CrossRef]
  52. Gao, M.; Chang, J.; Wang, Z.; Zhang, H.; Wang, T. Advances in Transport and Toxicity of Nanoparticles in Plants. J. Nanobiotechnology 2023, 21, 75. [Google Scholar] [CrossRef]
  53. Wiśniewski, M.; Czarnecka, J.; Bolibok, P.; Świdziński, M.; Roszek, K. New Insight into the Fluorescence Quenching of Nitrogen-Containing Carbonaceous Quantum Dots—From Surface Chemistry to Biomedical Applications. Materials 2021, 14, 2454. [Google Scholar] [CrossRef] [PubMed]
  54. Wei, T.; Deng, K.; Wang, H.; Zhang, L.; Wang, C.; Song, W.; Zhang, Y.; Chen, C. Comparative Transcriptome Analyses Reveal Potential Mechanisms of Enhanced Drought Tolerance in Transgenic Salvia Miltiorrhiza Plants Expressing AtDREB1A from Arabidopsis. Int. J. Mol. Sci. 2018, 19, 827. [Google Scholar] [CrossRef] [PubMed]
  55. Allan, R.A.; Miller, J.J. Influence of S -Adenosylmethionine on DAPI-Induced Fluorescence of Polyphosphate in the Yeast Vacuole. Can. J. Microbiol. 1980, 26, 912–920. [Google Scholar] [CrossRef] [PubMed]
  56. Livak, K.J.; Schmittgen, T.D. Analysis of Relative Gene Expression Data Using Real-Time Quantitative PCR and the 2−ΔΔCT Method. Methods 2001, 25, 402–408. [Google Scholar] [CrossRef]
  57. Liu, Q.; Chen, B.; Wang, Q.; Shi, X.; Xiao, Z.; Lin, J.; Fang, X. Carbon Nanotubes as Molecular Transporters for Walled Plant Cells. Nano Lett. 2009, 9, 1007–1010. [Google Scholar] [CrossRef] [PubMed]
  58. Santana, I.; Jeon, S.-J.; Kim, H.-I.; Islam, M.R.; Castillo, C.; Garcia, G.F.H.; Newkirk, G.M.; Giraldo, J.P. Targeted Carbon Nanostructures for Chemical and Gene Delivery to Plant Chloroplasts. ACS Nano 2022, 16, 12156–12173. [Google Scholar] [CrossRef]
  59. Rezaei Cherati, S.; Anas, M.; Liu, S.; Shanmugam, S.; Pandey, K.; Angtuaco, S.; Shelton, R.; Khalfaoui, A.N.; Alena, S.V.; Porter, E.; et al. Comprehensive Risk Assessment of Carbon Nanotubes Used for Agricultural Applications. ACS Nano 2022, 16, 12061–12072. [Google Scholar] [CrossRef]
Figure 1. Characterization of CQDs: (A) TEM and (B) HRTEM (inset) images. Scale bar = 5 nm. The arrows indicate a crystal lattice size of 0.23 nm. (C) The corresponding size distribution. (D)UV−VIS absorption and PL spectra. (E) FTIR spectra. (F) XRD patterns. (G) XPS spectra. (H) C 1s peaks signal. (I) N 1s peaks signal from the XPS analysis.
Ijms 24 15700 g001
Figure 2. Cell localization of CQDs in Arabidopsis. (A) CQDs at a concentration of 80 mg/mL are localized to the cell membrane. (B) CQDs at a concentration of 100 mg/mL are localized to the cell membrane and nucleus. (C) Morphology of CK (control) cells injected without CQDs. Scale bar—100 μm. The red arrow represents the nucleus. The excitation wavelength of ultraviolet is 405 nm. DIC stands for visible light.
Ijms 24 15700 g002
Figure 3. Localization of the AGO3-GFP fusion protein and CQDs in N. benthamiana cells. (A) The AtAGO3 gene, when fused to green fluorescent protein (GFP) and under the control of the 35S promoter, displays nuclear localization, with DAPI serving as an internal reference control. (B) The AtAGO3 gene, when fused with GFP and regulated by the 35S promoter, exhibits nuclear localization. (C) The expression of the AtAGO3 gene, under the control of the 35S promoter and fused with GFP, is determined through the simultaneous injection of carbon quantum dots (CQDs). This reveals nuclear localization under two distinct excitation wavelengths: 488 nm (for GFP) and 405 nm (for CQDs). Scale bar, 100 µm. The red arrows and blue dots indicate the presence of GFP and CQDs in the nucleus, respectively.
Ijms 24 15700 g003
Figure 4. Distribution of CQDs injections in Arabidopsis thaliana after 3 days. (A) Microscopic observation of CQDs on apical tissue. (B) Microscopic observation of CQDs on the stem. (C) Microscopic observation of CQDs on leaf. (D) Microscopic observation of CQDs on the flower stalk tissue. (E) Microscopic observation of CQDs on the leaf epidermal hairs. (F) Microscopic observation of CQDs on the flower tissue. (G) Microscopic observation of CQDs on anther tissue. (H) Microscopic observation of CQDs on the stomata tissue. Here, 405 nm is used for excitation light in ultraviolet, and DIC stands for visible light. The scale bars for panels A, B, C, D, E, F, G, and H are 75, 250, 50, 500, 500, 250, 250, and 75 µm, respectively.
Ijms 24 15700 g004
Figure 5. RT-qPCR analysis of 9 different significantly affected genes (A) as well as 9 Argonaute family genes (B) of Arabidopsis under the influence of CQDs. The Arabidopsis actin gene is used as an internal reference and three replicates of each sample are used. Abbreviations: AGO3—Argonaute 3; CRK—Cysteine-rich receptor-like protein kinase; HAK—potassium transporter; LEC—leucine-rich repeat disease resistance protein-like; NBS—TIR-NBS class of disease resistance protein; PR—uncharacterized protein; PAP—purple acid phosphatase; RLP—receptor-like protein; SK—putative WRKY transcription factor.
Ijms 24 15700 g005
Figure 6. RT-qPCR expressions of Argonaute family genes in the leaves (A), stems (B), and seeds (C) of Arabidopsis thaliana. The Arabidopsis actin gene was used as an internal reference and three replicates of each sample were used.
Ijms 24 15700 g006
Figure 7. DNA methylation analysis between CQDs and CK. (A) Circos plot of gene density; gene and TE density; and methylation levels of CG, CHG, and CHH between CQDs (blue) and CK. (B) Venn diagrams showing the overlap among differential expression genes. (C) Screenshot of DNA methylation levels over one representative gene, AT3G5512. The red and blue bars indicate TEs and genes, respectively.
Ijms 24 15700 g007
Figure 8. The microRNA172D transient expression of Argonaute family genes in Arabidopsis leaves.
Ijms 24 15700 g008
Figure 9. Transport of CQDs in Arabidopsis thaliana. (A) Transport of CQDs to different organs in Arabidopsis. (B) Transport of CQDs in the root system of Arabidopsis thaliana. (C) CQDs are transported by vascular bundles in Arabidopsis stems.
Ijms 24 15700 g009
Figure 10. Differential localization of CQDs in cells after injection of low and high amounts of CQDs. (A) They mainly enter the cell membrane and nucleus under high concentrations of CQDs. (B)When CQDs are at low concentrations, they mainly accumulate in the cell membrane.
Ijms 24 15700 g010
Disclaimer/Publisher’s Note: The statements, opinions and data contained in all publications are solely those of the individual author(s) and contributor(s) and not of MDPI and/or the editor(s). MDPI and/or the editor(s) disclaim responsibility for any injury to people or property resulting from any ideas, methods, instructions or products referred to in the content.

