
Anti-Proliferative Properties of the Novel Hybrid Drug Met-ITC, Composed of the Native Drug Metformin with the Addition of an Isothiocyanate H2S Donor Moiety, in Different Cancer Cell Lines

 , , ,
, , ,  , ,
, ,  , and
, and 
Abstract
:1. Introduction
2. Results
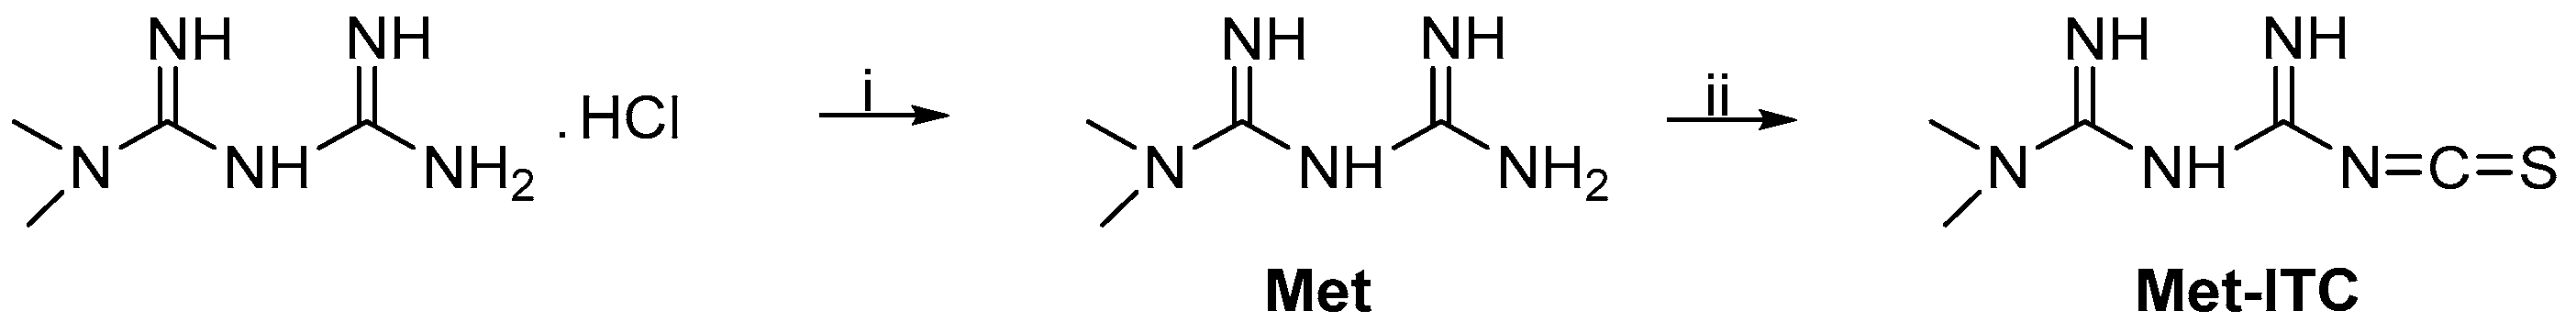
2.1. Chemistry
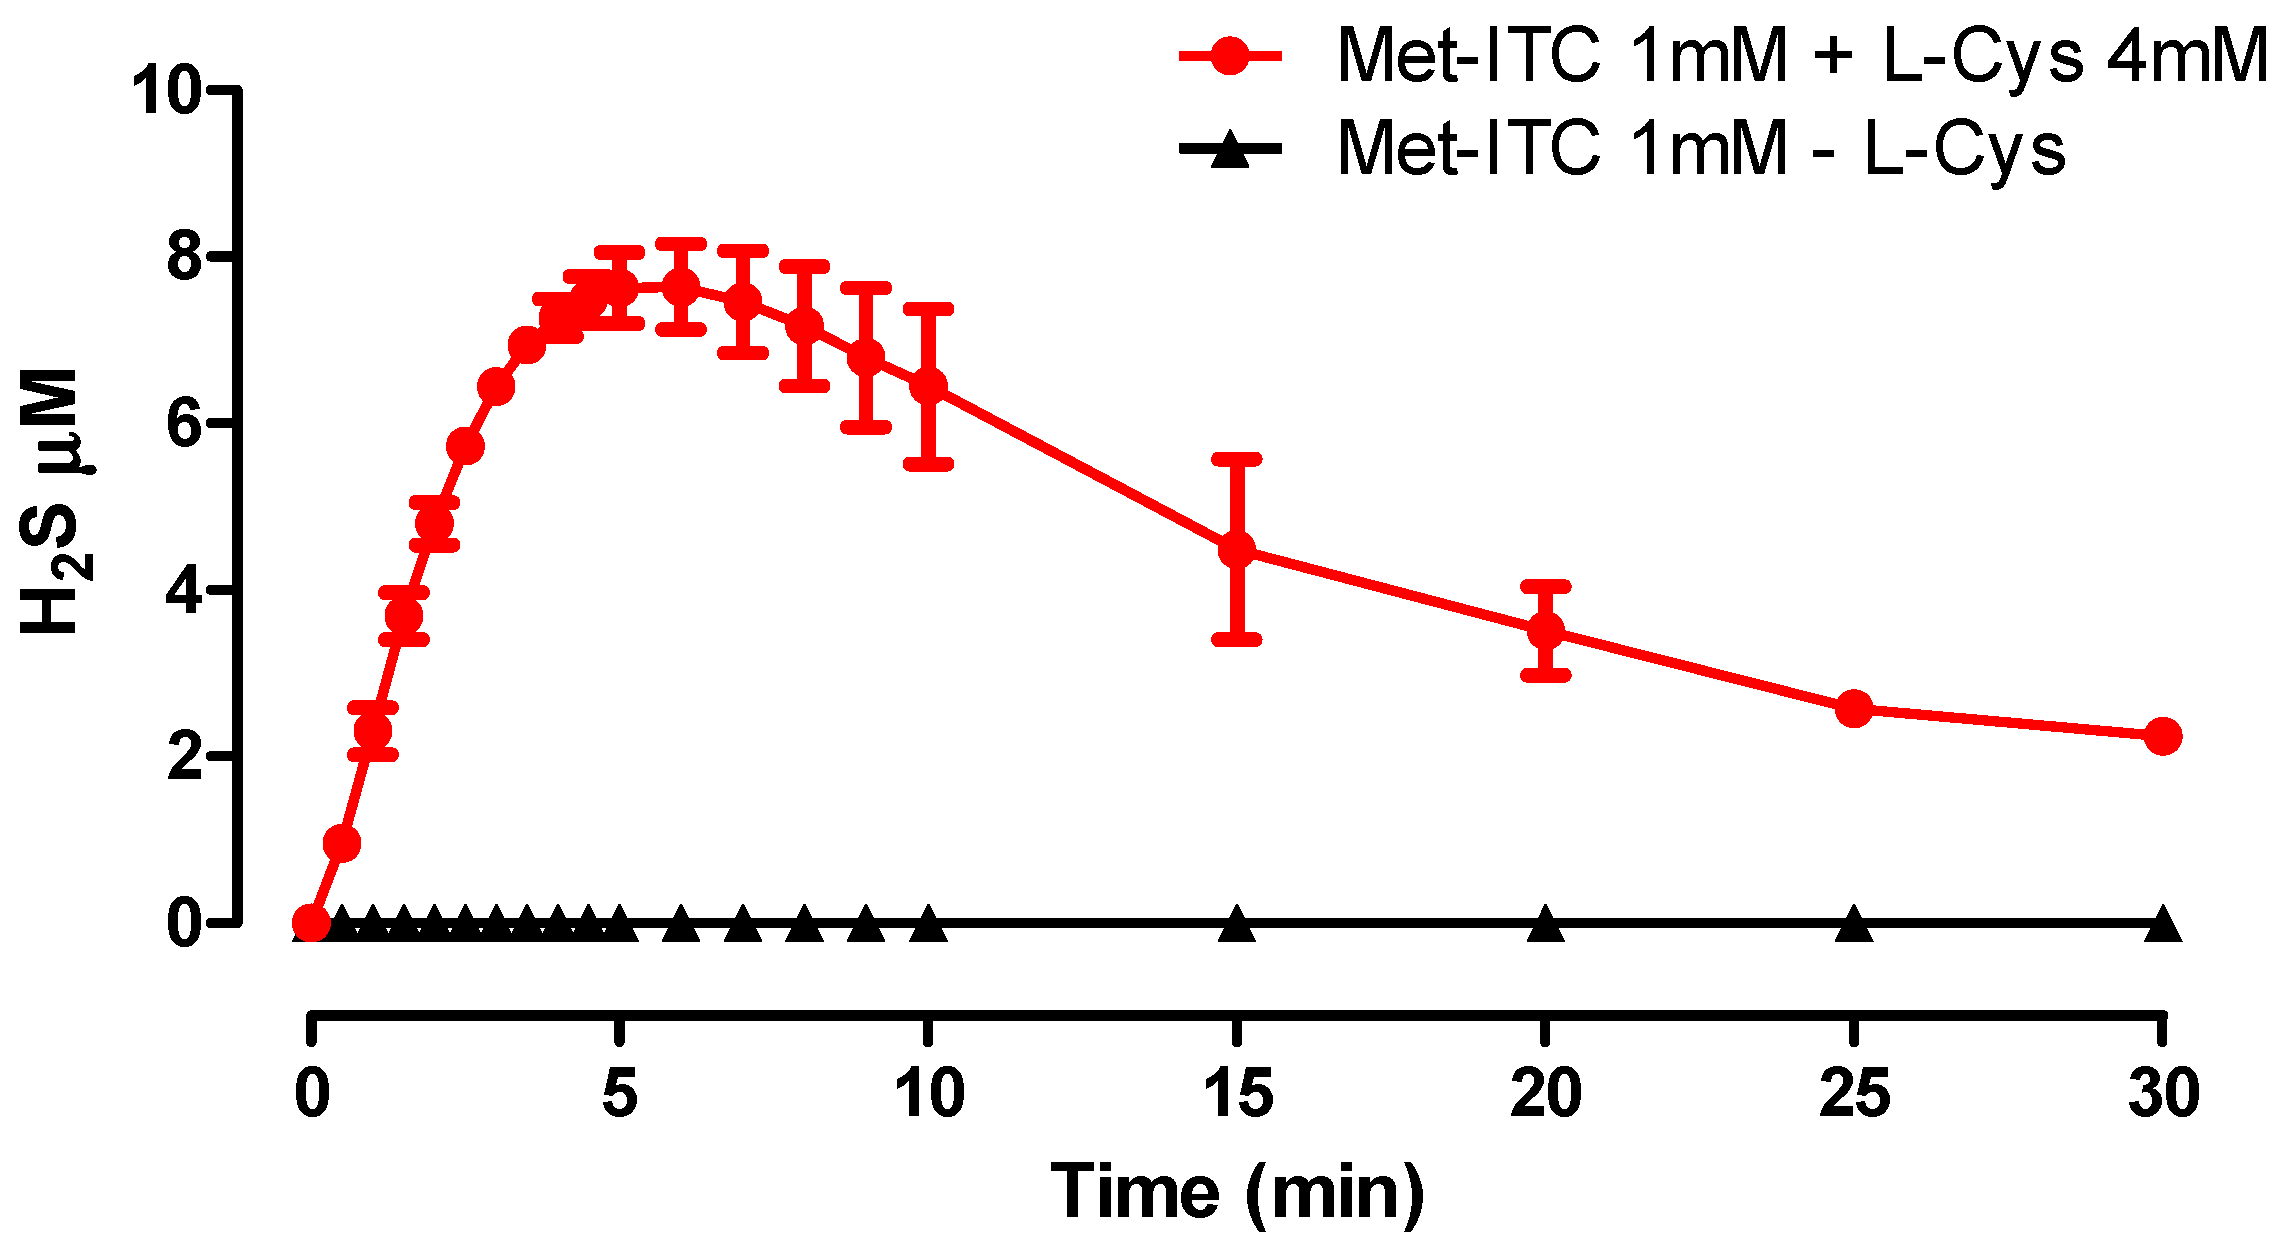
2.2. Amperometric Recording of H2S Release
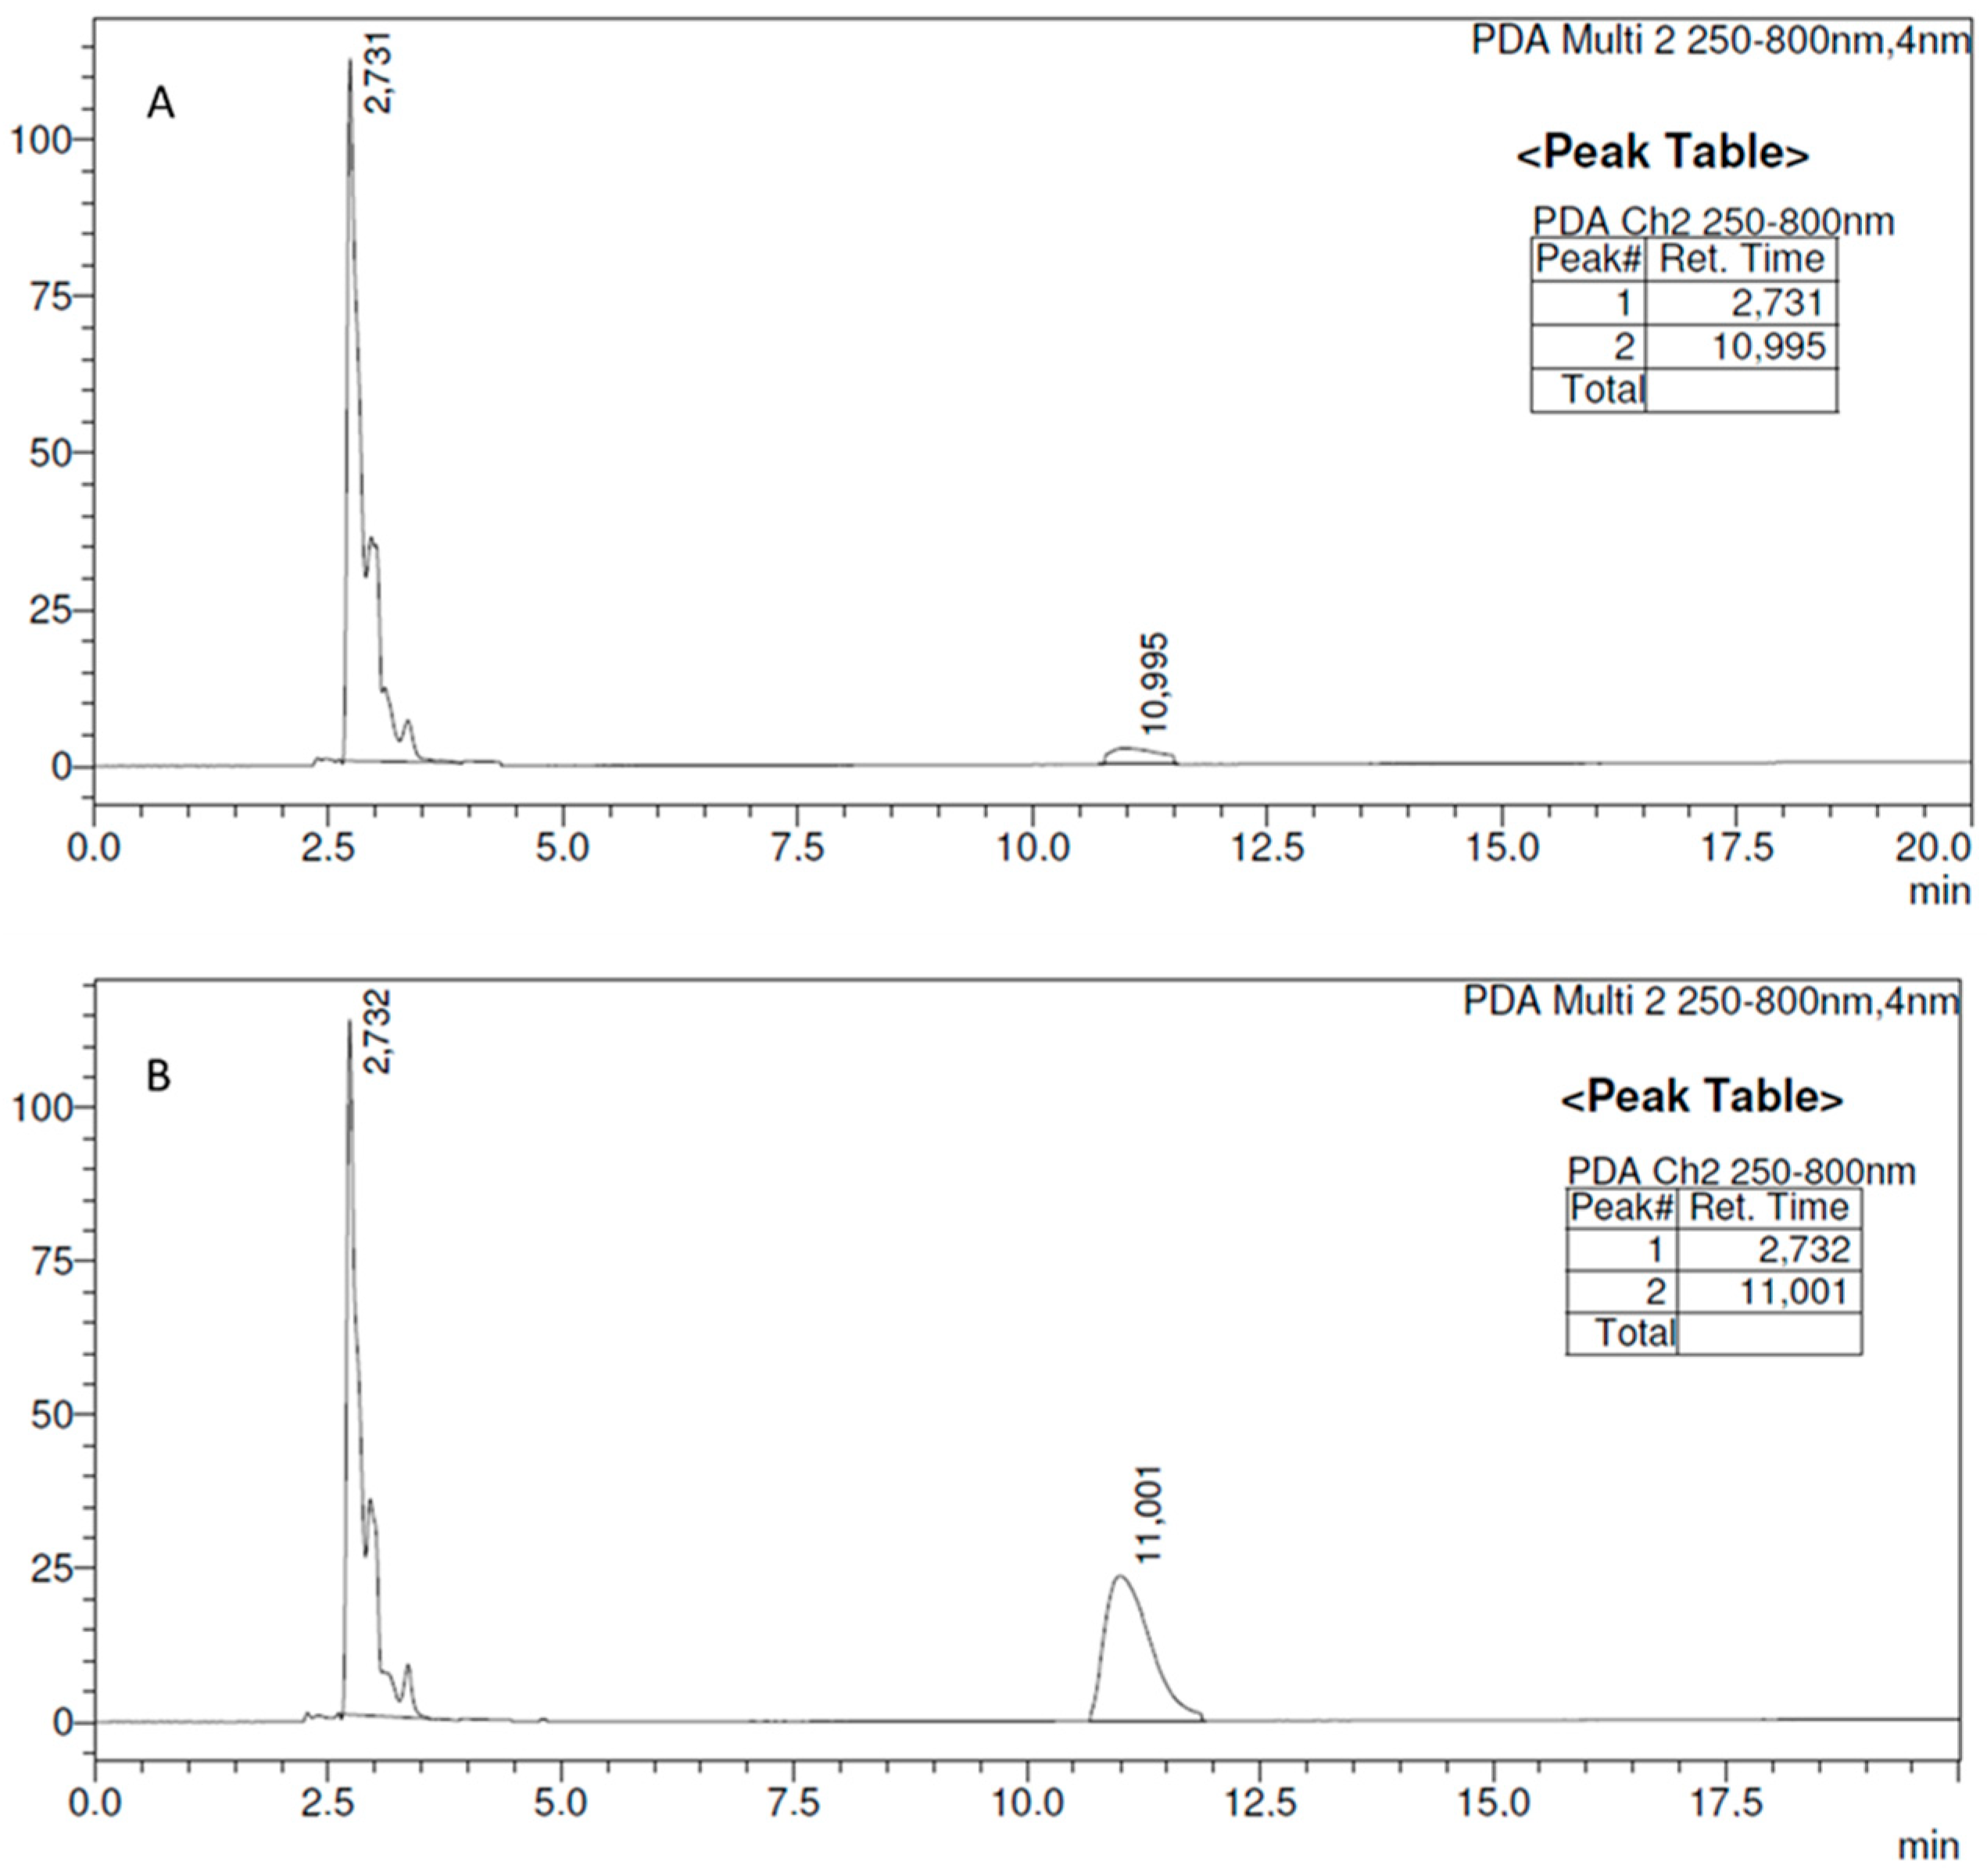
2.3. Evaluation of the Release of Met from Met-ITC
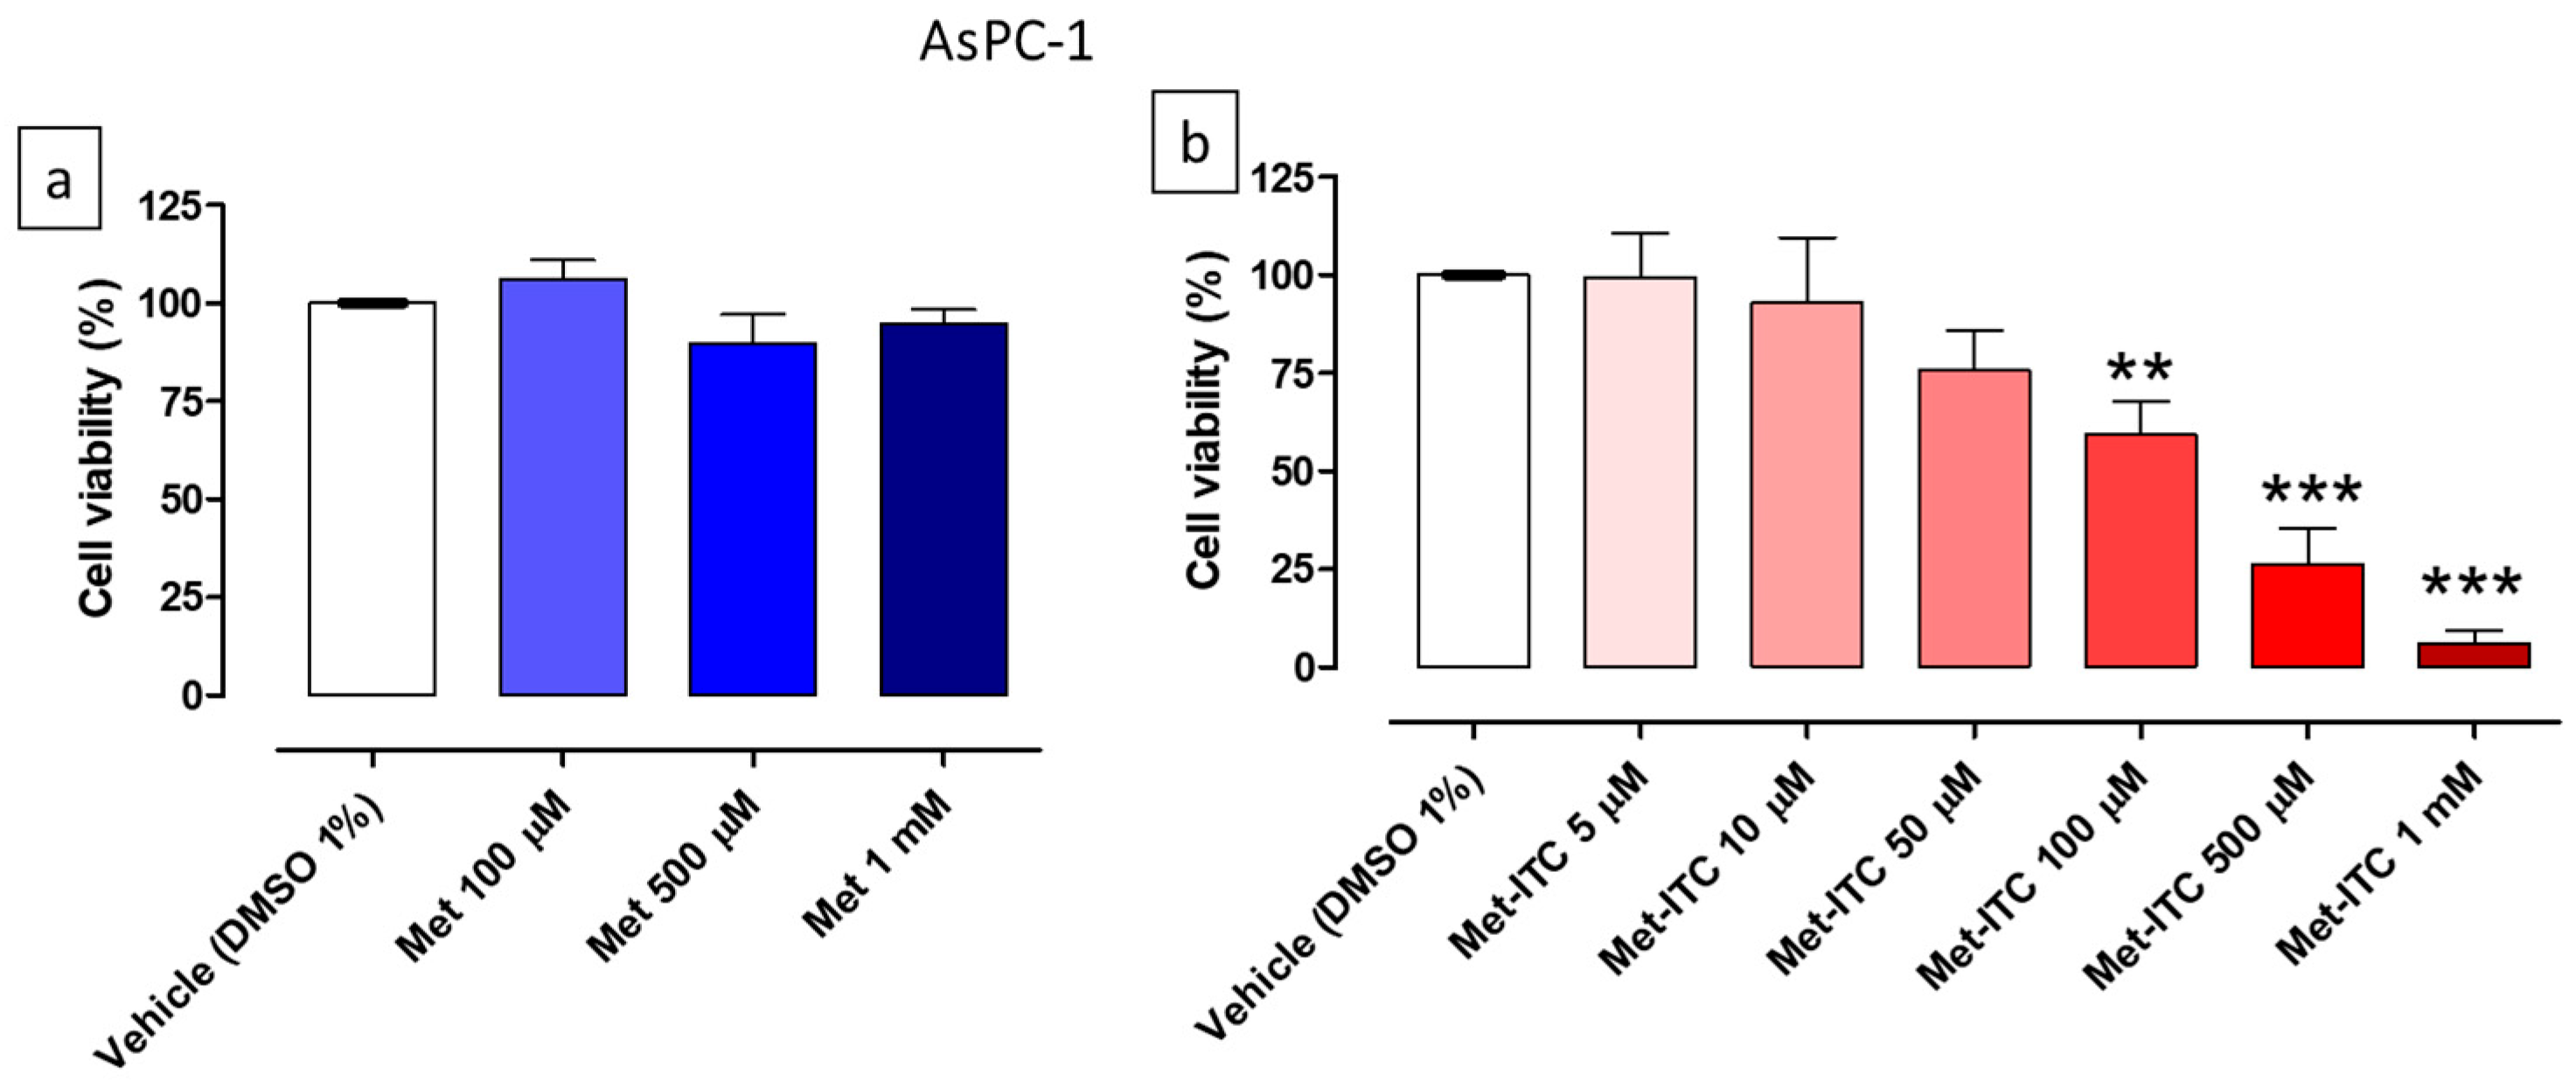
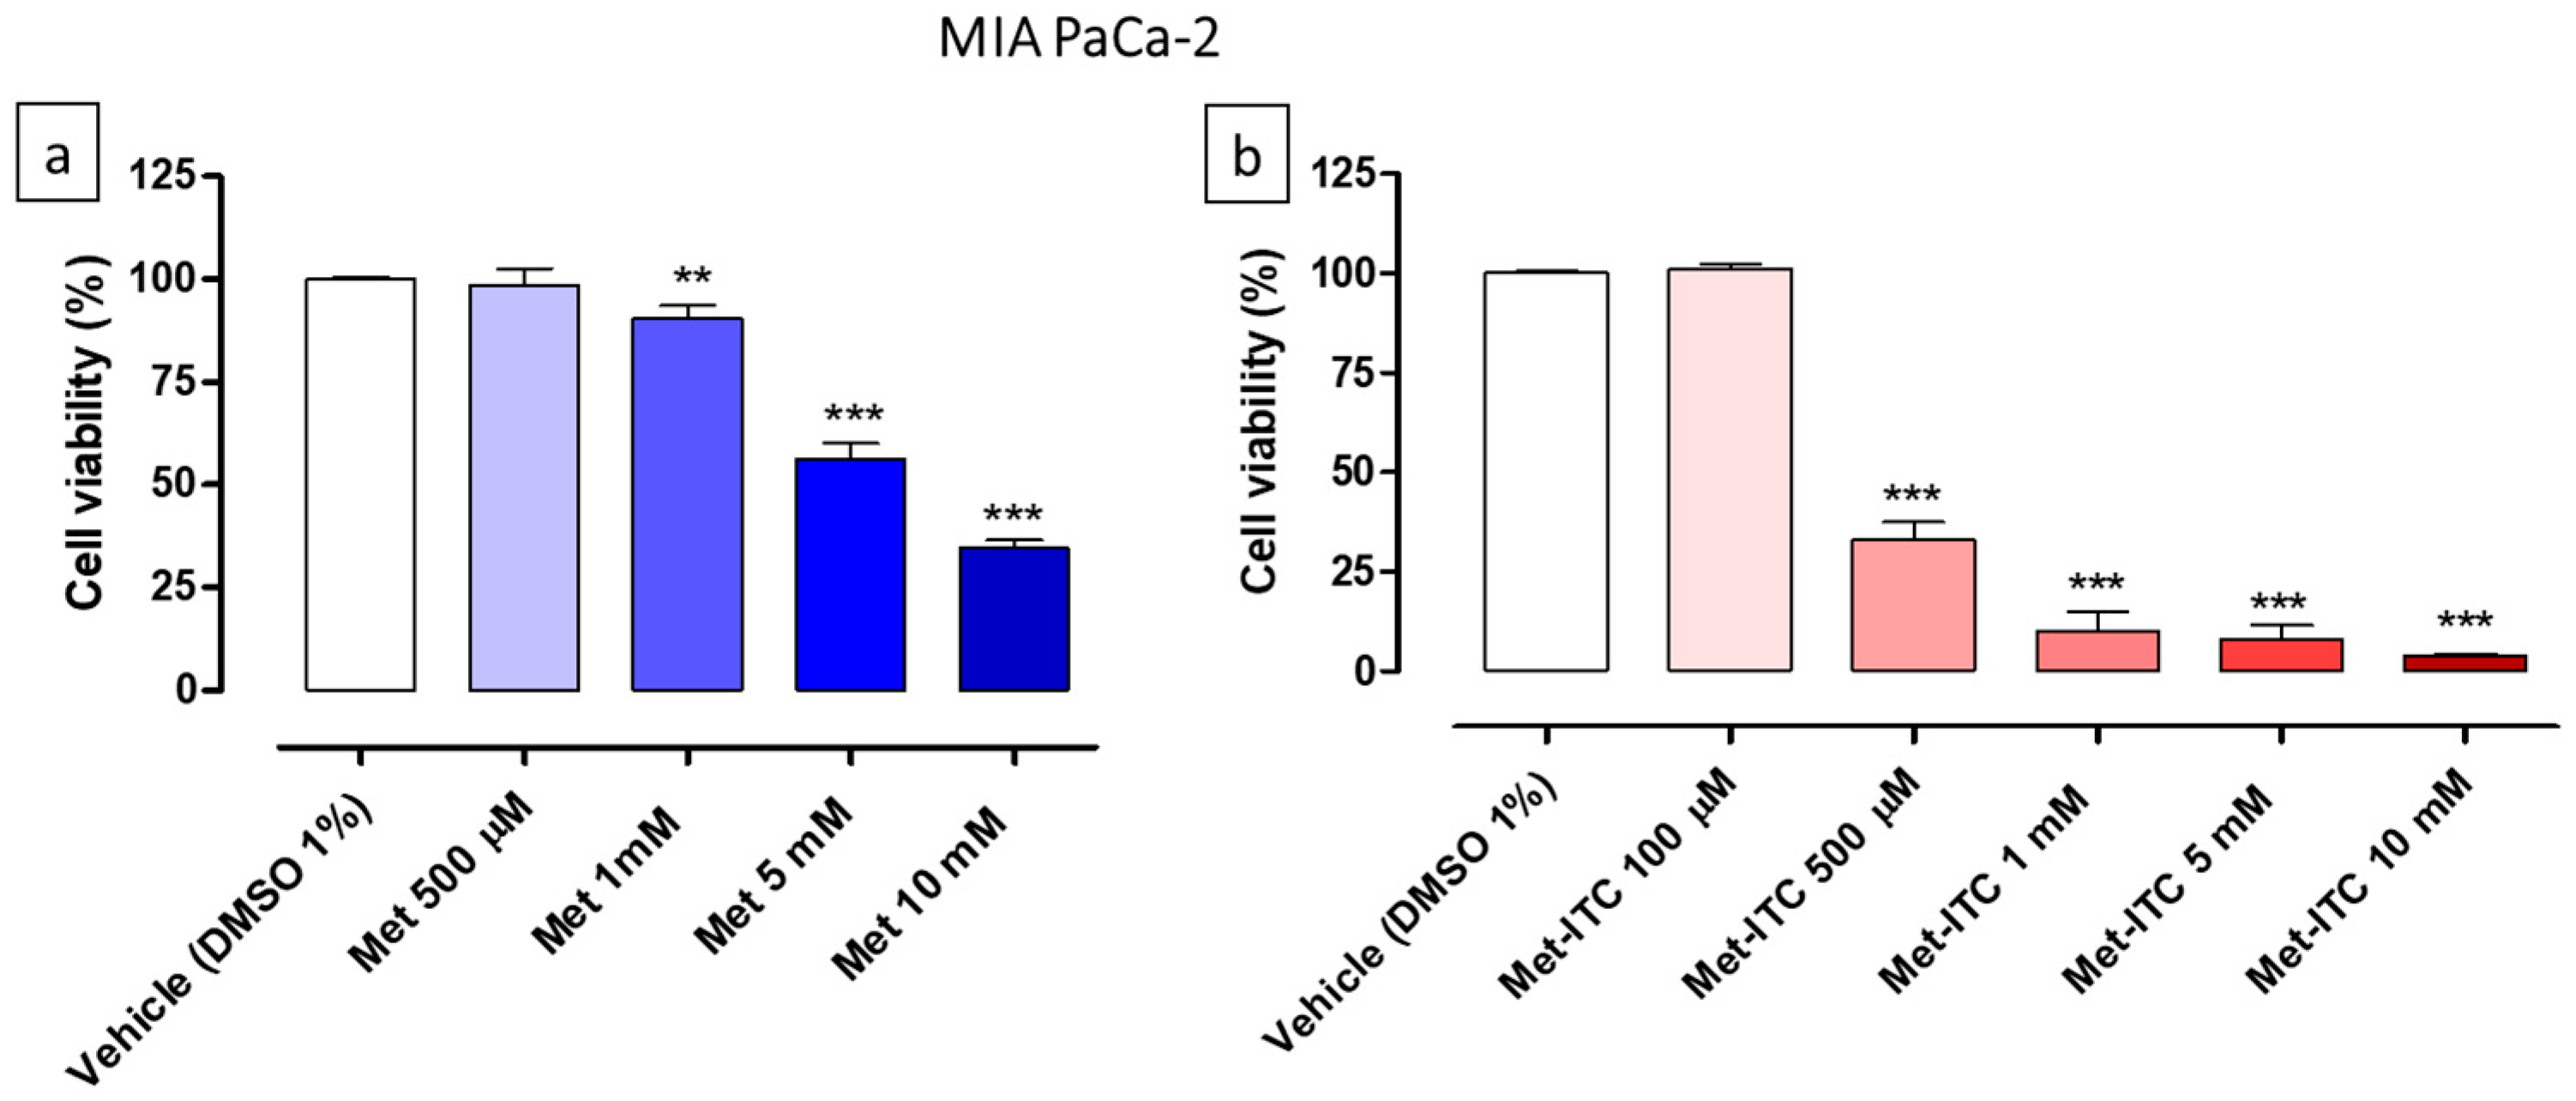
2.4. Effects on Cell Viability of AsPC-1 and MIA PaCa-2 Pancreatic Cancer Cells
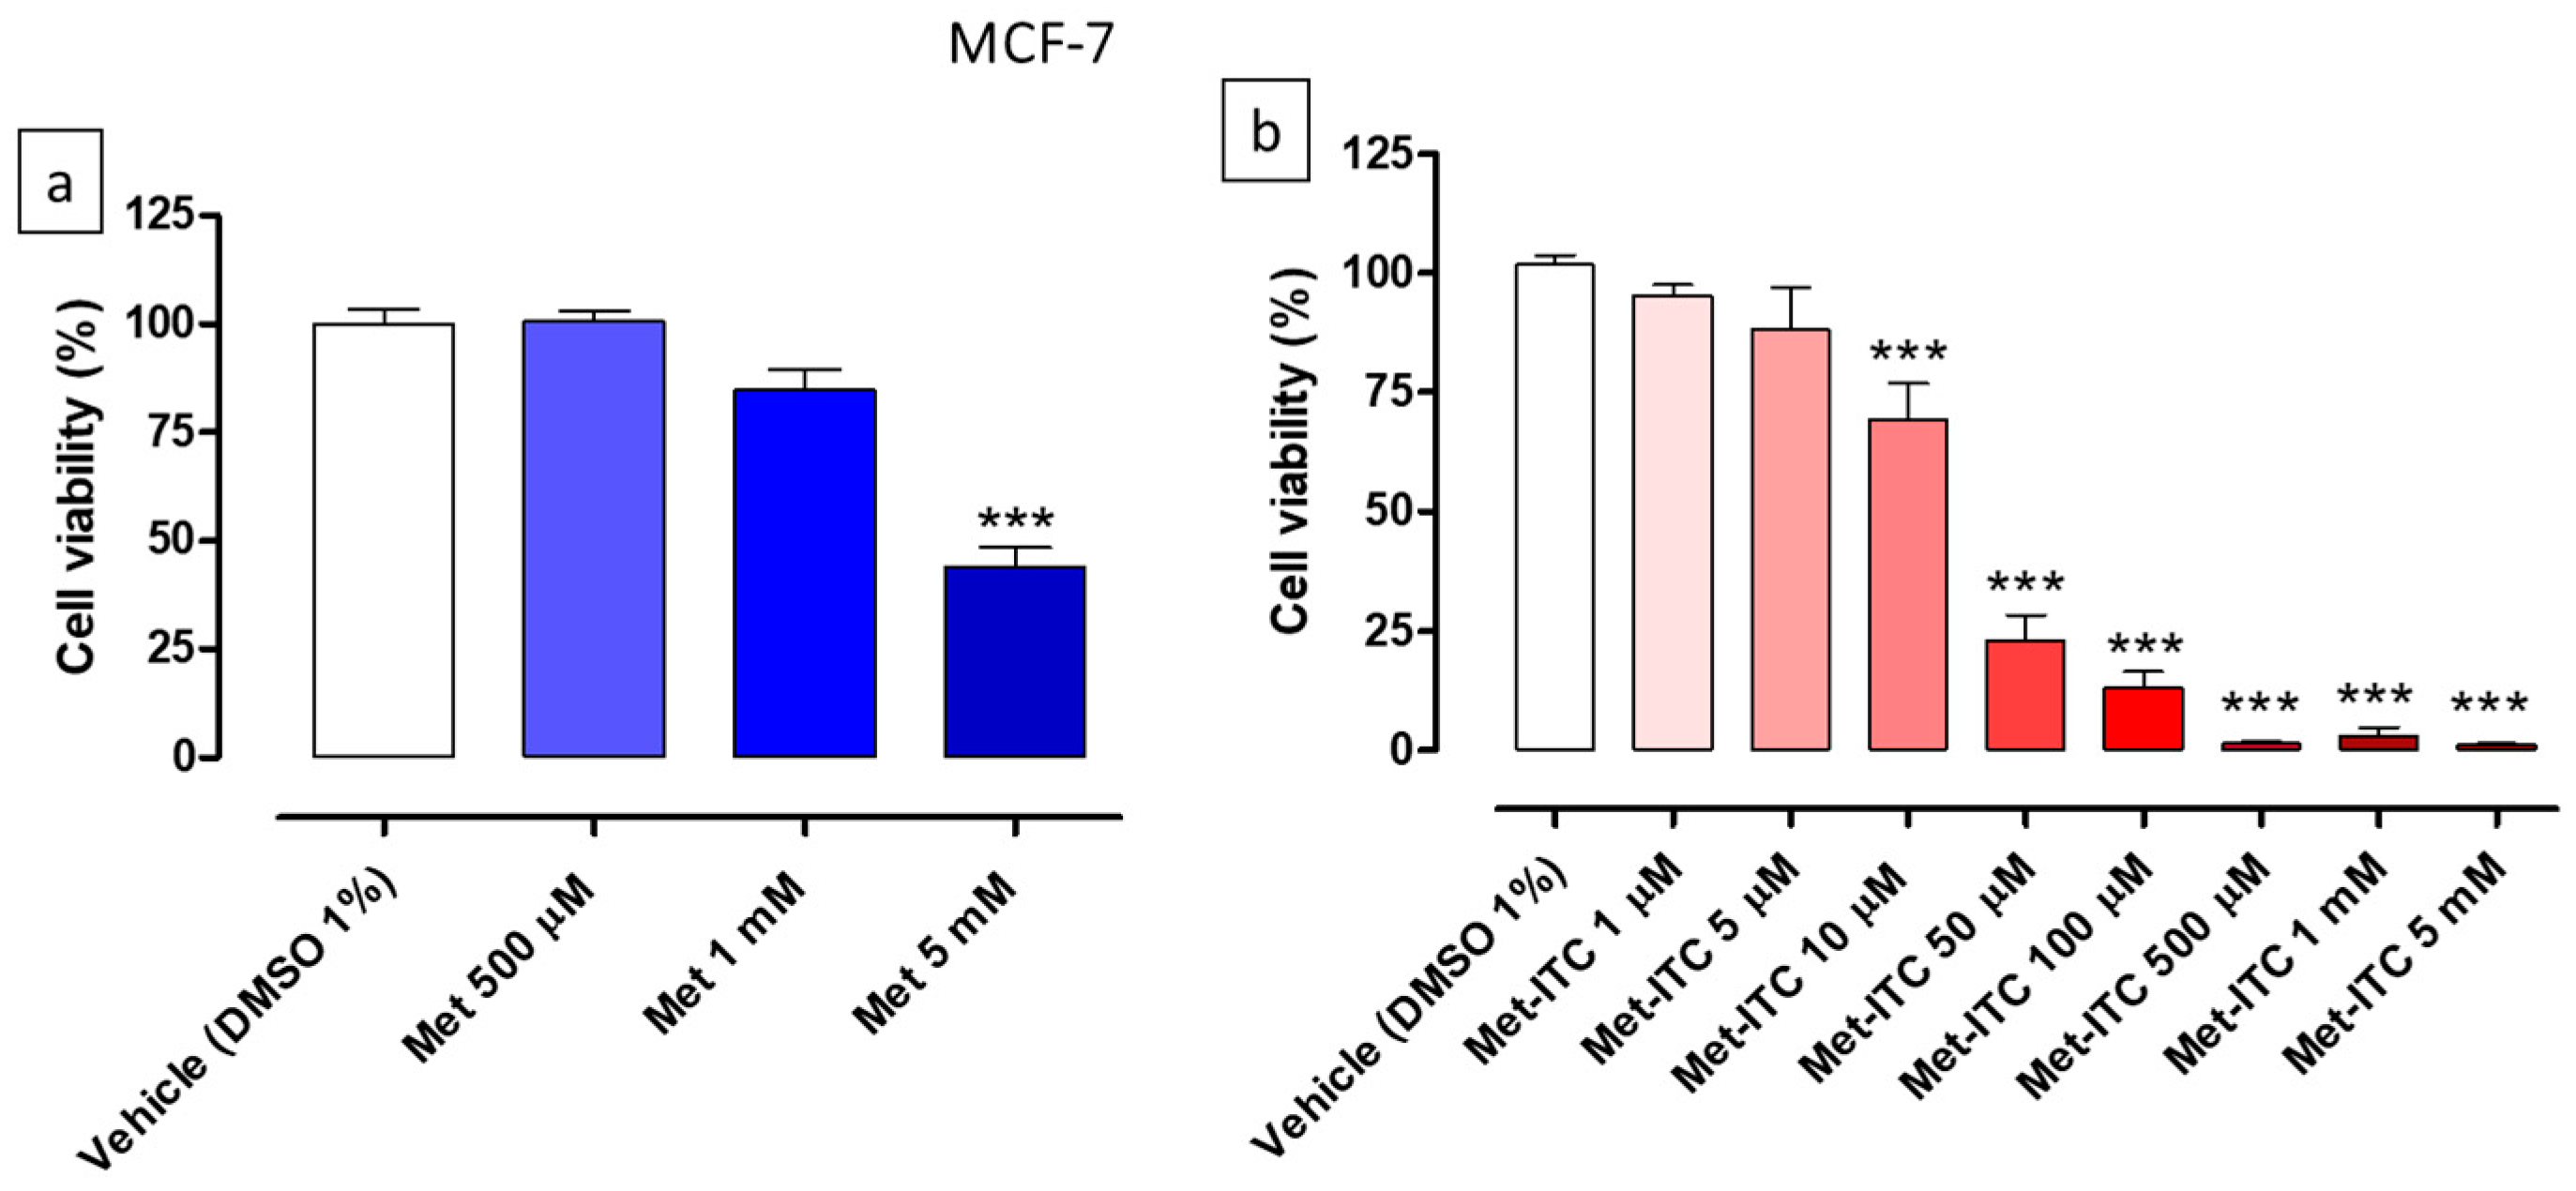
2.5. Effects on Cell Viability of MCF-7 Breast Cancer Cells
2.6. Effects on Cell Viability of Non-Tumorigenic Breast Epithelial Cells (MCF-10A)
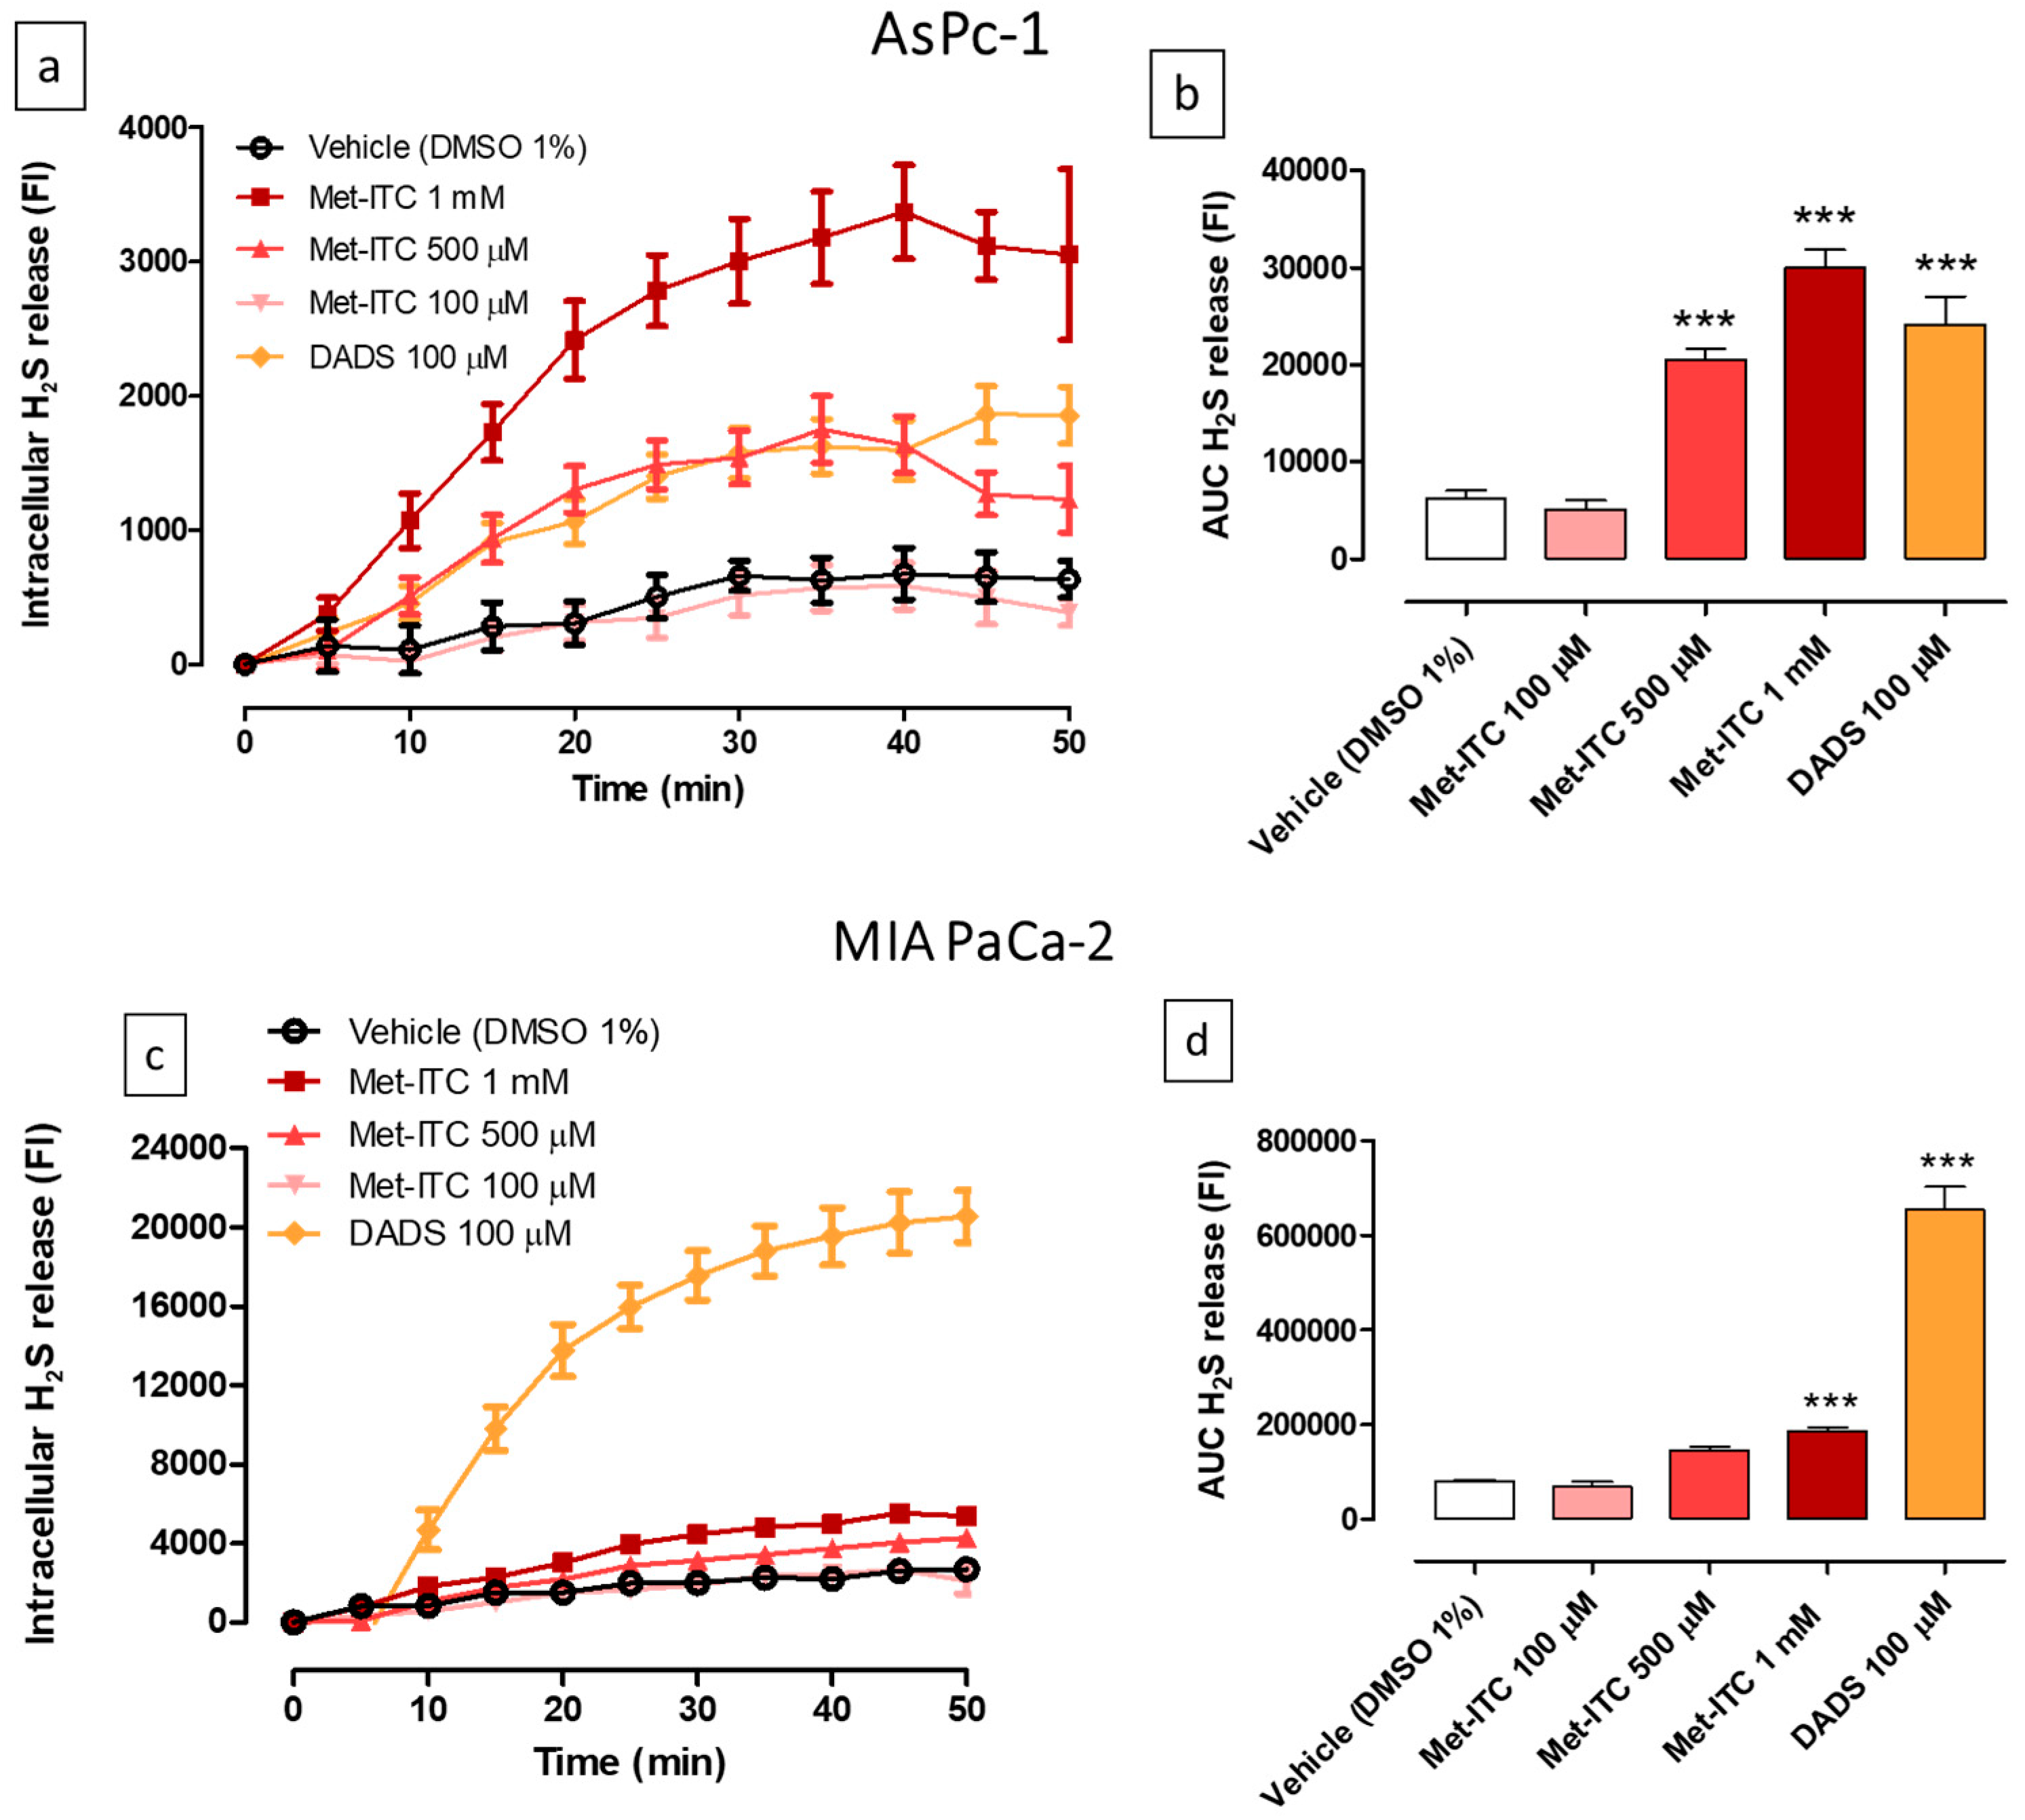
2.7. Intracellular Release of H2S in AsPC-1 and MIA PaCa-2 Pancreatic Cancer Cells
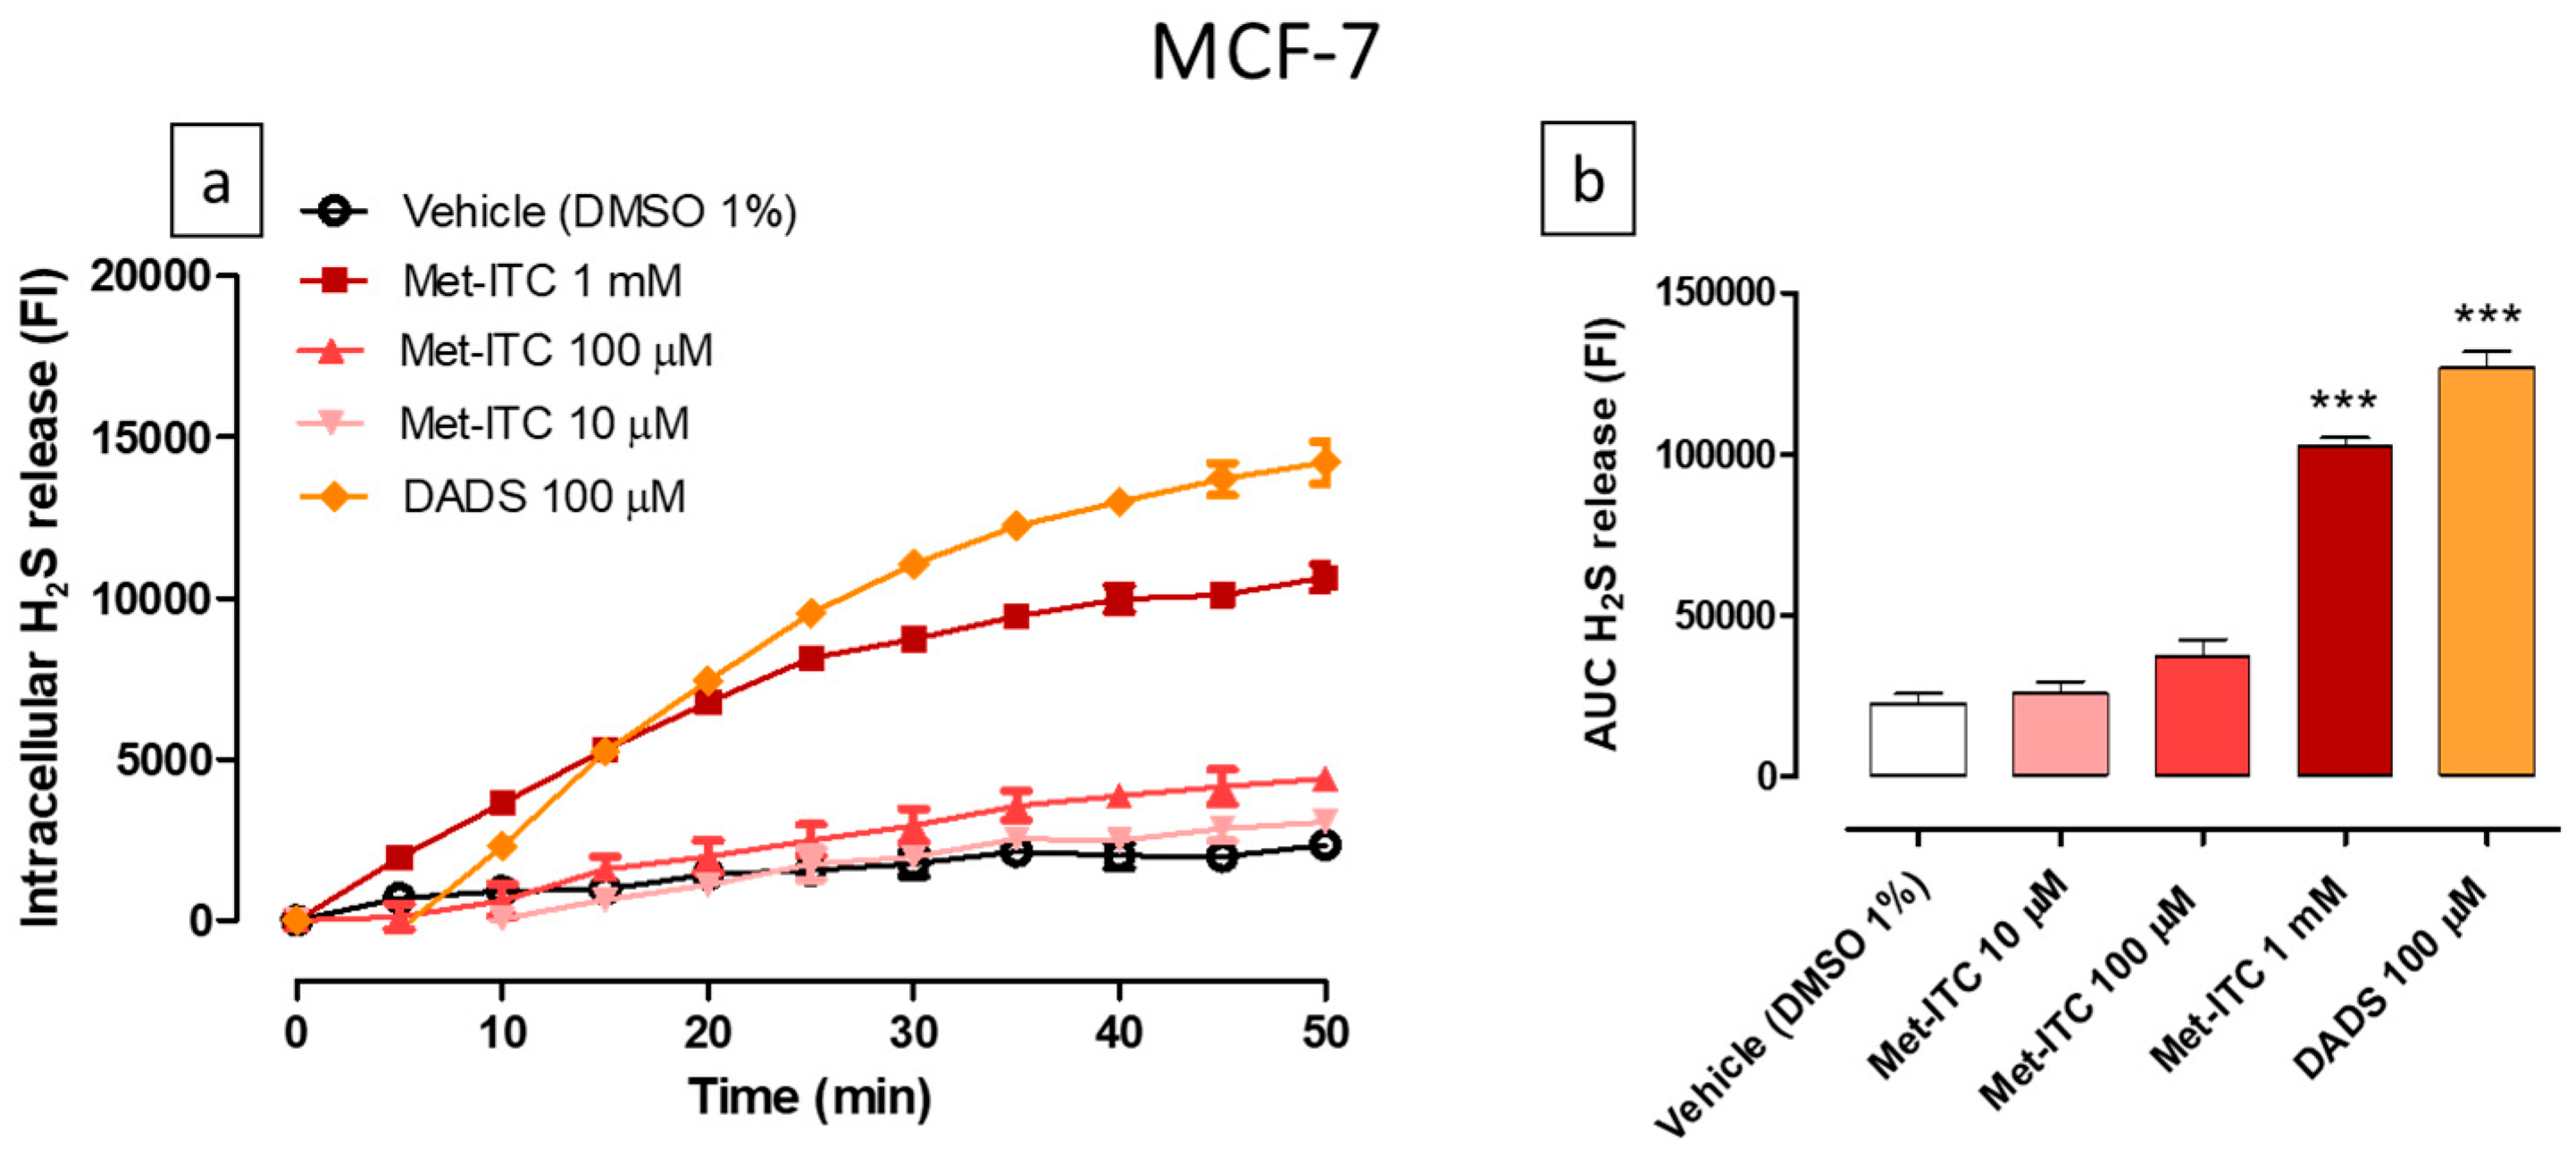
2.8. Intracellular Release of H2S in MCF-7 Breast Cancer Cells
2.9. Intracellular Release of H2S in MCF-10A Non-Tumorigenic Breast Epithelial Cells
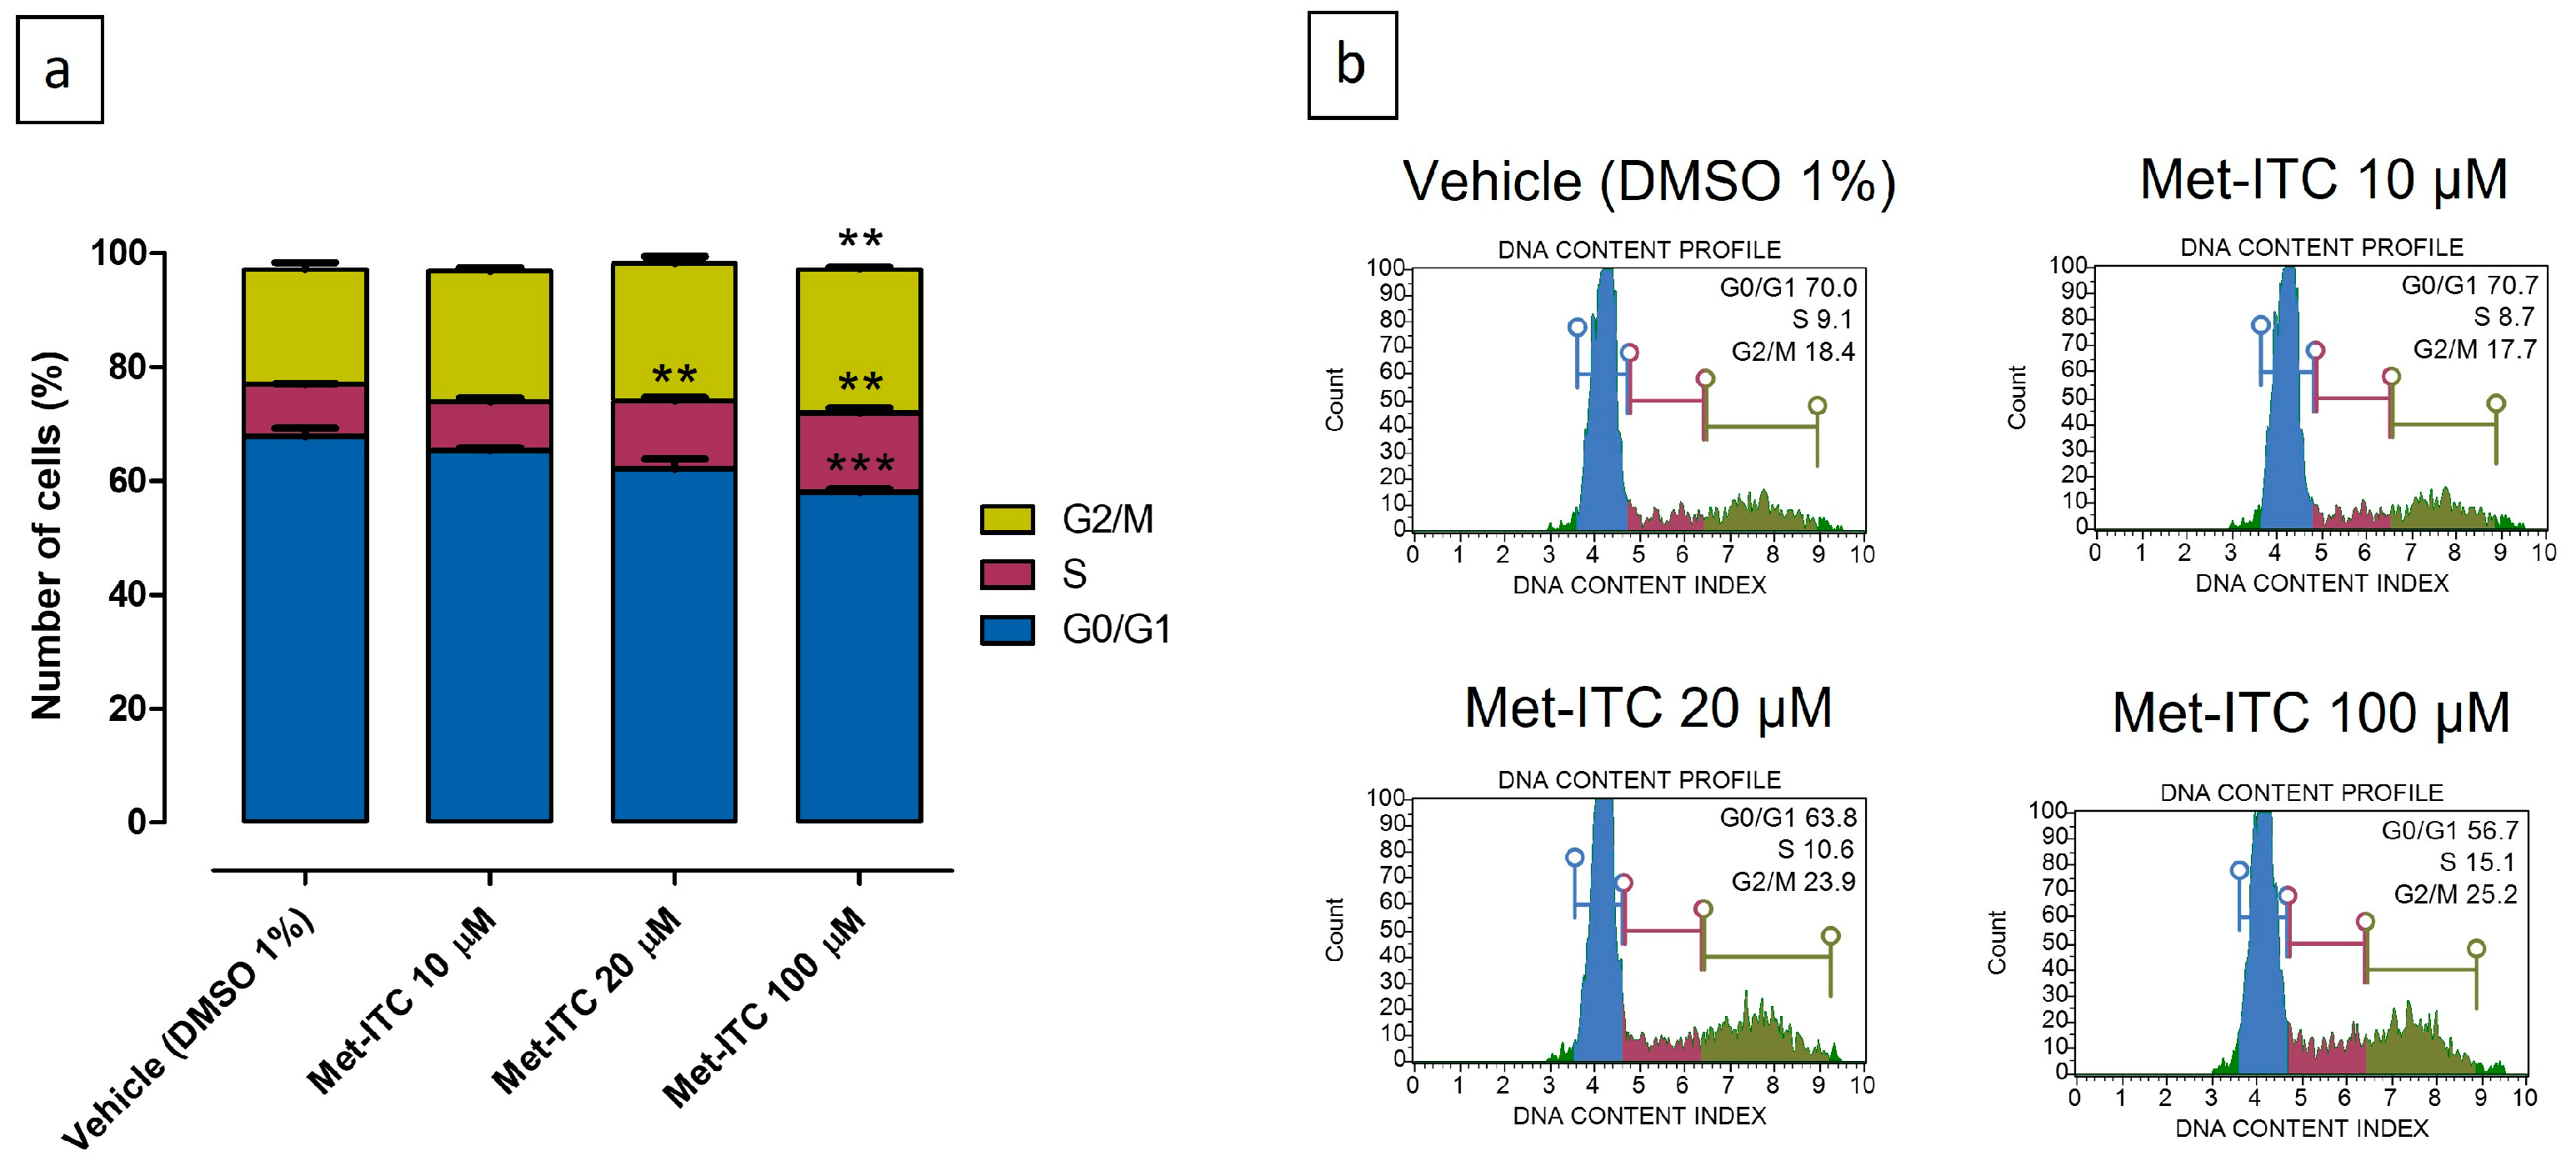
2.10. Inhibition of Cell Cycle Progression in MCF-7 Breast Cancer Cells
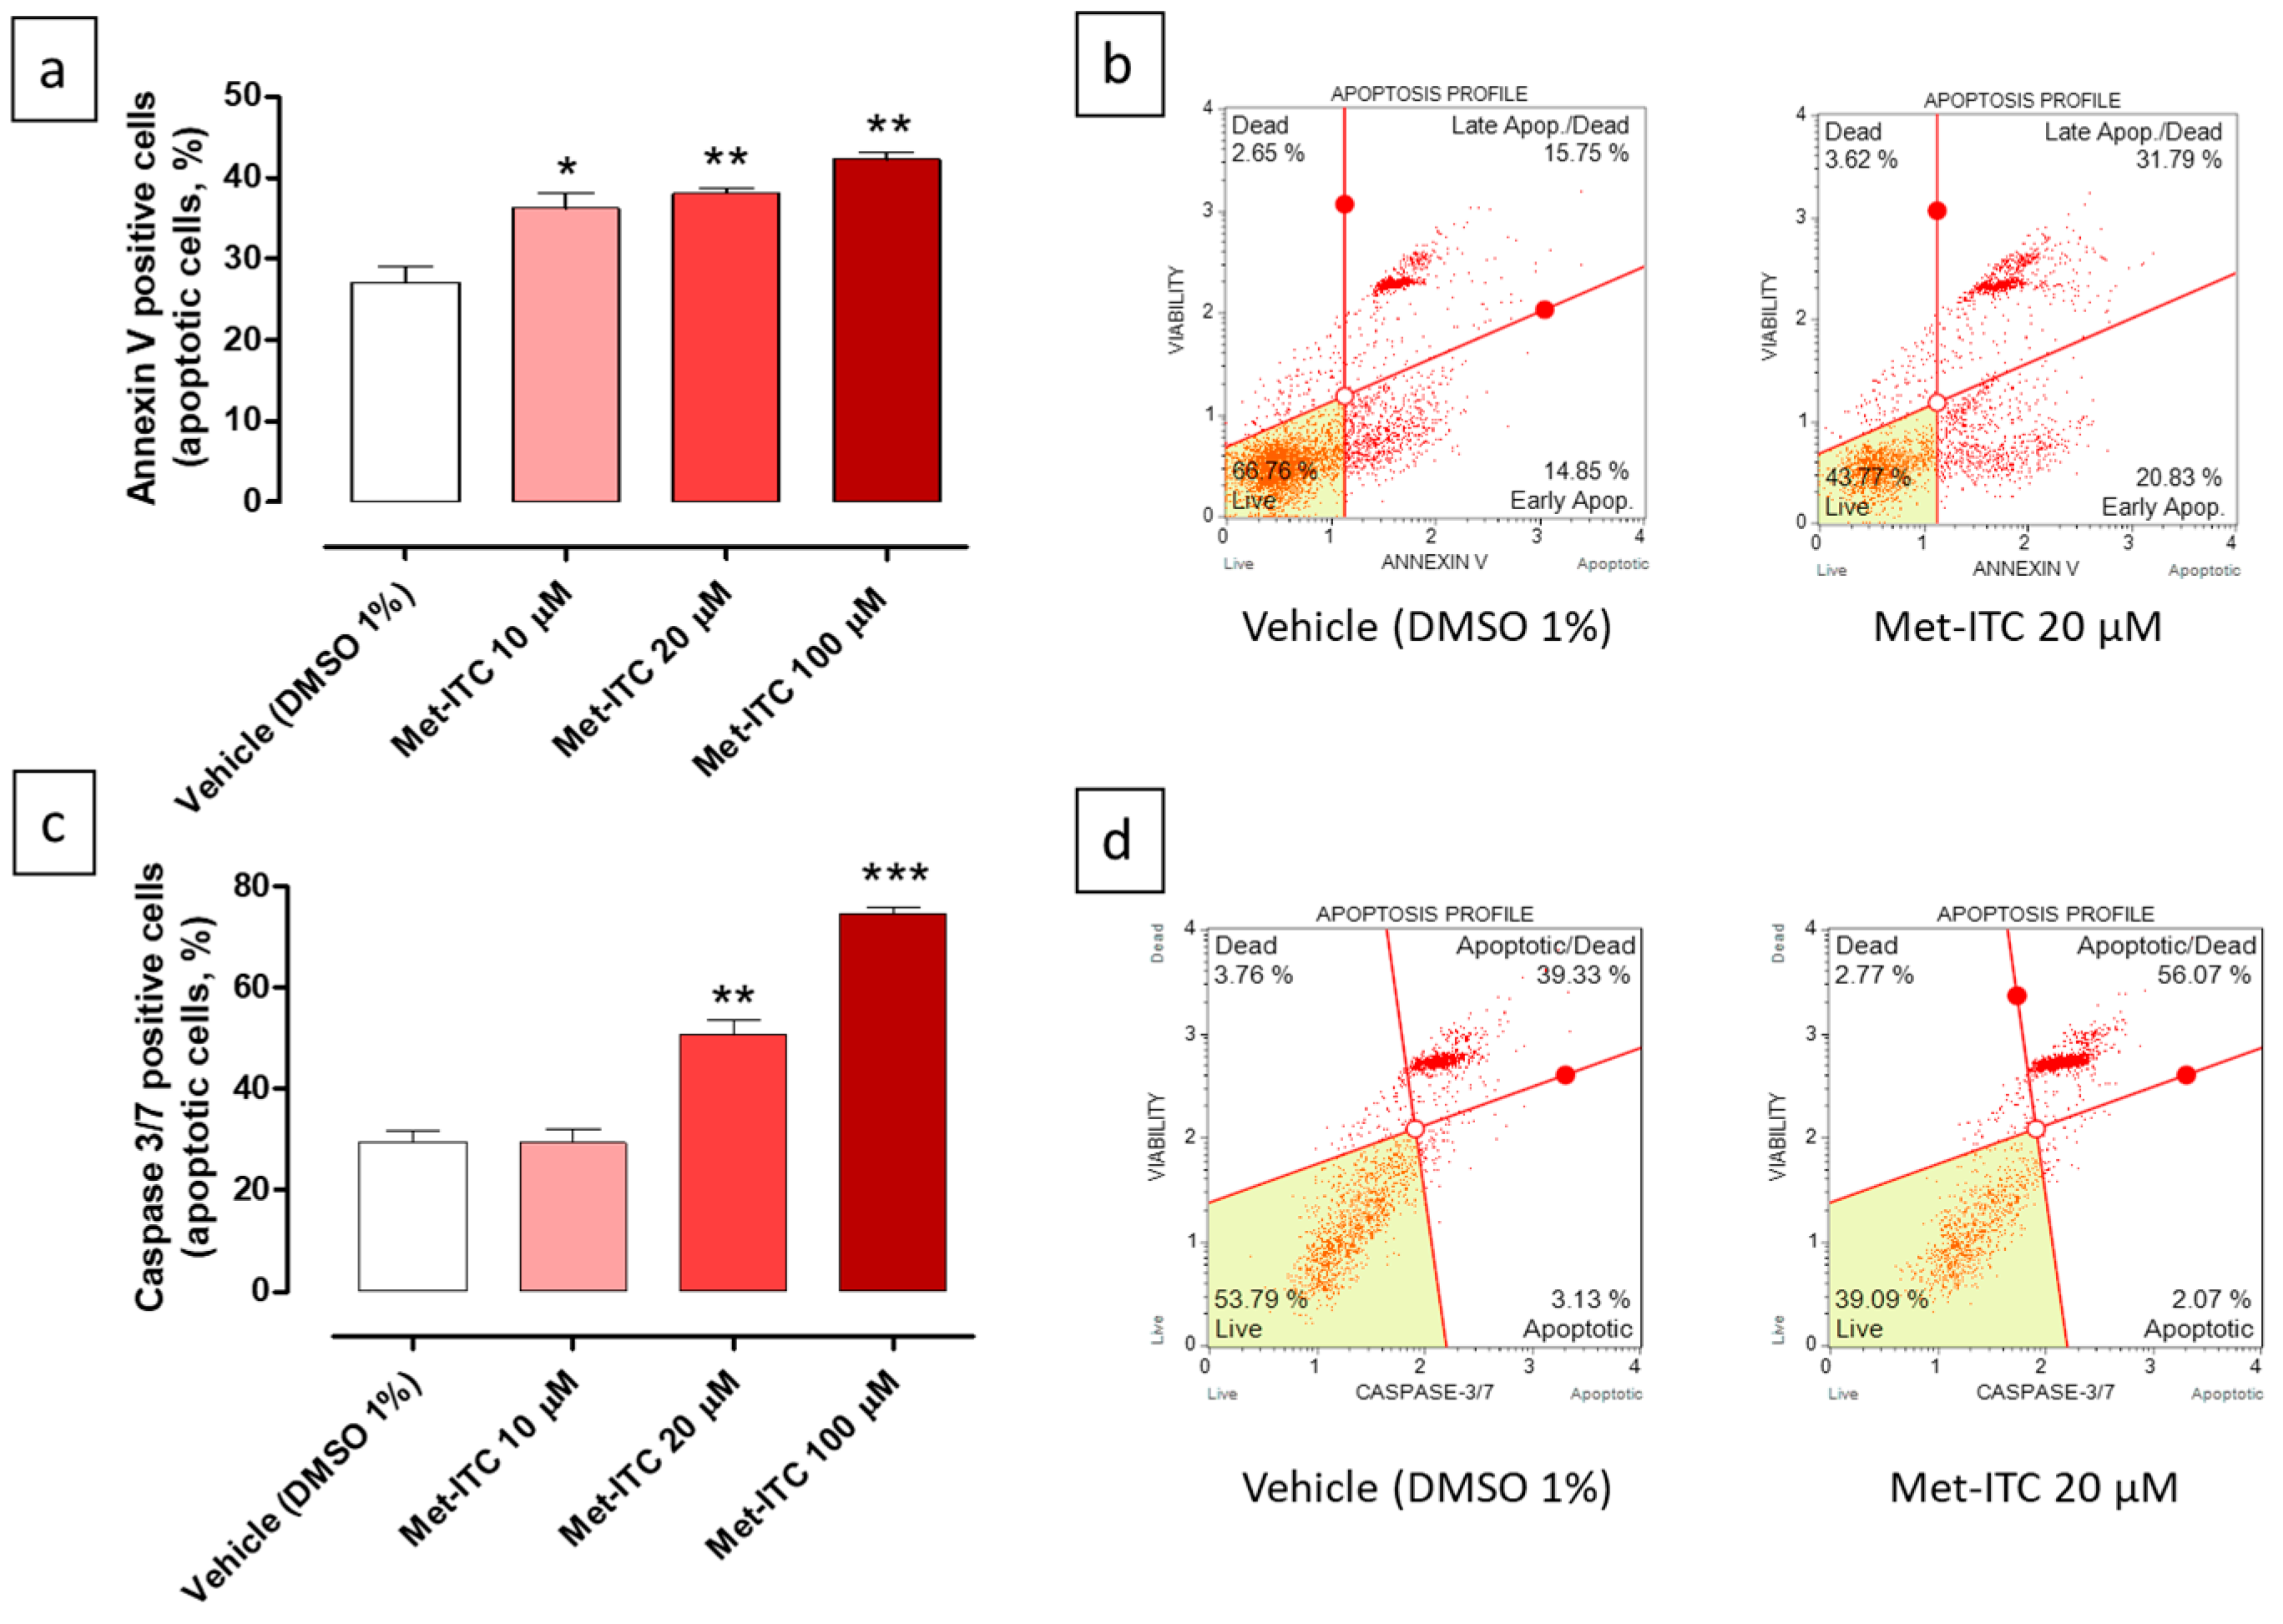
2.11. Pro-Apoptotic Effects of Met-ITC in MCF-7 Breast Cancer Cells
3. Discussion
4. Materials and Methods
4.1. Chemistry
HPLC Analysis of Met and Met-ITC
4.2. Amperometric Measurement of H2S Release
4.3. Cell Cultures
4.3.1. Human Pancreatic Cancer Cells
4.3.2. Human Breast Cancer Cells
4.3.3. Nontumorigenic Breast Epithelial Cells
4.4. Cell Viability
4.5. Intracellular Release of H2S
4.6. Cell Cycle Analysis
4.7. Annexin V Detection
4.8. Caspase 3/7 Activity
4.9. Data Analysis
5. Conclusions
6. Patents
Author Contributions
Funding
Institutional Review Board Statement
Informed Consent Statement
Data Availability Statement
Acknowledgments
Conflicts of Interest
References
- Sanchez-Rangel, E.; Inzucchi, S.E. Metformin: Clinical use in type 2 diabetes. Diabetologia 2017, 60, 1586–1593. [Google Scholar] [CrossRef]
- LaMoia, T.E.; Shulman, G.I. Cellular and molecular mechanisms of metformin action. Endocr. Rev. 2021, 42, 77–96. [Google Scholar] [CrossRef] [PubMed]
- Deng, M.; Su, D.; Xu, S.; Little, P.J.; Feng, X.; Tang, L.; Shen, A. Metformin and vascular diseases: A focused review on smooth muscle cell function. Front. Pharmacol. 2020, 11, 635. [Google Scholar] [CrossRef] [PubMed]
- Yerevanian, A.; Soukas, A.A. Metformin: Mechanisms in human obesity and weight loss. Curr. Obes. Rep. 2019, 8, 156–164. [Google Scholar] [CrossRef]
- Foretz, M.; Guigas, B.; Bertrand, L.; Pollak, M.; Viollet, B. Metformin: From mechanisms of action to therapies. Cell Metab. 2014, 20, 953–966. [Google Scholar] [CrossRef]
- Kheirandish, M.; Mahboobi, H.; Yazdanparast, M.; Kamal, W.; Kamal, M.A. Anti-cancer effects of metformin: Recent evidences for its role in prevention and treatment of cancer. Curr. Drug Metab. 2018, 19, 793–797. [Google Scholar] [CrossRef] [PubMed]
- Alimova, I.N.; Liu, B.; Fan, Z.; Edgerton, S.M.; Dillon, T.; Lind, S.E.; Thor, A.D. Metformin inhibits breast cancer cell growth, colony formation and induces cell cycle arrest in vitro. Cell Cycle 2009, 8, 909–915. [Google Scholar] [CrossRef] [PubMed]
- Chen, Y.-H.; Yang, S.-F.; Yang, C.-K.; Tsai, H.-D.; Chen, T.-H.; Chou, M.-C.; Hsiao, Y.-H. Metformin induces apoptosis and inhibits migration by activating the AMPK/p53 axis and suppressing PI3K/AKT signaling in human cervical cancer cells. Mol. Med. Rep. 2021, 23, 1. [Google Scholar] [CrossRef]
- Li, B.; Zhou, P.; Xu, K.; Chen, T.; Jiao, J.; Wei, H.; Yang, X.; Xu, W.; Wan, W.; Xiao, J. Metformin induces cell cycle arrest, apoptosis and autophagy through ROS/JNK signaling pathway in human osteosarcoma. Int. J. Biol. Sci. 2020, 16, 74. [Google Scholar] [CrossRef]
- Kim, T.S.; Lee, M.; Park, M.; Kim, S.Y.; Shim, M.S.; Lee, C.Y.; Choi, D.H.; Cho, Y. Metformin and dichloroacetate suppress proliferation of liver cancer cells by inhibiting mTOR complex 1. Int. J. Mol. Sci. 2021, 22, 10027. [Google Scholar] [CrossRef]
- Kim, J.; You, Y.J. Regulation of organelle function by metformin. IUBMB Life 2017, 69, 459–469. [Google Scholar] [CrossRef] [PubMed]
- Whiteman, M.; Le Trionnaire, S.; Chopra, M.; Fox, B.; Whatmore, J. Emerging role of hydrogen sulfide in health and disease: Critical appraisal of biomarkers and pharmacological tools. Clin. Sci. 2011, 121, 459–488. [Google Scholar] [CrossRef] [PubMed]
- Hellmich, M.R.; Szabo, C. Hydrogen sulfide and cancer. In Chemistry, Biochemistry and Pharmacology of Hydrogen Sulfide; Springer: Berlin/Heidelberg, Germany, 2015; pp. 233–241. [Google Scholar]
- Ngowi, E.E.; Afzal, A.; Sarfraz, M.; Khattak, S.; Zaman, S.U.; Khan, N.H.; Li, T.; Jiang, Q.-Y.; Zhang, X.; Duan, S.-F. Role of hydrogen sulfide donors in cancer development and progression. Int. J. Biol. Sci. 2021, 17, 73. [Google Scholar] [CrossRef] [PubMed]
- Li, H.; Xu, F.; Gao, G.; Gao, X.; Wu, B.; Zheng, C.; Wang, P.; Li, Z.; Hua, H.; Li, D. Hydrogen sulfide and its donors: Novel antitumor and antimetastatic therapies for triple-negative breast cancer. Redox Biol. 2020, 34, 101564. [Google Scholar] [CrossRef]
- Abdull Razis, A.F.; Noor, N.M. Cruciferous vegetables: Dietary phytochemicals for cancer prevention. Asian Pac. J. Cancer Prev. 2013, 14, 1565–1570. [Google Scholar] [CrossRef]
- Gründemann, C.; Huber, R. Chemoprevention with isothiocyanates–From bench to bedside. Cancer Lett. 2018, 414, 26–33. [Google Scholar] [CrossRef] [PubMed]
- Citi, V.; Martelli, A.; Testai, L.; Marino, A.; Breschi, M.C.; Calderone, V. Hydrogen sulfide releasing capacity of natural isothiocyanates: Is it a reliable explanation for the multiple biological effects of Brassicaceae? Planta Medica 2014, 80, 610–613. [Google Scholar] [CrossRef] [PubMed]
- Bello, I.; Smimmo, M.; d’Emmanuele di Villa Bianca, R.; Bucci, M.; Cirino, G.; Panza, E.; Brancaleone, V. Erucin, an H2S-Releasing Isothiocyanate, Exerts Anticancer Effects in Human Triple-Negative Breast Cancer Cells Triggering Autophagy-Dependent Apoptotic Cell Death. Int. J. Mol. Sci. 2023, 24, 6764. [Google Scholar] [CrossRef]
- Citi, V.; Piragine, E.; Pagnotta, E.; Ugolini, L.; Di Cesare Mannelli, L.; Testai, L.; Ghelardini, C.; Lazzeri, L.; Calderone, V.; Martelli, A. Anticancer properties of erucin, an H2S-releasing isothiocyanate, on human pancreatic adenocarcinoma cells (AsPC-1). Phytother. Res. 2019, 33, 845–855. [Google Scholar] [CrossRef]
- Xu, S.; Shieh, M.; Paul, B.D.; Xian, M. Hydrogen sulfide: Recent development of its dual donors and hybrid drugs. Br. J. Pharmacol. 2023. Epub ahead of print. [Google Scholar] [CrossRef]
- Fiorucci, S.; Distrutti, E. COXIBs, CINODs and H₂S-releasing NSAIDs: Current perspectives in the development of safer non steroidal anti-inflammatory drugs. Curr. Med. Chem. 2011, 18, 3494–3505. [Google Scholar] [CrossRef] [PubMed]
- Martelli, A.; Rapposelli, S.; Calderone, V. NO-releasing hybrids of cardiovascular drugs. Curr. Med. Chem. 2006, 13, 609–625. [Google Scholar] [CrossRef] [PubMed]
- Sharma, R.; Joubert, J.; Malan, S.F. Recent Developments in Drug Design of NO-donor Hybrid Compounds. Mini Rev. Med. Chem. 2018, 18, 1175–1198. [Google Scholar] [CrossRef] [PubMed]
- Turnbull, C.M.; Marcarino, P.; Sheldrake, T.A.; Lazzarato, L.; Cena, C.; Fruttero, R.; Gasco, A.; Fox, S.; Megson, I.L.; Rossi, A.G. A novel hybrid aspirin-NO-releasing compound inhibits TNFalpha release from LPS-activated human monocytes and macrophages. J. Inflamm. 2008, 5, 12. [Google Scholar] [CrossRef] [PubMed]
- Calderone, V.; Rapposelli, S.; Martelli, A.; Digiacomo, M.; Testai, L.; Torri, S.; Marchetti, P.; Breschi, M.C.; Balsamo, A. NO-glibenclamide derivatives: Prototypes of a new class of nitric oxide-releasing anti-diabetic drugs. Bioorganic Med. Chem. 2009, 17, 5426–5432. [Google Scholar] [CrossRef] [PubMed]
- Szőke, K.; Czompa, A.; Lekli, I.; Szabados-Fürjesi, P.; Herczeg, M.; Csávás, M.; Borbás, A.; Herczegh, P.; Tósaki, Á. A new, vasoactive hybrid aspirin containing nitrogen monoxide-releasing molsidomine moiety. Eur. J. Pharm. Sci. 2019, 131, 159–166. [Google Scholar] [CrossRef] [PubMed]
- Boschi, D.; Di Stilo, A.; Cena, C.; Lolli, M.; Fruttero, R.; Gasco, A. Studies on agents with mixed NO-dependent vasodilating and beta-blocking activities. Pharm. Res. 1997, 14, 1750–1758. [Google Scholar] [CrossRef]
- Sparatore, A.; Santus, G.; Giustarini, D.; Rossi, R.; Del Soldato, P. Therapeutic potential of new hydrogen sulfide-releasing hybrids. Expert Rev. Clin. Pharmacol. 2011, 4, 109–121. [Google Scholar] [CrossRef]
- Lee, M.; Tazzari, V.; Giustarini, D.; Rossi, R.; Sparatore, A.; Del Soldato, P.; McGeer, E.; McGeer, P.L. Effects of hydrogen sulfide-releasing L-DOPA derivatives on glial activation: Potential for treating Parkinson disease. J. Biol. Chem. 2010, 285, 17318–17328. [Google Scholar] [CrossRef]
- Sestito, S.; Pruccoli, L.; Runfola, M.; Citi, V.; Martelli, A.; Saccomanni, G.; Calderone, V.; Tarozzi, A.; Rapposelli, S. Design and synthesis of H2S-donor hybrids: A new treatment for Alzheimer’s disease? Eur. J. Med. Chem. 2019, 184, 111745. [Google Scholar] [CrossRef]
- Lee, M.; Sparatore, A.; Del Soldato, P.; McGeer, E.; McGeer, P.L. Hydrogen sulfide-releasing NSAIDs attenuate neuroinflammation induced by microglial and astrocytic activation. Glia 2010, 58, 103–113. [Google Scholar] [CrossRef] [PubMed]
- Kashfi, K.; Olson, K.R. Biology and therapeutic potential of hydrogen sulfide and hydrogen sulfide-releasing chimeras. Biochem. Pharmacol. 2013, 85, 689–703. [Google Scholar] [CrossRef] [PubMed]
- Corvino, A.; Citi, V.; Fiorino, F.; Frecentese, F.; Magli, E.; Perissutti, E.; Santagada, V.; Calderone, V.; Martelli, A.; Gorica, E. H2S donating corticosteroids: Design, synthesis and biological evaluation in a murine model of asthma. J. Adv. Res. 2022, 35, 267–277. [Google Scholar] [CrossRef]
- Sparaco, R.; Citi, V.; Magli, E.; Martelli, A.; Piragine, E.; Calderone, V.; Andreozzi, G.; Perissutti, E.; Frecentese, F.; Santagada, V. Design, Synthesis and Evaluation of Novel Molecular Hybrids between Antiglaucoma Drugs and H2S Donors. Int. J. Mol. Sci. 2022, 23, 13804. [Google Scholar] [CrossRef] [PubMed]
- Cerqua, I.; Granato, E.; Corvino, A.; Severino, B.; D’Avino, D.; Simonelli, M.; Perissutti, E.; Scognamiglio, A.; Mirra, D.; D’Agostino, B.; et al. Prednisone-hydrogen sulfide releasing hybrid shows improved therapeutic profile in asthma. Front. Pharmacol. 2023, 14, 1266934. [Google Scholar] [CrossRef] [PubMed]
- Fiorucci, S.; Santucci, L.; Distrutti, E. NSAIDs, coxibs, CINOD and H2S-releasing NSAIDs: What lies beyond the horizon. Dig. Liver Dis. 2007, 39, 1043–1051. [Google Scholar] [CrossRef] [PubMed]
- Kashfi, K. Anti-cancer activity of new designer hydrogen sulfide-donating hybrids. Antioxid. Redox. Signal. 2014, 20, 831–846. [Google Scholar] [CrossRef]
- Chattopadhyay, M.; Kodela, R.; Nath, N.; Dastagirzada, Y.M.; Velázquez-Martínez, C.A.; Boring, D.; Kashfi, K. Hydrogen sulfide-releasing NSAIDs inhibit the growth of human cancer cells: A general property and evidence of a tissue type-independent effect. Biochem. Pharmacol. 2012, 83, 715–722. [Google Scholar] [CrossRef]
- Faris, P.; Negri, S.; Faris, D.; Scolari, F.; Montagna, D.; Moccia, F. Hydrogen Sulfide (H2S): As a Potent Modulator and Therapeutic Prodrug in Cancer. Curr. Med. Chem. 2023, 30, 4506–4532. [Google Scholar] [CrossRef]
- Lin, Y.; Yang, X.; Lu, Y.; Liang, D.; Huang, D. Isothiocyanates as H2S donors triggered by cysteine: Reaction mechanism and structure and activity relationship. Org. Lett. 2019, 21, 5977–5980. [Google Scholar] [CrossRef]
- Martelli, A.; Piragine, E.; Citi, V.; Testai, L.; Pagnotta, E.; Ugolini, L.; Lazzeri, L.; Di Cesare Mannelli, L.; Manzo, O.L.; Bucci, M. Erucin exhibits vasorelaxing effects and antihypertensive activity by H2S-releasing properties. Br. J. Pharmacol. 2020, 177, 824–835. [Google Scholar] [CrossRef] [PubMed]
- Peng, B.; Chen, W.; Liu, C.; Rosser, E.W.; Pacheco, A.; Zhao, Y.; Aguilar, H.C.; Xian, M. Fluorescent probes based on nucleophilic substitution–cyclization for hydrogen sulfide detection and bioimaging. Chem. A Eur. J. 2014, 20, 1010–1016. [Google Scholar] [CrossRef] [PubMed]
- Evans, J.M.; Donnelly, L.A.; Emslie-Smith, A.M.; Alessi, D.R.; Morris, A.D. Metformin and reduced risk of cancer in diabetic patients. BMJ 2005, 330, 1304–1305. [Google Scholar] [CrossRef] [PubMed]
- Suissa, S.; Azoulay, L. Metformin and the risk of cancer: Time-related biases in observational studies. Diabetes Care 2012, 35, 2665–2673. [Google Scholar] [CrossRef] [PubMed]
- Yu, O.H.Y.; Suissa, S. Metformin and Cancer: Solutions to a Real-World Evidence Failure. Diabetes Care 2023, 46, 904–912. [Google Scholar] [CrossRef] [PubMed]
- Cui, X.; Liu, R.; Duan, L.; Zhang, Q.; Cao, D.; Zhang, A. Exogenous hydrogen sulfide (H2S) exerts therapeutic potential in triple-negative breast cancer by affecting cell cycle and DNA replication pathway. Biomed. Pharmacother. 2023, 161, 114488. [Google Scholar] [CrossRef]
- Lee, Z.W.; Zhou, J.; Chen, C.-S.; Zhao, Y.; Tan, C.-H.; Li, L.; Moore, P.K.; Deng, L.-W. The slow-releasing hydrogen sulfide donor, GYY4137, exhibits novel anti-cancer effects in vitro and in vivo. PLoS ONE 2011, 6, e21077. [Google Scholar] [CrossRef] [PubMed]
- Li, J.; Li, M.; Li, L.; Ma, J.; Yao, C.; Yao, S. Hydrogen sulfide attenuates ferroptosis and stimulates autophagy by blocking mTOR signaling in sepsis-induced acute lung injury. Mol. Immunol. 2022, 141, 318–327. [Google Scholar] [CrossRef]
- Tortorella, S.M.; Royce, S.G.; Licciardi, P.V.; Karagiannis, T.C. Dietary sulforaphane in cancer chemoprevention: The role of epigenetic regulation and HDAC inhibition. Antioxid. Redox Signal. 2015, 22, 1382–1424. [Google Scholar] [CrossRef]
- Abbaoui, B.; Telu, K.H.; Lucas, C.R.; Thomas-Ahner, J.M.; Schwartz, S.J.; Clinton, S.K.; Freitas, M.A.; Mortazavi, A. The impact of cruciferous vegetable isothiocyanates on histone acetylation and histone phosphorylation in bladder cancer. J. Proteom. 2017, 156, 94–103. [Google Scholar] [CrossRef]
- Zechner, D.; Albert, A.-C.; Bürtin, F.; Vollmar, B. Metformin inhibits gemcitabine induced apoptosis in pancreatic cancer cell lines. J. Cancer 2017, 8, 1744. [Google Scholar] [CrossRef]
- Citi, V.; Corvino, A.; Fiorino, F.; Frecentese, F.; Magli, E.; Perissutti, E.; Santagada, V.; Brogi, S.; Flori, L.; Gorica, E. Structure-activity relationships study of isothiocyanates for H2S releasing properties: 3-Pyridyl-isothiocyanate as a new promising cardioprotective agent. J. Adv. Res. 2021, 27, 41–53. [Google Scholar] [CrossRef]
- Benavides, G.A.; Squadrito, G.L.; Mills, R.W.; Patel, H.D.; Isbell, T.S.; Patel, R.P.; Darley-Usmar, V.M.; Doeller, J.E.; Kraus, D.W. Hydrogen sulfide mediates the vasoactivity of garlic. Proc. Natl. Acad. Sci. USA 2007, 104, 17977–17982. [Google Scholar] [CrossRef]


| Cell Line | Cell Type | Met (IC50) | Met-ITC (IC50) | Met Range of Concentrations | Met-ITC Range of Concentrations |
|---|---|---|---|---|---|
| AsPC-1 | Pancreatic cancer | n.c. | 234.5 ± 13.9 µM | 100 µM–1 mM | 5 µM–1 mM |
| MIA PaCa-2 | Pancreatic cancer | 7.9 ± 0.02 mM | 370.8 ± 12.1 µM | 500 µM–10 mM | 100 µM–10 mM |
| MCF-7 | Breast cancer | 5.5 ± 0.1 mM | 18.0 ± 1.9 µM | 500 µM–5 mM | 1 µM–5 mM |
| MCF-10A | Breast epithelium | 2.2 ± 0.1 mM | 171.3 ± 10.5 µM | 100 µM–5 mM | 10 µM–1 mM |
| Cell Cycle Phase | Vehicle (DMSO 1%) | Met-ITC 10 µM | Met-ITC 20 µM | Met-ITC 100 µM |
|---|---|---|---|---|
| G0/G1 | 67.7 ± 1.5 | 65.2 ± 0.6 | 62.0 ± 1.8 | 58.0 ± 0.6 |
| S | 9.2 ± 0.2 | 8.6 ± 0.7 | 12.0 ± 0.6 | 13.8 ± 1.0 |
| G2/M | 20.3 ± 1.2 | 23.0 ± 0.7 | 24.1 ± 1.3 | 25.4 ± 0.4 |
Disclaimer/Publisher’s Note: The statements, opinions and data contained in all publications are solely those of the individual author(s) and contributor(s) and not of MDPI and/or the editor(s). MDPI and/or the editor(s) disclaim responsibility for any injury to people or property resulting from any ideas, methods, instructions or products referred to in the content. |
© 2023 by the authors. Licensee MDPI, Basel, Switzerland. This article is an open access article distributed under the terms and conditions of the Creative Commons Attribution (CC BY) license (https://creativecommons.org/licenses/by/4.0/).
Share and Cite
Citi, V.; Barresi, E.; Piragine, E.; Spezzini, J.; Testai, L.; Da Settimo, F.; Martelli, A.; Taliani, S.; Calderone, V. Anti-Proliferative Properties of the Novel Hybrid Drug Met-ITC, Composed of the Native Drug Metformin with the Addition of an Isothiocyanate H2S Donor Moiety, in Different Cancer Cell Lines. Int. J. Mol. Sci. 2023, 24, 16131. https://doi.org/10.3390/ijms242216131
Citi V, Barresi E, Piragine E, Spezzini J, Testai L, Da Settimo F, Martelli A, Taliani S, Calderone V. Anti-Proliferative Properties of the Novel Hybrid Drug Met-ITC, Composed of the Native Drug Metformin with the Addition of an Isothiocyanate H2S Donor Moiety, in Different Cancer Cell Lines. International Journal of Molecular Sciences. 2023; 24(22):16131. https://doi.org/10.3390/ijms242216131
Chicago/Turabian StyleCiti, Valentina, Elisabetta Barresi, Eugenia Piragine, Jacopo Spezzini, Lara Testai, Federico Da Settimo, Alma Martelli, Sabrina Taliani, and Vincenzo Calderone. 2023. "Anti-Proliferative Properties of the Novel Hybrid Drug Met-ITC, Composed of the Native Drug Metformin with the Addition of an Isothiocyanate H2S Donor Moiety, in Different Cancer Cell Lines" International Journal of Molecular Sciences 24, no. 22: 16131. https://doi.org/10.3390/ijms242216131
APA StyleCiti, V., Barresi, E., Piragine, E., Spezzini, J., Testai, L., Da Settimo, F., Martelli, A., Taliani, S., & Calderone, V. (2023). Anti-Proliferative Properties of the Novel Hybrid Drug Met-ITC, Composed of the Native Drug Metformin with the Addition of an Isothiocyanate H2S Donor Moiety, in Different Cancer Cell Lines. International Journal of Molecular Sciences, 24(22), 16131. https://doi.org/10.3390/ijms242216131