Article

Exploration of the Conformational Scenario for α-, β-, and γ-Cyclodextrins in Dry and Wet Conditions, from Monomers to Crystal Structures: A Quantum-Mechanical Study

Dipartimento di Chimica and Nanostructured Interfaces and Surfaces (NIS) Centre, Università degli Studi di Torino, Via P. Giuria 7, 10125 Torino, Italy
*
Author to whom correspondence should be addressed.
These authors contributed equally to this work.
Current address: Dipartimento di Scienza Applicata e Tecnologia, Politecnico di Torino, C.so Duca degli Abruzzi 24, 10129 Torino, Italy.
Int. J. Mol. Sci. 2023, 24(23), 16826; https://doi.org/10.3390/ijms242316826
Submission received: 30 September 2023 / Revised: 21 November 2023 / Accepted: 23 November 2023 / Published: 27 November 2023
(This article belongs to the Special Issue Cyclodextrins: Properties and Applications)

Abstract

:
Cyclodextrins (CDs) constitute a class of cyclic oligosaccharides that are well recognized and largely applied in the drug delivery field, thanks to their biocompatibility, low cost, and the possibility to be derivatized in order to tune and optimize the complexation/release of the specific drug. The conformational flexibility of these systems is one of their key properties and requires a cost-effective methodology to be studied by combining the accuracy of results with the possibility of exploring a large set of conformations. In the present paper, we have explored the conformational potential energy surface of the monomers and dimers of α-, β-, and γ-cyclodextrins (i.e., 6, 7, and 8 monomeric units, respectively) by means of fast but accurate semiempirical methods, which are then refined by state-of-the-art DFT functionals. Moreover, the crystal structure is considered for a more suitable comparison with the IR spectrum experimentally recorded. Calculations are carried out in the gas phase and in water environments, applying both implicit and explicit treatments. We show that the conformation of the studied molecules changes from the gas phase to the water, even if treated implicitly, thus modifying their complexation capability.

1. Introduction

Cyclodextrins (CDs) are cyclic oligosaccharides consisting of α-D-glucopyranose monomeric units connected by α-(1-4) glycosidic bonds. CDs are labeled with a Greek letter according to the number of glucopyranose units forming the molecule, i.e., 6, 7, and 8, corresponding to α-, β-, and γ-cyclodextrins, respectively [1,2,3], even if much larger structures have been synthesized, with more than 30 glucopyranose units [4]. Characterized by a non-symmetric toroidal structure, wider on one side and narrower on the other, cyclodextrins exhibit a truncated cone shape. This peculiar structural feature renders CDs particularly suitable as drug delivery systems [5] and, in their specific use as such, the different number of monomeric units affects the size of the cavity, thus impacting the size of the molecule that can be hosted [3,6]. The outermost part of the CD is more hydrophilic, while the inner cavity is more lipophilic. Thanks to these major structural features, cyclodextrins are widely utilized for drug delivery applications, due to their ability to form inclusion or encapsulation complexes with a broad range of heterogenic guest molecules. Moreover, CDs are biocompatible and biodegradable, with a relatively low-cost production [7,8].
In recent years, CDs have received much attention from the scientific community in a wider variety of applicative fields: in cosmetics [9,10,11] and in the food industry for odor and taste control [12,13,14,15,16]; in the environmental sector for heavy metal and pollutant removal [17,18,19,20,21,22]; and in the chemical/pharmaceutical sector as Drug Delivery Systems (DDS), i.e., high-performance carrier materials to deliver an established amount of drug to the targeted site within a specific period of time [6,23,24,25,26,27,28]. In the last decade, many computational works have been conducted aiming at an atomistic interpretation of the inclusion and release processes for several different guest molecules [29,30,31,32,33,34,35,36], such as amino acids [37,38,39], vitamins [40], unsaturated acids [41], and antioxidants molecules [42]. The broad applicability of the CD molecule is due to its very versatile properties: it can form 1:1, 2:1, and 2:2 type complexes (even if other ratios are also possible [43]), adapting itself to the size and properties of the guest molecule, by either complexing the guest dimers of small molecules or forming host dimers with large guest molecules [44]. Moreover, hydroxyl groups can be easily functionalized in order to further improve its complexation capabilities; as an example, the derivatization made by the methyl and hydroxypropyl groups improves cyclodextrin solubility [45]. Another relevant feature of CDs is that small molecules with symmetric acidic moieties, such as carbonic, succinic, and citric acid, can be used as cross-linkers, merging the cyclodextrins to one another, to form porous structures like nanosponges and nanogels [46,47].
The high mobility of cyclodextrins seems to be one of the main characteristics contributing to the inclusion and release of the guest molecule. Specifically, all the hydroxyl and hydroxymethyl groups are free to rotate, as well as the monomeric units, which can act as a sort of flip-flop mechanism, thus opening and closing the cavity, depending on the environmental conditions of the temperature and solvent [46,47,48,49,50]. At present, systematic works exploring the potential energy surface of the cyclodextrin bare system, its dimerization reaction, and its interaction with a solvent have been mostly carried out at a molecular mechanic level by means of large molecular dynamics simulations, therefore exploring all the possible conformations of such flexible systems, without, however, reaching the accuracy of quantum mechanically based methods [39,48,50,51,52]. On the other side, Density Functional Theory (DFT) studies are limited to arbitrarily selected conformations, in many cases neglecting the solvent, or at best using implicit (i.e., structureless) models [37,38,40,41,42,49,53,54,55,56,57,58]. However, a workflow combining these two techniques is still missing in the literature. The aim of this study is to provide accurate calculations that can discriminate among similar conformers but, at the same time, to explore the complex potential energy surface of these flexible systems by considering all the possible conformers.
In the present work, we propose a systematic study of α-, β-, and γ-cyclodextrin conformations, by means of a semiempirical methodology, to explore their potential energy surfaces, thereby refining geometries at the DFT level, carefully benchmarked against several double-hybrid DFT functionals (i.e., DFT with post-HF MP2 correction).

2. Results and Discussion

2.1. Nomenclature and Workflow

In the following, the computational characterization of the three cyclodextrins, from β, to α, to γ, is presented considering the monomeric, dimeric, and crystalline structures. The monomeric units of the α-, β-, and γ-cyclodextrins were extracted from the corresponding crystallographic structures [59,60,61].
Figure 1 reports three top and one side views of the β-cyclodextrin with the scope of describing the nomenclature adopted throughout the paper, valid also for the α and γ structures.
In Figure 1, we have highlighted the -OH-bearing carbon atoms, namely C2, C3, and C6, and we have arbitrarily labeled “Head” and “Tail” as the two parts of the molecule where the hydroxyl groups are located (C2 and C3 belong to the Head, while C6 to the Tail). Moreover, we have also reported the two possible optimized conformations, i.e., the closed and open, naming them CD1 and CD2, respectively. All the other conformations will be referred to as “xn”, where n corresponds to the structure number assigned during the conformational search performed by the CREST module of the xTB code (see Computational details). This nomenclature has been applied also to the cases of the α- and γ cyclodextrins, as it is defined for the monomeric glucose unit.
We sum up the computational procedure adopted for all CD monomers in the following methodological workflow:
  • xTB-CREST for the conformational exploration;
  • xTB-GFN2 for semiempirical geometry optimization on all the β-CD conformations derived by CREST;
  • Composite DFT functionals for re-optimization on a number of structures selected in the range within 2 kcal/mol with respect to the most stable structure in the CREST energetic ranking;
  • Double-hybrid DFT functionals for single-point calculations during the benchmark (see Section 2.2.1);
  • r2SCAN-3c composite DFT functional for vibrational frequency calculations on a number of structures selected in the range within 1 kcal/mol with respect to the most stable structure in the r2SCAN-3c energetic ranking.

2.2. The Case of β-Cyclodextrin

2.2.1. Benchmarking Computational Methods

We have chosen the β-CD molecule to perform the computational benchmark.
The conformational search was carried out on both the CD1 and CD2 conformers. The only structure obtained by CREST using the CD1 as a starting point is the CD1 itself, indicating that CREST metadynamic calculations are not able to open the fully closed conformation. All the 217 structures found by CREST during the conformational search on the CD2 were re-optimized at the GFN2 level by removing all the constraints imposed during the conformational exploration. Then, the 10 most stable structures obtained by the abovementioned conformational explorations were re-optimized with B97-3c and r2SCAN-3c functionals. On the two sets of obtained optimized geometries (B97-3c and r2SCAN-3c) single-point calculations were performed with B2PLYP-D3BJ, DSD-BLYP-D3BJ, and DSD-PBEP86-D3BJ functionals (double-hybrid) to crosscheck the reliability of each method from both geometrical and energetic standpoints. Indeed, the DSD functionals are reported to be very accurate in the description of isomerization reactions and non-covalent interactions [62]. In Table 1, structure labels and their relative stability values with respect to the most stable conformer (CD1) are reported. Both the B97-3c and r2SCAN-3c show good agreement with the double-hybrid functionals for what concerns the geometry, as the column associated with the double-hybrid methods gives good values, with a maximum error of about 1 and 3 kcal/mol, for the r2SCAN-3c and B97-3c, respectively. Therefore, we have selected the r2SCAN-3c as the functional reference for all the simulations here presented (see Table S1 for comparison with GFN2).

2.2.2. β-CD Monomer in Dry and Wet Conditions

The conformational space of the β-cyclodextrin has been investigated both in the gas and aqueous phases, as this system is often used in water solvent, not only for synthesis but also during the drug delivery process in the human body. Due to the high complexity of explicitly simulating the solvent (i.e., in the presence of a great number of solvating water molecules), we have applied the C-PCM implicit model as a first approach.
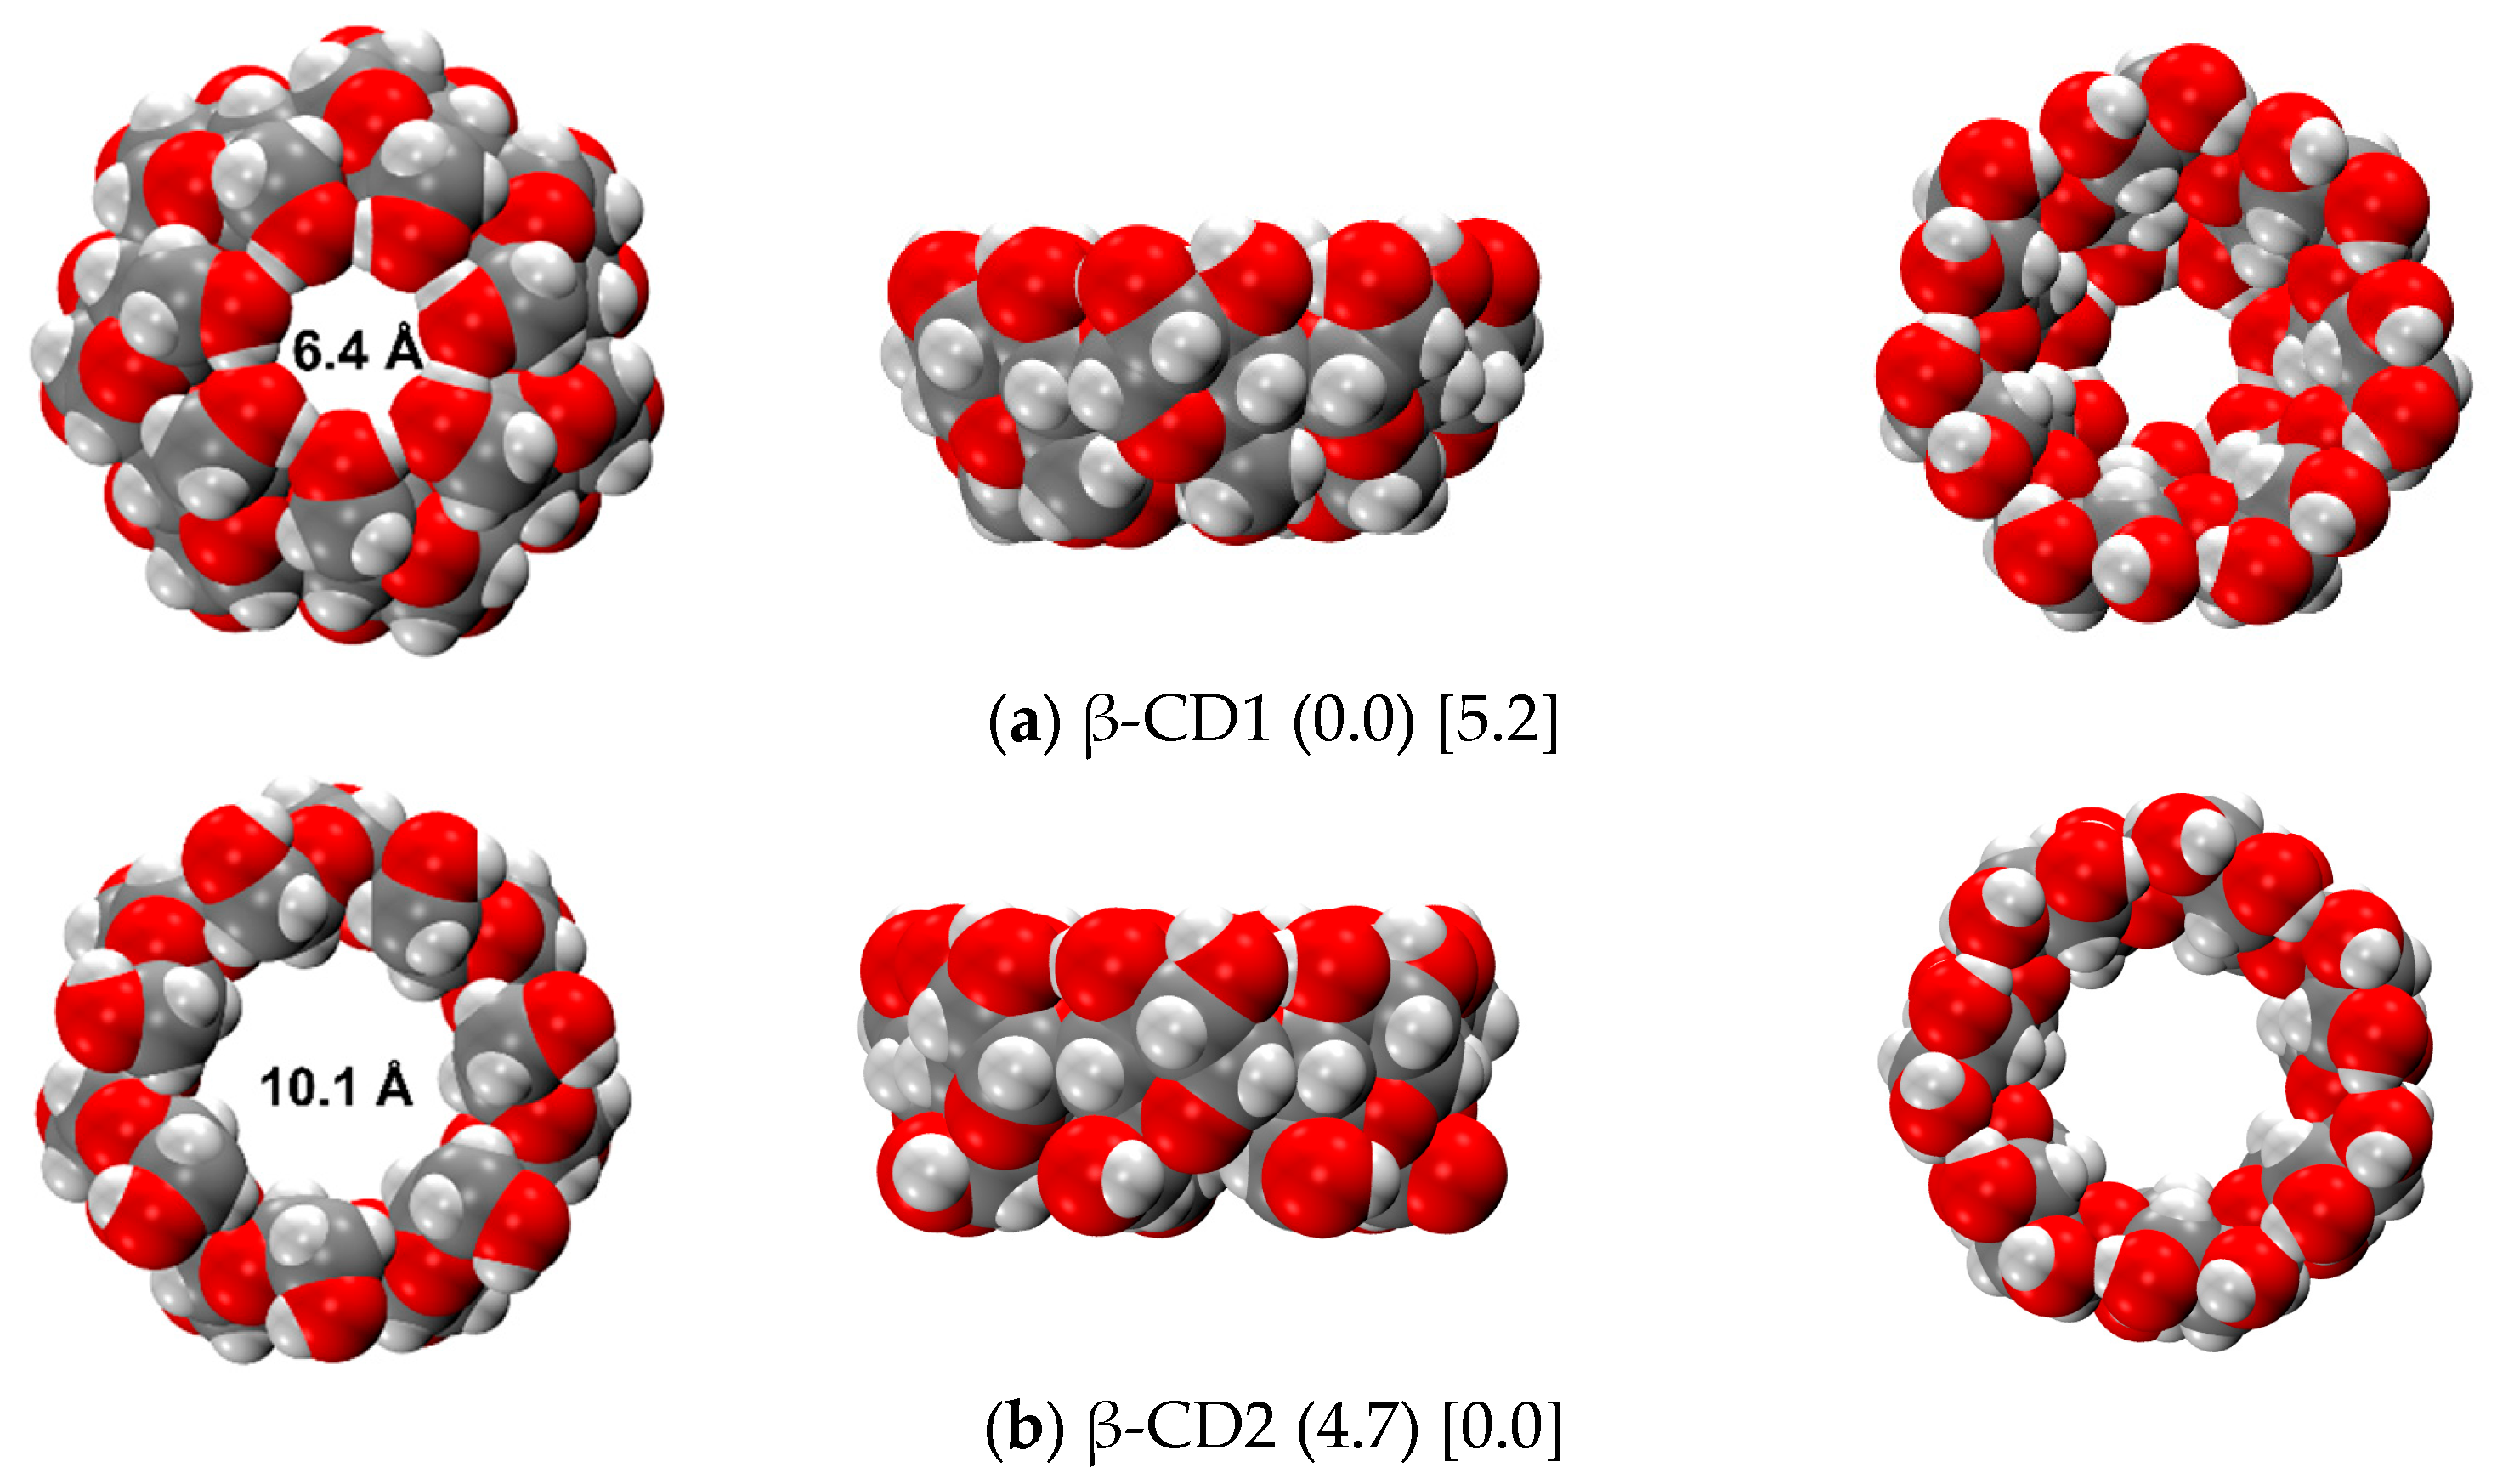
Figure 2 shows the two most stable structures, namely CD1 and CD2, in the gas phase and in water C-PCM. The first sports a closed configuration, in which the hydroxymethyl chains on the “Tail” side of the truncated cone are interacting with one another, forming seven strong hydrogen bonds (1.862 Å). These H-bonds are formed in addition to the H-bond pattern on the “Head” side, where all C2 hydroxyl groups donate an H-bond (2.190 Å) to the C3 of the subsequent monomeric unit (same for both CD1 and CD2). The CD1 conformation is the most stable in the gas phase, the second (CD2) being less stable at 4.7 kcal/mol (see previous section). These findings agree with a previous paper by Stachowicz et al. [49] from a qualitative point of view, even if they calculated a lower difference in energy between CD1 and CD2, equal to 2.8 kcal/mol. Moreover, in ref. [49] the authors found another CD2-type structure in which the Tail part presents seven H-bonds but with results less stable than CD1 at 18.0 kcal/mol; this specific conformation was not found by our conformational search, since CREST only retains the structures within a 6 kcal/mol range with respect to the most stable. Nevertheless, as a further check, we built that structure manually (see Figure S1) and we calculated an energy difference with respect to CD1 of 17.6 kcal/mol, very close to the literature value.
In C-PCM water solvent, the most stable structure is CD2, with all the hydroxyl moieties pointing towards the outermost part of the molecule. It is interesting to notice that the implicit solvent, despite its structureless nature, is able to deeply change the β-CD stability with respect to the gas phase. In particular, as one could expect in a real water environment, the structure changes in the sense of exposing to the solvent the most polar (hydrophilic) part of the molecule, i.e., the OH moiety of the hydroxymethyl groups, instead of the -CH2- aliphatic part (as in CD1). From an energetic point of view, this is the opposite with respect to the gas phase, i.e., CD2 is more stable at 5.2 kcal/mol than CD1. From a geometrical point of view, instead, the water solvation does not change the H-bond pattern of either CD1 or CD2. More details on the geometries are available in Table S2. In Table 2, the energetic ranking of the β-CD in C-PCM water is shown. For the low-lying structures within 1 kcal/mol with respect to the most stable, vibrational frequencies were also computed in order to calculate the solvation ΔG. The free energy correction does not change the relative energy ranking; however, all solvation energy values increase by ca. 10 kcal/mol because of the zero-point energy and vibrational entropy contributions that favor the open structure over the closed one. At variance with the conformational exploration in the gas phase, in the case of implicit water, the hydroxymethyl groups are much less constrained than in CD1 as they establish interactions with the solvent, thus finding many local minima.

2.2.3. Increasing System Size: β-CD Dimers

To study the most stable structure of β-CD, the conformational search on the monomer is not exhaustive, as it is not certain that the dimeric form is composed of two molecules in the most stable conformation of the monomer. In this section, we report all the possible H-bonded β-CD dimers, as a full CREST analysis would be unaffordable in terms of time and memory consumption. Two possible orientations were considered: (i) the Head-Head (HH), with the two wider rings (bearing the secondary C2 and C3 hydroxyls) facing one to each other, and (ii) the opposite conformation called Tail-Tail (TT), involving the interaction between the two narrower rings, with the C6 hydroxyls (see Figure 1 for Head and Tail nomenclature). Both were built up using the most stable CD1 and CD2 conformers found for the monomers, in the gas phase and in water, respectively, for a total number of 4 structures.
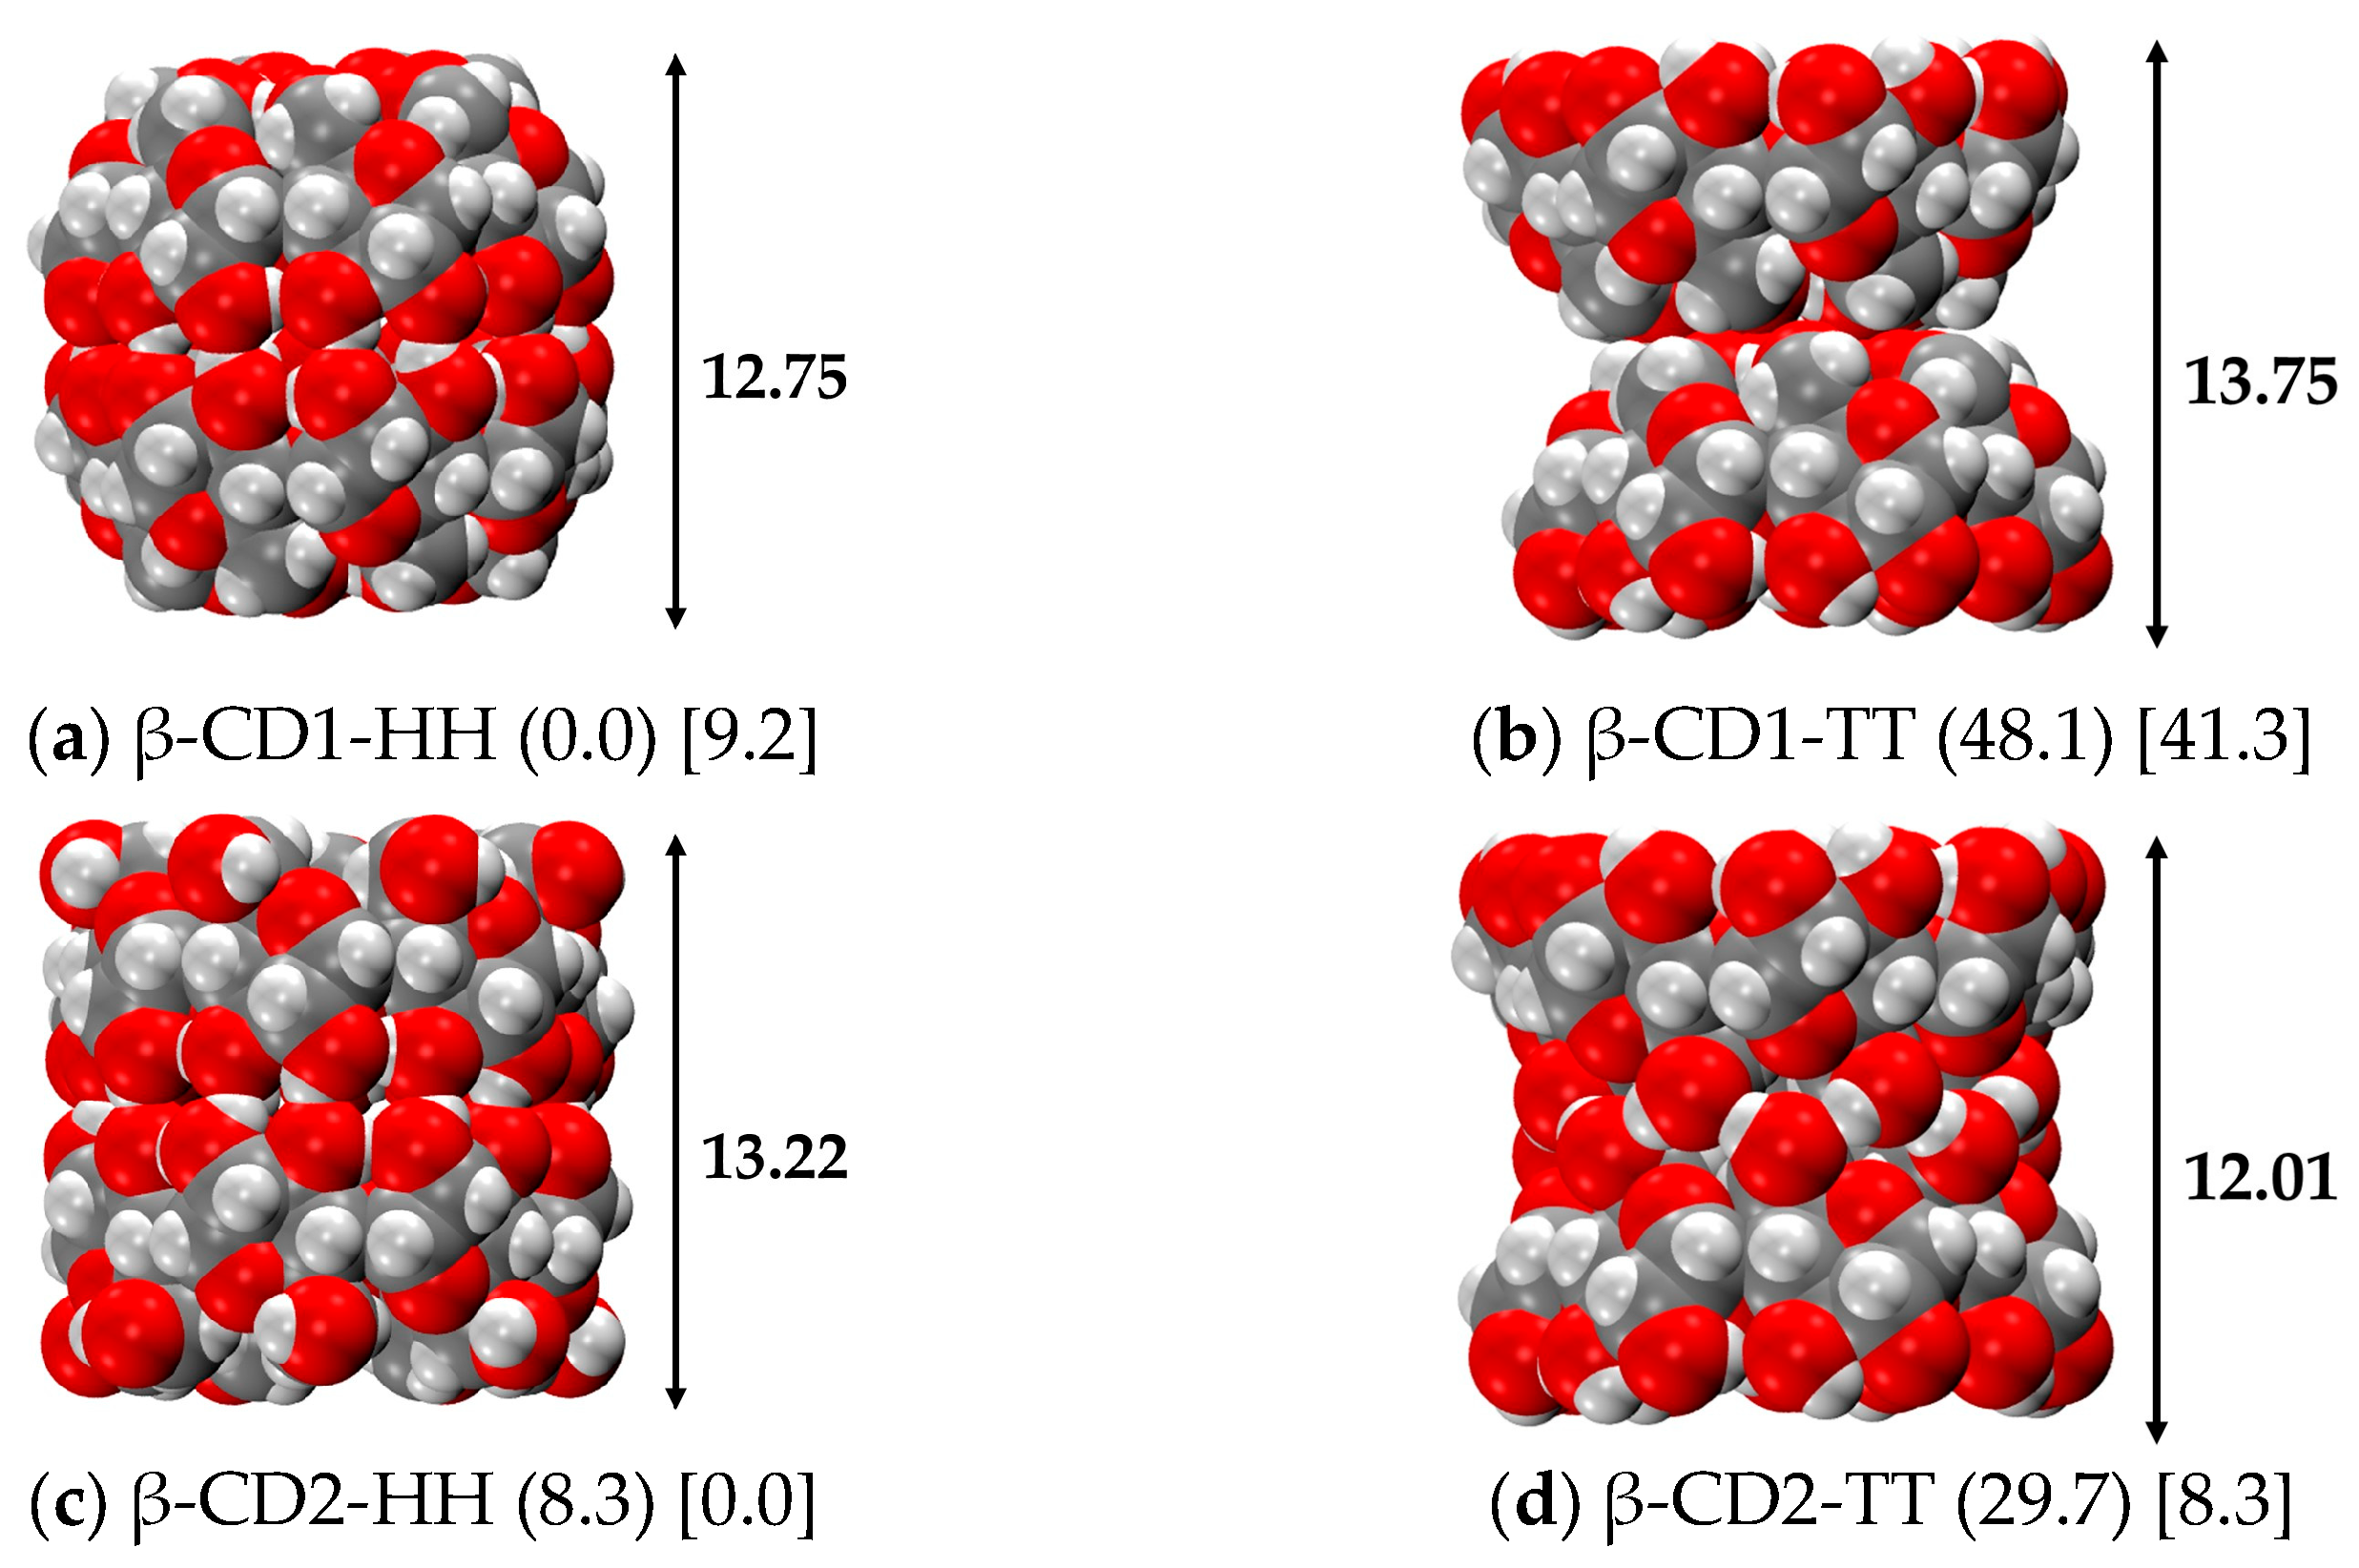
As displayed in Figure 3, the geometry of each β-CD is conserved but the dimerization has led to new structures with characteristic shapes: the CD1 Head-Head is an almost completely closed (barrel-like, Figure 3a) structure, the CD2 Head-Head is an almost perfect cylinder (Figure 3d), while both the Tail-Tail dimers have a noticeable hourglass shape (Figure 3b,c). The CD1 dimers present evident steric hindrances in the Tail side of the monomeric unit, which renders it very difficult for whatever molecule to enter within the dimer, in particular in the CD1 Tail-Tail, that presents a bottleneck in the middle of the structure (hourglass-type structure).
On the contrary, the CD2 dimers are characterized by a cavity capable of complexing several drugs, even particularly long-chain molecules, up to 13.34 Å (see Figure 3). As found for the monomer, the most stable dimer in the gas phase is represented by CD1 in the Head-Head conformation, with a dimerization energy of −64.6 kcal/mol and a dimerization free energy of −35.2 kcal/mol (see Table 3). This is the structure forming the maximum number of H-bonds, and indeed, every -OH group is engaged in two H-bonds, behaving as both donor and acceptor. On the Head side, all the hydroxyl groups on the C3 atoms (that are only H-bond acceptors in the monomer) donate an H-bond to the hydroxyl group on the C2 atom of the other β-CD, thus forming seven additional H-bonds (1.905 Å) that keep the two CDs together. The same conformation, but for CD2 (i.e., CD2-HH), is higher in energy by about 8 kcal/mol, confirming that when the two wide rings face one another, the H-bond pattern is maximized.
The TT structures are fairly less stable, about 30 to 50 kcal/mol, as they have fewer H-bond interactions; in CD1-TT, the less stable case in the gas phase and in implicit water, the two monomers are interacting only throughout dispersive forces. In a similar way as happens to the monomers, for dimers, the situation is different in the water environment and, in particular, there is an inversion of stability between the CD1 and CD2 conformations. The most stable structure in water is that of CD2-HH, not followed in the stability order by the corresponding CD1-HH, but by CD2-TT, which is stabilized with respect to the gas phase, with a dimerization energy value close to that of the most stable conformer. As expected, the less stable dimer is CD1-TT, as in the gas phase and in water its dimerization energy is even smaller (−3.5 kcal/mol). Even for dimers, the geometrical changes are, in contrast to the energies, not so affected by the implicit solvation. As a general trend, strong H-bonds (1.8–1.9 Å) tend to become slightly weaker (with an increase of 0.02–0.05 Å), while weak H-bonds (2.1–2.3 Å) become stronger (decrease of 0.1–0.3 Å).
In this case, the thermodynamic corrections deeply change the energetic features, especially if entropy is included. In the gas phase, even the relative energy is affected by entropic corrections, inverting the most stable structures, with the CD1 conformation being close and compact and, accordingly, entropically disfavored. The Gibbs free energy correction affects even more, unsurprisingly, the dimerization energy, as in that case, the entropic factor favors the reactants (2 molecules) instead of the product (1 molecule) of about 20–30 kcal/mol.

2.2.4. Towards Periodicity: β-CD Crystal

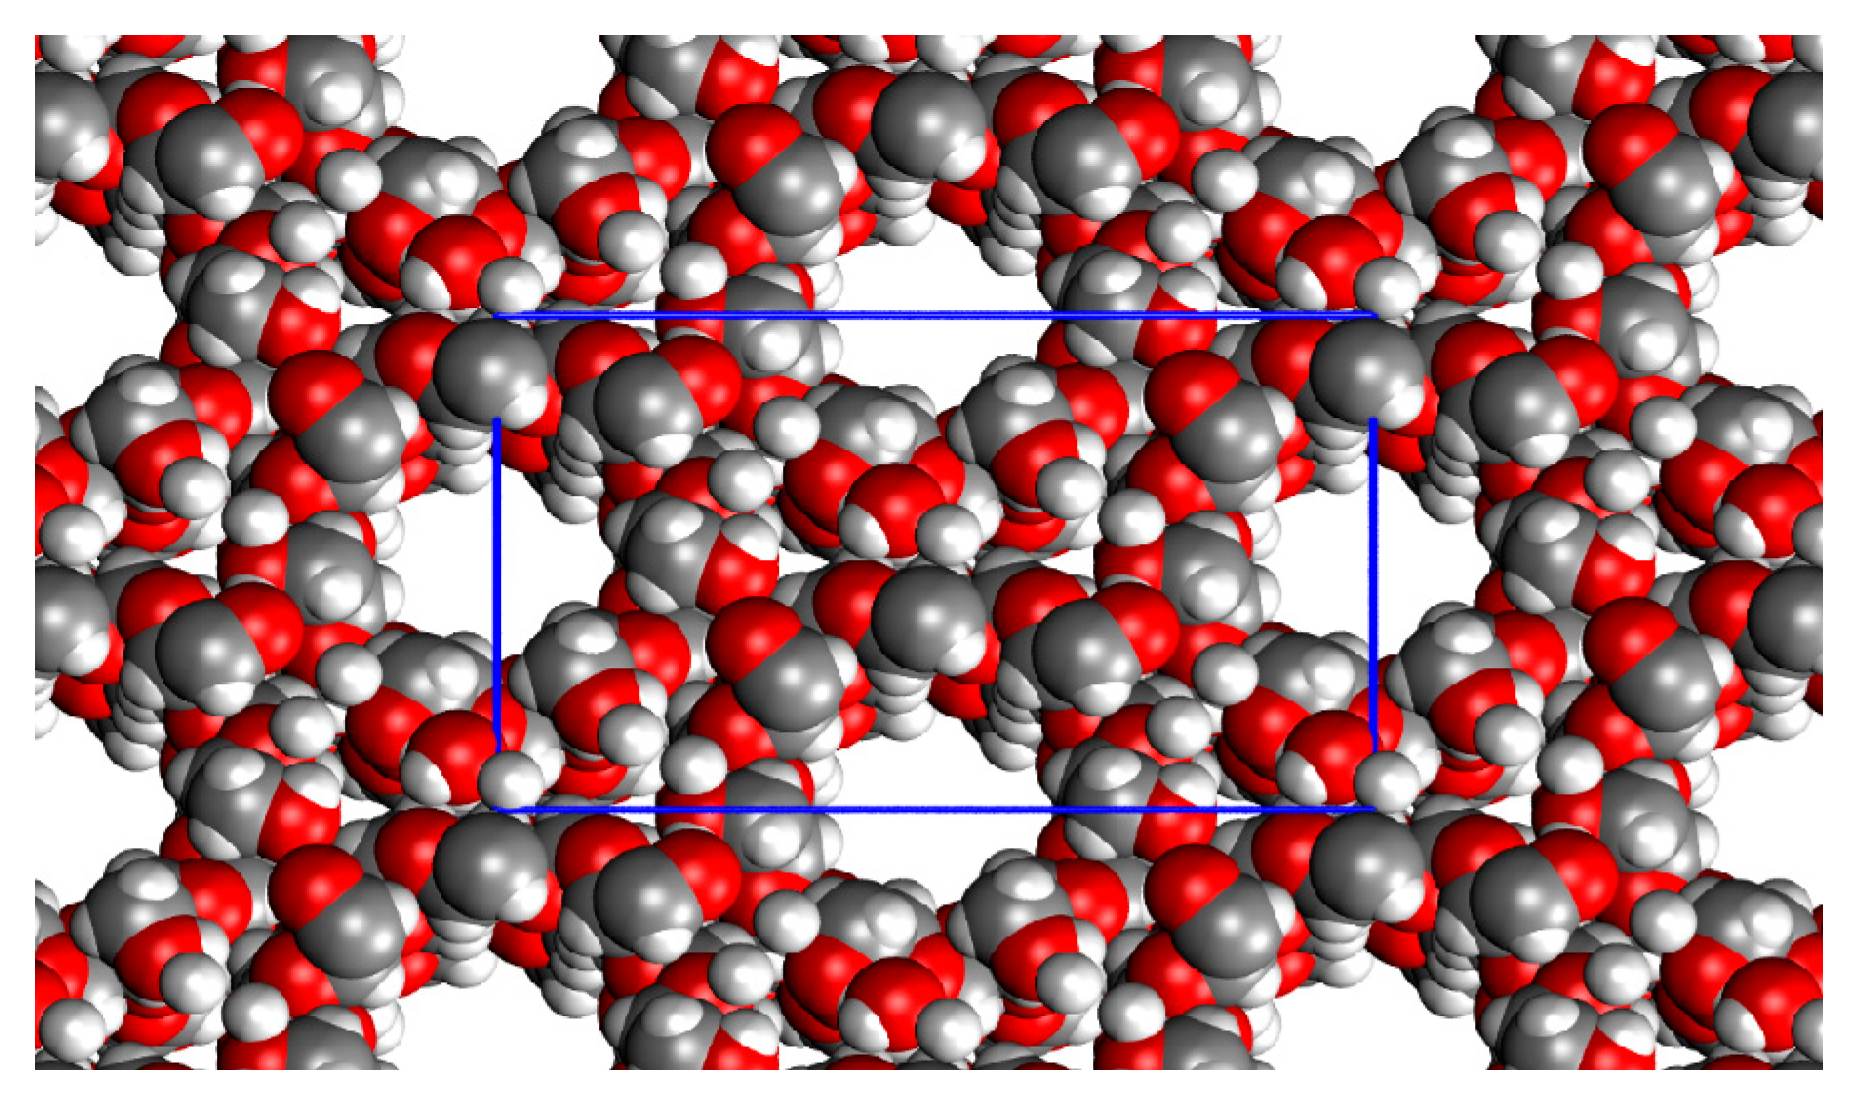
Figure 4 reports the r2SCAN-D3BJ/def2-TZVP(gCP) optimized crystal structure of the β-cyclodextrin, while Table 4 reports the crystallographic calculated data in comparison with the experimental ones. The spatial disposition of the cyclodextrins is made via side-by-side cylinders of the CD structures, each one composed of an alternate internal –[Head-Head-Tail-Tail]n- pattern and making 14 H-bonds with the neighboring CD cylinders. The percent error is high for only one cell parameter (Δ%(a) = 12.5) and, on average, the optimized structure is a little shrunk with respect to the experimental value. This is due to the fact that in the crystallographic structure, there is a very high uncertainty about the positions of the hydroxyl H atom. The first manual editing of the crystal structure was indeed devoted to redefining these specific atomic positions in a way that the H-bonds, in particular the intermolecular ones, had the maximum number possible. Due to this arbitrary decision, the final structure results are more compact than the experimental one, in which not all the hydrogens in the unit cell are in their most favorable position to maximize the number of H-bonds. The Cohesive enthalpy is larger than the dimerization energies, with the hydroxyl groups being fully engaged in H-bond interactions in all three dimensions of the periodic structure, as well as dispersive interactions. Nevertheless, the entropic corrections are similar to those of the dimers (around 30 kcal/mol).

2.3. α-Cyclodextrin

2.3.1. α-CD Monomer

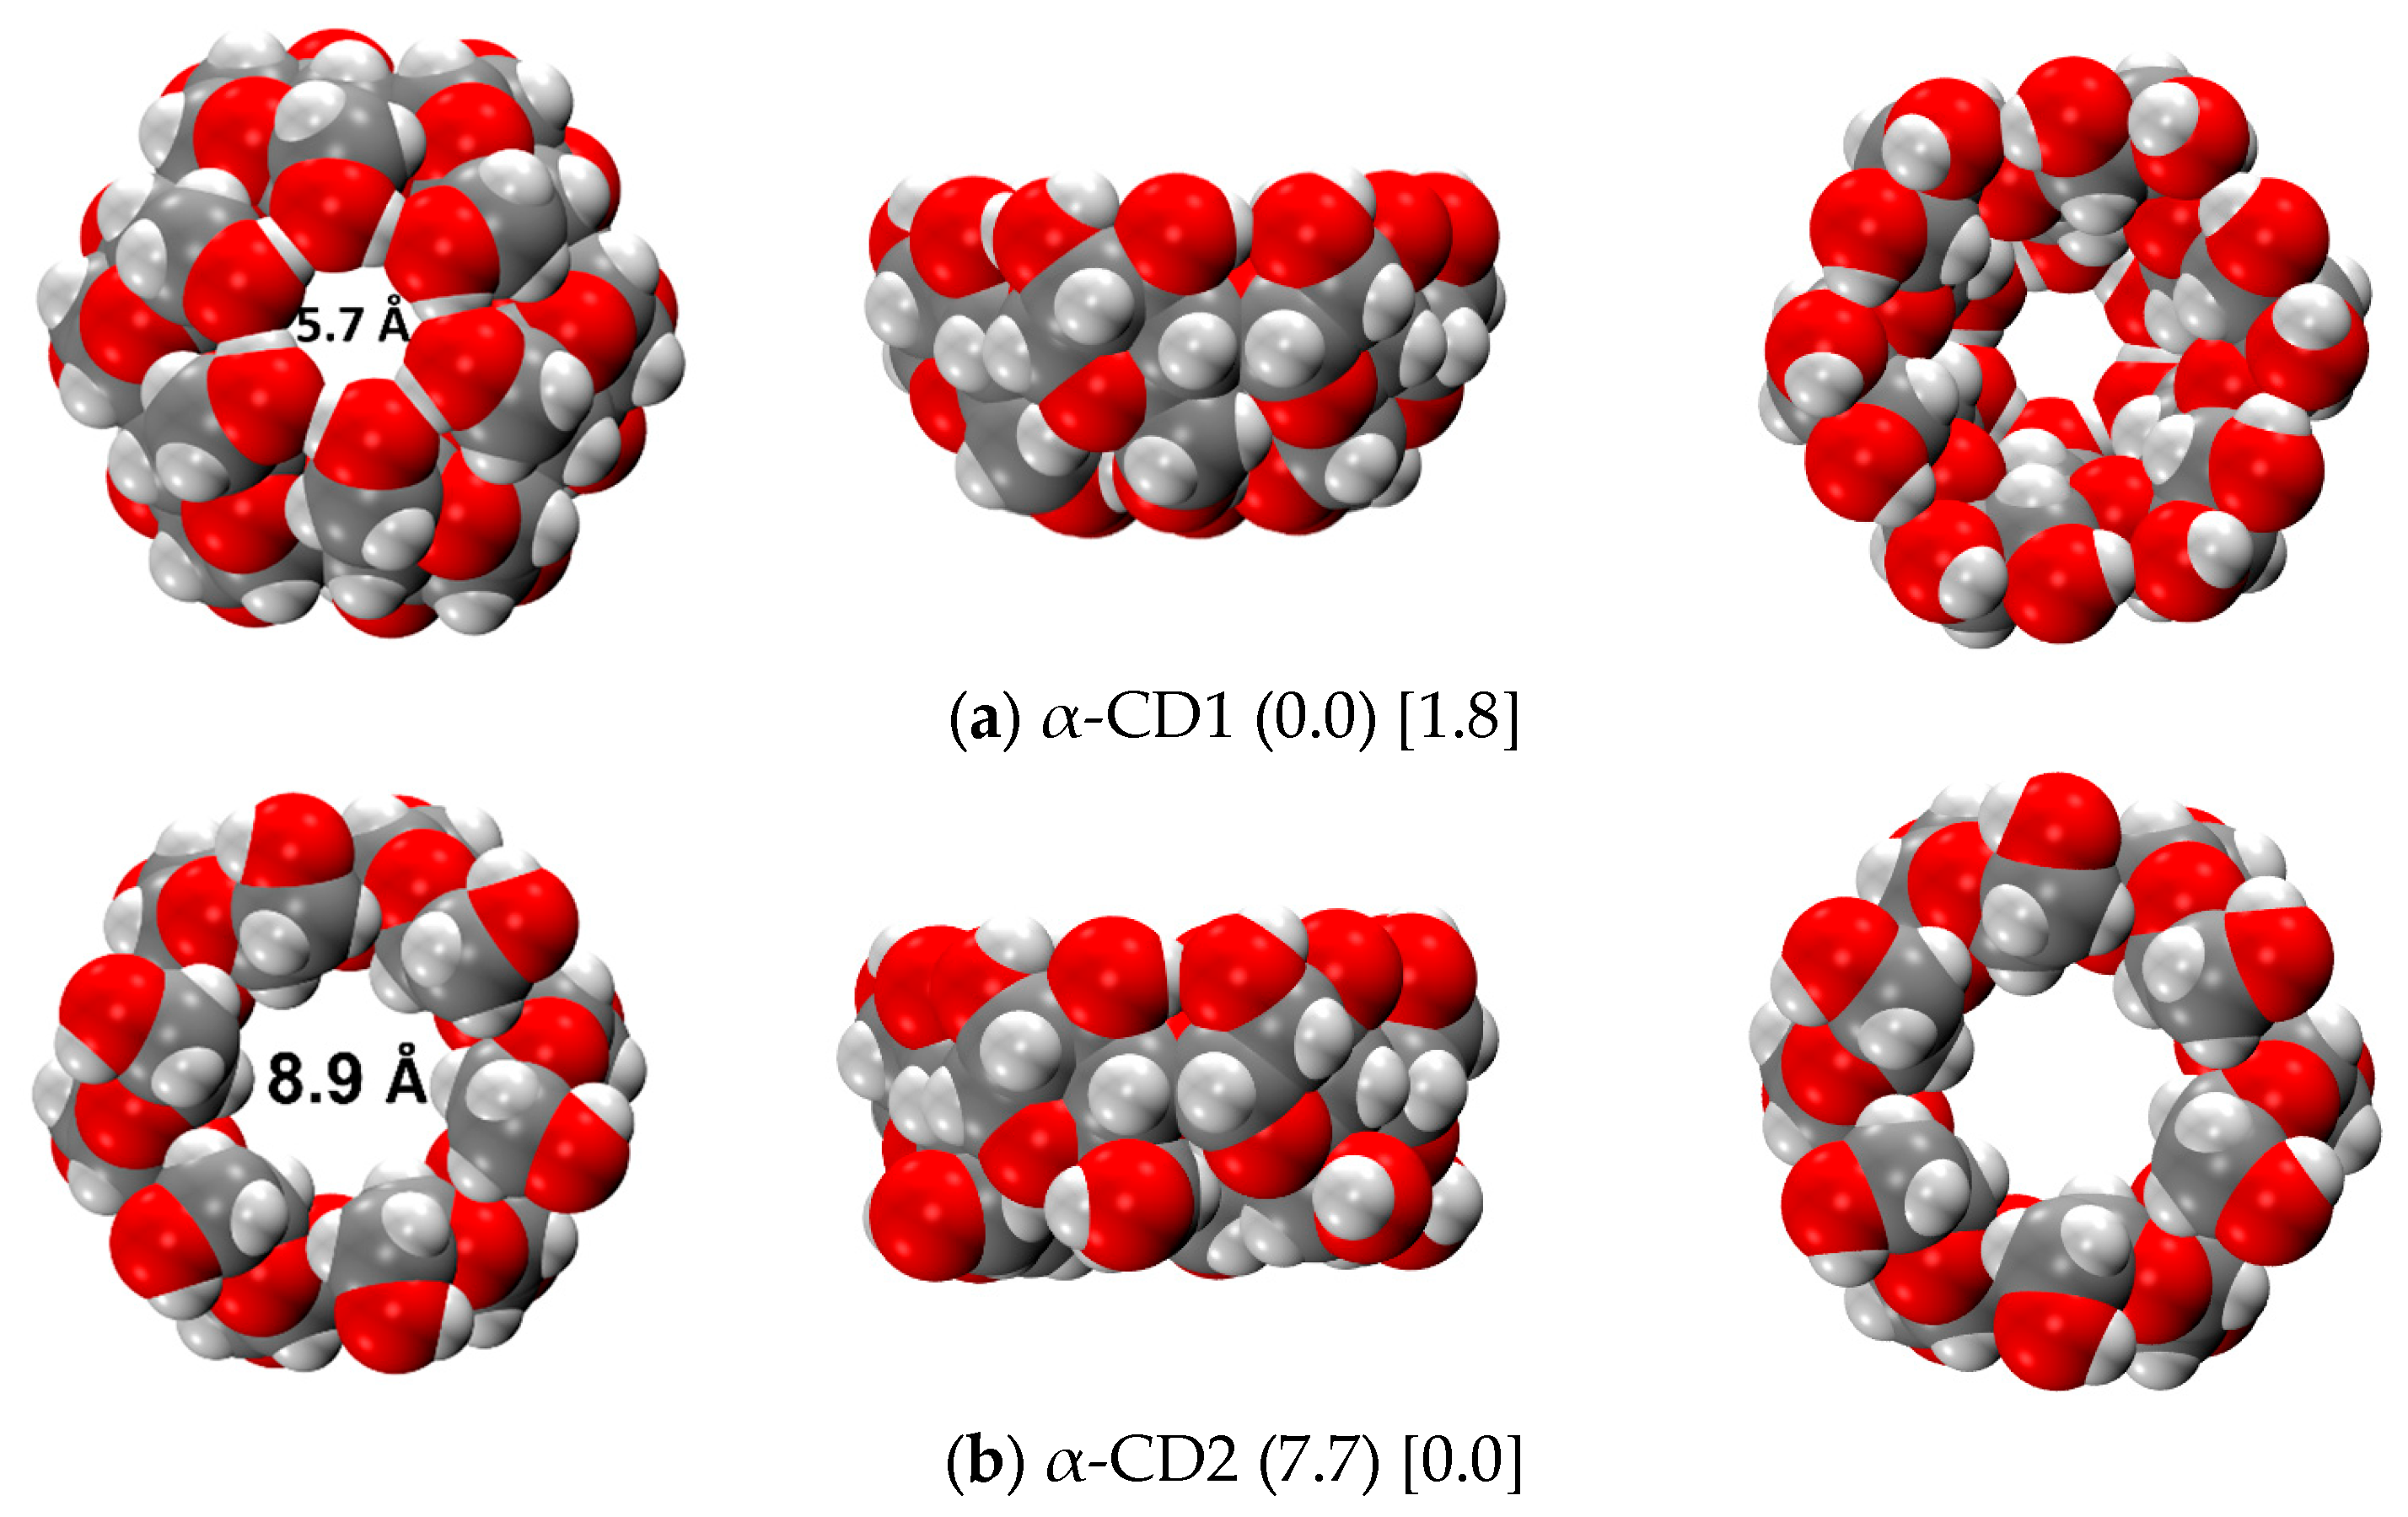
The global minimum structure of α-cyclodextrin (α-CD) was also investigated both in the gas phase and in aqueous media, employing the same workflow as for the β-CD. In the gas phase, the CREST conformational search has only found the α-CD1 structure, as happened for β-CD. Figure 5 shows the r2SCAN-3c optimized structures in the gas phase, and the relative energies of α-CD1 and α-CD2 in both the gas phase and C-PCM. In this case, the α-CD2 is less stable than α-CD1 (7.7 kcal/mol) with respect to the corresponding β-CDs (4.7 kcal/mol). We attribute this difference to the major stability of the H-bonds on the Tail side of α-CD1, whose length increases from α-CD1 to β-CD1 (see Figure S2). Moreover, the shape of α-CD1 is more compact than that of β-CD1, and this increases the intramolecular dispersive interactions, further stabilizing the closed conformer over the open one. The above-mentioned stabilization is also found with the implicit solvent, as the relative energy decreases from 5.2 kcal/mol of the β-CDs to 1.8 kcal/mol of the α-CDs. At variance with the conformational exploration carried out on β-CD, which was not able to convert CD1 into CD2 and vice versa, in this case, the α-CD2 structure (used as input in the water phase) converts into CD1 during the CREST exploration procedure. Therefore, according to GFN2, the α-CD1 structure is the most stable conformer even in a water environment, as already happened for β-CD. However, r2SCAN-3c energies confirmed that the lowest energy conformer in the water phase is the α-CD2, as it was for β-CD. It is worth mentioning that the conformational exploration in this case returned solely α-CD2 as the only monomer contributing to the Boltzmann population, the second most stable structure being higher in energy at 4 kcal/mol (see Table S4). Probably, the reduced size of the molecule limits its mobility and, accordingly, also the stability of the various conformers, at a variance of what happens for β-CD.

2.3.2. α-CD Dimer

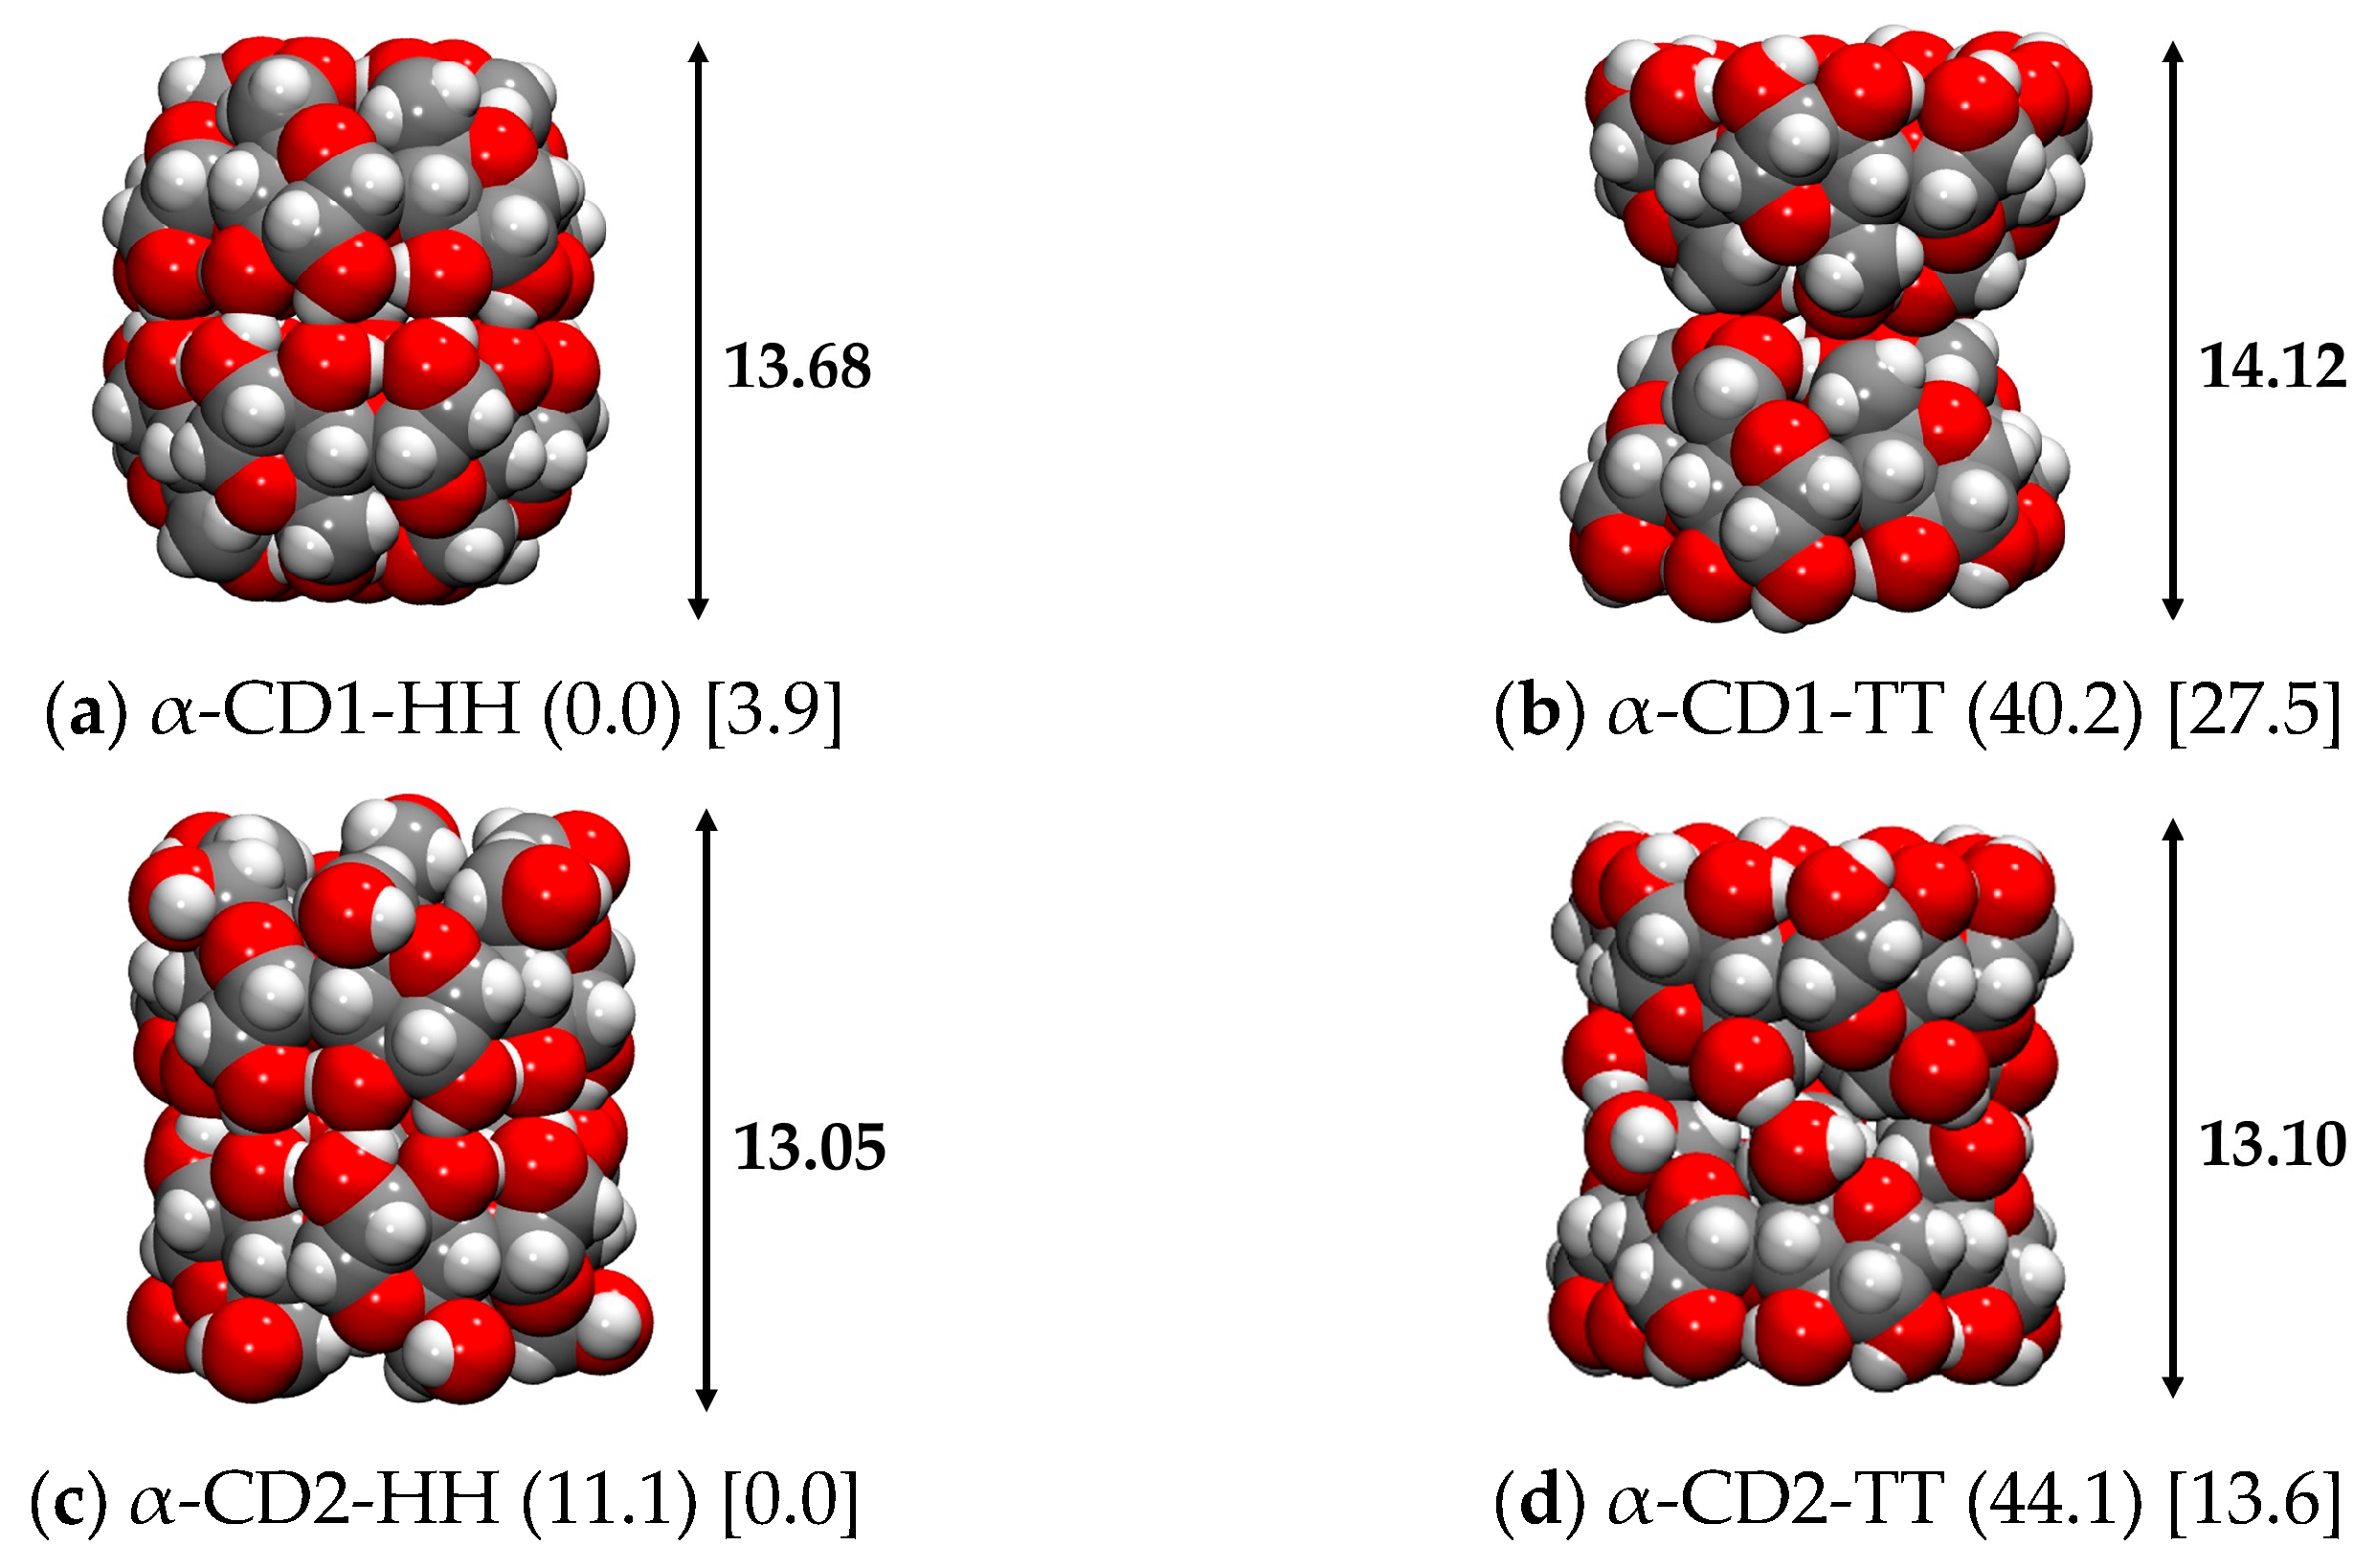
Following the same criteria used for the β-CD, the Head-Head and Tail-Tail dimers of α-CD were also built using the most stable CD1 and CD2 conformers found for the monomers, and their geometries were optimized in the gas phase and in implicit water. Figure 6 shows the geometrical shapes of the dimers found for α-cyclodextrin, which are very similar to those of β-CD (see Figure 3), except for the length of the α-CD1-HH dimer, which is longer than the β-CD1-HH one (13.69 Å versus 13.34 Å, respectively), as the monomer is less flattened due to the lack of one glucose unit.
The α-CD1-HH dimer has a smaller, barrel-like structure with respect to β-CD1-HH, as well as α-CD2-HH, which keeps the same cylindric structure as β-CD2-HH but with a smaller diameter. Both Tail-Tail dimers show the typical hourglass structure, which is more pronounced in the CD1 monomer. As reported in Table 5, the most stable dimer in the gas phase is represented by α-CD1-HH, with a dimerization energy of −52.0 kcal/mol and a dimerization free energy of −26.1 kcal/mol, which is a lower value compared to that of β-CD (−64.6 and −35.2 kcal/mol, see Table 3), due to the lack of one glycosidic unit and, therefore, of two H-bonds. A large difference is observed between the α- and β- Tail-Tail dimers. Specifically, the β-CD2-TT is much more stable than the β-CD1-TT (of about 20 kcal/mol) due to the presence of a strong H-bond chain at the interface between the Tail sides of the two conformers, which is completely absent in β-CD1-TT. On the contrary, the α-CD1-TT and α-CD2-TT are very close in energy (4 kcal/mol) because α-CD2-TT does not present the same strong H-bond pattern as β-CD2-TT. In implicit water, the most stable structure is that of α-CD2-HH and the dimerization energies decrease with respect to the gas phase, as well as for the β-CD dimers, due to the competitive interactions with the solvent, and in the α-CD1-HH case the free energy correction even leads to positive dimerization energy (i.e., repulsive).

2.4. γ-Cyclodextrin

2.4.1. γ-CD Monomer

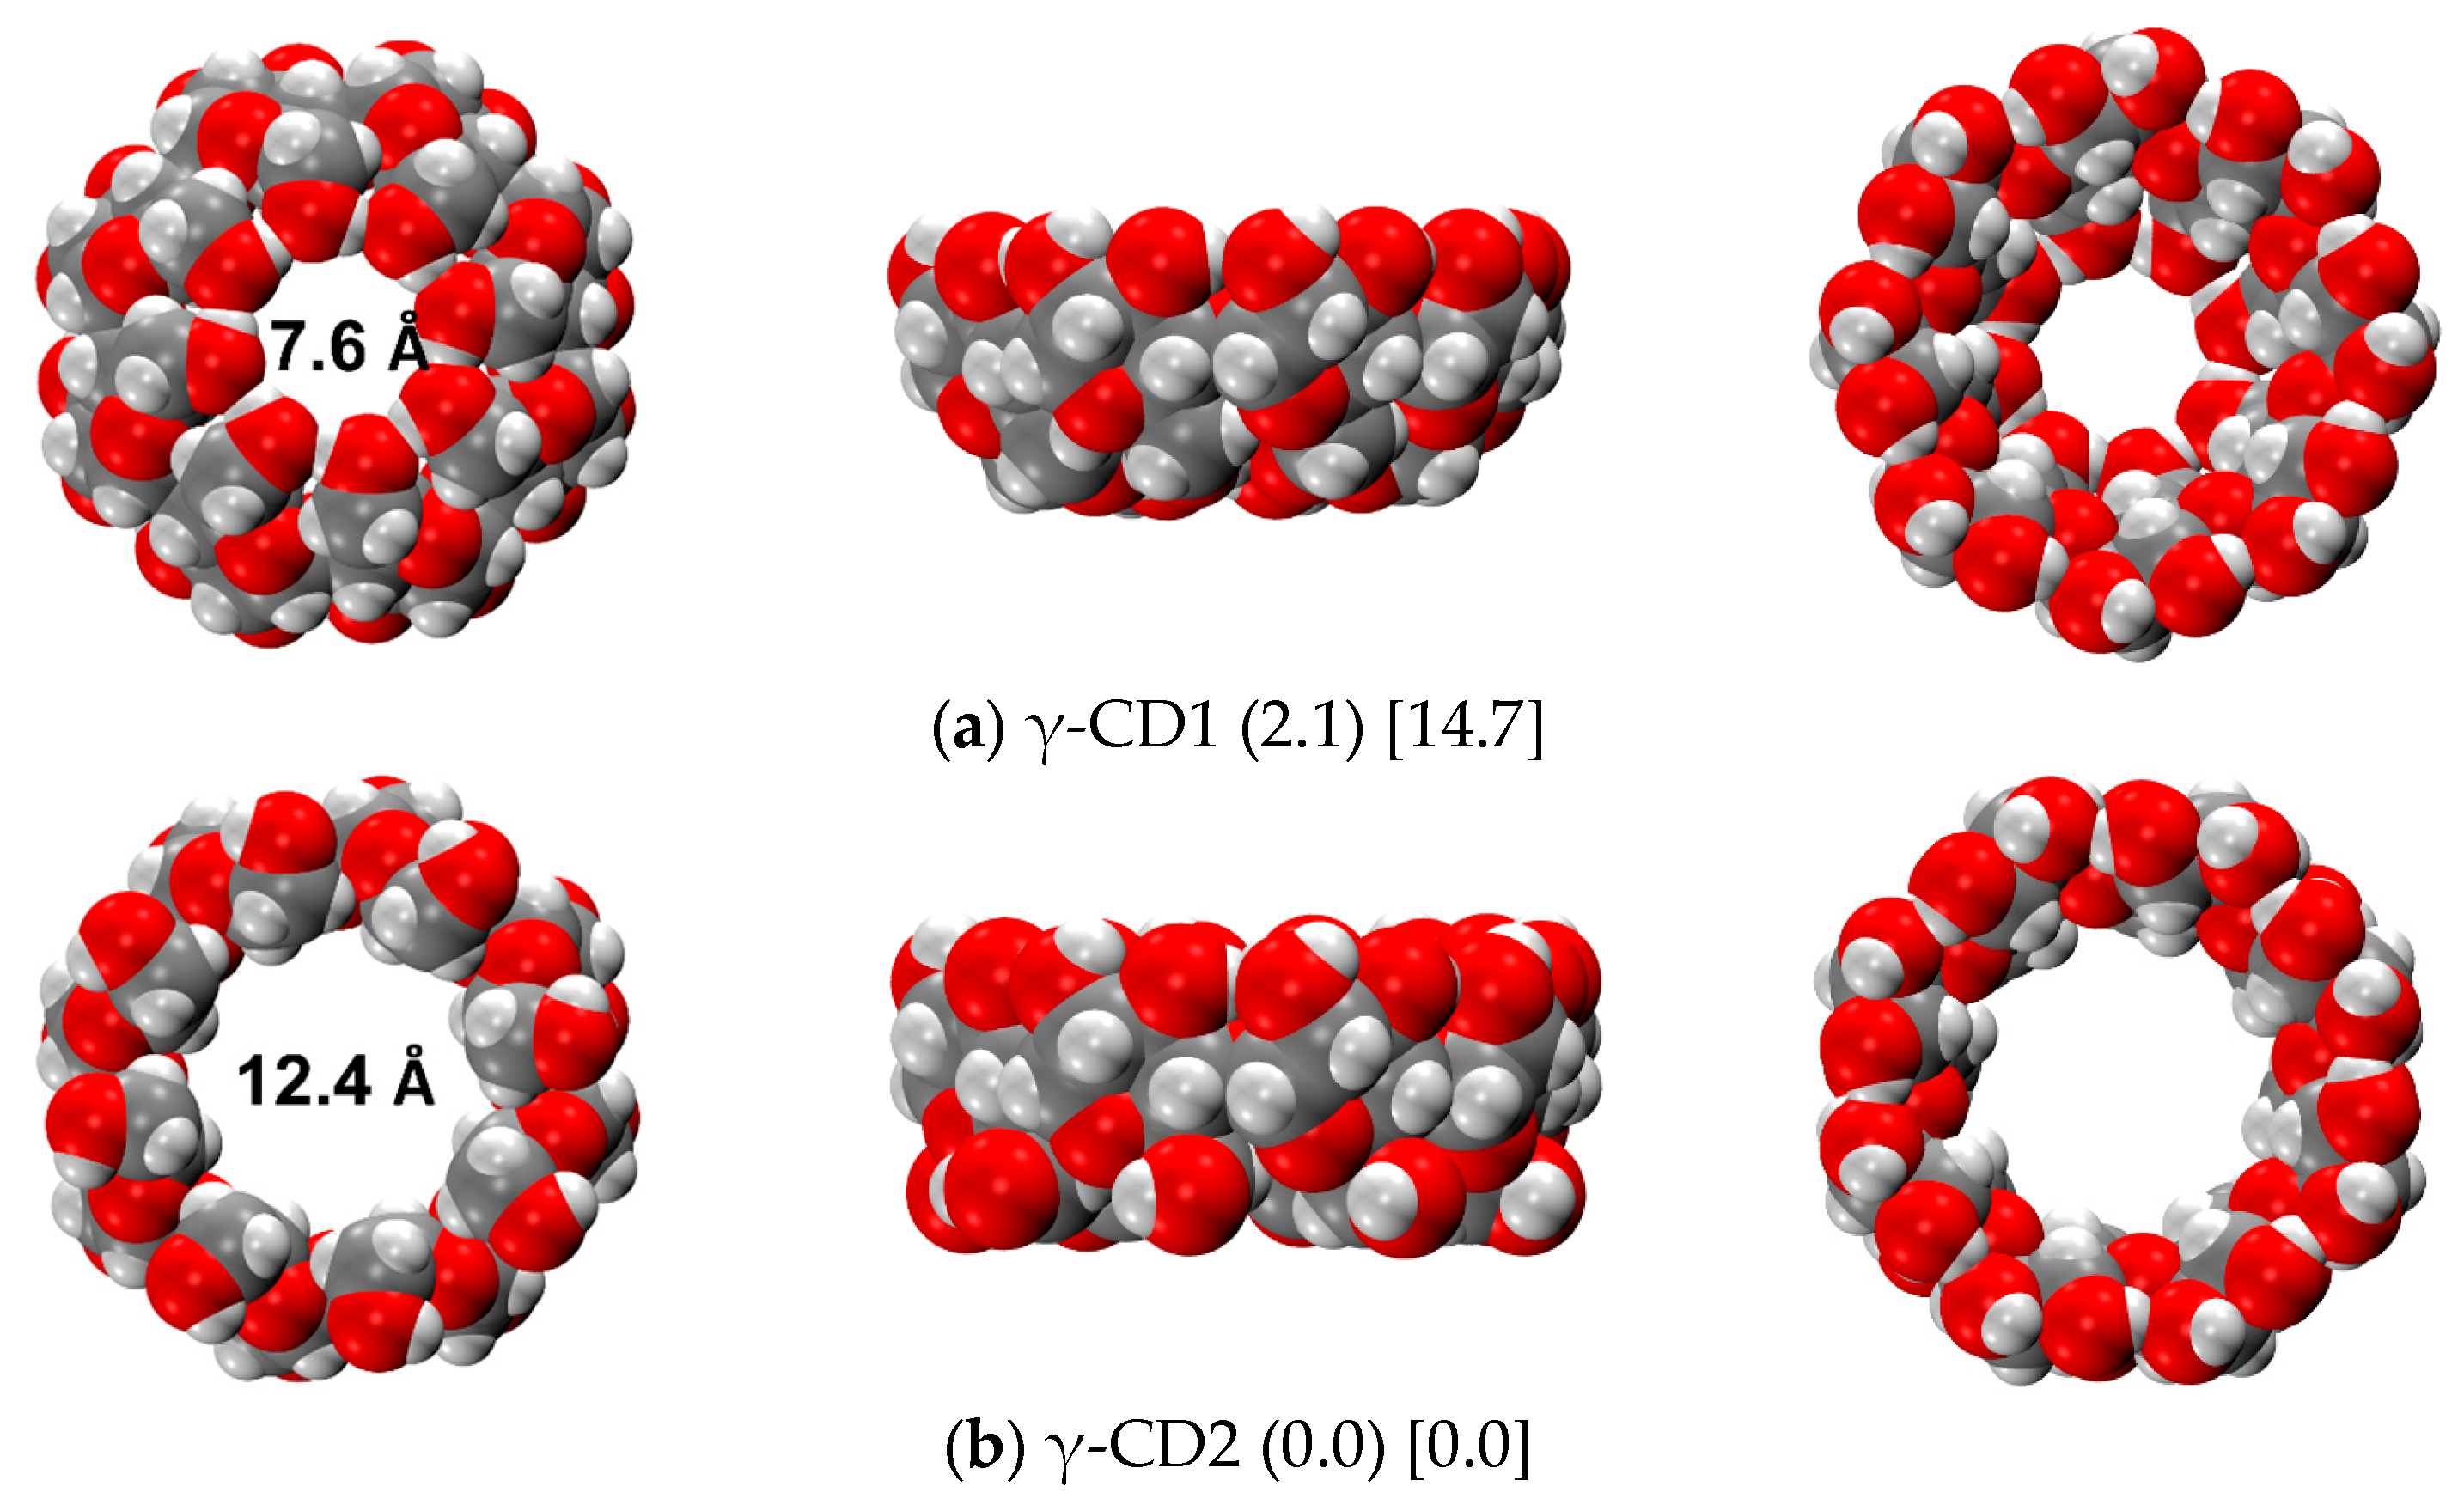
The most stable structure of γ-cyclodextrin (γ-CD) was also investigated both in the gas phase and in an aqueous medium, employing the same workflow previously discussed for the α and β-CDs. Figure 7 shows the well-known CD1 and CD2 conformations, very similar to the corresponding α and β-CDs, even if in this case CD2 is the most stable structure both in the gas phase and an aqueous medium, according to r2SCAN-3c results (while for xTB-GFN2 the most stable structure in the gas phase for all the cyclodextrins is CD1). The stability overturn of the γ-CD1 and γ-CD2 is due to the change in the H-bond pattern, particularly on the Tail side. As one can see in Figure S2, the H-bond length on the Head side decreases almost linearly from α to γ for both CD1 and CD2, while the Tail side presents an unexpected increase from β-CD1 to γ-CD1, which is indeed responsible for the minor stability of γ-CD1 with respect to the corresponding α and β-CDs.
The energetic ranking of the conformational search carried out in water is available in Table 6, as well as the solvation energies. At variance with α-CD and similar to β-CD, the conformational search in water leads to several structures with comparable energies (below 1 kcal/mol of difference), for which it is impossible to unambiguously define the most stable without performing more accurate calculations.

2.4.2. γ-CD Dimer

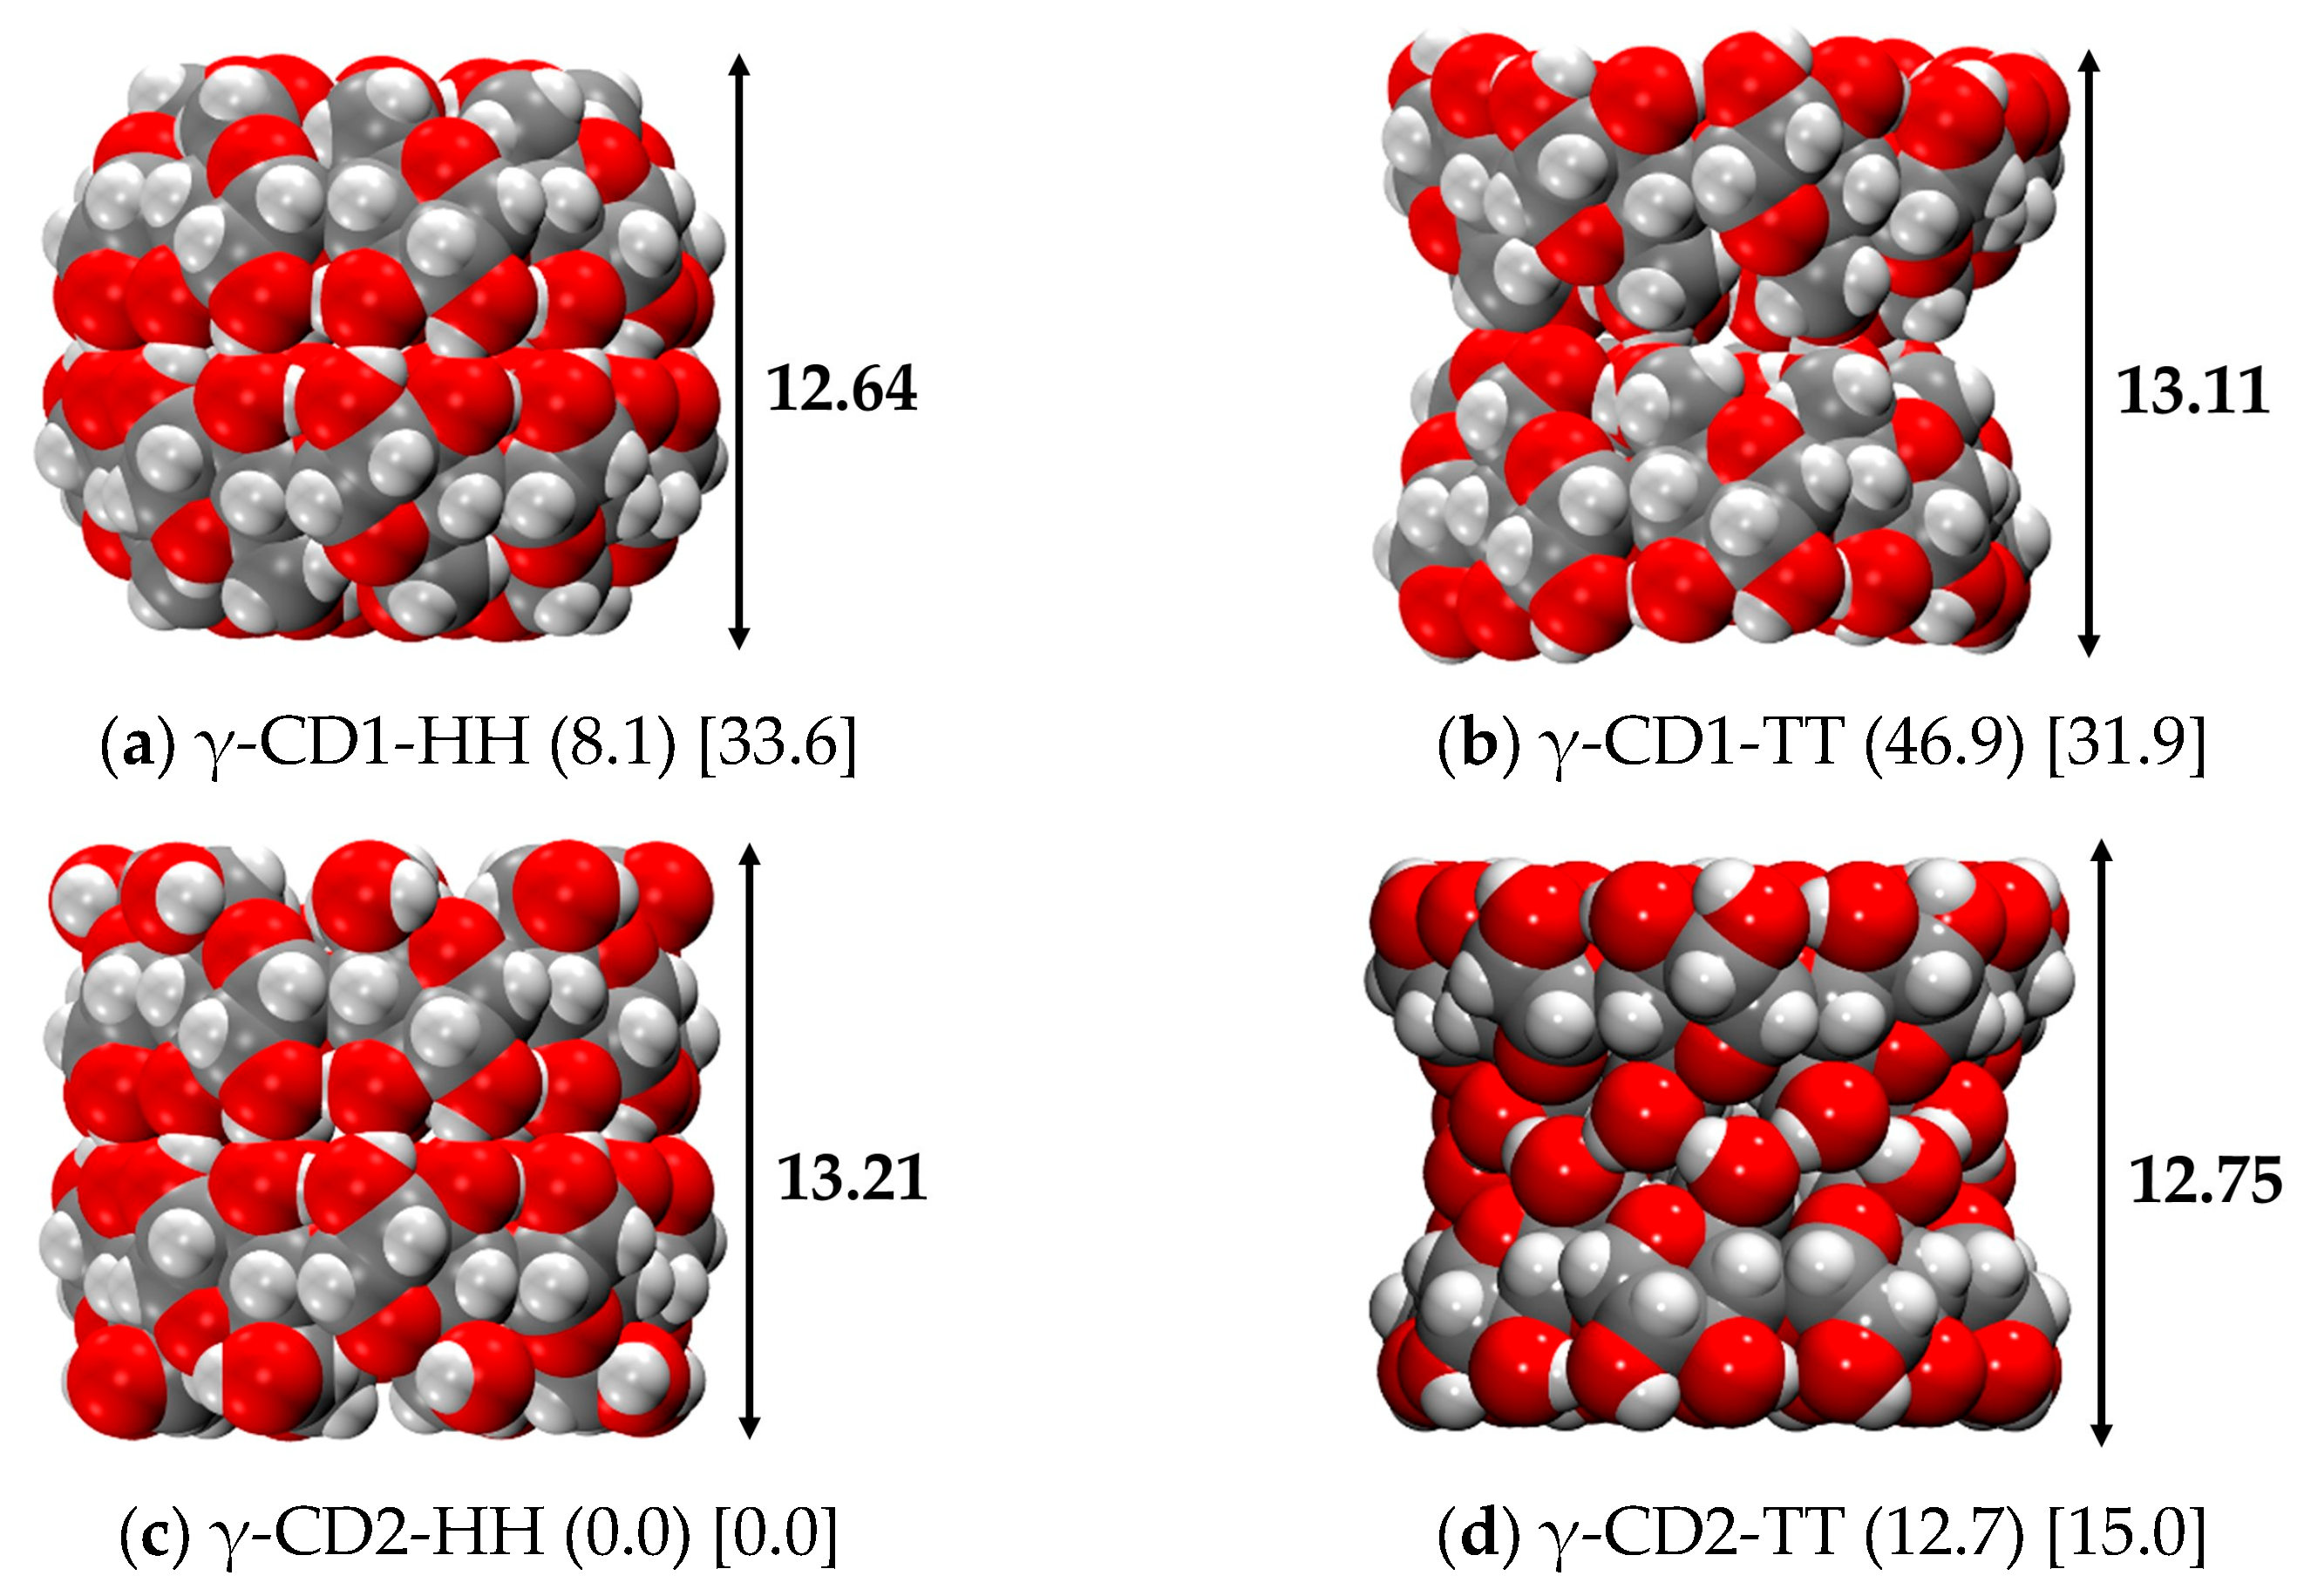
Following the same criteria used for the α- and β-CDs, the Head-Head and Tail-Tail dimers of γ-CD were built using both CD1 and CD2 as input structures, and their stability was evaluated both in the gas and aqueous phases. Figure 8 shows the structures obtained, which are very similar to those found for the α- and β-CDs: γ-CD1-HH γ-CD2-HH keep a barrel and cylindric shape, respectively, and γ-CD1-TT and γ-CD2-TT show their typical hourglass structure. As reported in Table 7, the most stable dimer of γ-CD both in the gas and water phases is γ-CD2-HH. This is not surprising, as γ-CD2 is the most stable monomer in the gas and water phases, overcoming the structural stability exerted by the strong hydrogen bond pattern on the Head side of the γ-CD1, which is less stable at 8.1 kcal/mol. The thermodynamic corrections further penalize the CD1-HH dimer, which presents a relative Gibbs free energy of 15.5 kcal/mol, and lower the dimerization energies, as already discussed for the β- and α-CDs. In the water phase, they do not affect the relative energies, but the dimerization energies further decrease, as the CD2-TT dimer has a dimerization Gibbs free energy value of −4.8 kcal/mol (versus a dimerization energy of −37.2 kcal/mol), which is only slightly negative, showing that the dimerization process is not so favored in an aqueous medium.

2.5. Cyclodextrin IR-Spectra

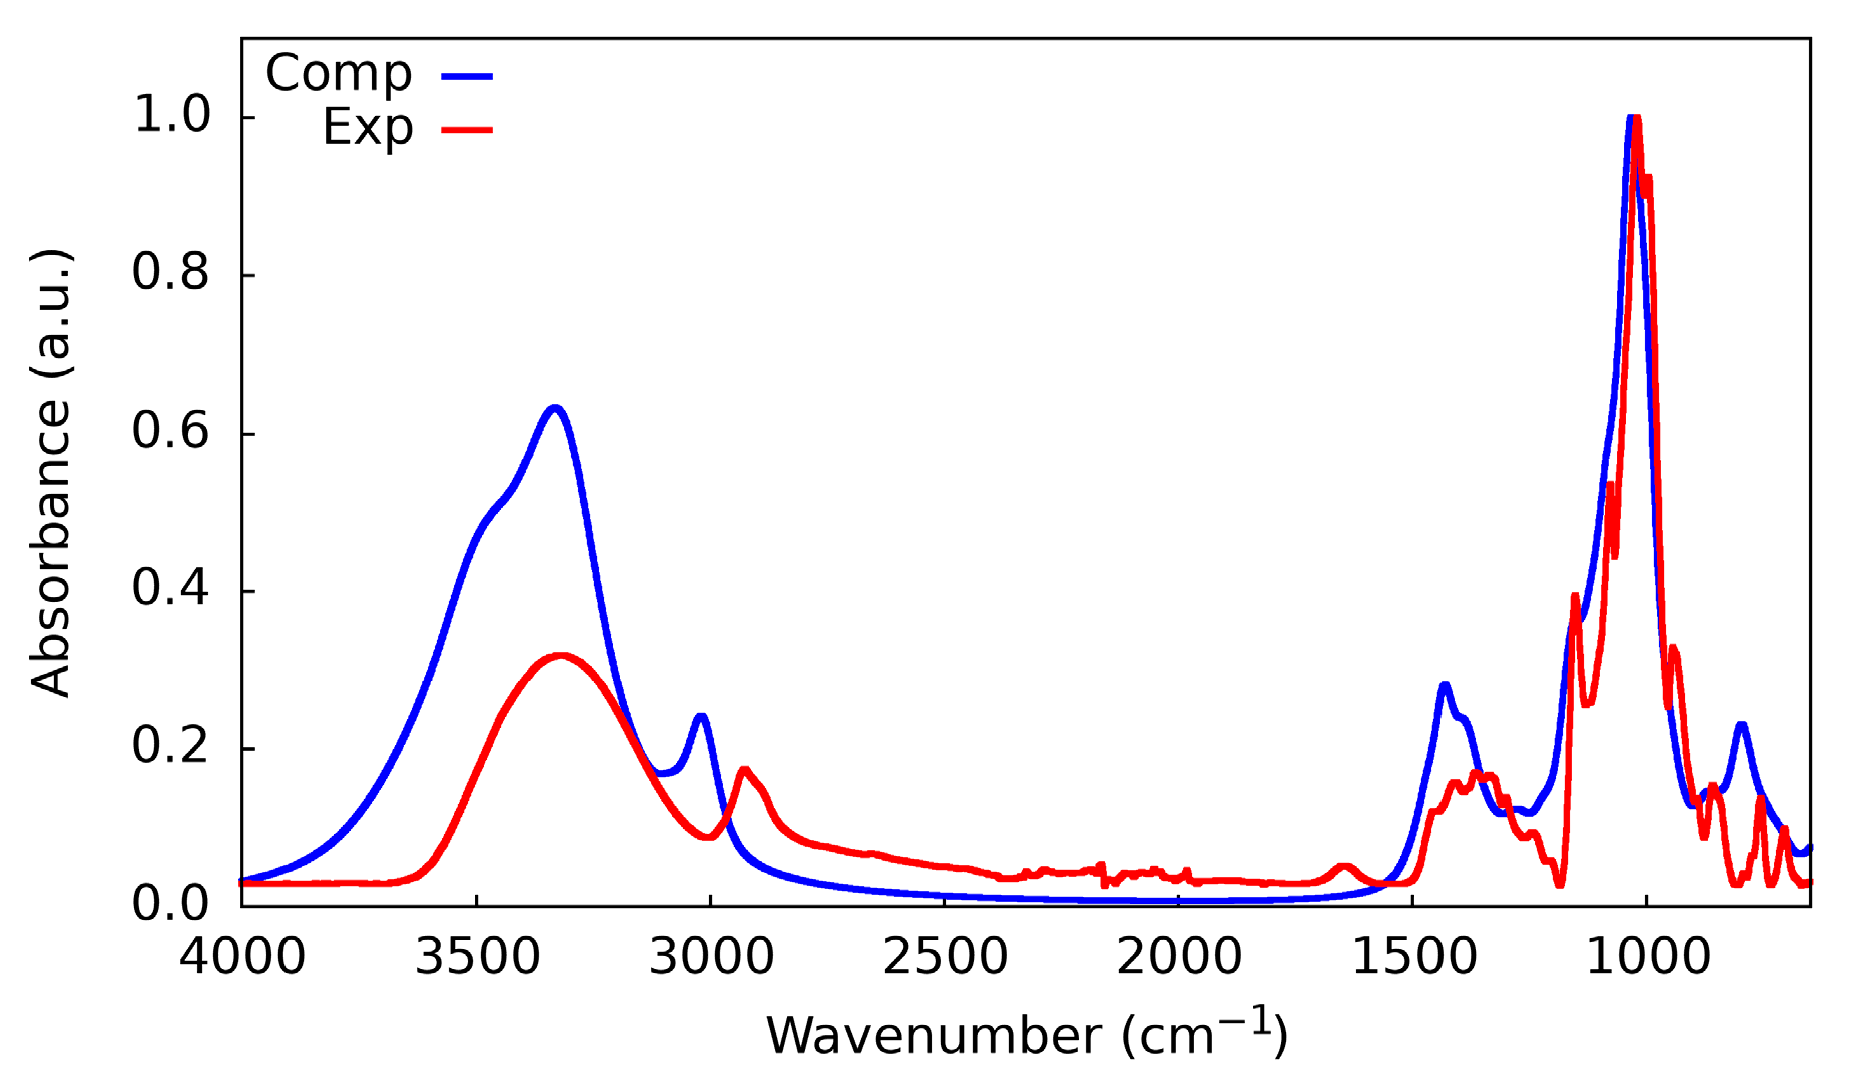
The experimental IR spectrum of β-cyclodextrin was recorded in order to compare it with the simulated spectrum of the crystal structure calculated at the r2SCAN-D3BJ/def2-TZVP(gCP) level of theory (see Figure 9 and Supporting Information for experimental details). In the Supporting Information, we have reported a comparison among the experimental spectra of α-, β-, and γ-CD, while here we discuss only that of β-CD (see Figure S3).
The experimental spectrum presents a broad band from 3000 to 3600 cm−1 due to the presence of many chemically different -OH bonds, as they can act as H-bond donors, H-bond acceptors, or free -OH. At approximately 3000 cm−1, there is the signal of the C-H bond stretching, coupled to the band from 1300 to 1450 cm−1 which corresponds to the bending of the same group. In the fingerprint region, it is possible to distinguish a narrow and intense peak at 1050–1100 cm−1, belonging to the C-C stretching. The match between simulation and experiment is good, especially in the fingerprint region, until 1500 cm−1; at higher wavenumbers, a red shift of the peaks is observed, mainly due to the anharmonic effects of the vibration of H-bearing moieties, which are not accounted for in the simulation. Apart from the last expected difference, the simulated IR spectrum shows that the r2SCAN is an accurate functional even in describing delicate properties such as vibrational frequencies and, even more, IR intensities.

2.6. Explicit Solvation

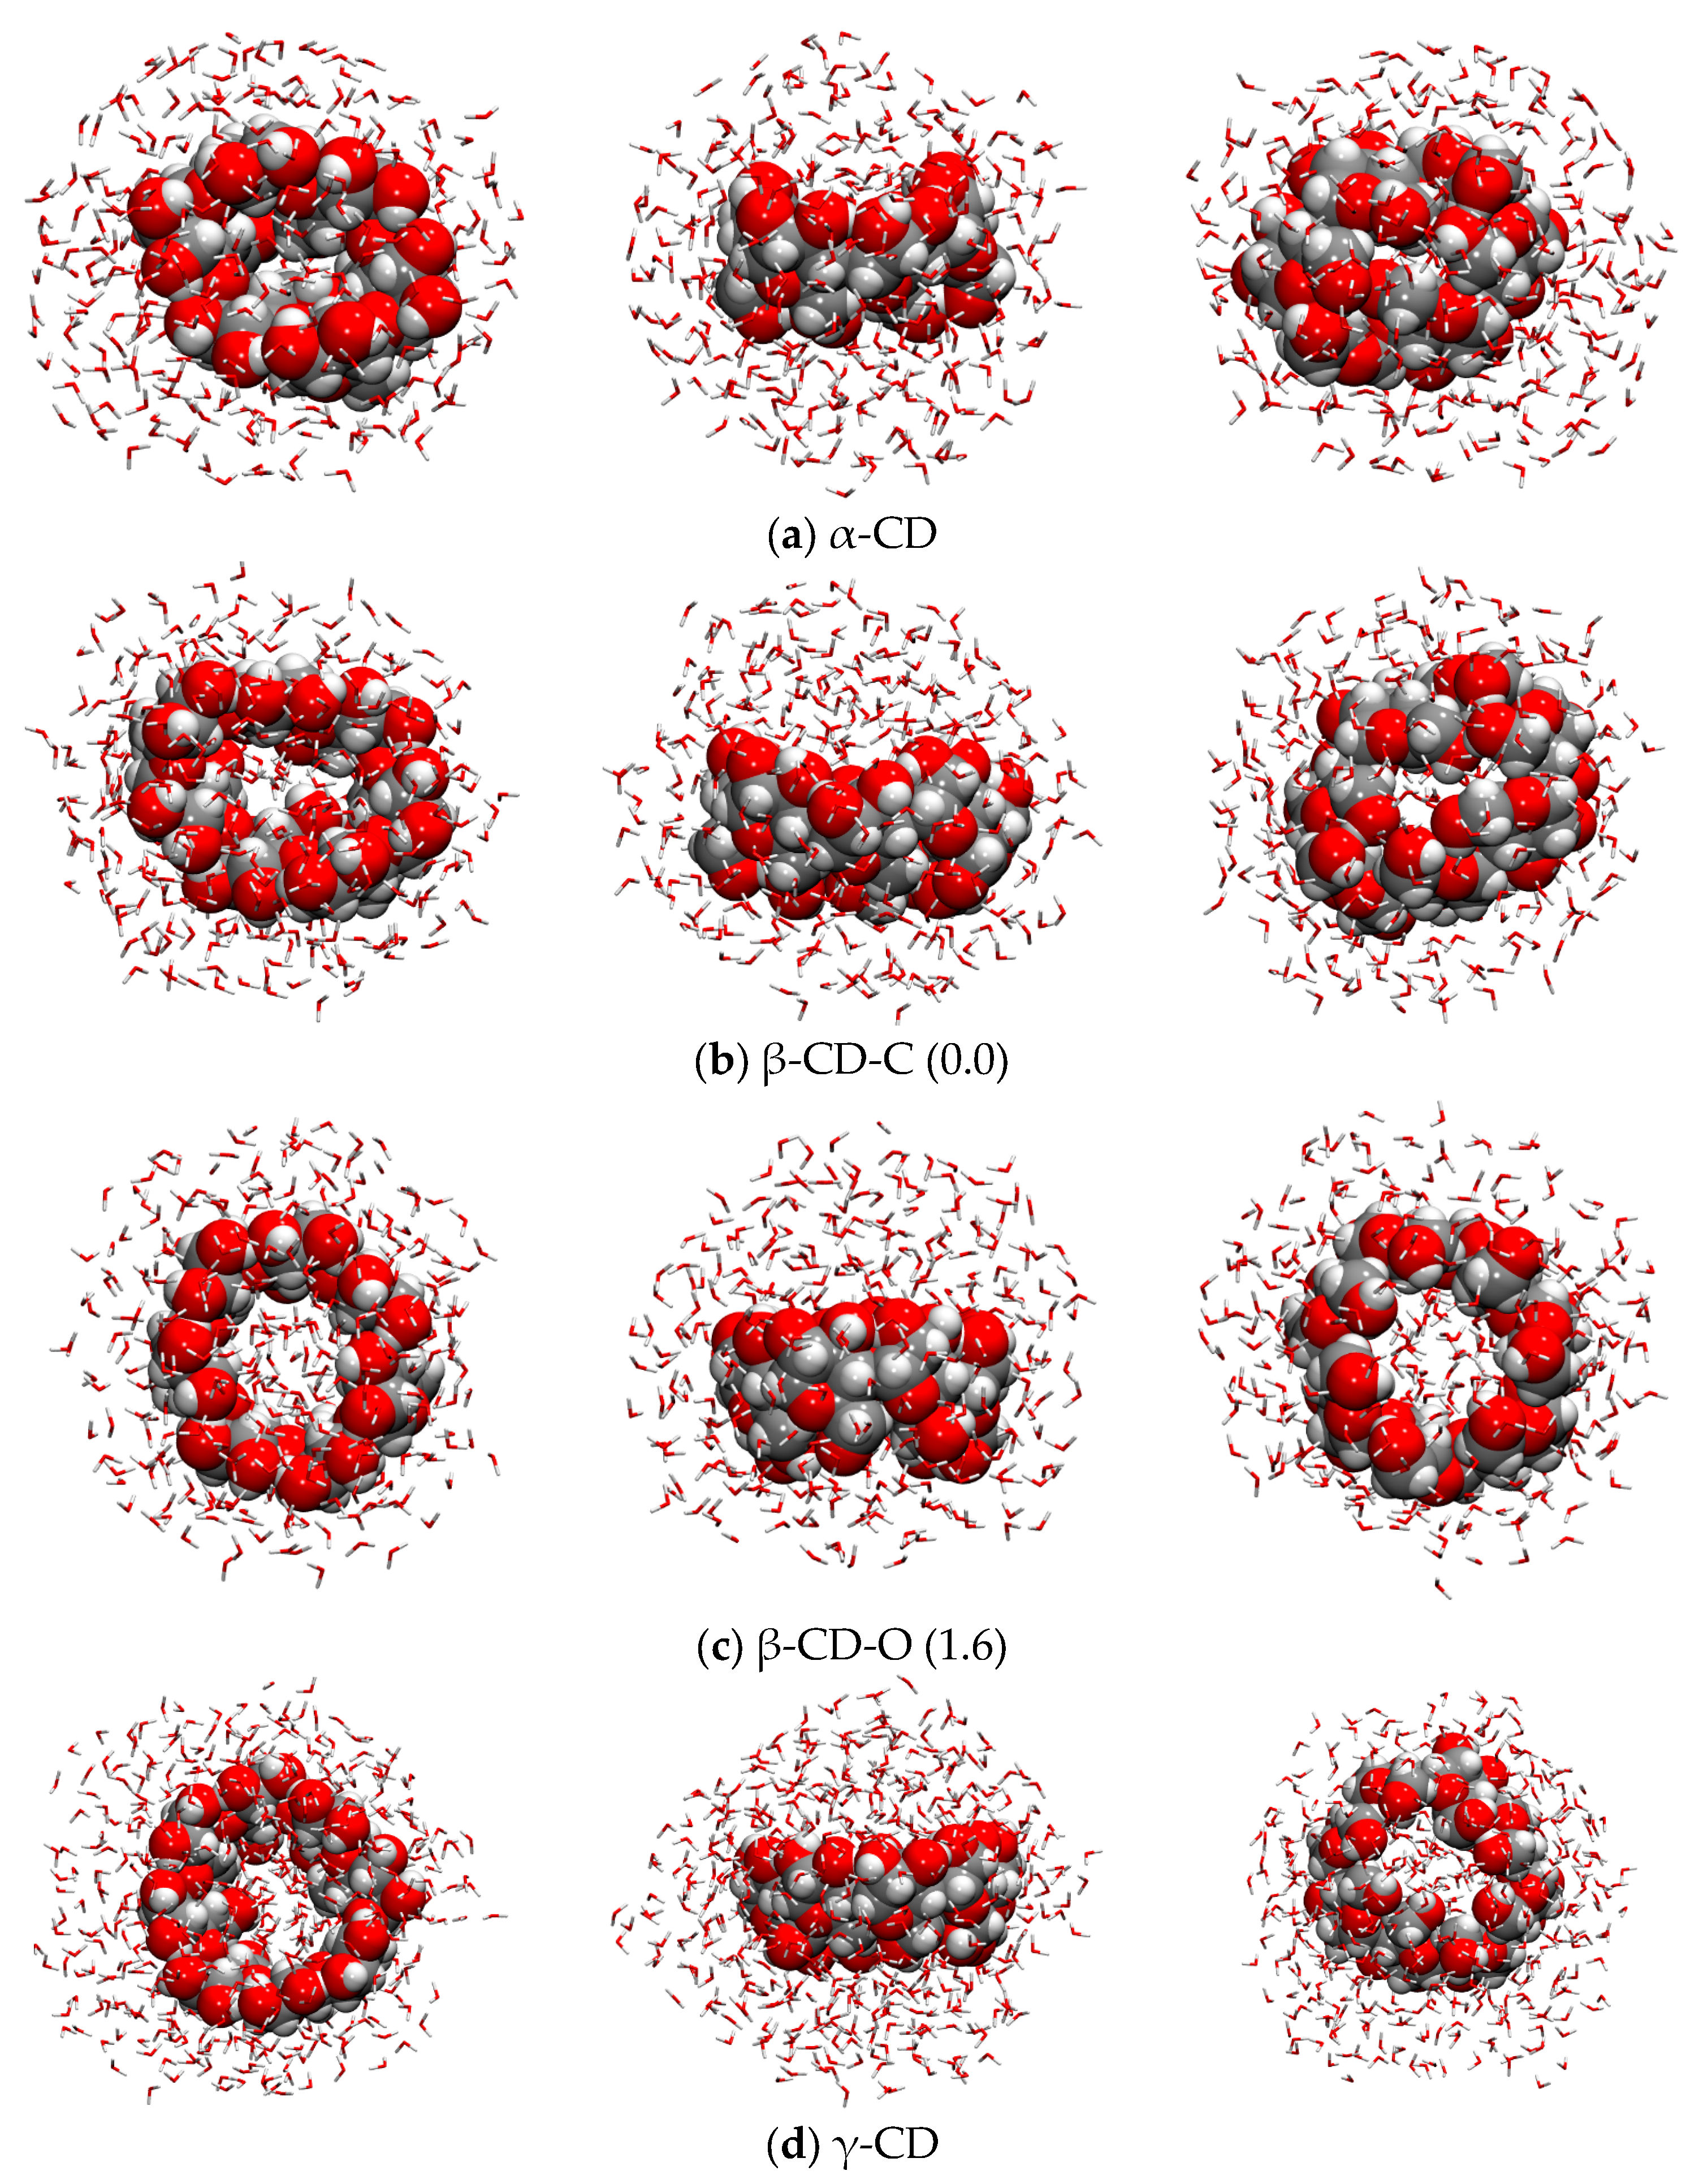
Explicit solvation was modeled throughout the QCG submodule of the CREST code. The starting structure for all the CDs was the most stable conformer in the gas phase, i.e., the closed conformation (CD1); for the water solvation shell, 300 water molecules were used for the α- and β-CDs, and this number was increased to 450 for γ-CD, in order to obtain at least a first complete solvation sphere. Not surprisingly, the explicit solvent is able to break the interactions among the -CH2OH groups on the Tail side, thus opening the ring (see Figure 10), which the implicit solvent cannot do. This is a further confirmation that, even if for some properties the implicit model may be enough to have an accurate description of the system, structural effects play a prominent role, particularly when the interactions between the solute and solvent are strong, as in the case of H-bonded systems.
From Figure 10, it is evident that the explicit solvation not only opens the cyclodextrins but also distorts them much more than the implicit solvent for what concerns the dihedral angles of the glycosidic units, thus losing their characteristic shape of a truncated cone. In the case of the β-CD, two stable conformers were found, in equilibrium between an open and a closed structure. The closed structure (β-CD-C, see Figure 10b) is the most stable, with the β-CD-O being 1.6 kcal/mol higher in energy. The decomposition energy performed on these systems, shown in Table S5, reveals that both the CDs and the water clusters of β-CD-O are much less stable with respect to β-CD-C ( E r e l C D = 18.7 and E r e l H 2 O = 26.9 kcal/mol); however, β-CD-O presents a stronger interaction energy ( E i n t e x p l (β-CD-O) = −362.3 and E i n t e x p l (β-CD-C) = −406.3 kcal/mol) that counterbalances the lower stability of the two fragments. The small global energetic difference (1.6 kcal/mol) is due to the displacement of the enclosed water molecules which undergo unfavorable free energy with respect to the bulk water, and the value is consistent with previous calculations present in the literature (0.99 kcal/mol) [39]. This flip-flop movement of glycosidic units is believed to play a fundamental role in the complexation/release mechanisms of drugs [51].
Regarding the other cyclodextrins, for both the α- and γ-CDs, only one conformer with a non-negligible Boltzmann distribution was found (see Figure 10a,d). The α-CD (see Figure 10a) presents a completely closed conformation on the Tail side of the cavity, thus making the inclusion of a drug very difficult, and this is a possible explanation for the low usage of this specific cyclodextrin. On the contrary, γ-CD (Figure 10d) shows an open conformation on both the Head and Tail sides in which many water molecules are free to enter. It is possible that the inclusion of drug molecules is hindered in both the α- and γ-CDs because of their too-closed and open structure, respectively, while, in the case of the β-CD, the two equilibriums closed/open conformers allow for control of the inclusion/release of the drug of interest.
In Table 8, the data on implicit and explicit solvation are reported. They quantitatively converge only for the α- and β-CDs, whose implicit solvation energies are −37.9 and −49.5 kcal/mol, and explicit are −36.8 and −48.9/−41.5 (depending on the conformer), respectively. For γ-CD, the implicit solvation energy is −64.5 kcal/mol, while the explicit one is −190.5 kcal/mol, but the trend in the water affinity is kept, i.e., γ-CD > β-CD > α-CD. However, this does not correspond to the experimental evidence, i.e., that β-CD is almost insoluble (18.5 mg/L) while α- and γ-CDs dissolve much more (145 and 232 mg/L). Only in the case of normalizing the solvation energy for the solvent-accessible surface area (SASA), does the β-CD-O become less soluble than the α-CD. Probably, the relatively small complexity of these models is not enough to describe such a complex macroscopic property as the solubility, as one should also consider the possible presence of CD aggregates, thus exponentially increasing the number of atoms of the model. From Table 8, it is clear that the deformation energies can give important information: the deformation of the CDs is in a narrow energetic range (60–80 kcal/mol), while the deformation of the water cluster changes a lot depending on the CD (from 100 to 250 kcal/mol), and this is a confirmation that solvent molecules do play the most important role in determining the solubility and the conformation of a specific CD.

3. Materials and Methods

3.1. Computational Codes and Associated Parameters

3.1.1. Conformational Search: xTB

Simulations with the xTB code (extended Tight-Binding) (v. 6.4.0) were carried out at the semiempirical level of theory using GFN2 [63], and at the force-field level using GFN-FF [64]. GFN2 is a generally applicable semiempirical method, which means that within a quantum mechanical scheme, some integrals are neglected and/or parametrized, thus reducing the cost of the calculation with respect to DFT by several orders of magnitude. GFN-FF, as the name suggests, is not based on quantum mechanics; in this case, only classical equations must be solved, which renders these methods much cheaper than semiempirical ones. Moreover, both GFN2 and GFN-FF include the self-consistent D4 dispersion model [65], which is useful for including dispersive interactions. The considered systems are very flexible and, in order to explore their potential energy surface, thus finding the most stable conformers, the submodule CREST (Conformer-Rotamer Ensemble Sampling Tool, v. 2.12) [66] was used at its default settings (energy convergence Econv = 5 × 10⁻⁶ hartree, gradient convergence Gconv = 1 × 10⁻³ hartree·bohr−1, accuracy for integral cutoffs and SCF criteria = 1.0). To avoid non-physical deformations of the cyclodextrin and to save computing time, all the atoms belonging to the carbonaceous skeletons of CDs were fixed to their starting position, thus not including them in the conformational exploration. In the specific, only the moieties bound to the carbon atoms highlighted in Figure 1, i.e., the hydroxyl groups (bound to C2 and C3) and the hydroxymethyl group (bound to C5) are free to rotate. The structures obtained by CREST in the range of 6 kcal/mol (this is the default, all the structures above this threshold are not considered), i.e., those from the output file named crest_conformers.xyz, were then re-optimized at the GFN2 level using tighter thresholds to improve the accuracy of the calculations for energy convergence Econv = 1 × 10⁻⁷ and gradient convergence Gconv = 2 × 10⁴ (program setting: -acc 0.01). The simulations were also carried out in water, using the Analytical Linearized Poisson-Boltzmann implicit solvation model (ALPB) [67], which is parametrized for both GFN2-XTB and GFN-FF. Furthermore, the most stable cyclodextrin structures in the gas phase were treated with explicit solvation using the submodule QCG [68], which includes a docking algorithm [69] that adds water molecules, one by one, in a reasonable starting position, followed by a geometry optimization. The procedure is reiterated until the desired number of water molecules is reached. Then, the CREST program is automatically called to explore the potential energy surface of the final structure, thus finding an ensemble of the most representative low-lying energy structures, on which one can perform some statistics or refine using DFT.

3.1.2. DFT Refinement: ORCA

The lowest-energy structures (within 2 kcal/mol) obtained with the xTB code (i.e., after the CREST procedure and the subsequent xTB-GFN2 optimization with tighter thresholds) were re-optimized with DFT-based methods at different levels of theory using the ORCA (v. 5.0.4) package. Two different composite DFT functionals were used: B97-3c [70] and r2SCAN-3c [71]. These functionals consist of a large basis set (def2-TZVP) [72] modified to optimize the efficiency of the calculations, and including some a-posteriori corrections: the short-range basis set incompleteness SRB (only for B97-3c), the geometrical counterpoise gCP [73] (only for r2SCAN-3c), and the dispersion correction (D3-BJ [74,75] and D4 [65], respectively, for B97-3c and r2SCAN-3c). The DFT formalism is very similar to the Hartree-Fock (HF), however, it is based on electron density, thus avoiding the large complexity of the wavefunction, thereby reaching a better accuracy than HF but at a reduced computational cost.
Three double-hybrid DFT functionals were also used to test for helping the choice between the two above-mentioned pure DFT functionals: B2PLYP [76], DSD-BLYP [77], and DSD-PBEP86 [78] (DSD stands for Dispersion corrected Spin-component Double-hybrid), coupled with a high-quality def2-QZVPP basis set [72] and D3-BJ dispersion correction [74,75]. These functionals include part of the HF formalism and the MP2 correction (one of the so-called post-HF methods), with the aim of bringing together the best features of the DFT, HF, and post-HF methodologies, but with a higher computational cost. They were chosen according to a paper by Goerigk et al. [62], which demonstrated that they were the most reliable for calculating energetic differences among conformers, thanks to an extensive benchmark on the GMTKN55 database. The double-hybrid functionals were used to test the accuracy of the cost-effective B97-3c and r2SCAN-3c. Since r2SCAN-3c showed better performances than B97-3c, we employed it for the QM calculations of all cyclodextrins we studied.
The self-consistent field (SCF) iterative procedure was converged to a tolerance in total energy of ∆E = 1 × 10⁻⁸ a.u. (default for geometry optimization). The thresholds on geometry optimizations were set to 1 × 10⁻⁸ a.u. on the energy difference from two subsequent steps, 3 × 10⁻⁵ and 1 × 10⁻⁴ hartree Bohr−1 on the Root Mean Square (RMS) and maximum gradients, and 6 × 10⁻⁴ and 1 × 10⁻³ Bohr on the RMS and maximum displacements, respectively. All the structures were also optimized in water using the C-PCM (Conductor-like Polarizable Continuum Model) implicit solvation model [79,80] (see Table S3 for comparison with different implicit solvation models). Vibrational frequencies were calculated analytically (only on the structures within a 1 kcal/mol range) to ensure that the structures are minima on the PES (i.e., all real frequencies), to include thermodynamic corrections to the electronic energy, and to simulate IR spectra.

3.1.3. Periodic Simulations: CRYSTAL

Calculations on the crystal structure of β-cyclodextrin were carried out with the last public version of the CRYSTAL code, i.e., CRYSTAL23 [81,82]. Since the r2SCAN-3c method has not been implemented in this code yet, we have used the r2SCAN [83] functional coupled with a def2-TZVP basis set (which is the starting basis set modified for r2SCAN-3c), and with similar a-posteriori corrections with respect to the r2SCAN-3c, thus maintaining the same level of accuracy of molecular calculations. Specifically, we applied the gCP (geometrical counterpoise) to the selected basis set [73], and the D3-BJ (Becke-Johnson) dispersion correction [74,75]. A careful check of the r2SCAN-D3BJ/def2-TZVP(gCP) vs. r2SCAN-3c is available in the Supporting Information. For the numerical integration-correlation term of all calculations of exchange, 75 radial points and 947 angular points (XLGRID) in a Lebedev scheme in the region of chemical interest were adopted. The Pack-Monkhorst/Gilat shrinking factors for the reciprocal space were set to 2 [84]. Tolerances of the integral calculations for Coulomb overlap and Coulomb penetration were increased to 10−7 hartree (10−6 hartree is the default). The SCF iterative procedure was converged to a tolerance in total energy of ∆E = 1 × 10⁻⁷ hartree for geometry optimization and ∆E = 1 × 10⁻¹¹ hartree for frequency calculations. Both the cell parameters and atomic positions were set free to relax during the geometry optimization procedure, whose thresholds on gradients and displacements were set to the default values (3 × 10⁻⁴ hartree bohr−1 and 1.2 × 10⁻³ bohr, respectively). Vibrational frequencies, referred to as the Γ point, were calculated on the optimized geometry by means of a mass-weighted Hessian matrix, which is obtained by the numerical differentiation of the analytical first derivatives [85,86]. The Berry phase approach was applied to calculate intensities in the simulation of IR spectra [87]. The full width at half maximum of the OH stretching band was chosen according to the red shift with respect to free silanols in the isolated β-CD molecule, as proposed by Pimentel and coworkers [88].
Structure editing and visualization were performed using the MOLDRAW (v. 2.0) [89] and Gaussview (v. 6) [90] programs, while figure rendering was performed using the VMD software (v. 1.9.3) [91].

3.1.4. Reference Equations for Computing the Energetic Contributions

The relative energies presented in the Tables are calculated as:
E r e l = E n E 0
where En is the electronic energy of the nth conformer, and E0 is the electronic energy of the most stable conformer (that may change according to the level of theory, or if the calculation is carried out in gas or liquid phase). Similarly, the dimerization energies are calculated as:
E d i m = E d i m e r E 0
where Edimer is the electronic energy of the cyclodextrin dimer, and E0 is the electronic energy of the most stable conformer of the monomer. Solvation energies in implicit water were calculated as:
E s o l v P C M = E C P C M E g p
where ECPCM is the absolute electronic energy in implicit solvation (vide infra), and Egp is the absolute energy at the same level of theory in the gas phase. The cohesive energy of the crystal structure was calculated according to the following equation:
E c o h e s i v = E c r y 2 E G P 2
where Ecry and Egp are the absolute electronic energies of the crystal structure and the isolated molecule in the gas phase, respectively, while the normalization factor is due to the number of molecules composing the crystal structure. The solvation energies in explicit water are computed as follows:
E s o l v e x p l = E w C D E C D + E H 2 O
where E w C D is the electronic energy of the complex at the r2SCAN-3c level, calculated on the GFN2 optimized geometry, ECD is the electronic energy of the most stable structure in the gas phase, and E H 2 O is the electronic energy of a cluster containing 300 (for α- and β-CD) or 450 (for γ-CD) water molecules, on which a conformational search was performed at a semiempirical level in order to find the most stable structure (vide infra). The deformation energies on both the CD and the water cluster were calculated as:
E d e f C D = E C D / / w C D E C D
E d e f H 2 O = E H 2 O / / w C D E H 2 O
where E C D / / w C D is the electronic energy of the CD only in the gas phase at the geometry of the complex in explicit solvation, E C D is the electronic energy of the most stable structure of the cyclodextrin in the gas phase (the same as in the previous equation), E H 2 O / / w C D is the electronic energy of the water cluster at the geometry of the complex in explicit solvation after removing the CD molecule, and E H 2 O is the electronic energy of the water cluster (containing 300 and 450 water molecules).

4. Conclusions

In this work, we have studied the conformations of α-, β-, and γ-cyclodextrins in the gas phase and water environment by means of combined semiempirical and DFT computational approaches. Specifically, the xTB-GFN2 semiempirical method was applied in joint with an automatic tool (CREST) capable of exploring the potential energy surface of a given molecule throughout iterative cycles of metadynamics. The structures found by xTB were then refined at the r2SCAN-3c level, which was in turn benchmarked against several double-hybrid functionals coupled with a high-quality def2-QZVPP basis set. Moreover, we have utilized the QCG tool to automatically solvate the three cyclodextrins, followed by the CREST procedure, in order to obtain the most stable structure among the possible conformers. The dimers of the three cyclodextrins were modeled and optimized as well, to study their tendency to form aggregates and, following a rationale of increasing complexity, we considered the crystal structure with the aim of reproducing the experimental IR spectrum registered in our laboratories.
Our results show that α- and β-cyclodextrins prefer the closed conformation in the gas phase and the open one in implicit water, while the open conformation of γ-cyclodextrin is the most stable one in both cases. The dimers also follow the same tendency as that of the monomers. When water is treated explicitly, it strongly affects the CD structure, which appears much more distorted compared to the gas phase and the implicit solvation. Curiously, for the β-cyclodextrin we have found two structures very close in energy that were also discovered in previous works in the literature, which can be distinguished because of their open and closed cavity. In this specific case, one of the α-D-glucopyranose rings is responsible for opening and closing the cavity with a sort of flip-flop mechanism (see Figure 10), which seems to be the main driving force of moving the water molecules inside and outside the cavity and, as a consequence, of the complexation/release of the drug molecule. Finally, the comparison between the experimental and computed IR spectra is good, considering that the computed one does not take into account the anharmonic effects. This indicates that the r2SCAN is very robust both against more accurate DFT functionals and from an experimental point of view, so it can also be used for more complex systems, such as the study of the complexation/release mechanism that is currently ongoing in our laboratories.
Overall, we provide a cost-effective methodology for future works, either in our laboratories or performed by someone else on similar systems, to explore, in a fast but reliable way, the conformational complexity of flexible systems and to properly refine results with a cheap but accurate DFT method applicable to medium-sized systems.

Supplementary Materials

The following supporting information can be downloaded at: https://www.mdpi.com/article/10.3390/ijms242316826/s1.

Author Contributions

Conceptualization, V.B. and M.C.; Methodology, S.P., C.I.G. and R.F.; Software, S.P.; Validation, V.B. and M.C.; Formal analysis, S.P. and R.F.; Investigation, S.P., C.I.G. and R.F.; Data curation, S.P. and C.I.G.; Writing—original draft, S.P. and R.F.; Writing—review & editing, M.C.; Supervision, V.B. and M.C.; Project administration, M.C. All authors have read and agreed to the published version of the manuscript.

Funding

This work has been partially supported by the Spoke 7 “Materials and Molecular Sciences” of ICSC–Centro Nazionale di Ricerca in High-Performance Computing, Big Data and Quantum Computing, funded by the European Union–NextGenerationEU (PNRR, CN1-SPOKE 7 Materials and Molecular Sciences CUP D13C22001340001-CN00000013). R.F. is indebted to MUR for his PhD grant PON DM1061.

Data Availability Statement

Data is contained within the article and Supplementary Materials.

Acknowledgments

M.C., S.P. and R.F. would like to acknowledge Piero Ugliengo, Department of Chemistry of the University of Turin, Italy, for fruitful discussion. The authors acknowledge also support from Project CH4.0 under the MUR program “Dipartimenti di Eccellenza 2023–2027” (CUP: D13C22003520001).

Conflicts of Interest

The authors declare no conflict of interest.

References

  1. Crini, G. Review: A History of Cyclodextrins. Chem. Rev. 2014, 114, 10940–10975. [Google Scholar] [CrossRef] [PubMed]
  2. Szejtli, J. Introduction and General Overview of Cyclodextrin Chemistry. Chem. Rev. 1998, 90, 1743–1753. [Google Scholar] [CrossRef] [PubMed]
  3. Jansook, P.; Ogawa, N.; Loftsson, T. Cyclodextrins: Structure, Physicochemical Properties and Pharmaceutical Applications. Int. J. Pharm. 2018, 535, 272–284. [Google Scholar] [CrossRef] [PubMed]
  4. Larsen, K.L. Large Cyclodextrins. J. Incl. Phenom. Macrocycl. Chem. 2002, 43, 1–13. [Google Scholar] [CrossRef]
  5. Braga, S.S. Cyclodextrin Superstructures for Drug Delivery. J. Drug. Deliv. Sci. Technol. 2022, 75, 103650. [Google Scholar] [CrossRef]
  6. del Valle, E.M.M. Cyclodextrins and Their Uses: A Review. Process Biochem. 2004, 39, 1033–1046. [Google Scholar] [CrossRef]
  7. Trotta, F.; Zanetti, M.; Cavalli, R. Cyclodextrin-Based Nanosponges as Drug Carriers. Beilstein J. Org. Chem. 2012, 8, 2091–2099. [Google Scholar] [CrossRef]
  8. Krabicová, I.; Appleton, S.L.; Tannous, M.; Hoti, G.; Caldera, F.; Pedrazzo, A.R.; Cecone, C.; Cavalli, R.; Trotta, F. History of Cyclodextrin Nanosponges. Polymers 2020, 12, 1122. [Google Scholar] [CrossRef]
  9. Mori, T.; Tsuchiya, R.; Doi, M.; Nagatani, N.; Tanaka, T. Solubilization of Ultraviolet Absorbers by Cyclodextrin and Their Potential Application in Cosmetics. J. Incl. Phenom. Macrocycl. Chem. 2019, 93, 91–96. [Google Scholar] [CrossRef]
  10. Giovannelli, L.; Milanesi, A.; Ugazio, E.; Fracchia, L.; Segale, L. Effect of Methyl–β–Cyclodextrin and Trehalose on the Freeze–Drying and Spray–Drying of Sericin for Cosmetic Purposes. Pharmaceuticals 2021, 14, 262. [Google Scholar] [CrossRef]
  11. Dubey, S.K.; Dey, A.; Singhvi, G.; Pandey, M.M.; Singh, V.; Kesharwani, P. Emerging Trends of Nanotechnology in Advanced Cosmetics. Colloids Surf. B 2022, 214, 112440. [Google Scholar] [CrossRef] [PubMed]
  12. Liu, Y.; Chen, Y.; Gao, X.; Fu, J.; Hu, L. Application of Cyclodextrin in Food Industry. Crit. Rev. Food Sci. Nutr. 2022, 62, 2627–2640. [Google Scholar] [CrossRef] [PubMed]
  13. Tian, B.; Xiao, D.; Hei, T.; Ping, R.; Hua, S.; Liu, J. The Application and Prospects of Cyclodextrin Inclusion Complexes and Polymers in the Food Industry: A Review. Polym. Int. 2020, 69, 597–603. [Google Scholar] [CrossRef]
  14. Morin-Crini, N.; Fourmentin, S.; Fenyvesi, É.; Lichtfouse, E.; Torri, G.; Fourmentin, M.; Crini, G. 130 Years of Cyclodextrin Discovery for Health, Food, Agriculture, and the Industry: A Review. Environ. Chem. Lett. 2021, 19, 2581–2617. [Google Scholar] [CrossRef]
  15. Liu, Y.; Sameen, D.E.; Ahmed, S.; Wang, Y.; Lu, R.; Dai, J.; Li, S.; Qin, W. Recent Advances in Cyclodextrin-Based Films for Food Packaging. Food Chem. 2022, 370, 131026. [Google Scholar] [CrossRef] [PubMed]
  16. Xiao, Z.; Zhang, Y.; Niu, Y.; Ke, Q.; Kou, X. Cyclodextrins as Carriers for Volatile Aroma Compounds: A Review. Carbohydr. Polym. 2021, 269, 118292. [Google Scholar] [CrossRef]
  17. Pedrazzo, A.R.; Smarra, A.; Caldera, F.; Musso, G.; Dhakar, N.K.; Cecone, C.; Hamedi, A.; Corsi, I.; Trotta, F. Eco-Friendly β-Cyclodextrin and Linecaps Polymers for the Removal of Heavy Metals. Polymers 2019, 11, 1658. [Google Scholar] [CrossRef]
  18. Liu, Q.; Zhou, Y.; Lu, J.; Zhou, Y. Novel Cyclodextrin-Based Adsorbents for Removing Pollutants from Wastewater: A Critical Review. Chemosphere 2020, 241, 125043. [Google Scholar] [CrossRef]
  19. Tian, B.; Hua, S.; Tian, Y.; Liu, J. Cyclodextrin-Based Adsorbents for the Removal of Pollutants from Wastewater: A Review. Environ. Sci. Pollut. Res. 2021, 28, 1317–1340. [Google Scholar] [CrossRef]
  20. Verma, M.; Lee, I.; Hong, Y.; Kumar, V.; Kim, H. Multifunctional β-Cyclodextrin-EDTA-Chitosan Polymer Adsorbent Synthesis for Simultaneous Removal of Heavy Metals and Organic Dyes from Wastewater. Environ. Pollut. 2022, 292, 118447. [Google Scholar] [CrossRef]
  21. Yadav, M.; Thakore, S.; Jadeja, R. A Review on Remediation Technologies Using Functionalized Cyclodextrin. Environ. Sci. Pollut. Res. 2022, 29, 236–250. [Google Scholar] [CrossRef] [PubMed]
  22. Sivakumar, K.; Parinamachivayam, G. Review on β-Cyclodextrin Inclusion Complex Based Chemosensors for Heavy Metals. J. Incl. Phenom. Macrocycl. Chem. 2022, 102, 603–618. [Google Scholar] [CrossRef]
  23. Jambhekar, S.S.; Breen, P. Cyclodextrins in Pharmaceutical Formulations I: Structure and Physicochemical Properties, Formation of Complexes, and Types of Complex. Drug. Discov. Today 2016, 21, 356–362. [Google Scholar] [CrossRef] [PubMed]
  24. Ferrero, R.; Pantaleone, S.; Delle Piane, M.; Caldera, F.; Corno, M.; Trotta, F.; Brunella, V. On the Interactions of Melatonin/β-Cyclodextrin Inclusion Complex: A Novel Approach Combining Efficient Semiempirical Extended Tight-Binding (Xtb) Results with Ab Initio Methods. Molecules 2021, 26, 5881. [Google Scholar] [CrossRef] [PubMed]
  25. Wankar, J.; Kotla, N.G.; Gera, S.; Rasala, S.; Pandit, A.; Rochev, Y.A. Recent Advances in Host–Guest Self-Assembled Cyclodextrin Carriers: Implications for Responsive Drug Delivery and Biomedical Engineering. Adv. Funct. Mater. 2020, 30, 1909049. [Google Scholar] [CrossRef]
  26. Tian, B.; Liu, Y.; Liu, J. Smart Stimuli-Responsive Drug Delivery Systems Based on Cyclodextrin: A Review. Carbohydr. Polym. 2021, 251, 116871. [Google Scholar] [CrossRef] [PubMed]
  27. Fang, G.; Yang, X.; Chen, S.; Wang, Q.; Zhang, A.; Tang, B. Cyclodextrin-Based Host–Guest Supramolecular Hydrogels for Local Drug Delivery. Coord. Chem. Rev. 2022, 454, 214352. [Google Scholar] [CrossRef]
  28. Allahyari, S.; Zahednezhad, F.; Khatami, M.; Hashemzadeh, N.; Zakeri-Milani, P.; Trotta, F. Cyclodextrin Nanosponges as Potential Anticancer Drug Delivery Systems to Be Introduced into the Market, Compared with Liposomes. J. Drug. Deliv. Sci. Technol. 2022, 67, 102931. [Google Scholar] [CrossRef]
  29. Mazurek, A.H.; Szeleszczuk, Ł. Current Status of Quantum Chemical Studies of Cyclodextrin Host–Guest Complexes. Molecules 2022, 27, 3874. [Google Scholar] [CrossRef]
  30. Muzaffar, S.; Imtiaz, S.; Ali, S.M. Demonstrating Accuracy of the Proposed Protocol for Structure Elucidation of Cyclodextrin Inclusion Complexes by Validation Using DFT Studies. J. Mol. Struct. 2020, 1217, 128419. [Google Scholar] [CrossRef]
  31. Bao, X.; Liu, X.; Dou, R.; Xu, S.; Liu, D.; Luo, J.; Gong, X.; Wong, C.F.; Zhou, B. How Are N-Methylcarbamates Encapsulated by β-Cyclodextrin: Insight into the Binding Mechanism. Phys. Chem. Chem. Phys. 2023, 25, 13923–13932. [Google Scholar] [CrossRef] [PubMed]
  32. Nie, B.; Yan, J.; Shi, S.; Wang, L.J.; Wu, Y.C.; Li, H.J. Sustainable Corrosion Resistance of Piroxicam-Cyclodextrin Inclusion Complex to Mild Steel and Its Mechanism. J. Mater. Res. Technol. 2023, 23, 3665–3675. [Google Scholar] [CrossRef]
  33. Aree, T. Atomic-Level Understanding on Conformational Flexibility of Neochlorogenic and Chlorogenic Acids and Their Inclusion Complexation with β-Cyclodextrin. Food Hydrocoll. 2023, 141, 108742. [Google Scholar] [CrossRef]
  34. Benaïssa, A.; Bouhadiba, A.; Naili, N.; Chekkal, F.; Khelfaoui, M.; Bouras, I.; Madjram, M.S.; Zouchoune, B.; Mogalli, S.; Malfi, N.; et al. Computational Investigation of Dimethoate and β-Cyclodextrin Inclusion Complex: Molecular Structures, Intermolecular Interactions, and Electronic Analysis. Struct. Chem. 2023, 34, 1189–1204. [Google Scholar] [CrossRef]
  35. Imamura, W.; Yamasaki, T.; Kato, H.; Ishikawa, T. Insights into the Molecular Interaction of Cyclodextran with a Guest Molecule: A Computational Study. Carbohydr. Polym. 2023, 301, 120315. [Google Scholar] [CrossRef] [PubMed]
  36. Badi, S.; Madi, F.; Nouar, L.; Gheid, A. Effect of Cyclodextrins Inclusion Complexes into Absorption and Emission Spectra of P-Methylaminobenzoate Derivatives: A DFT and TD-DFT Investigation. J. Fluoresc. 2023, 33, 1457–1467. [Google Scholar] [CrossRef] [PubMed]
  37. Zaboub, A.; Madi, F.; Merdes, R.; Mohamedi, M.; Nouar, L. A Combined DFT and Experimental Study of Proline/β-Cyclodextrin Inclusion Complex. J. Mol. Liq. 2016, 216, 716–723. [Google Scholar] [CrossRef]
  38. Nora, M.; Ismahan, L.; Abdelkrim, G.; Mouna, C.; Leila, N.; Fatiha, M.; Nada, B.; Brahim, H. Interactions in Inclusion Complex of β-Cyclodextrin/l-Metheonine: DFT Computational Studies. J. Incl. Phenom. Macrocycl. Chem. 2020, 96, 43–54. [Google Scholar] [CrossRef]
  39. Harris, R.C.; Deng, N.; Levy, R.M.; Ishizuka, R.; Matubayasi, N. Computing Conformational Free Energy Differences in Explicit Solvent: An Efficient Thermodynamic Cycle Using an Auxiliary Potential and a Free Energy Functional Constructed from the End Points. J. Comput. Chem. 2017, 38, 1198–1208. [Google Scholar] [CrossRef]
  40. Belhouchet, H.R.; Abbaz, T.; Bendjedou, A.; Gouasmia, A.; Villemin, D. A Computational Study of the Inclusion of β-Cyclodextrin and Nicotinic Acid: DFT, DFT-D, NPA, NBO, QTAIM, and NCI-RDG Studies. J. Mol. Model. 2022, 28, 348. [Google Scholar] [CrossRef]
  41. Liu, R.; Qin, X.; Liu, X.; Wang, Y.; Zhong, J. Host-Guest Interactions between Oleic Acid and β-Cyclodextrin: A Combined Experimental and Theoretical Study. Food Chem. 2022, 387, 132910. [Google Scholar] [CrossRef] [PubMed]
  42. Alizadeh, N.; Poorbagher, N. Host-Guest Inclusion Complexes of Sulfabenzamide with β- and Methyl-β-Cyclodextrins: Characterization, Antioxidant Activity and DFT Calculation. J. Mol. Struct. 2022, 1260, 132809. [Google Scholar] [CrossRef]
  43. Karoyo, A.H.; Borisov, A.S.; Wilson, L.D.; Hazendonk, P. Formation of Host-Guest Complexes of β-Cyclodextrin and Perfluorooctanoic Acid. J. Phys. Chem. B 2011, 115, 9511–9527. [Google Scholar] [CrossRef]
  44. Topuz, F.; Uyar, T. Advances in the Development of Cyclodextrin-Based Nanogels/Microgels for Biomedical Applications: Drug Delivery and Beyond. Carbohydr. Polym. 2022, 297, 120033. [Google Scholar] [CrossRef] [PubMed]
  45. Jicsinszky, L.; Rossi, F.; Solarino, R.; Cravotto, G. Comparison of the Conventional and Mechanochemical Syntheses of Cyclodextrin Derivatives. Molecules 2023, 28, 467. [Google Scholar] [CrossRef] [PubMed]
  46. Cirri, M.; Nerli, G.; Mennini, N.; Maestrelli, F.; Mura, P. Development and Characterization of Cyclodextrin-Based Nanogels as a New Ibuprofen Cutaneous Delivery System. Pharmaceutics 2022, 14, 2567. [Google Scholar] [CrossRef] [PubMed]
  47. Peimanfard, S.; Zarrabi, A.; Trotta, F.; Matencio, A.; Cecone, C.; Caldera, F. Developing Novel Hydroxypropyl-β-Cyclodextrin-Based Nanosponges as Carriers for Anticancer Hydrophobic Agents: Overcoming Limitations of Host–Guest Complexes in a Comparative Evaluation. Pharmaceutics 2022, 14, 1059. [Google Scholar] [CrossRef]
  48. Bonnet, P.; Jaime, C.; Morin-Allory, L. Structure and Thermodynamics of α-, β-, and γ-Cyclodextrin Dimers. Molecular Dynamics Studies of the Solvent Effect and Free Binding Energies. J. Org. Chem. 2002, 67, 8602–8609. [Google Scholar] [CrossRef]
  49. Stachowicz, A.; Styrcz, A.; Korchowiec, J.; Modaressi, A.; Rogalski, M. DFT Studies of Cation Binding by β-Cyclodextrin. Theor. Chem. Acc. 2011, 130, 939–953. [Google Scholar] [CrossRef]
  50. Zhang, H.; Tan, T.; van der Spoel, D. Generalized Born and Explicit Solvent Models for Free Energy Calculations in Organic Solvents: Cyclodextrin Dimerization. J. Chem. Theory Comput. 2015, 11, 5103–5113. [Google Scholar] [CrossRef]
  51. He, P.; Sarkar, S.; Gallicchio, E.; Kurtzman, T.; Wickstrom, L. Role of Displacing Confined Solvent in the Conformational Equilibrium of β-Cyclodextrin. J. Phys. Chem. B 2019, 123, 8378–8386. [Google Scholar] [CrossRef]
  52. Anconi, C.P.A.; Nascimento, C.S.; De Almeida, W.B.; Santos, H.F.D. Structure and Stability of (α-CD)3 Aggregate and OEG at (α-CD)3 Pseudorotaxane in Aqueous Solution: A Molecular Dynamics Study. J. Phys. Chem. B 2009, 113, 9762–9769. [Google Scholar] [CrossRef] [PubMed]
  53. de Sousa, S.M.R.; Guimarães, L.; Ferrari, J.L.; de Almeida, W.B.; Nascimento, C.S. A DFT Investigation on the Host/Guest Inclusion Process of Prilocaine into β-Cyclodextrin. Chem. Phys. Lett. 2016, 652, 123–129. [Google Scholar] [CrossRef]
  54. Bouchemela, H.; Madi, F.; Nouar, L. DFT Investigation of Host–Guest Interactions between α-Terpineol and β-Cyclodextrin. J. Incl. Phenom. Macrocycl. Chem. 2019, 95, 247–258. [Google Scholar] [CrossRef]
  55. Ignaczak, A.; Orszański, Ł.; Adamiak, M.; Olejniczak, A.B. Comparative DFT Study of Inclusion Complexes of Thymidine-Carborane Conjugate with β-Cyclodextrin and Heptakis(2,6-O-Dimethyl)-β-Cyclodextrin in Water. J. Mol. Liq. 2020, 315, 113767. [Google Scholar] [CrossRef]
  56. Lopes, J.F.; Nascimento, C.S.; Anconi, C.P.A.; Santos, H.F.D.; Almeida, W.B.D. Inclusion Complex Thermodynamics: The β-Cyclodextrin and Sertraline Complex Example. J. Mol. Graph. Model. 2015, 62, 11–17. [Google Scholar] [CrossRef] [PubMed]
  57. Passos, J.J.; De Sousa, F.B.; Lula, I.S.; Barreto, E.A.; Lopes, J.F.; De Almeida, W.B.; Sinisterra, R.D. Multi-Equilibrium System Based on Sertraline and β-Cyclodextrin Supramolecular Complex in Aqueous Solution. Int. J. Pharm. 2011, 421, 24–33. [Google Scholar] [CrossRef] [PubMed]
  58. Anconi, C.P.A.; Nascimento, C.S.; Fedoce-Lopes, J.; Dos Santos, H.F.; De Almeida, W.B. Ab Initio Calculations on Low-Energy Conformers of α-Cyclodextrin. J. Phys. Chem. A 2007, 111, 12127–12135. [Google Scholar] [CrossRef] [PubMed]
  59. Ramos, A.I.; Braga, T.M.; Silva, P.; Fernandes, J.A.; Ribeiro-Claro, P.; De Fátima Silva Lopes, M.; Paz, F.A.A.; Braga, S.S. Chloramphenicol·cyclodextrin Inclusion Compounds: Co-Dissolution and Mechanochemical Preparations and Antibacterial Action. CrystEngComm 2013, 15, 2822–2834. [Google Scholar] [CrossRef]
  60. Harata, K. The Structure of the Cyclodextrin Complex. V. Crystal Structures of α-Cyclodextrin Complexes with p-Nitrophenol and p-Hydroxybenzoic Acid. Bull. Chem. Soc. Jpn. 1977, 60, 1416–1424. [Google Scholar] [CrossRef]
  61. Jiang, Z.G.; Mao, W.T.; Huang, D.P.; Wang, Y.; Wang, X.J.; Zhan, C.H. A Nonconventional Host-Guest Cubic Assembly Based on γ-Cyclodextrin and a Keggin-Type Polyoxometalate. Nanoscale 2020, 12, 10166–10171. [Google Scholar] [CrossRef]
  62. Goerigk, L.; Hansen, A.; Bauer, C.; Ehrlich, S.; Najibi, A.; Grimme, S. A Look at the Density Functional Theory Zoo with the Advanced GMTKN55 Database for General Main Group Thermochemistry, Kinetics and Noncovalent Interactions. Phys. Chem. Chem. Phys. 2017, 19, 32184–32215. [Google Scholar] [CrossRef] [PubMed]
  63. Bannwarth, C.; Ehlert, S.; Grimme, S. GFN2-XTB—An Accurate and Broadly Parametrized Self-Consistent Tight-Binding Quantum Chemical Method with Multipole Electrostatics and Density-Dependent Dispersion Contributions. J. Chem. Theory Comput. 2019, 15, 1652–1671. [Google Scholar] [CrossRef]
  64. Spicher, S.; Grimme, S. Robust Atomistic Modeling of Materials, Organometallic, and Biochemical Systems. Angew. Chem. 2020, 132, 15795–15803. [Google Scholar] [CrossRef]
  65. Caldeweyher, E.; Ehlert, S.; Hansen, A.; Neugebauer, H.; Spicher, S.; Bannwarth, C.; Grimme, S. A Generally Applicable Atomic-Charge Dependent London Dispersion Correction. J. Chem. Phys. 2019, 150, 154122. [Google Scholar] [CrossRef]
  66. Pracht, P.; Bohle, F.; Grimme, S. Automated Exploration of the Low-Energy Chemical Space with Fast Quantum Chemical Methods. Phys. Chem. Chem. Phys. 2020, 22, 7169–7192. [Google Scholar] [CrossRef] [PubMed]
  67. Ehlert, S.; Stahn, M.; Spicher, S.; Grimme, S. A Robust and Efficient Implicit Solvation Model for Fast Semiempirical Methods. J. Chem. Theory Comput. 2021, 17, 4250–4261. [Google Scholar] [CrossRef]
  68. Spicher, S.; Plett, C.; Pracht, P.; Hansen, A.; Grimme, S. Automated Molecular Cluster Growing for Explicit Solvation by Efficient Force Field and Tight Binding Methods. J. Chem. Theory Comput. 2022, 18, 3174–3189. [Google Scholar] [CrossRef]
  69. Grimme, S.; Bannwarth, C.; Caldeweyher, E.; Pisarek, J.; Hansen, A. A General Intermolecular Force Field Based on Tight-Binding Quantum Chemical Calculations. J. Chem. Phys. 2017, 147, 161708. [Google Scholar] [CrossRef]
  70. Brandenburg, J.G.; Bannwarth, C.; Hansen, A.; Grimme, S. B97-3c: A Revised Low-Cost Variant of the B97-D Density Functional Method. J. Chem. Phys. 2018, 148, 064104. [Google Scholar] [CrossRef]
  71. Grimme, S.; Hansen, A.; Ehlert, S.; Mewes, J.M. r2SCAN-3c: A “Swiss Army Knife” Composite Electronic-Structure Method. J. Chem. Phys. 2021, 154, 064103. [Google Scholar] [CrossRef] [PubMed]
  72. Weigend, F.; Ahlrichs, R. Balanced Basis Sets of Split Valence, Triple Zeta Valence and Quadruple Zeta Valence Quality for H to Rn: Design and Assessment of Accuracy. Phys. Chem. Chem. Phys. 2005, 7, 3297–3305. [Google Scholar] [CrossRef] [PubMed]
  73. Kruse, H.; Grimme, S. A Geometrical Correction for the Inter- and Intra-Molecular Basis Set Superposition Error in Hartree-Fock and Density Functional Theory Calculations for Large Systems. J. Chem. Phys. 2012, 136, 154101. [Google Scholar] [CrossRef] [PubMed]
  74. Grimme, S.; Antony, J.; Ehrlich, S.; Krieg, H. A Consistent and Accurate Ab Initio Parametrization of Density Functional Dispersion Correction (DFT-D) for the 94 Elements H-Pu. J. Chem. Phys. 2010, 132, 154104. [Google Scholar] [CrossRef] [PubMed]
  75. Grimme, S.; Ehrlich, S.; Goerigk, L. Effect of the Damping Function in Dispersion Corrected Density Functional Theory. J. Comput. Chem. 2011, 32, 1456–1465. [Google Scholar] [CrossRef] [PubMed]
  76. Grimme, S. Semiempirical Hybrid Density Functional with Perturbative Second-Order Correlation. J. Chem. Phys. 2006, 124, 034108. [Google Scholar] [CrossRef] [PubMed]
  77. Kozuch, S.; Gruzman, D.; Martin, J.M.L. DSD-BLYP: A General Purpose Double Hybrid Density Functional Including Spin Component Scaling and Dispersion Correction. J. Phys. Chem. C 2010, 114, 20801–20808. [Google Scholar] [CrossRef]
  78. Kozuch, S.; Martin, J.M.L. DSD-PBEP86: In Search of the Best Double-Hybrid DFT with Spin-Component Scaled MP2 and Dispersion Corrections. Phys. Chem. Chem. Phys. 2011, 13, 20104–20107. [Google Scholar] [CrossRef]
  79. Barone, V.; Cossi, M. Quantum Calculation of Molecular Energies and Energy Gradients in Solution by a Conductor Solvent Model. J. Phys. Chem. A 1998, 102, 1995–2001. [Google Scholar] [CrossRef]
  80. Cossi, M.; Rega, N.; Scalmani, G.; Barone, V. Energies, Structures, and Electronic Properties of Molecules in Solution with the C-PCM Solvation Model. J. Comput. Chem. 2003, 24, 669–681. [Google Scholar] [CrossRef]
  81. Dovesi, R.; Saunders, V.; Roetti, C.; Orlando, R.; Zicovich-Wilson, C.M.; Pascale, F.; Civalleri, B.; Doll, K.; Harrison, N.; Bush, I.; et al. CRYSTAL23 User’s Manual. 2022. Available online: https://www.crystal.unito.it/include/manuals/crystal23.pdf (accessed on 20 June 2023).
  82. Erba, A.; Desmarais, J.K.; Casassa, S.; Civalleri, B.; Donà, L.; Bush, I.J.; Searle, B.; Maschio, L.; Edith-Daga, L.; Cossard, A.; et al. CRYSTAL23: A Program for Computational Solid State Physics and Chemistry. J. Chem. Theory Comput. 2022, 19, 6891–6932. [Google Scholar] [CrossRef] [PubMed]
  83. Furness, J.W.; Kaplan, A.D.; Ning, J.; Perdew, J.P.; Sun, J. Accurate and Numerically Efficient r2SCAN Meta-Generalized Gradient Approximation. J. Phys. Chem. Lett. 2020, 11, 8208–8215. [Google Scholar] [CrossRef] [PubMed]
  84. Monkhorst, H.J.; Pack, J.D. Special Points for Brillouin-Zone Integrations. Phys. Rev. B 1976, 13, 5188–5192. [Google Scholar] [CrossRef]
  85. Pascale, F.; Zicovich-Wilson, C.M.; Gejo, F.L.; Civalleri, B.; Orlando, R.; Dovesi, R. The Calculation of the Vibrational Frequencies of Crystalline Compounds and Its Implementation in the CRYSTAL Code. J. Comput. Chem. 2004, 25, 888–897. [Google Scholar] [CrossRef] [PubMed]
  86. Zicovich-Wilson, C.M.; Pascale, F.; Roetti, C.; Saunders, V.R.; Orlando, R.; Dovesi, R. Calculation of the Vibration Frequencies of α-Quartz: The Effect of Hamiltonian and Basis Set. J. Comput. Chem. 2004, 25, 1873–1881. [Google Scholar] [CrossRef] [PubMed]
  87. Dall’Olio, S.; Dovesi, R.; Resta, R. Spontaneous Polarization as a Berry Phase of the Hartree-Fock Wave Function: The Case of KNbO3. Phys. Rev. B 1997, 56, 10105–10114. [Google Scholar] [CrossRef]
  88. Huggins, C.M.; Pimentel, G.C. Systematics of the infrared spectral properties of hydrogen bonding systems: Frequency shift, half width and intensity. J. Phys. Chem. 1956, 60, 1615–1619. [Google Scholar] [CrossRef]
  89. Ugliengo, P.; Viterbo, D.; Chiari, G. MOLDRAW: Molecular Graphics on a Personal Computer. Z. Krist.—Cryst. Mater. 1993, 207, 9–23. [Google Scholar] [CrossRef]
  90. Dennington, R.; Keith, T.A.; Millam, J.M. Gaussview6; Semichem Inc.: Shawnee, KS, USA, 2016. [Google Scholar]
  91. Humphrey, W.; Dalke, A.; Schulten, K. VMD: Visual Molecular Dynamics. J. Mol. Graph. 1996, 14, 33–38. [Google Scholar] [CrossRef]
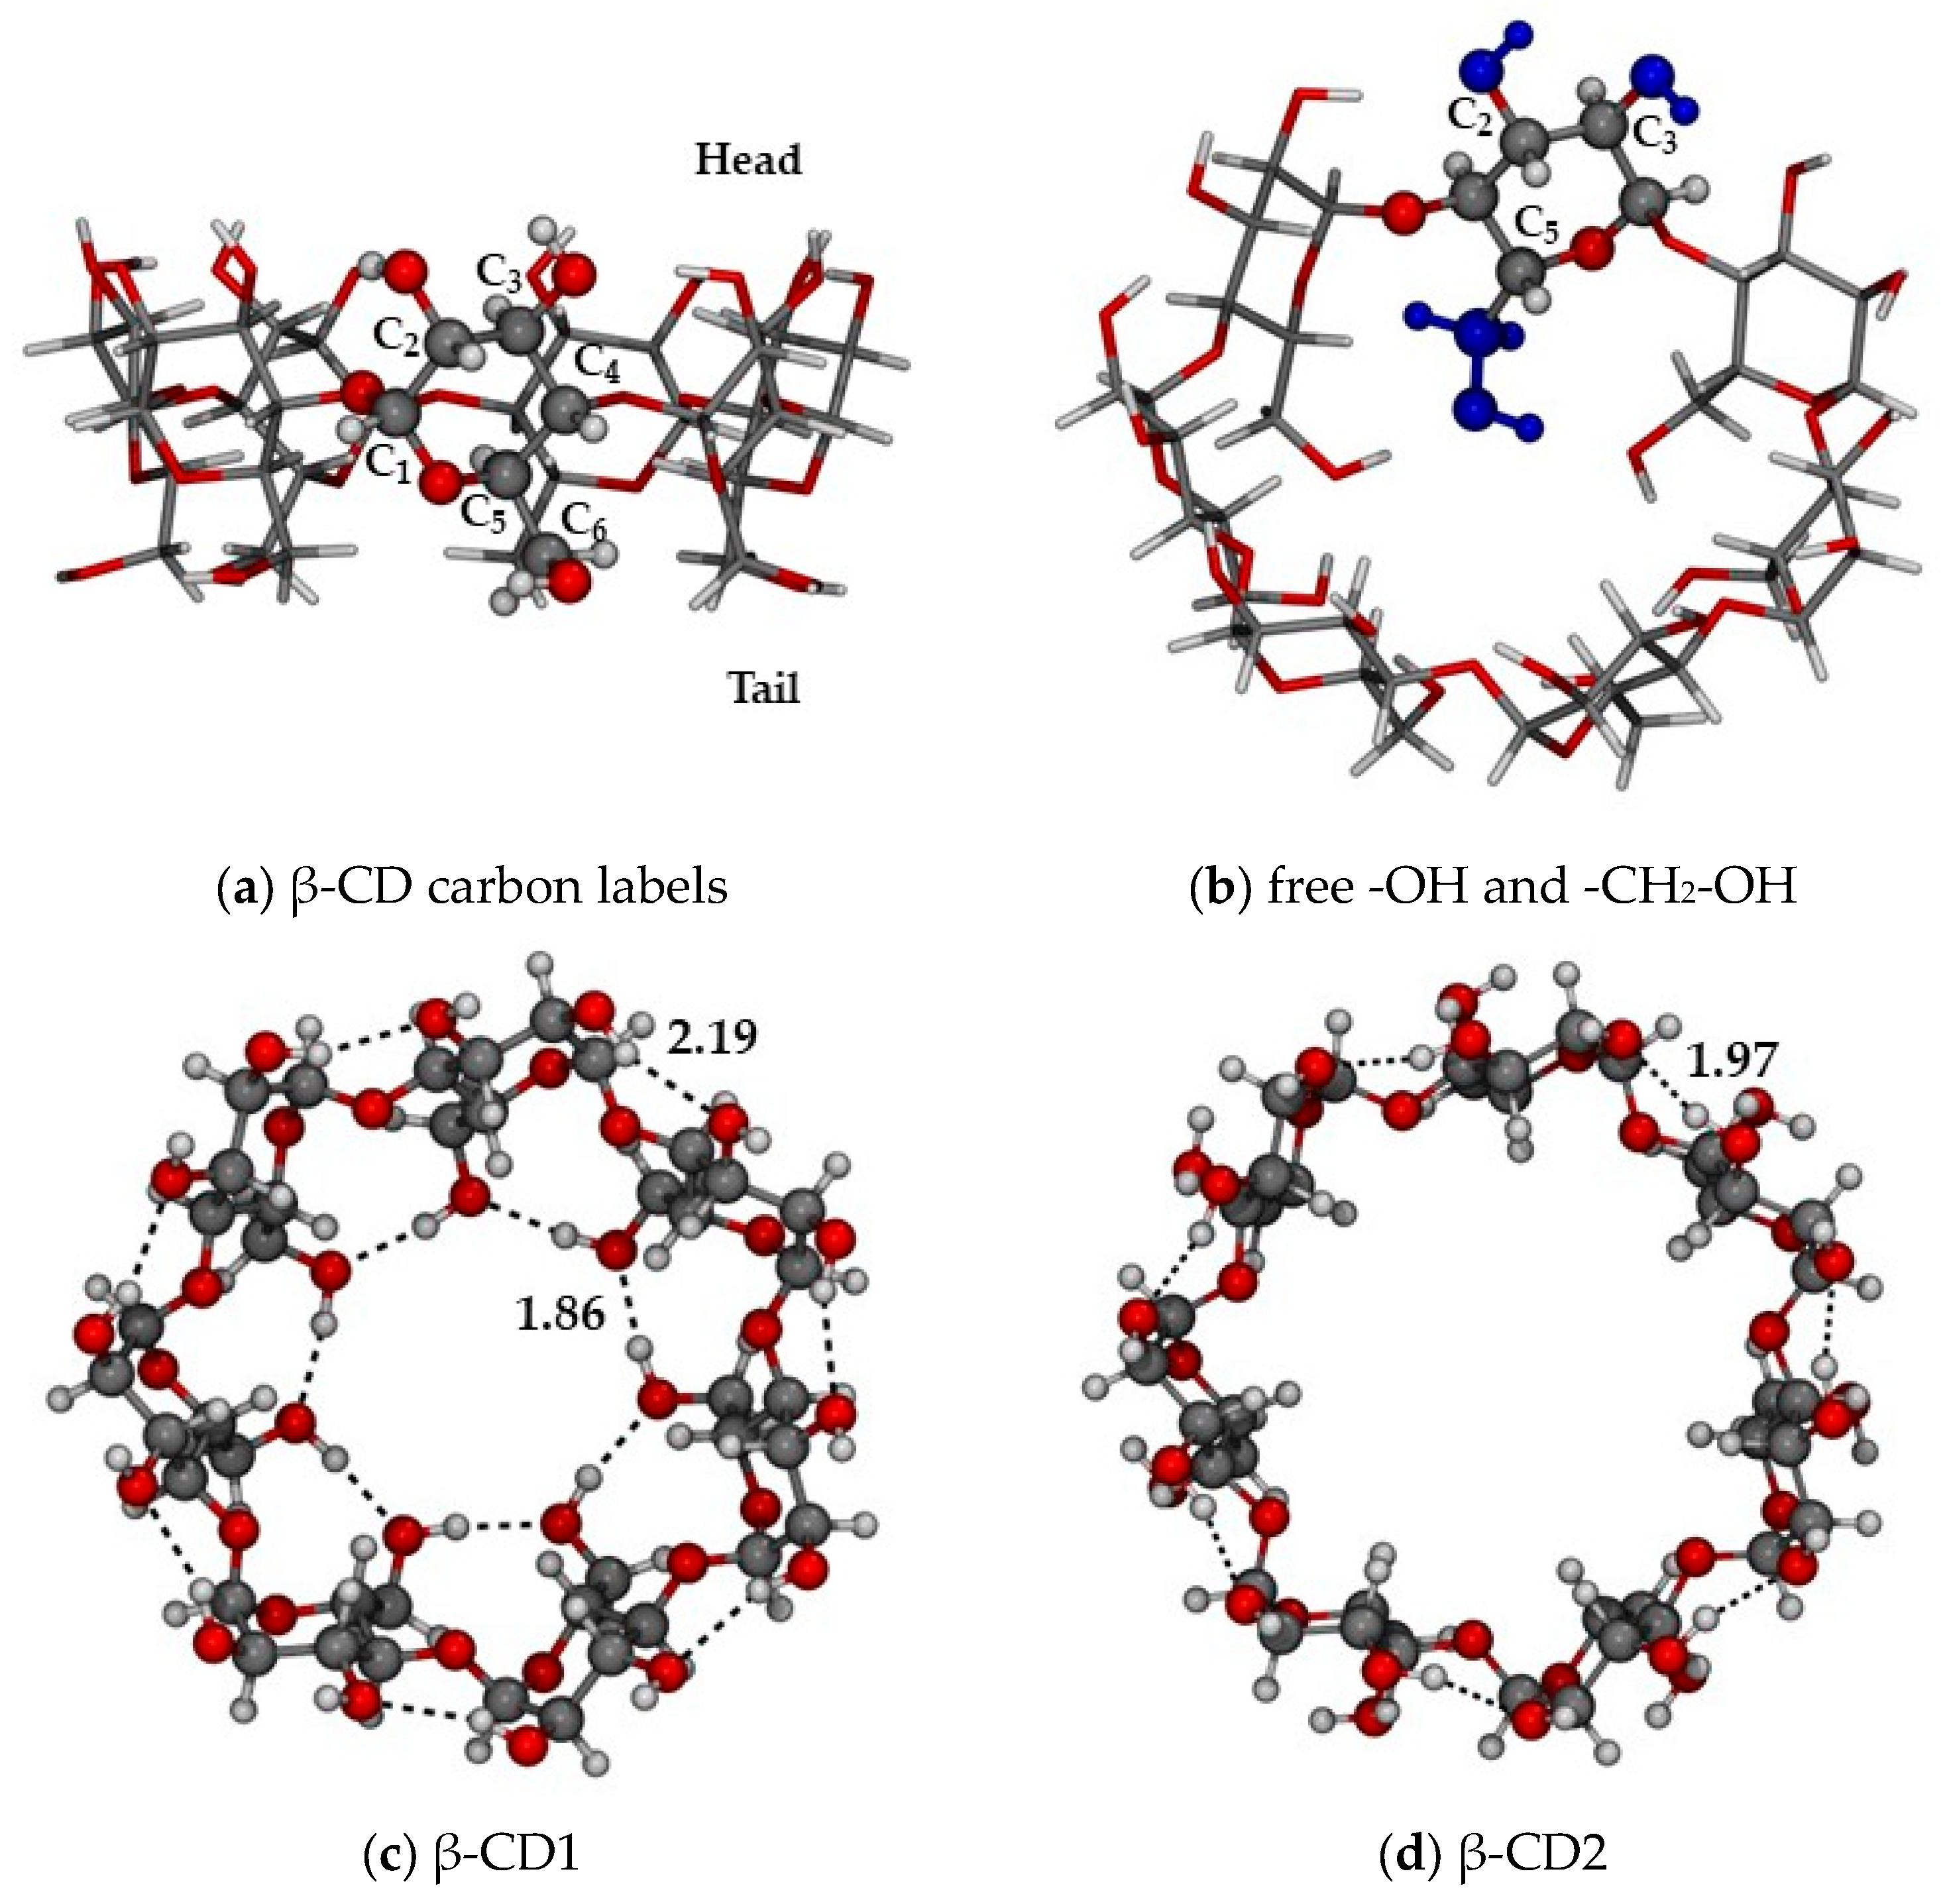
Figure 1. (a) Carbon labeling of the α-glucopyranose ring and “Head”/”Tail” parts of β-cyclodextrin; (b) hydroxyl and hydroxymethyl groups free to rotate during the conformational search (highlighted in blue); (c) closed (CD1) and (d) open (CD2) conformations, as optimized at the r2SCAN-3c level. Color code: H in white, C in grey, O in red, H-bond as red dotted lines. H-bond distances in Å.
Ijms 24 16826 g001
Figure 2. r2SCAN-3c optimized structures of the most stable β-CD conformers in the gas (a) and water (b) phases. Numbers in round parenthesis correspond to the relative energy in the gas phase, and in square parenthesis to the relative energy in C-PCM water (in kcal/mol). Color code: H in white, C in grey, O in red.
Ijms 24 16826 g002
Figure 3. r2SCAN-3c optimized structures of the β-CD dimers in the gas phase. Numbers in round parentheses correspond to the relative energy in the gas phase, and in square parentheses to the relative energy in water C-PCM (in kcal/mol). H and T stand for Head and Tail sides, respectively. Color code: H in white, C in grey, O in red.
Ijms 24 16826 g003
Figure 4. r2SCAN-D3BJ/def2-TZVP(gCP) optimized structure of the β-CD crystal in the gas phase (viewed in the ab plane). Color code: H in white, C in grey, O in red, unit cell borders in blue.
Ijms 24 16826 g004
Figure 5. r2SCAN-3c optimized structures of the α-CD dimers in the gas phase. Numbers in round parentheses correspond to the relative energy in the gas phase, and in square parentheses to the relative energy in water C-PCM (in kcal/mol). Color code: H in white, C in grey, O in red.
Ijms 24 16826 g005
Figure 6. r2SCAN-3c optimized structures of the α-CD dimers in the gas phase. Numbers in round parenthesis correspond to the relative energy in the gas phase, and in square parenthesis to the relative energy in water C-PCM (in kcal/mol). H and T stand for Head and Tail sides. Color code: H in white, C in grey, O in red.
Ijms 24 16826 g006
Figure 7. r2SCAN-3c optimized structures of the γ-CD dimers in the gas phase. Numbers in round parentheses correspond to the relative energy in the gas phase, and in square parentheses to the relative energy in water C-PCM (in kcal/mol). Color code: H in white, C in grey, O in red.
Ijms 24 16826 g007
Figure 8. r2SCAN-3c optimized structures of the γ-CD dimers in the gas phase. Numbers in round parentheses correspond to the relative energy in the gas phase, and in square parentheses to the relative energy in water C-PCM (in kcal/mol). H and T stand for Head and Tail sides. Color code: H in white, C in grey, O in red.
Ijms 24 16826 g008
Figure 9. Experimental (red line) vs. computed (blue line) IR spectrum of β-CD. For the simulated spectrum, the crystal structure was used.
Ijms 24 16826 g009
Figure 10. xTB-GFN2 optimized geometries of α-, β-, and γ-CDs in explicit solvation. In round parentheses are the relative energies of the two most stable β-CD conformers. In vdW representation are the cyclodextrins, and in sticks are the solvation water molecules. Color code: H in white, C in grey, O in red.
Ijms 24 16826 g010
Table 1. Energetic ranking (in kcal/mol) of the structures used for the benchmark. Top part: r2SCAN-3c geometries; bottom part: B97-3c geometries. In parenthesis: the RMSD (Root Mean Square Deviation) with respect to the CD1 structure.
StructuresΔErel
r2SCAN-3cB2PLYPDSD-BLYPDSD-PBEP86r2SCAN-3cB2PLYPDSD-BLYPDSD-PBEP86
1.CD1 (0.000)CD1CD1CD10.00.00.00.0
2.CD2 (1.110)x121x121x1214.76.75.96.0
3.x121 (1.789)x033x026x0265.86.86.16.3
4.x026 (1.858)x026x033x0336.36.86.16.3
5.x033 (1.864)x080CD2CD26.47.66.36.5
6.x153 (1.820)x072x080x0807.37.66.86.8
7.x023 (1.820)CD2x072x0727.37.76.86.8
8.x043 (1.820)x043x043x0237.38.47.67.7
9.x072 (2.147)x023x023x0437.48.47.67.7
10.x080 (2.141)x153x153x1537.48.47.67.7
B97-3cB2PLYPDSD-BLYPDSD-PBEP86B97-3cB2PLYPDSD-BLYPDSD-PBEP86
1.CD1 (0.000)CD1CD1CD10.00.00.00.0
2.x026 (1.853)x033x121x1218.66.76.06.2
3.x033 (1.854)x026x033x0338.76.76.16.4
4.CD2 (1.166)x121x026x0269.16.86.16.4
5.x121 (1.788)x080CD2CD29.27.66.46.7
6.x023 (1.814)x072x080x08010.47.66.97.0
7.x043 (1.814)CD2x072x07210.47.76.97.0
8.x153 (1.822)x043x153x15310.58.47.77.9
9.x072 (2.150)x023x023x02310.58.47.78.0
10.x080 (2.150)x153x043x04310.68.47.78.0
Table 2. r2SCAN-3c energetic ranking (ΔErel, in kcal/mol) of β-CD conformers in C-PCM. In parentheses are the free energies.
StructureΔErelSolvation E
CD20.0 (0.0)−49.5 (−60.2)
x050.5 (0.4)−49.0 (−59.8)
x010.5 (0.6)−49.0 (−59.6)
x031.0 (1.2)−48.5 (−59.1)
x021.6−47.9
x083.1−46.3
x063.2−46.3
x233.6−45.9
x164.3−45.2
x154.3−45.1
CD15.2−44.3
x766.0−44.0
Table 3. r2SCAN-3c relative (ΔErel) and dimerization (ΔEdim) energies (in kcal/mol) of β-CD dimers in the gas phase and in water C-PCM. In parentheses are the free energies. H and T stand for Head and Tail sides.
StructureGas PhaseWater (C-PCM)
ΔErelΔEdimΔErelΔEdim
β-CD1-HH0.0 (2.4)−64.6 (−35.2)9.2−35.6
β-CD2-HH8.3 (0.0)−56.2 (−37.6)0.0 (0.0)−44.8 (−15.7)
β-CD2-TT29.7−34.88.3 (7.1)−36.5 (−8.7)
β-CD1-TT48.1−16.541.3−3.5
Table 4. Experimental vs. r2SCAN-D3BJ/def2-TZVP(gCP) optimized cell parameters of the β-cyclodextrin crystal structure. Cell parameters in Å, angle in degrees, and volume in Å3. Δ% is the percentage of error. Energies are in kcal/mol.
abcβVolumeCohesive HCohesive G
r2SCAN-D3BJ/
def2-TZVP (gCP)
16.86725.33915.849113.1856226.575−91.4−64.2
EXP19.05624.41515.698109.4636886.183----
Δ%12.5−4.8−2.0−3.68.0----
Table 5. r2SCAN-3c relative (ΔErel) and dimerization (ΔEdim) energies (in kcal/mol) of α-CD dimers in the gas phase and in water C-PCM. In parentheses are the free energies. H and T stand for Head and Tail sides.
Gas PhaseWater (C-PCM)
StructureΔErelΔEdimΔErelΔEdim
α-CD1-HH0.0 (0.0)−52.0 (−26.1)3.9 (12.3)−34.6 (3.1)
α-CD2-HH11.1 (3.8)−40.9 (−22.3)0.0 (0.0)−38.5 (−9.2)
α-CD1-TT40.2−11.827.5−11.0
α-CD2-TT44.1−7.913.6−24.9
Table 6. r2SCAN-3c energetic ranking (ΔErel, in kcal/mol) of γ-CD conformer in C-PCM. In parentheses are the free energies.
StructureΔErelSolvation E
γ-CD20.0 (0.0)−64.5 (−74.7)
γ-x080.5 (1.9)−64.0 (−72.8)
γ-x090.5 (0.5)−63.9 (−74.2)
γ-x240.8 (1.3)−63.6 (−73.4)
γ-x421.3 (1.0)−63.2 (−73.6)
γ-x381.3 (2.2)−63.2 (−72.4)
γ-x314.1−60.4
Table 7. r2SCAN-3c relative (ΔErel) and dimerization (ΔEdim) energies (in kcal/mol) of γ-CD dimers in the gas phase and in water C-PCM. In parentheses are the free energies. H and T stand for Head and Tail sides.
Gas PhaseWater (C-PCM)
StructureΔErelΔEdimΔErelΔEdim
γ-CD2-HH0.0 (0.0)−78.6 (−56.0)0.0 (0.0)−51.1 (−20.5)
γ-CD1-HH8.1 (15.5)−70.5 (−40.5)33.6 −17.6
γ-CD2-TT12.7−37.213.9 (15.7)−37.2 (−4.8)
γ-CD1-TT46.9−31.731.9−19.3
Table 8. Solvation data of α-, β-, and γ-CDs in implicit and explicit solvation. SASA stands for solvent-accessible surface area. Implicit solvation energies refer to the most stable conformers at r2SCAN-3c (C-PCM) level of theory. Energies are in kcal/mol. Areas in Å2. Experimental solubility in mg/L.
α-CDβ-CD-Cβ-CD-Oγ-CD
E s o l v P C M −37.91−49.46−64.48
SASA (PCM)3014.213486.243994.49
Normalized E s o l v P C M −1.26 × 10⁻²−1.42 × 10⁻²−1.61 × 10⁻²
E s o l v e x p l −36.82−48.91−41.52−190.53
SASA (explicit)2759.613272.973438.823827.84
Normalized E s o l v e x p l −1.33 × 10⁻²−1.57 × 10⁻²−1.28 × 10⁻²−4.98 × 10⁻²
E d e f C D 78.3063.5183.3970.34
E d e f H 2 O 198.13222.91252.90103.42
Experimental solubility14518.518.5232
Disclaimer/Publisher’s Note: The statements, opinions and data contained in all publications are solely those of the individual author(s) and contributor(s) and not of MDPI and/or the editor(s). MDPI and/or the editor(s) disclaim responsibility for any injury to people or property resulting from any ideas, methods, instructions or products referred to in the content.