
Lost in Space? Unmasking the T Cell Reaction to Simulated Space Stressors

 , ,
, , 
Abstract
:1. Introduction
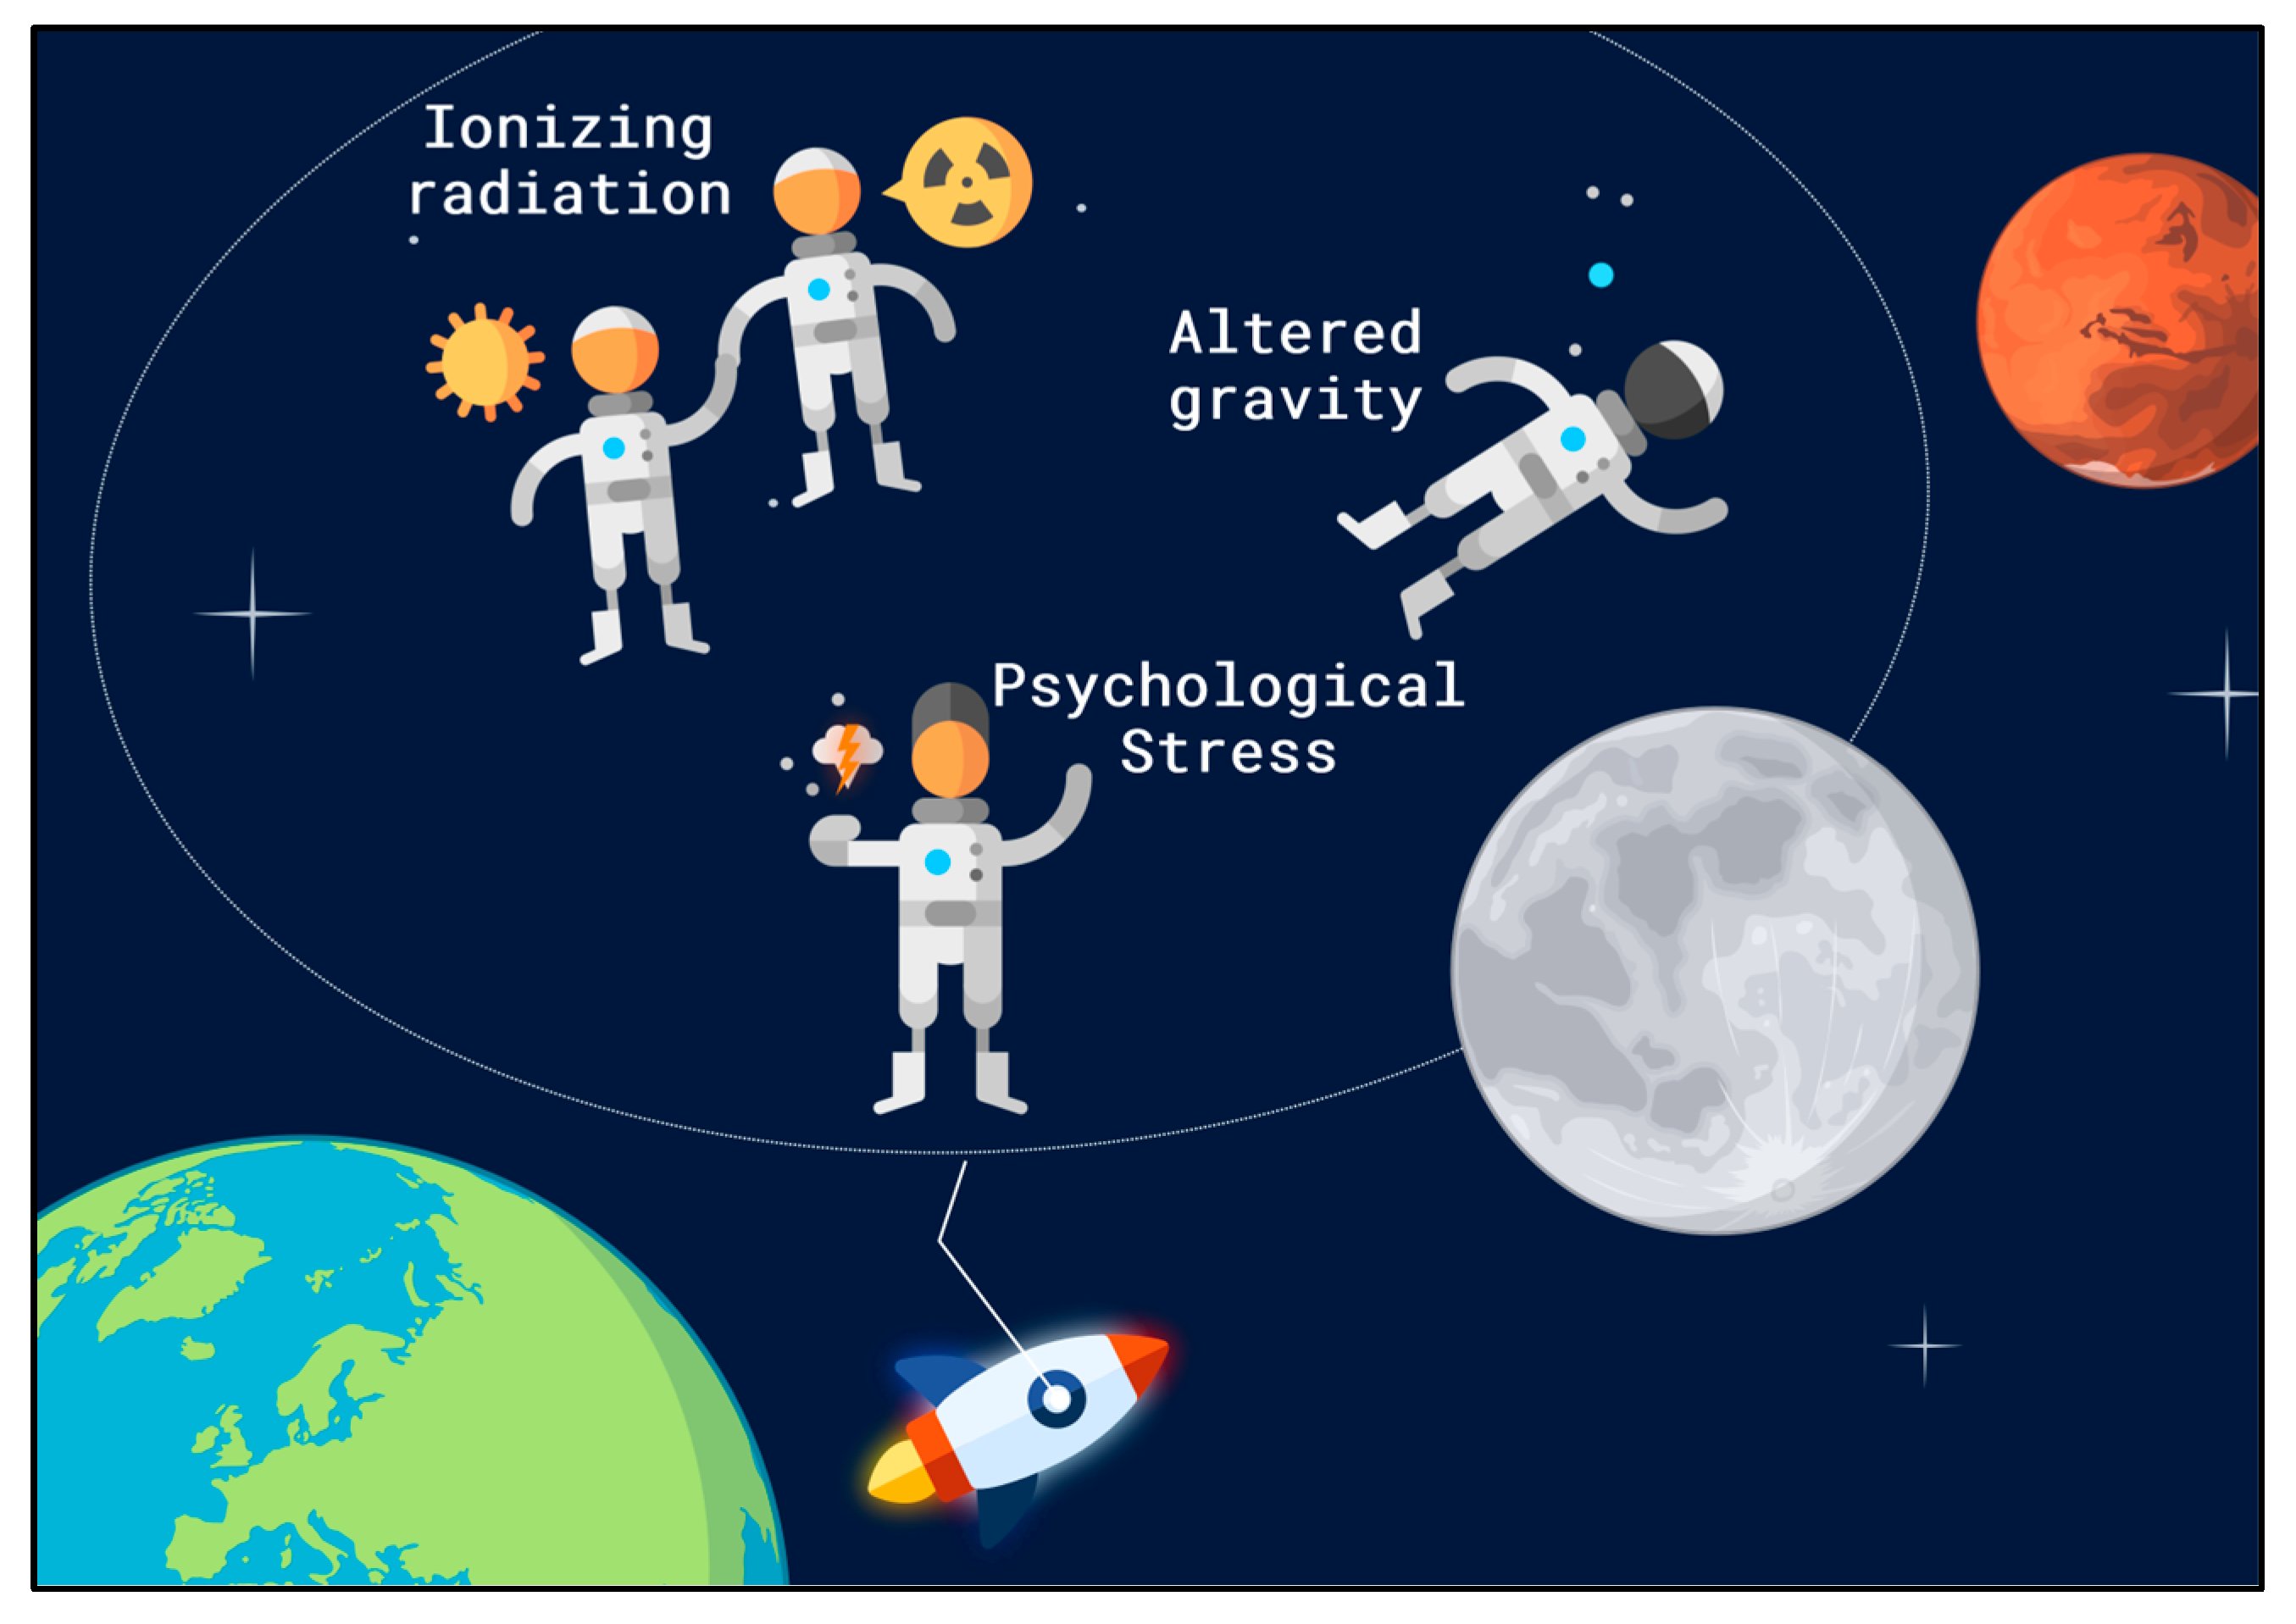
1.1. Space Radiation
1.2. Altered Gravity
1.3. Psychological Stress
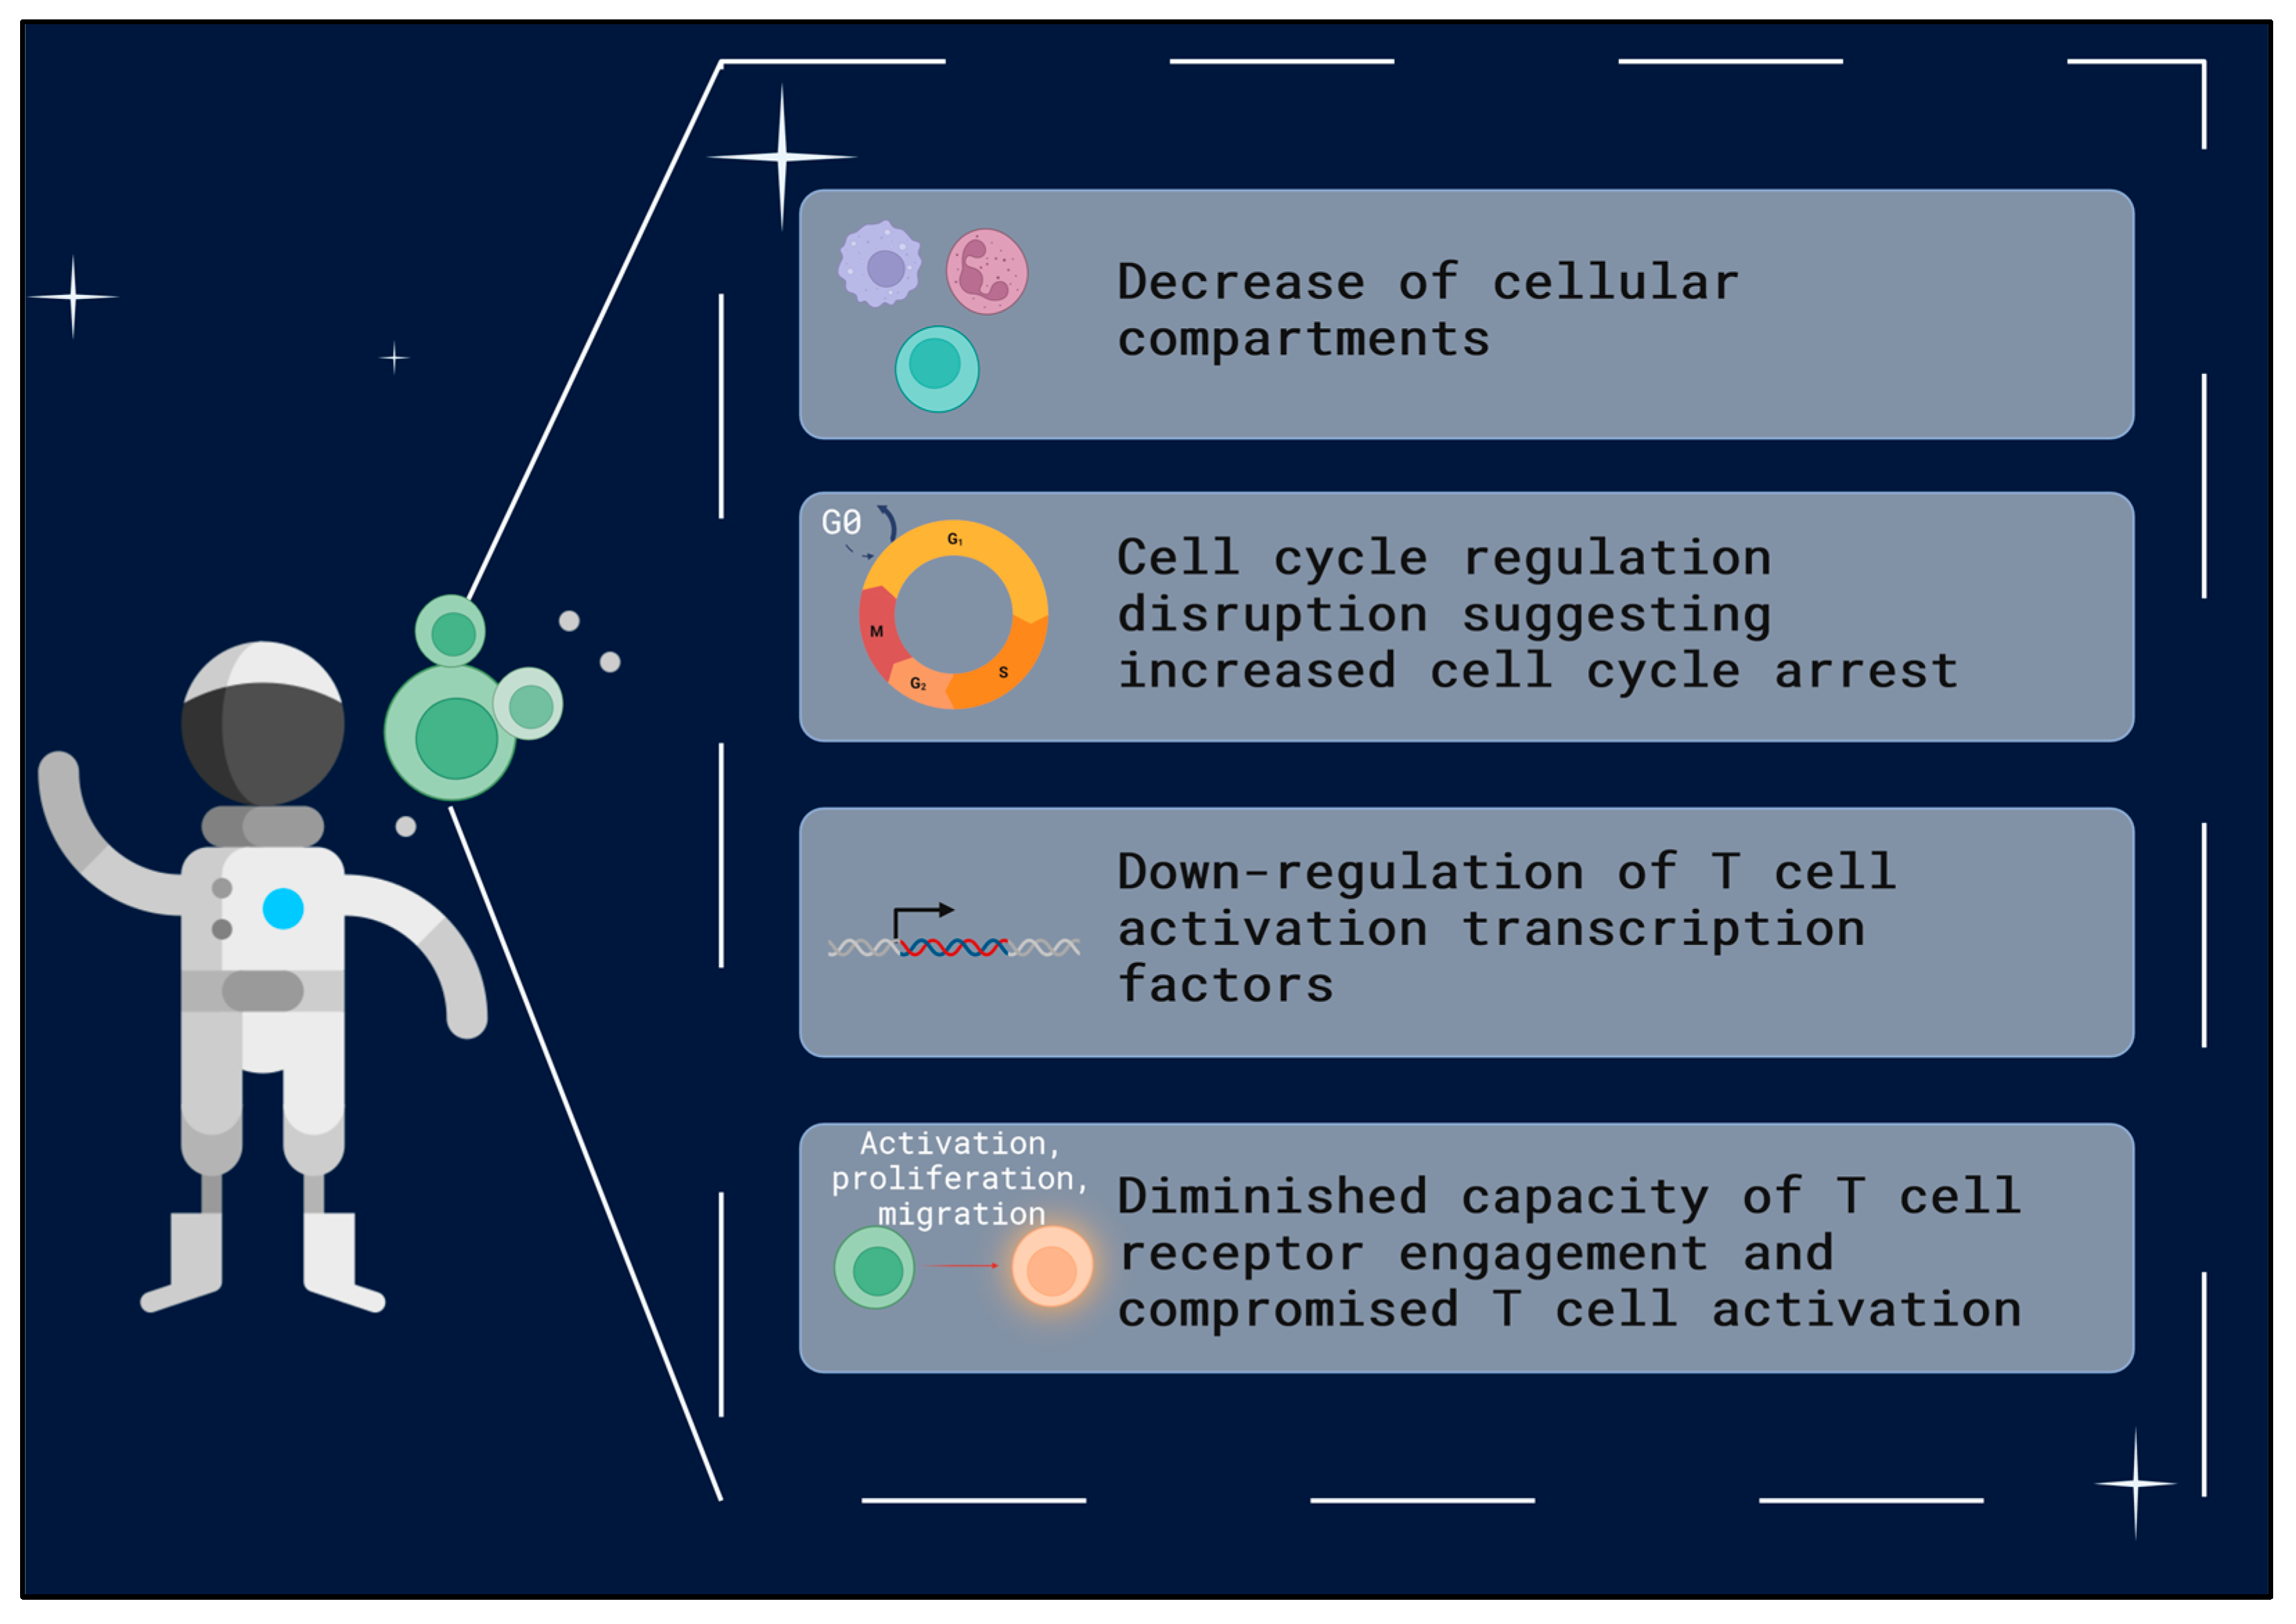
1.4. T Cells—Key Players in Immune System Function
2. Results
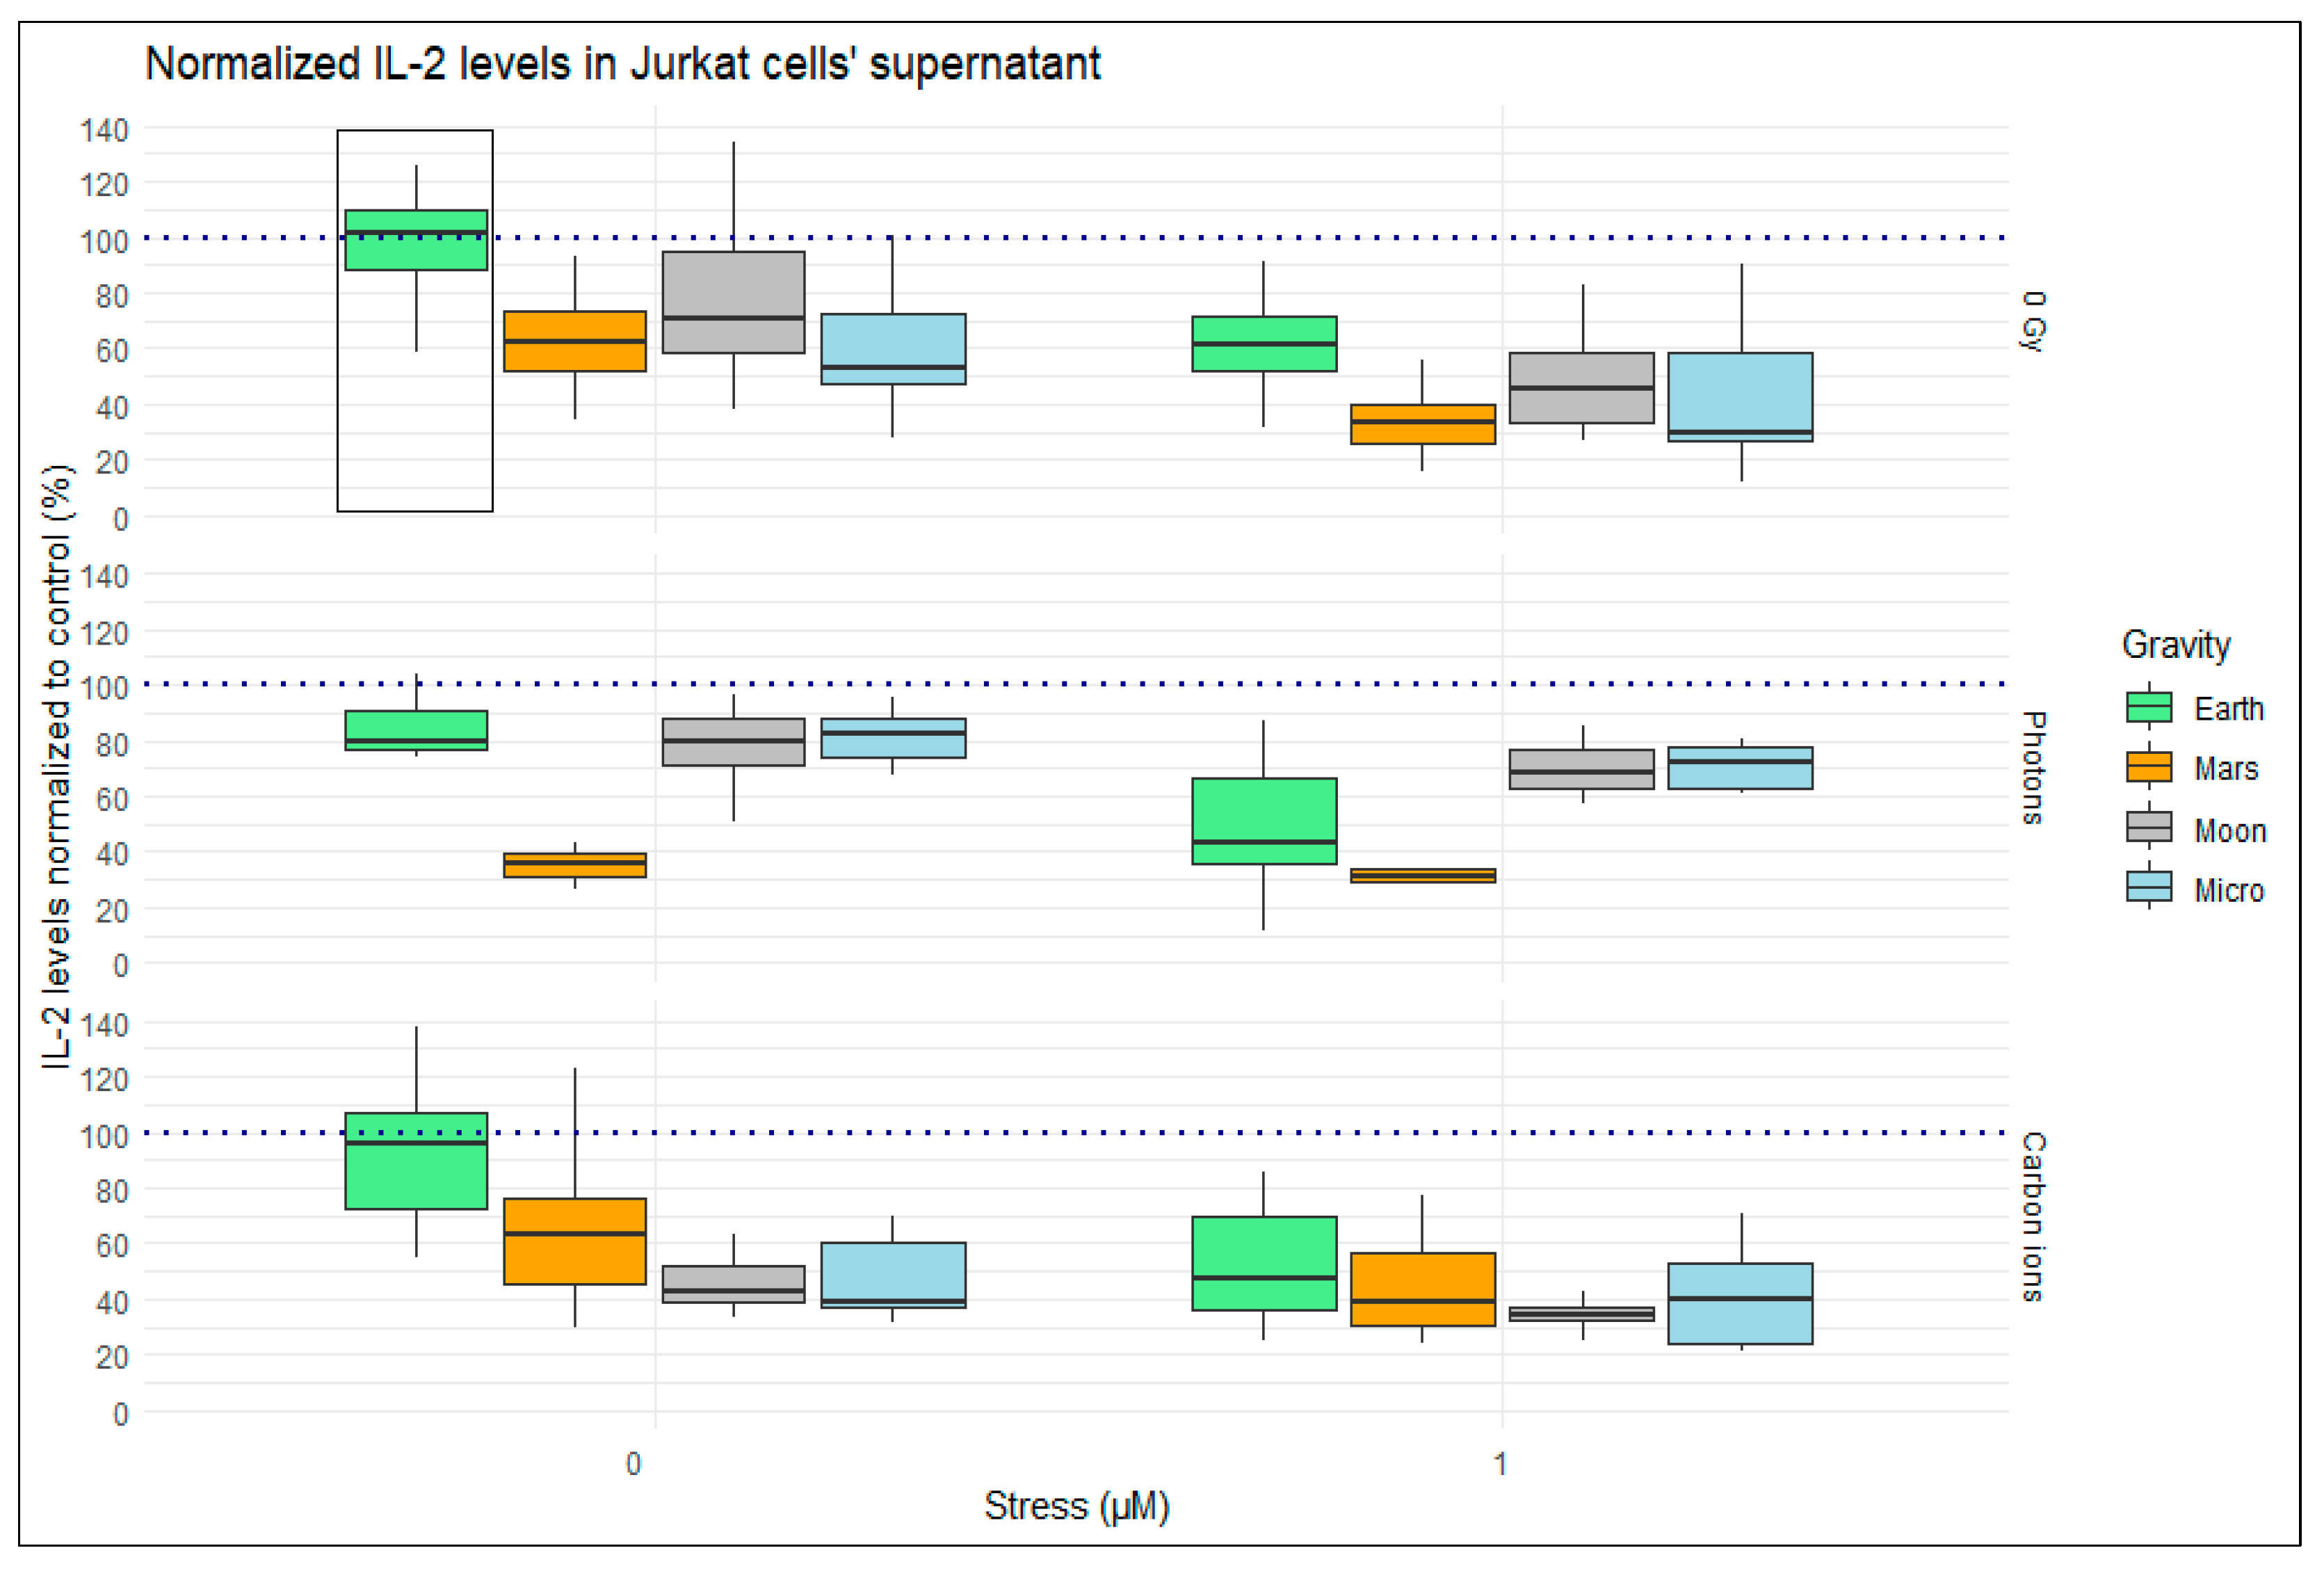
2.1. IL-2 Levels in the Supernatant of Jurkat Cells after 24 h Exposure to Simulated Space Conditions
2.1.1. Single Simulated Space Stressor Effect
2.1.2. Double Simulated Space Stressor Effects
2.1.3. Triple Simulated Space Stressor Effects
2.2. IL-2 Gene Expression in Jurkat Cells after 24 h Exposure to Simulates Space Conditions
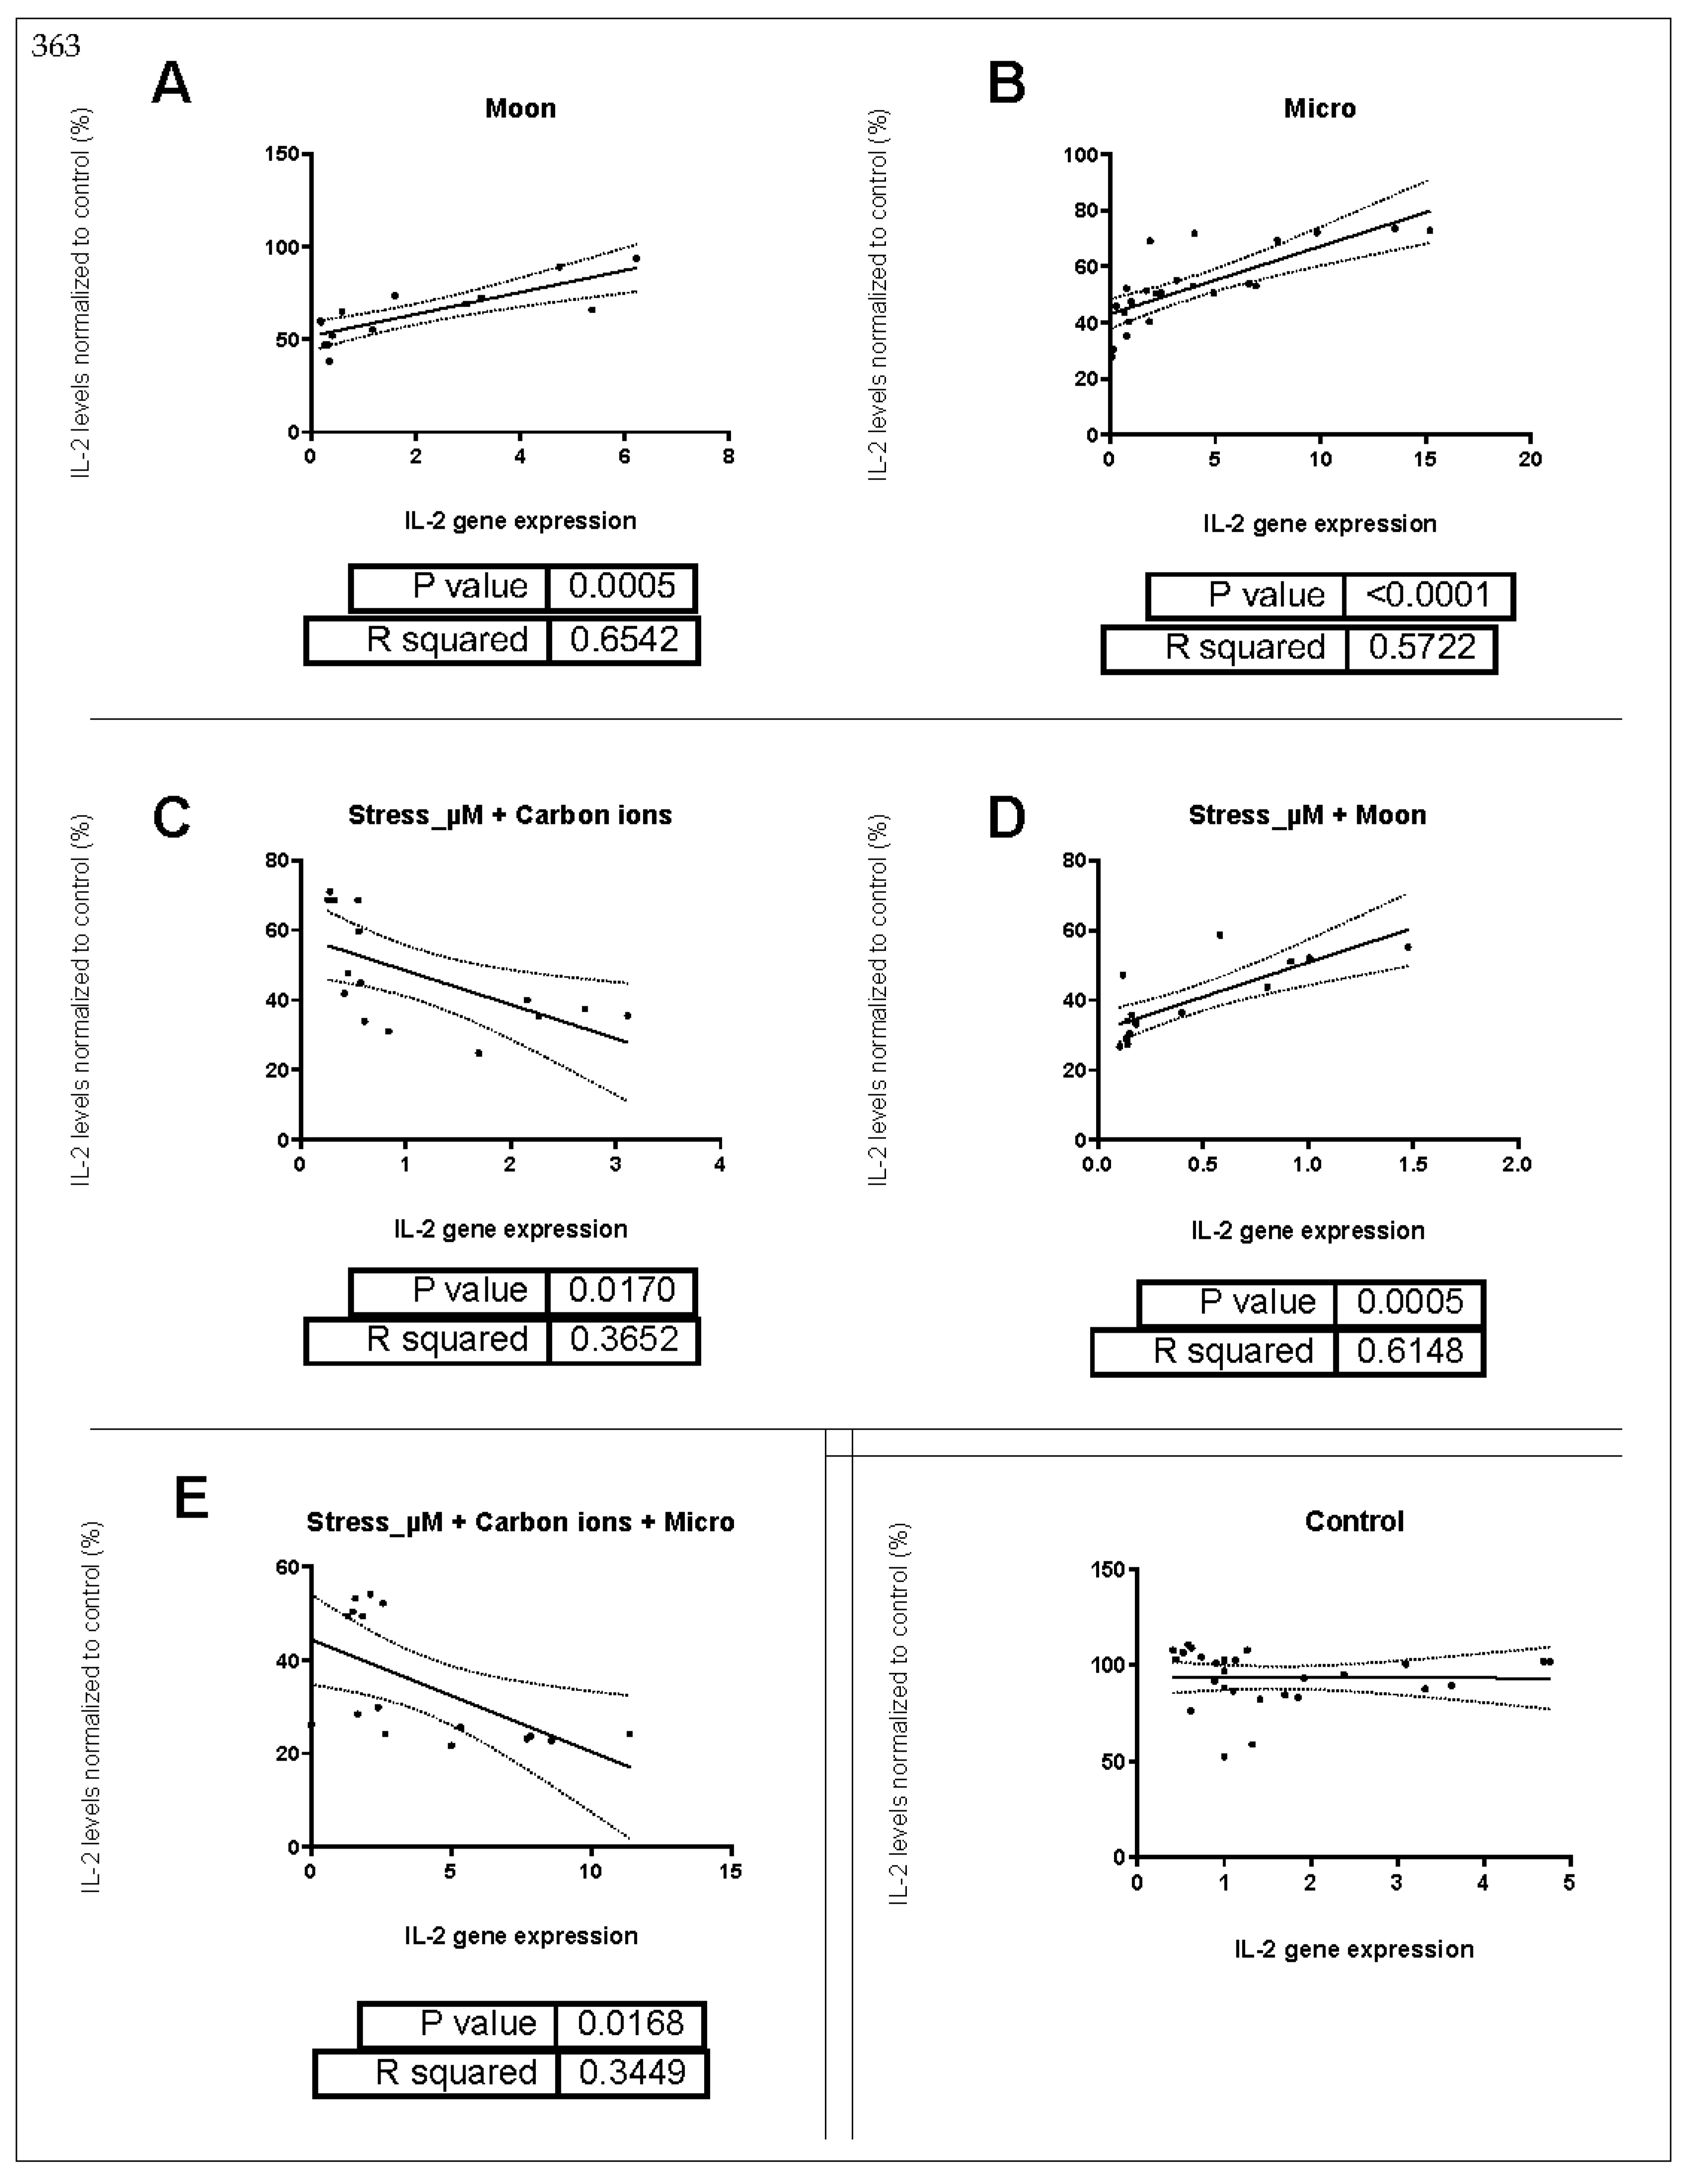
2.3. Correlation between IL-2 Gene Expression and Supernatant Protein Levels
3. Discussion
Limitations and Future Perspectives
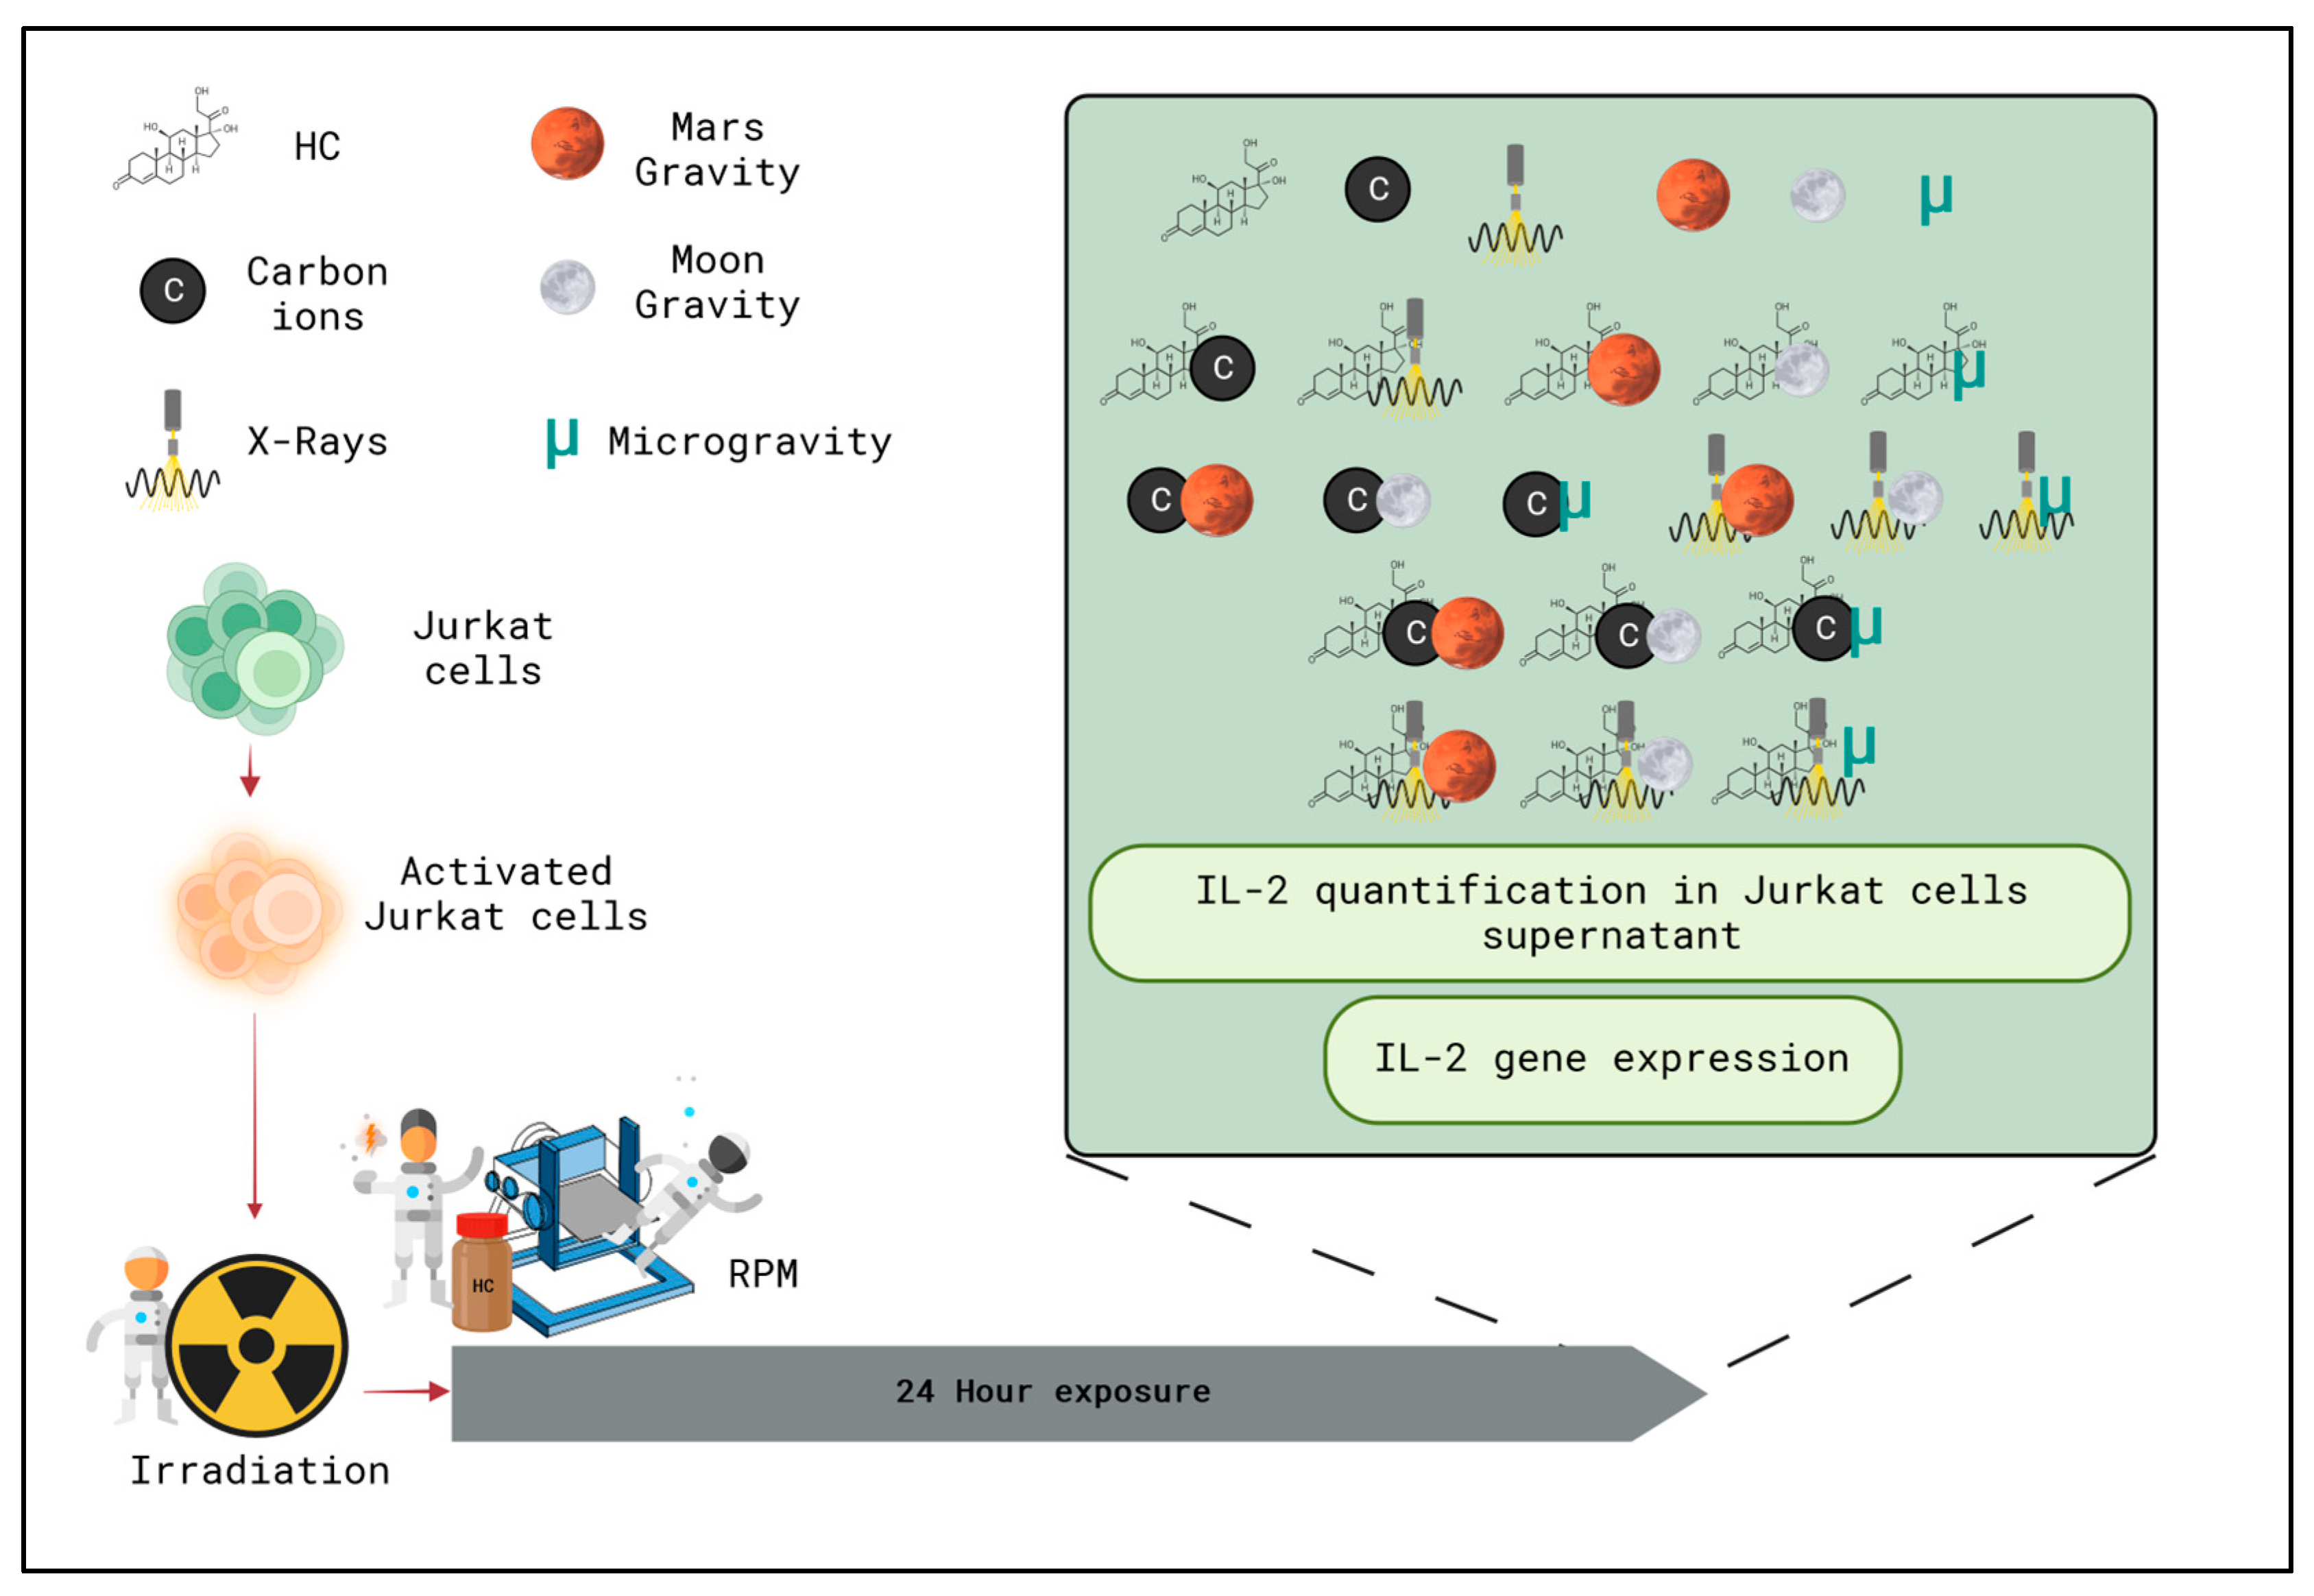
4. Materials and Methods
4.1. Cell Culture
4.2. Irradiation
4.3. ivDTH—Stimulation Assay
4.4. Simulated Altered Gravity
4.5. Hydrocortisone
4.6. ELISA
4.7. Real-Time qPCR
4.8. Data Analysis
5. Conclusions
Supplementary Materials
Author Contributions
Funding
Institutional Review Board Statement
Informed Consent Statement
Data Availability Statement
Acknowledgments
Conflicts of Interest
References
- Afshinnekoo, E.; Scott, R.T.; MacKay, M.J.; Pariset, E.; Cekanaviciute, E.; Barker, R.; Gilroy, S.; Hassane, D.; Smith, S.M.; Zwart, S.R.; et al. Fundamental Biological Features of Spaceflight: Advancing the Field to Enable Deep-Space Exploration. Cell 2020, 183, 1162–1184. [Google Scholar] [CrossRef]
- Krittanawong, C.; Singh, N.K.; Scheuring, R.A.; Urquieta, E.; Bershad, E.M.; Macaulay, T.R.; Kaplin, S.; Dunn, C.; Kry, S.F.; Russomano, T.; et al. Human Health during Space Travel: State-of-the-Art Review. Cells 2022, 12, 40. [Google Scholar] [CrossRef]
- Chancellor, J.; Nowadly, C.; Williams, J.; Aunon-Chancellor, S.; Chesal, M.; Looper, J.; Newhauser, W. Everything you wanted to know about space radiation but were afraid to ask. J. Environ. Sci. Health Part C 2021, 39, 113–128. [Google Scholar] [CrossRef] [PubMed]
- Durante, M.; Cucinotta, F.A. Physical basis of radiation protection in space travel. Rev. Mod. Phys. 2011, 83, 1245. [Google Scholar] [CrossRef]
- Durante, M. Space radiobiology on the Moon. Planet. Space Sci. 2012, 74, 72–77. [Google Scholar] [CrossRef]
- Durante, M.; Cucinotta, F.A. Heavy ion carcinogenesis and human space exploration. Nat. Rev. Cancer 2008, 8, 465–472. [Google Scholar] [CrossRef]
- Hellweg, C.E.; Arena, C.; Baatout, S.; Baselet, B.; Beblo-Vranesevic, K.; Caplin, N.; Coos, R.; Da Pieve, F.; De Micco, V.; Foray, N.; et al. Space Radiobiology. In Radiobiology Textbook; Baatout, S., Ed.; Springer International Publishing: Cham, Switzerland, 2023; pp. 503–569. [Google Scholar]
- Durante, M.; Kraft, G.; O’neill, P.; Reitz, G.; Sabatier, L.; Schneider, U. Preparatory study of a ground-based space radiobiology program in Europe. Adv. Space Res. 2006, 39, 1082–1086. [Google Scholar] [CrossRef]
- Sihver, L. Physics and biophysics experiments needed for improved risk assessment in space. Acta Astronaut. 2008, 63, 886–898. [Google Scholar] [CrossRef]
- Man, J.; Graham, T.; Squires-Donelly, G.; Laslett, A.L. The effects of microgravity on bone structure and function. npj Microgravity 2022, 8, 9. [Google Scholar] [CrossRef]
- Baran, R.; Marchal, S.; Campos, S.G.; Rehnberg, E.; Tabury, K.; Baselet, B.; Wehland, M.; Grimm, D.; Baatout, S. The Cardiovascular System in Space: Focus on In Vivo and In Vitro Studies. Biomedicines 2022, 10, 59. [Google Scholar] [CrossRef]
- Frippiat, J.-P.; Crucian, B.E.; de Quervain, D.J.-F.; Grimm, D.; Montano, N.; Praun, S.; Roozendaal, B.; Schelling, G.; Thiel, M.; Ullrich, O.; et al. Towards human exploration of space: The THESEUS review series on immunology research priorities. npj Microgravity 2016, 2, 16040. [Google Scholar] [CrossRef] [PubMed]
- Richter, C.; Braunstein, B.; Winnard, A.; Nasser, M.; Weber, T. Human Biomechanical and Cardiopulmonary Responses to Partial Gravity—A Systematic Review. Front. Physiol. 2017, 8, 583. [Google Scholar] [CrossRef] [PubMed]
- Borst, A.G.; van Loon, J.J.W.A. Technology and Developments for the Random Positioning Machine, RPM. Microgravity Sci. Technol. 2008, 21, 287. [Google Scholar] [CrossRef]
- Wuest, S.L.; Richard, S.; Kopp, S.; Grimm, D.; Egli, M. Simulated Microgravity: Critical Review on the Use of Random Positioning Machines for Mammalian Cell Culture. BioMed Res. Int. 2015, 2015, 971474. [Google Scholar] [CrossRef] [PubMed]
- Schwarzenberg, M.; Pippia, P.; Meloni, M.A.; Cossu, G.; Cogoli-Greuter, M.; Cogoli, A. Signal transduction in T lymphocytes—A comparison of the data from space, the free fall machine and the random positioning machine. Adv. Space Res. 1999, 24, 793–800. [Google Scholar] [CrossRef] [PubMed]
- Elverson, C.A.; Wilson, M.E. Cortisol: Circadian Rhythm and Response to a Stressor. Newborn Infant Nurs. Rev. 2005, 5, 159–169. [Google Scholar] [CrossRef]
- Ulrich-Lai, Y.M.; Herman, J.P. Neural regulation of endocrine and autonomic stress responses. Nat. Rev. Neurosci. 2009, 10, 397–409. [Google Scholar] [CrossRef] [PubMed]
- Leach, C.S.; Cintrón, N.M.; Krauhs, J.M. Metabolic changes observed in astronauts. J. Clin. Pharmacol. 1991, 31, 921–927. [Google Scholar] [CrossRef]
- Stowe, R.P.; Sams, C.F.; Pierson, D.L. Adrenocortical and immune responses following short- and long-duration spaceflight. Aviat. Space Environ. Med. 2011, 82, 627–634. [Google Scholar] [CrossRef] [PubMed]
- Stowe, R.P.; Sams, C.F.; Pierson, D.L. Effects of mission duration on neuroimmune responses in astronauts. Aviat. Space Environ. Med. 2003, 74, 1281–1284. [Google Scholar]
- Glaser, R.; MacCallum, R.C.; Laskowski, B.F.; Malarkey, W.B.; Sheridan, J.F.; Kiecolt-Glaser, J.K. Evidence for a shift in the Th-1 to Th-2 cytokine response associated with chronic stress and aging. J. Gerontol. A Biol. Sci. Med. Sci. 2001, 56, M477–M482. [Google Scholar] [CrossRef]
- Vitlic, A.; Lord, J.M.; Phillips, A.C. Stress, ageing and their influence on functional, cellular and molecular aspects of the immune system. Age 2014, 36, 9631. [Google Scholar] [CrossRef] [PubMed]
- Lewis, D.E.; Blutt, S.E. 2—Organization of the Immune System. In Clinical Immunology, 5th ed.; Rich, R.R., Fleisher, T.A., Shearer, W.T., Schroeder, H.W., Frew, A.J., Weyand, C.M., Eds.; Elsevier: London, UK, 2019; pp. 19–38.e1. [Google Scholar]
- Peterson, E.J.; Maltzman, J.S. 12—T-Cell Activation and Tolerance. In Clinical Immunology, 5th ed.; Rich, R.R., Fleisher, T.A., Shearer, W.T., Schroeder, H.W., Frew, A.J., Weyand, C.M., Eds.; Elsevier: London, UK, 2019; pp. 183–196.e1. [Google Scholar]
- Farber, D.L. Form and function for T cells in health and disease. Nat. Rev. Immunol. 2020, 20, 83–84. [Google Scholar] [CrossRef] [PubMed]
- Gridley, D.S.; Slater, J.M.; Luo-Owen, X.; Rizvi, A.; Chapes, S.K.; Stodieck, L.S.; Ferguson, V.L.; Pecaut, M.J.; Spielmann, G.; Agha, N.; et al. Spaceflight effects on T lymphocyte distribution, function and gene expression. J. Appl. Physiol. 2009, 106, 194–202. [Google Scholar] [CrossRef] [PubMed]
- Crucian, B.E.; Chouker, A.; Simpson, R.J.; Mehta, S.; Marshall, G.; Smith, S.M.; Zwart, S.R.; Heer, M.; Ponomarev, S.; Whitmire, A.; et al. Immune System Dysregulation During Spaceflight: Potential Countermeasures for Deep Space Exploration Missions. Front. Immunol. 2018, 9, 1437. [Google Scholar] [CrossRef] [PubMed]
- Luo, H.; Wang, C.; Feng, M.; Zhao, Y. Microgravity inhibits resting T cell immunity in an exposure time-dependent manner. Int. J. Med. Sci. 2013, 11, 87–96. [Google Scholar] [CrossRef] [PubMed]
- Thiel, C.S.; Lauber, B.A.; Polzer, J.; Ullrich, O. Time course of cellular and molecular regulation in the immune system in altered gravity: Progressive damage or adaptation? REACH 2017, 5, 22–32. [Google Scholar] [CrossRef]
- Chang, T.T.; Walther, I.; Li, C.-F.; Boonyaratanakornkit, J.; Galleri, G.; Meloni, M.A.; Pippia, P.; Cogoli, A.; Hughes-Fulford, M. The Rel/NF-κB pathway and transcription of immediate early genes in T cell activation are inhibited by microgravity. J. Leukoc. Biol. 2012, 92, 1133–1145. [Google Scholar] [CrossRef]
- Paulsen, K.; Thiel, C.; Timm, J.; Schmidt, P.M.; Huber, K.; Tauber, S.; Hemmersbach, R.; Seibt, D.; Kroll, H.; Grote, K.H.; et al. Microgravity-induced alterations in signal transduction in cells of the immune system. Acta Astronaut. 2010, 67, 1116–1125. [Google Scholar] [CrossRef]
- Tauber, S.; Hauschild, S.; Paulsen, K.; Gutewort, A.; Raig, C.; Hürlimann, E.; Biskup, J.; Philpot, C.; Lier, H.; Engelmann, F.; et al. Signal Transduction in Primary Human T Lymphocytes in Altered Gravity During Parabolic Flight and Clinostat Experiments. Cell. Physiol. Biochem. 2015, 35, 1034–1051. [Google Scholar] [CrossRef]
- Martinez, E.M.; Yoshida, M.C.; Candelario, T.L.T.; Hughes-Fulford, M. Spaceflight and simulated microgravity cause a significant reduction of key gene expression in early T-cell activation. Am. J. Physiol. Regul. Integr. Comp. Physiol. 2015, 308, R480–R488. [Google Scholar] [CrossRef] [PubMed]
- Abraham, R.T.; Weiss, A. Jurkat T cells and development of the T-cell receptor signalling paradigm. Nat. Rev. Immunol. 2004, 4, 301–308. [Google Scholar] [CrossRef] [PubMed]
- Kutner, M.H.; Nachtsheim, C.; Neter, J. Applied Linear Regression Models; McGraw-Hill Education/Asia: Singapore, 2018. [Google Scholar]
- Huber, P.J.; Ronchetti, E.M. Robust Statistics; Wiley: Hoboken, NJ, USA, 2011. [Google Scholar]
- Pfaffl, M.W. A new mathematical model for relative quantification in real-time RT-PCR. Nucleic Acids Res. 2001, 29, e45. [Google Scholar] [CrossRef] [PubMed]
- Limouse, M.; Manie, S.; Konstantinova, I.; Ferrua, B.; Schaffar, L. Inhibition of phorbol ester-induced cell activation in microgravity. Exp. Cell Res. 1991, 197, 82–86. [Google Scholar] [CrossRef]
- Crucian, B.E.; Cubbage, M.L.; Sams, C.F. Altered Cytokine Production by Specific Human Peripheral Blood Cell Subsets Immediately Following Space Flight. J. Interferon Cytokine Res. 2000, 20, 547–556. [Google Scholar] [CrossRef]
- Crucian, B.E.; Stowe, R.P.; Pierson, D.L.; Sams, C.F. Immune System Dysregulation Following Short- vs Long-Duration Spaceflight. Aviat. Space Environ. Med. 2008, 79, 835–843. [Google Scholar] [CrossRef] [PubMed]
- Radstake, W.E.; Gautam, K.; Miranda, S.; Vermeesen, R.; Tabury, K.; Rehnberg, E.; Buset, J.; Janssen, A.; Leysen, L.; Neefs, M.; et al. The Effects of Combined Exposure to Simulated Microgravity, Ionizing Radiation, and Cortisol on the In Vitro Wound Healing Process. Cells 2023, 12, 246. [Google Scholar] [CrossRef]
- Canova, S.; Fiorasi, F.; Mognato, M.; Grifalconi, M.; Reddi, E.; Russo, A.; Celotti, L. “Modeled microgravity” affects cell response to ionizing radiation and increases genomic damage. Radiat. Res. 2005, 163, 191–199. [Google Scholar] [CrossRef]
- Yamanouchi, S.; Rhone, J.; Mao, J.H.; Fujiwara, K.; Saganti, P.B.; Takahashi, A.; Hada, M. Simultaneous Exposure of Cultured Human Lymphoblastic Cells to Simulated Microgravity and Radiation Increases Chromosome Aberrations. Life 2020, 10, 187. [Google Scholar] [CrossRef]
- Sanzari, J.K.; Romero-Weaver, A.L.; James, G.; Krigsfeld, G.; Lin, L.; Diffenderfer, E.S.; Kennedy, A.R. Leukocyte Activity Is Altered in a Ground Based Murine Model of Microgravity and Proton Radiation Exposure. PLoS ONE 2013, 8, e71757. [Google Scholar] [CrossRef]
- ElGindi, M.; Sapudom, J.; Laws, P.; Garcia-Sabaté, A.; Daqaq, M.F.; Teo, J. 3D microenvironment attenuates simulated microgravity-mediated changes in T cell transcriptome. Cell. Mol. Life Sci. 2022, 79, 508. [Google Scholar] [CrossRef]
- Taves, M.D.; Ashwell, J.D. Glucocorticoids in T cell development, differentiation and function. Nat. Rev. Immunol. 2021, 21, 233–243. [Google Scholar] [CrossRef] [PubMed]
- Chen, M.; Singh, A.K.; Repasky, E.A. Highlighting the Potential for Chronic Stress to Minimize Therapeutic Responses to Radiotherapy through Increased Immunosuppression and Radiation Resistance. Cancers 2020, 12, 3853. [Google Scholar] [CrossRef] [PubMed]
- Hellweg, C.E. The Nuclear Factor κB pathway: A link to the immune system in the radiation response. Cancer Lett. 2015, 368, 275–289. [Google Scholar] [CrossRef] [PubMed]
- Hellweg, C.E.; Baumstark-Khan, C.; Schmitz, C.; Lau, P.; Meier, M.M.; Testard, I.; Berger, T.; Reitz, G. Activation of the Nuclear Factor κB pathway by heavy ion beams of different linear energy transfer. Int. J. Radiat. Biol. 2011, 87, 954–963. [Google Scholar] [CrossRef]
- Lin, Z.; Fillmore, G.C.; Um, T.-H.; Elenitoba-Johnson, K.S.J.; Lim, M.S. Comparative Microarray Analysis of Gene Expression During Activation of Human Peripheral Blood T Cells and Leukemic Jurkat T Cells. Lab. Investig. 2003, 83, 765–776. [Google Scholar] [CrossRef]
- Shyer, J.A.; Flavell, R.A.; Bailis, W. Metabolic signaling in T cells. Cell Res. 2020, 30, 649–659. [Google Scholar] [CrossRef]
- Gioia, L.; Siddique, A.; Head, S.R.; Salomon, D.R.; Su, A.I. A genome-wide survey of mutations in the Jurkat cell line. BMC Genom. 2018, 19, 334. [Google Scholar] [CrossRef]
- Macho, L.; Koška, J.; Kšinantová, L.; Pacak, K.; Hoff, T.; Noskov, V.; Grigoriev, A.; Vigaš, M.; Kvetňanský, R. The response of endocrine system to stress loads during space flight in human subject. Adv. Space Res. 2003, 31, 1605–1610. [Google Scholar] [CrossRef]
- Sapolsky, R.M. Stress and the brain: Individual variability and the inverted-U. Nat. Neurosci. 2015, 18, 1344–1346. [Google Scholar] [CrossRef] [PubMed]
- Jain, J.; Loh, C.; Rao, A. Transcriptional regulation of the IL-2 gene. Curr. Opin. Immunol. 1995, 7, 333–342. [Google Scholar] [CrossRef]
- Kovanen, P.E.; Young, L.; Al-Shami, A.; Rovella, V.; Pise-Masison, C.A.; Radonovich, M.F.; Powell, J.; Fu, J.; Brady, J.N.; Munson, P.J.; et al. Global analysis of IL-2 target genes: Identification of chromosomal clusters of expressed genes. Int. Immunol. 2005, 17, 1009–1021. [Google Scholar] [CrossRef] [PubMed]
- Dietze, G.; Bartlett, D.; Cool, D.; Cucinotta, F.; Jia, X.; McAulay, I.; Pelliccioni, M.; Petrov, V.; Reitz, G.; Sato, T. ICRP, 123. Assessment of radiation exposure of astronauts in space. ICRP Publication 123. Ann. ICRP 2013, 42, 1–339. [Google Scholar] [CrossRef]
- Huff, J.L.; Poignant, F.; Rahmanian, S.; Khan, N.; Blakely, E.A.; Britten, R.A.; Chang, P.; Fornace, A.J.; Hada, M.; Kronenberg, A.; et al. Galactic cosmic ray simulation at the NASA space radiation laboratory—Progress, challenges and recommendations on mixed-field effects. Life Sci. Space Res. 2023, 36, 90–104. [Google Scholar] [CrossRef] [PubMed]
- Schuy, C.; Weber, U.; Durante, M. Hybrid Active-Passive Space Radiation Simulation Concept for GSI and the Future FAIR Facility. Front. Phys. 2020, 8, 337. [Google Scholar] [CrossRef]
- Durante, M.; Golubev, A.; Park, W.-Y.; Trautmann, C. Applied nuclear physics at the new high-energy particle accelerator facilities. Phys. Rep. 2019, 800, 1–37. [Google Scholar] [CrossRef]
- Acharya, M.M.; Baulch, J.E.; Klein, P.; Baddour, A.A.D.; Apodaca, L.A.; Kramár, E.A.; Alikhani, L.; Garcia, C.; Angulo, M.C.; Batra, R.S.; et al. New Concerns for Neurocognitive Function during Deep Space Exposures to Chronic, Low Dose-Rate, Neutron Radiation. eNeuro 2019, 6, ENEURO.0094-19.2019. [Google Scholar] [CrossRef]
- Manger, B.; Hardy, K.J.; Weiss, A.; Stobo, J.D. Differential effect of cyclosporin A on activation signaling in human T cell lines. J. Clin. Investig. 1986, 77, 1501–1506. [Google Scholar] [CrossRef]
- Weiss, A.; Wiskocil, R.L.; Stobo, J.D. The role of T3 surface molecules in the activation of human T cells: A two-stimulus requirement for IL 2 production reflects events occurring at a pre-translational level. J. Immunol. 1984, 133, 123–128. [Google Scholar] [CrossRef] [PubMed]
- Chen, L.; Flies, D.B. Molecular mechanisms of T cell co-stimulation and co-inhibition. Nat. Rev. Immunol. 2013, 13, 227–242. [Google Scholar] [CrossRef]
- Livak, K.J.; Schmittgen, T.D. Analysis of relative gene expression data using real-time quantitative PCR and the 2(-Delta Delta C(T)) Method. Methods 2001, 25, 402–408. [Google Scholar] [CrossRef] [PubMed]


| Radiation Exposure | Concentration of HC (Stress) | Gravity |
|---|---|---|
| 0 Gy | 0 µM | Earth 1 g |
| 1 Gy X-rays (photons) | 1 µM | Mars~0.38 g |
| 1 Gy carbon ions | Moon~0.17 g | |
| Micro~0.01 g |
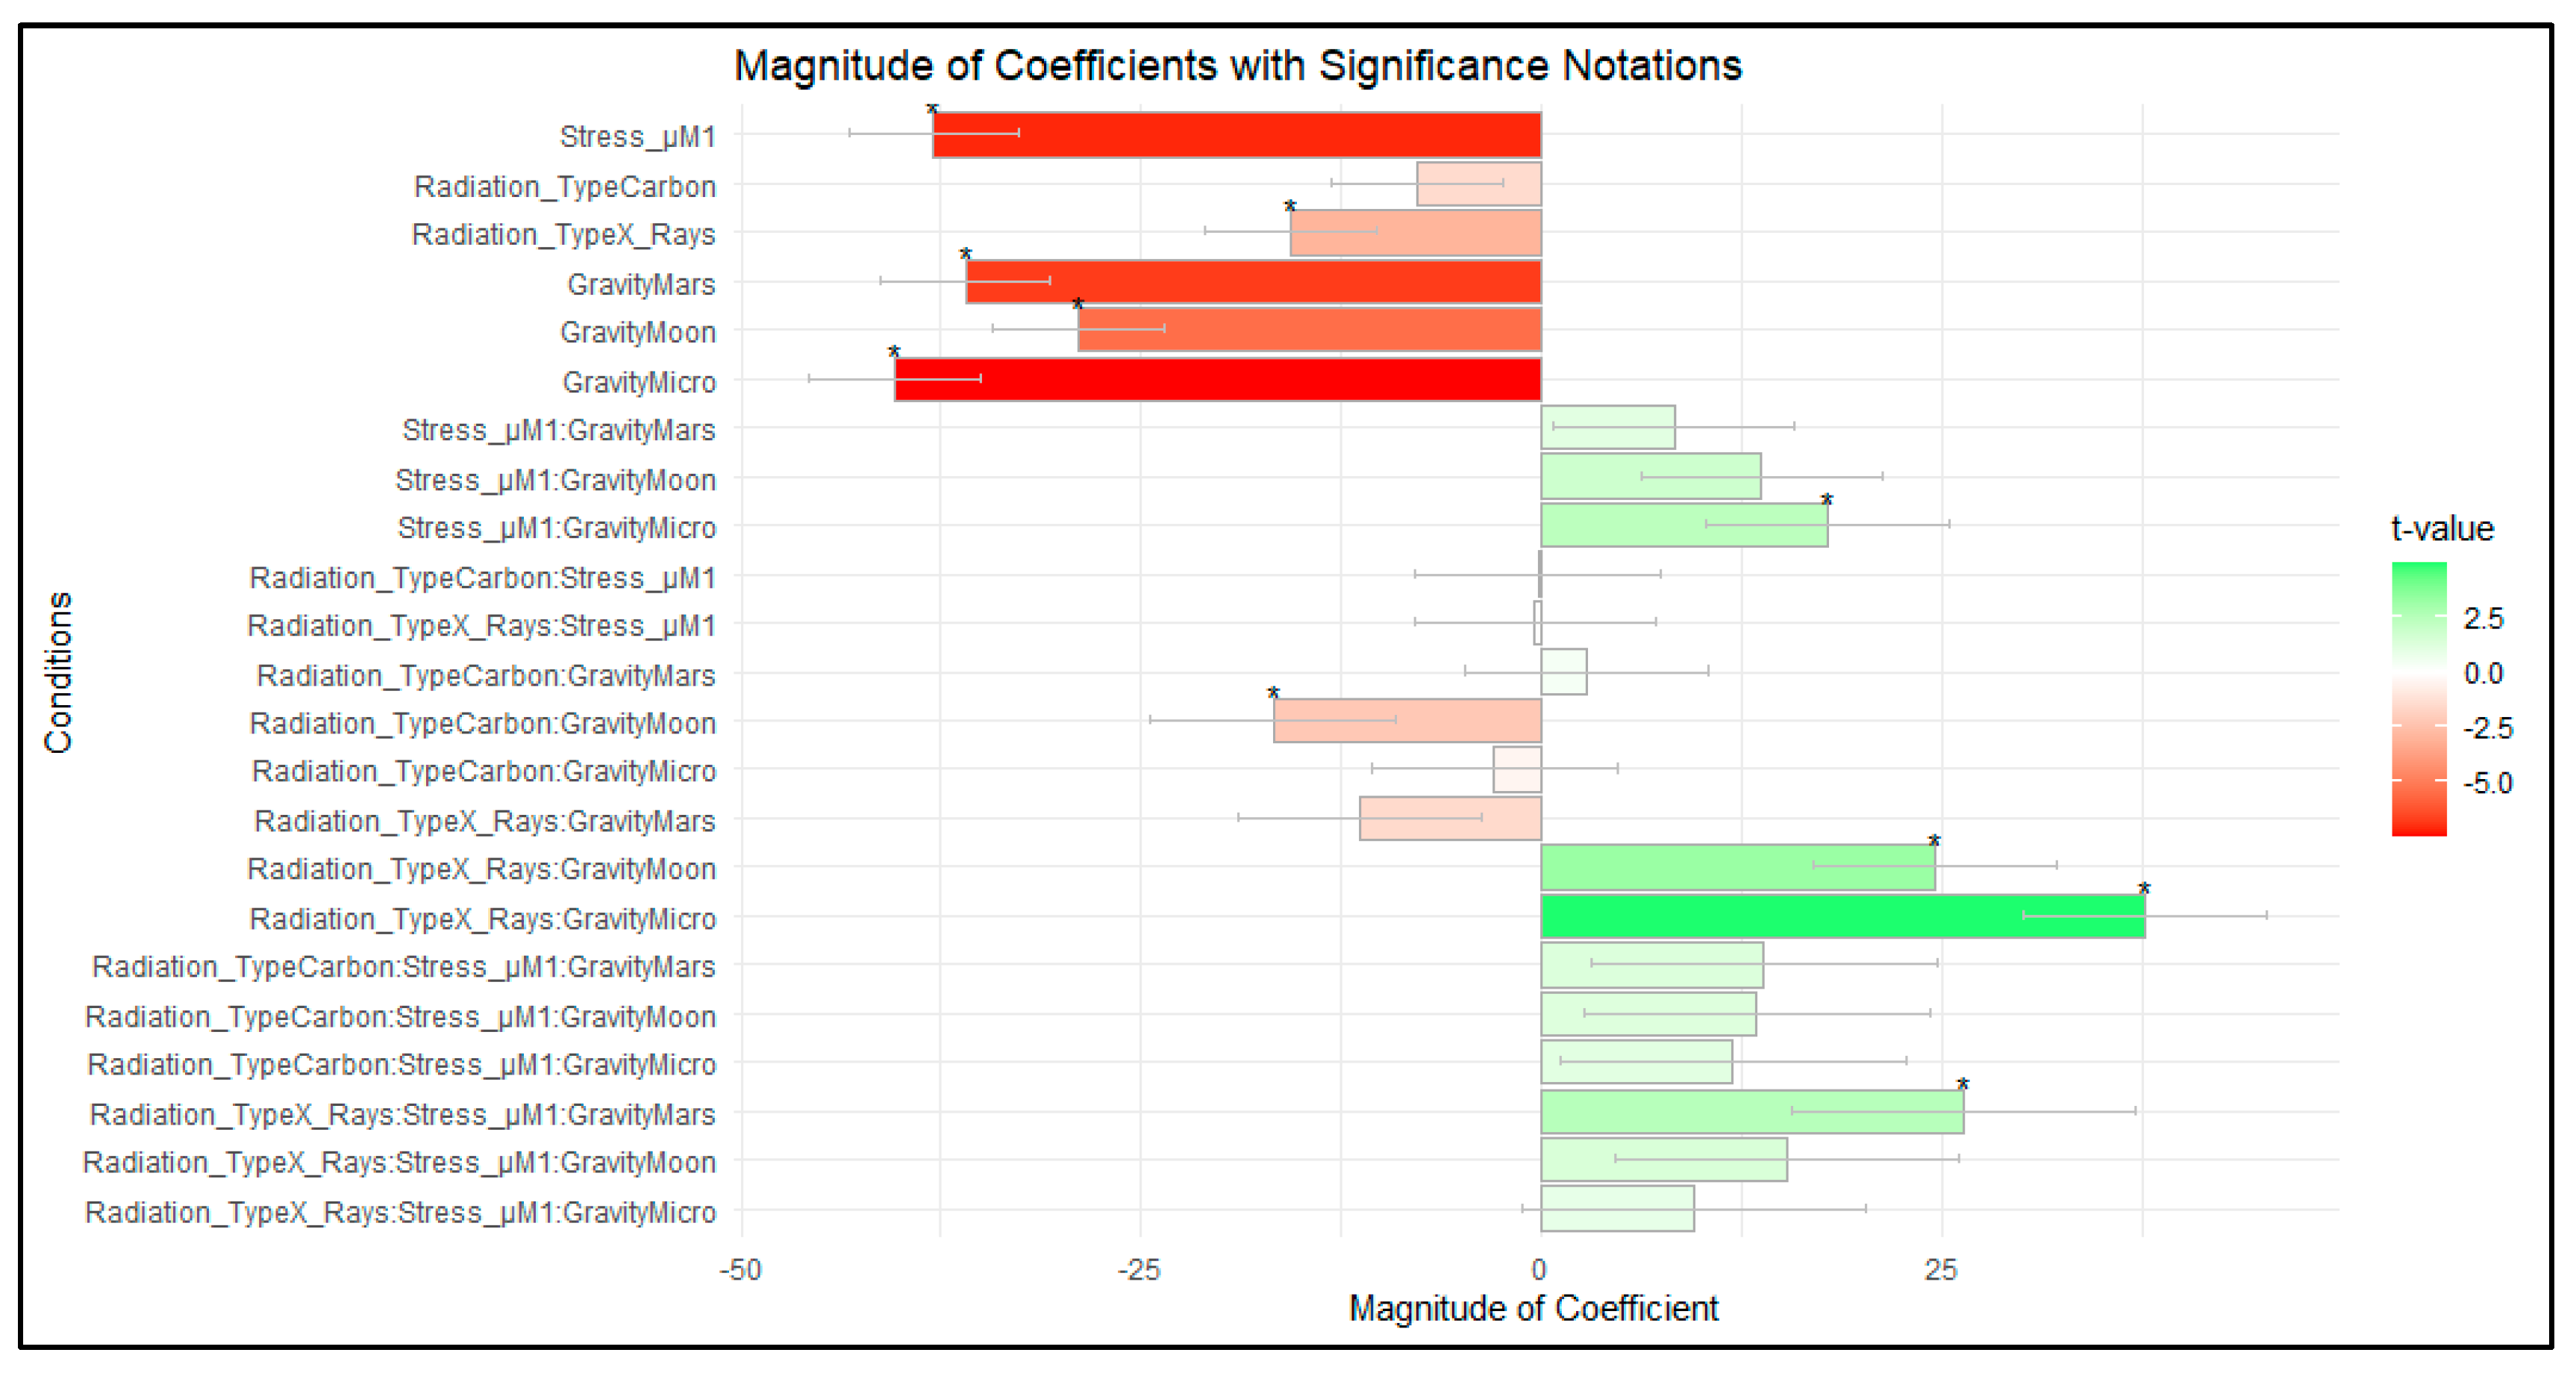
| Coefficient Value | Std. Error | t Value | ||
|---|---|---|---|---|
| Carbon ions | −7.7845 | 5.3472 | −1.4558 | |
| Photons | −15.7117 | 5.3472 | −2.9383 | * |
| Stress µM | −37.9513 | 5.3472 | −7.0975 | * |
| Mars | −36.0043 | 5.3472 | −6.7333 | * |
| Moon | −28.9804 | 5.3472 | −5.4198 | * |
| Micro | −40.4247 | 5.3931 | −7.4957 | * |
| Mars—Stress µM | 8.2061 | 7.562 | 1.0852 | |
| Moon—Stress µM | 13.6749 | 7.562 | 1.8084 | |
| Micro—Stress µM | 17.86 | 7.5946 | 2.3517 | * |
| Carbon ions—Stress µM | −0.2715 | 7.6116 | −0.0357 | |
| Photons—Stress µM | −0.4461 | 7.562 | −0.059 | |
| Carbon ions—Mars | 2.742 | 7.6144 | 0.3601 | |
| Carbon ions—Moon | −16.7909 | 7.6663 | −2.1902 | * |
| Carbon ions—Micro | −3.0143 | 7.6439 | −0.3943 | |
| Photons—Mars | −11.3448 | 7.562 | −1.5002 | |
| Photons—Moon | 24.4772 | 7.562 | 3.2368 | * |
| Photons—Micro | 37.5884 | 7.5946 | 4.9494 | * |
| Carbon ion—Mars—Stress µM | 13.8434 | 10.7664 | 1.2858 | |
| Carbon ions—Moon—Stress µM | 13.3951 | 10.8032 | 1.2399 | |
| Carbon ions—Micro—Stress µM | 11.9049 | 10.7873 | 1.1036 | |
| Photons—Mars—Stress µM | 26.3041 | 10.6943 | 2.4596 | * |
| Photons—Moon—Stress µM | 15.231 | 10.6943 | 1.4242 | |
| Photons—Micro—Stress µM | 9.4366 | 10.7173 | 0.8805 |
| Coefficient Value | Std. Error | t Value | ||
|---|---|---|---|---|
| Carbon ions | 0.0511 | 0.2608 | 0.1958 | |
| Photons | −0.1743 | 0.2608 | −0.6682 | |
| Stress µM | −0.2668 | 0.2608 | −1.023 | |
| Mars | 0.002 | 0.2608 | 0.0077 | |
| Moon | −0.5274 | 0.2608 | −2.0222 | * |
| Micro | 0.4839 | 0.2608 | 1.8556 | |
| Mars—Stress µM | −0.3441 | 0.3688 | −0.9329 | |
| Moon—Stress µM | −0.0157 | 0.3688 | −0.0426 | |
| Micro—Stress µM | 1.2016 | 0.3688 | 3.2579 | * |
| Carbon ions—Stress µM | −0.1111 | 0.3688 | −0.3011 | |
| Photons—Stress µM | 0.0027 | 0.3688 | 0.0072 | |
| Carbon ions—Mars | −0.5645 | 0.3688 | −1.5304 | |
| Carbon ions—Moon | −0.0096 | 0.3688 | −0.026 | |
| Carbon ions—Micro | 0.617 | 0.3688 | 1.6727 | |
| Photons—Mars | −0.1429 | 0.3688 | −0.3876 | |
| Photons—Moon | −0.2765 | 0.3688 | −0.7496 | |
| Photons—Micro | −0.8147 | 0.3688 | −2.2089 | * |
| Carbon ions—Mars—Stress µM | 0.6473 | 0.5216 | 1.241 | |
| Carbon ions—Moon—Stress µM | 0.6935 | 0.5216 | 1.3295 | |
| Carbon ions—Micro—Stress µM | −1.1722 | 0.5216 | −2.2473 | * |
| Photons—Mars—Stress µM | 0.2568 | 0.5216 | 0.4923 | |
| Photons—Moon—Stress µM | 0.0872 | 0.5216 | 0.1671 | |
| Photons—Micro—Stress µM | −1.2668 | 0.5216 | −2.4287 | * |
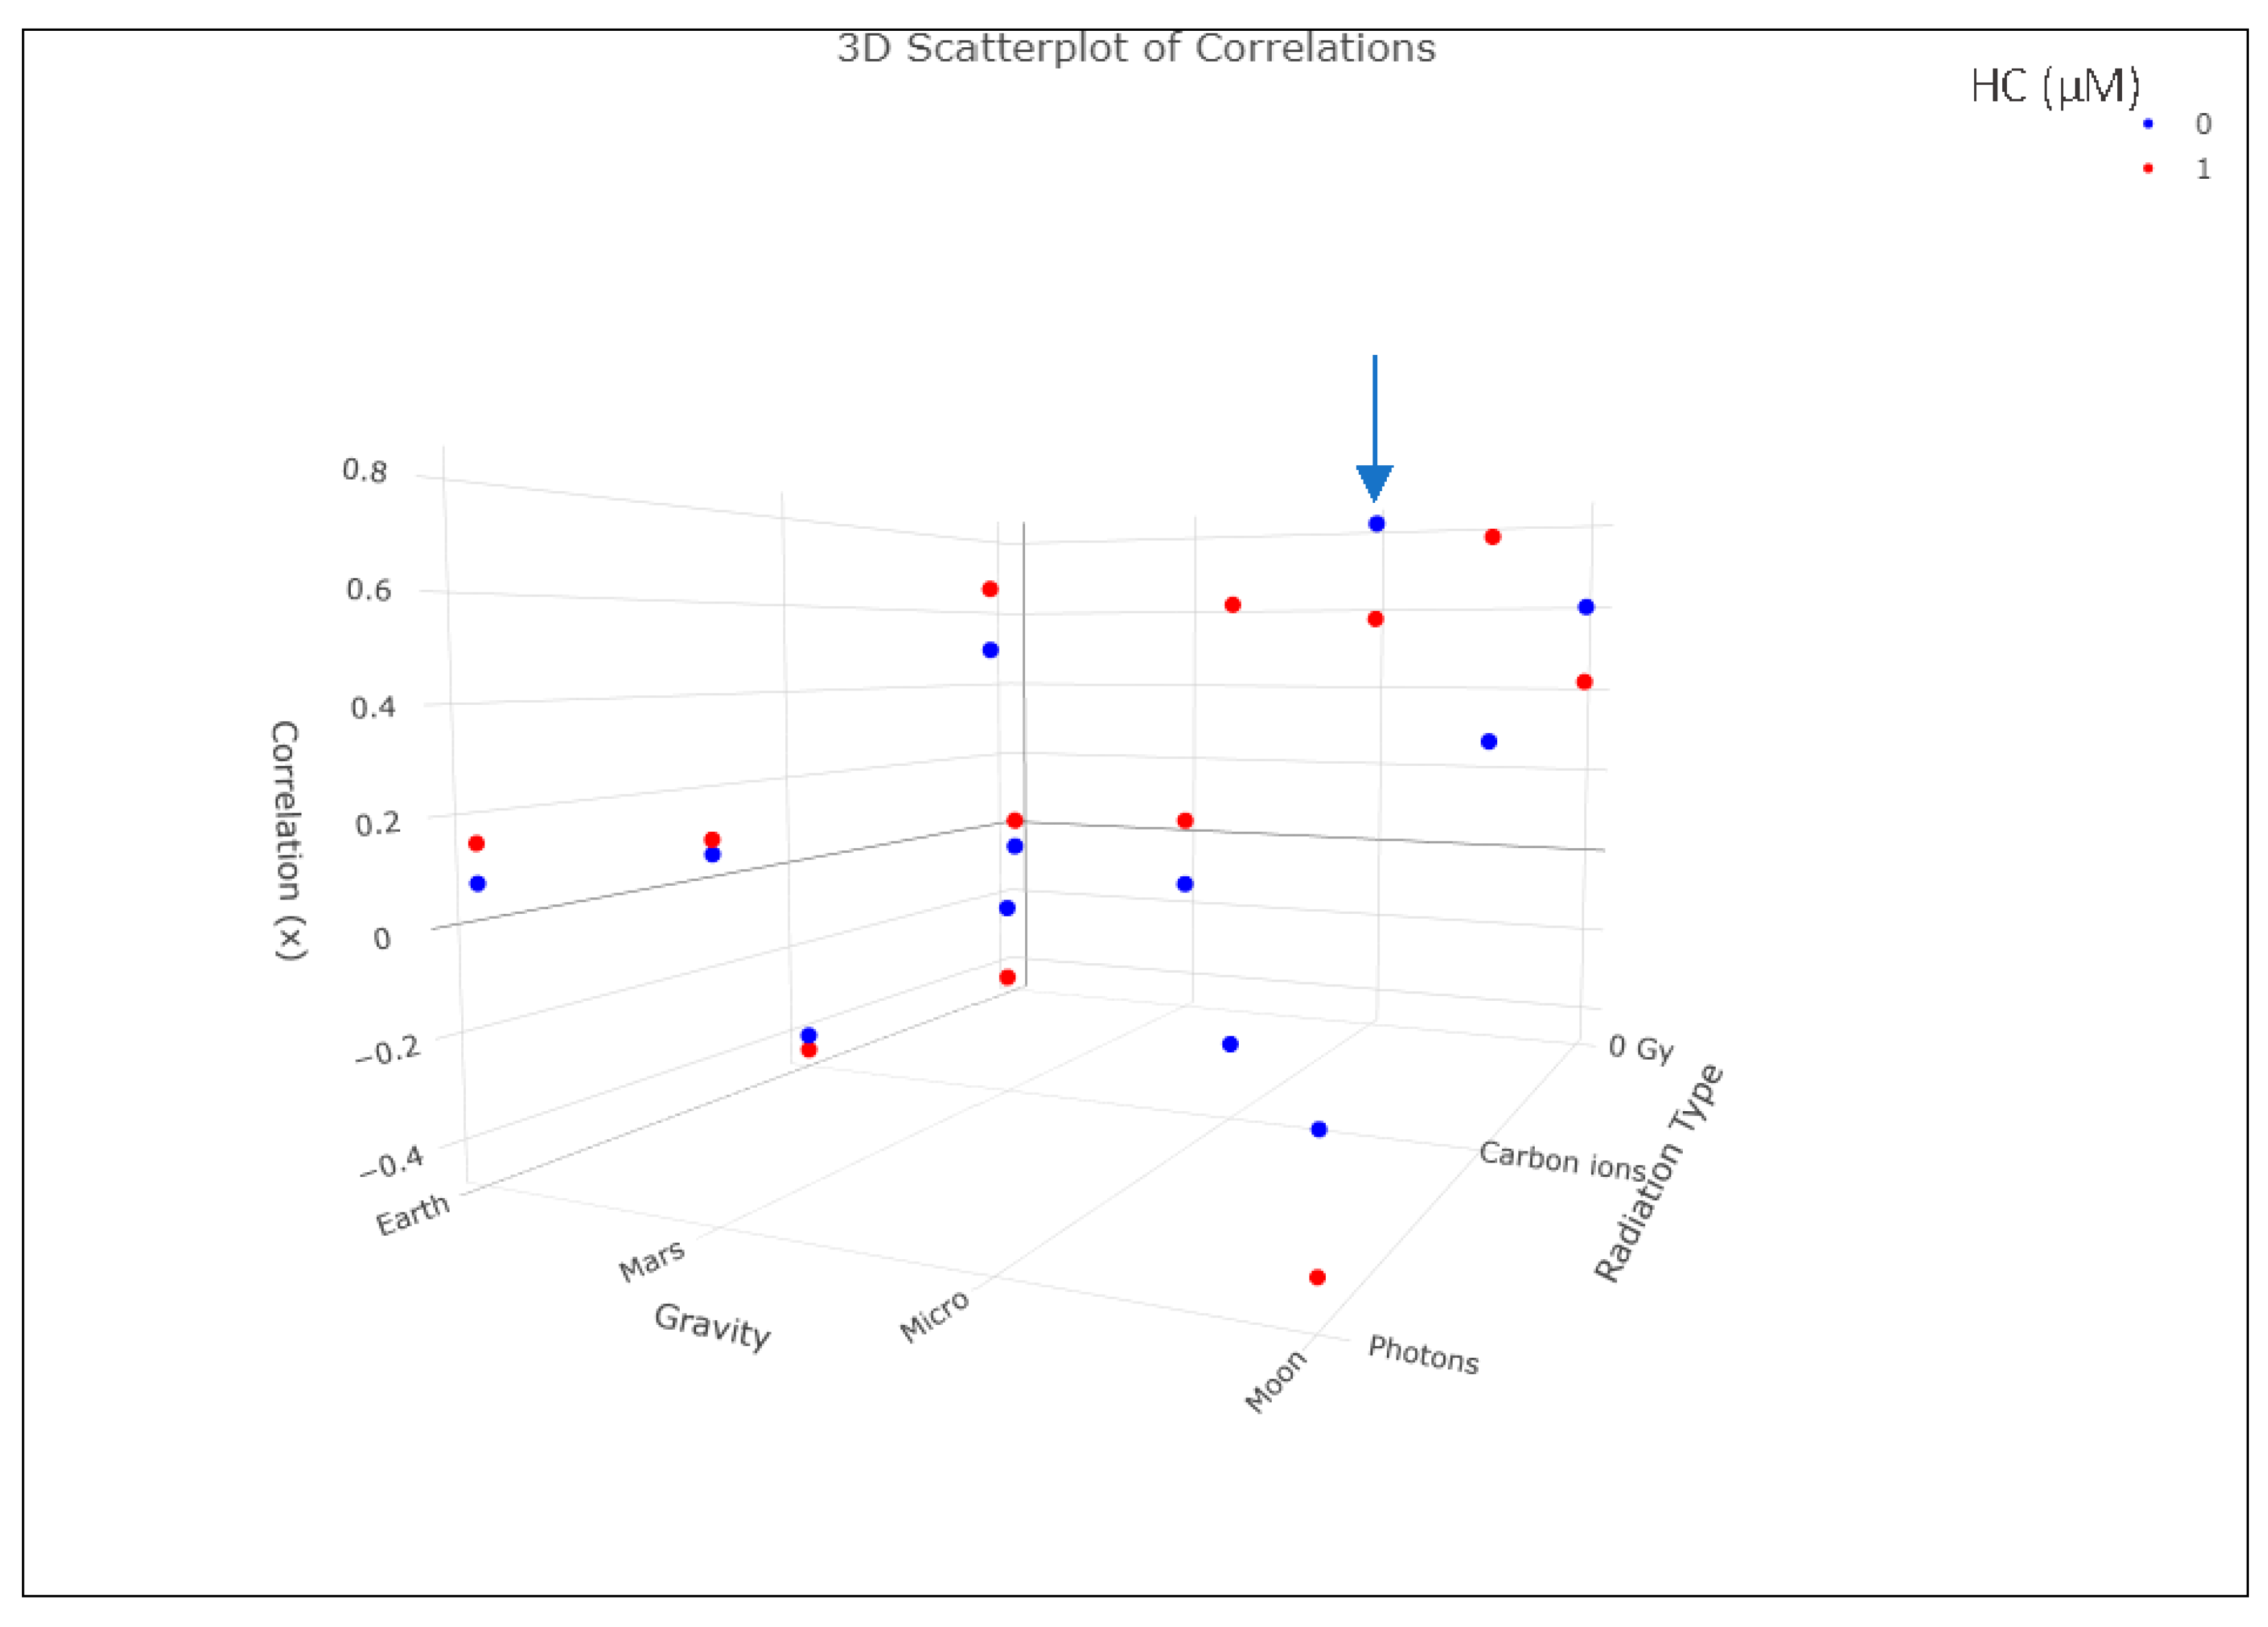
| Radiation_Type | Stress_µM | Gravity | Correlation |
|---|---|---|---|
| 0 Gy | 0 | Earth | −0.06304529 |
| Carbon ions | 0 | Earth | −0.40766668 |
| Photons | 0 | Earth | 0.07761725 |
| 0 Gy | 0 | Mars | −0.1410919 |
| Carbon ions | 0 | Mars | −0.0699926 |
| Photons | 0 | Mars | 0.15788835 |
| 0 Gy | 0 | Micro | →0.81937225 |
| Carbon ions | 0 | Micro | −0.32210807 |
| Photons | 0 | Micro | 0.49734382 |
| 0 Gy | 0 | Moon | 0.60214769 |
| Carbon ions | 0 | Moon | 0.322216 |
| Photons | 0 | Moon | −0.18010503 |
| 0 Gy | 1 | Earth | 0.01094268 |
| Carbon ions | 1 | Earth | −0.44159913 |
| Photons | 1 | Earth | 0.15052512 |
| 0 Gy | 1 | Mars | 0.03330089 |
| Carbon ions | 1 | Mars | −0.22493537 |
| Photons | 1 | Mars | 0.18267156 |
| 0 Gy | 1 | Micro | 0.57702244 |
| Carbon ions | 1 | Micro | 0.58951685 |
| Photons | 1 | Micro | 0.589298 |
| 0 Gy | 1 | Moon | 0.4198696 |
| Carbon ions | 1 | Moon | 0.71189189 |
| Photons | 1 | Moon | −0.39601785 |
Disclaimer/Publisher’s Note: The statements, opinions and data contained in all publications are solely those of the individual author(s) and contributor(s) and not of MDPI and/or the editor(s). MDPI and/or the editor(s) disclaim responsibility for any injury to people or property resulting from any ideas, methods, instructions or products referred to in the content. |
© 2023 by the authors. Licensee MDPI, Basel, Switzerland. This article is an open access article distributed under the terms and conditions of the Creative Commons Attribution (CC BY) license (https://creativecommons.org/licenses/by/4.0/).
Share and Cite
Miranda, S.; Vermeesen, R.; Radstake, W.E.; Parisi, A.; Ivanova, A.; Baatout, S.; Tabury, K.; Baselet, B. Lost in Space? Unmasking the T Cell Reaction to Simulated Space Stressors. Int. J. Mol. Sci. 2023, 24, 16943. https://doi.org/10.3390/ijms242316943
Miranda S, Vermeesen R, Radstake WE, Parisi A, Ivanova A, Baatout S, Tabury K, Baselet B. Lost in Space? Unmasking the T Cell Reaction to Simulated Space Stressors. International Journal of Molecular Sciences. 2023; 24(23):16943. https://doi.org/10.3390/ijms242316943
Chicago/Turabian StyleMiranda, Silvana, Randy Vermeesen, Wilhelmina E. Radstake, Alessio Parisi, Anna Ivanova, Sarah Baatout, Kevin Tabury, and Bjorn Baselet. 2023. "Lost in Space? Unmasking the T Cell Reaction to Simulated Space Stressors" International Journal of Molecular Sciences 24, no. 23: 16943. https://doi.org/10.3390/ijms242316943
APA StyleMiranda, S., Vermeesen, R., Radstake, W. E., Parisi, A., Ivanova, A., Baatout, S., Tabury, K., & Baselet, B. (2023). Lost in Space? Unmasking the T Cell Reaction to Simulated Space Stressors. International Journal of Molecular Sciences, 24(23), 16943. https://doi.org/10.3390/ijms242316943