Abstract
Renal cell cancer is the most common type of kidney cancer in adults, and clear cell renal cell carcinoma (ccRCC) is the most diagnosed type. T cell immunoglobulin and mucin-domain-containing-3 (TIM-3) belongs to immunological checkpoints that are key regulators of the immune response. One of the known TIM-3 ligands is galectin-9 (LGALS9). A limited number of studies have shown an association between TIM-3 polymorphisms and cancer risk in the Asian population; however, there is no study on the role of LGALS9 polymorphisms in cancer. The present study aimed to analyze the influence of TIM-3 and LGALS9 polymorphisms on susceptibility to ccRCC and patient overall survival (OS), with over ten years of observations. Using TaqMan probes, ARMS–PCR, and RFPL-PCR, we genotyped two TIM-3 single-nucleotide polymorphisms (SNPs): rs1036199 and rs10057302, and four LGALS9 SNPs: rs361497, rs3751093, rs4239242, and rs4794976. We found that the presence of the rs10057302 A allele (AC + AA genotypes) as well as the rs4794976 T allele (GT + TT genotypes) decreased susceptibility to ccRCC by two-fold compared to corresponding homozygotes. A subgroup analysis showed the association of some SNPs with clinical features. Moreover, TIM-3 rs1036199 significantly influenced OS. Our results indicate that variations within TIM-3 and LGALS9 genes are associated with ccRCC risk and OS.
1. Introduction
Renal cell carcinoma (RCC) is the most frequently diagnosed type of renal cancer in adults between 50 and 70 years old, accounting for more than 90% of renal cancer cases. According to WHO data, approximately 431,288 new renal cancer cases were diagnosed in 2020 [1]. The incidence of RCC is two times higher in men than in women. RCC has one of the highest mortality rates of all genitourinary cancers (179,368 deaths in 2021) [1,2]. RCC is divided histologically into three major subtypes: clear cell RCC (ccRCC), papillary RCC, and chromophobe RCC, with ccRCC accounting for 70–80% of all RCC cases [3].
ccRCC is named after its distinctive microscopic imaging, where tumor cells look similar to clear soap bubbles. ccRCC originates from the epithelial cells of the proximal tubule (renal cortex), and in most cases presents a rapidly expansive growth pattern, classifying ccRCC as an aggressive tumor. The development of ccRCC in most cases is sporadic (95%), but in some cases ccRCC is associated with inherited syndromes, including von Hippel–Lindau disease and tuberous sclerosis [3]. One of the reasons for the high mortality of renal cancer is its asymptomatic nature in the early stages of the disease, resulting in patients with metastatic tumors at the time of their diagnosis [4]. Due to a lack of reliable early diagnostic markers of ccRCC, there is a need to identify new diagnostic and prognostic markers for ccRCC.
Immunological checkpoints (ICs) are crucial molecules that maintain immune tolerance and prevent autoimmunity by adjusting the duration and severity of immune responses [5]. Cancer cells learn how to take advantage of these properties of ICs for their own benefit by overexpressing ICs, helping the tumor hide from immune system surveillance [6,7,8]. To date, several IC receptors and their ligands have been identified, including T cell immunoglobulin and mucin-domain-containing molecule-3 (TIM-3). TIM-3, also known as hepatitis A virus cellular receptor 2 (HAVCR2), is a type I transmembrane protein. Various studies have shown that TIM-3 is overexpressed in different types of cancer, such as urothelial carcinoma, prostate cancer, and lung cancer [9,10,11]. Interestingly, TIM-3 is overexpressed on both immune cells and cancer cells. High TIM-3 expression promotes the tumorigenesis, proliferation, and invasion of tumor cells by suppressing immune cells’ functions [12]. TIM-3 binds to several ligands, including galectin-9, CEACAM1, phosphatidylserine (PtdSer), and HMGB1. The first TIM-3 ligand that was discovered was galectin-9 (coded by the LGALS9 gene), which is widely expressed by various organ systems and tissues. The binding of TIM-3 to galectin-9 initiates inhibitory pathways leading to the suppression of Th1 and Th17 functions that induce immune tolerance [13,14]. Altered galectin-9 expression has been reported in different types of cancers and is negatively correlated with overall survival (OS) in patients [15,16,17,18], making galectin-9 an interesting biomarker and potential target for immunotherapy.
Despite the huge success of immunotherapy, only 20–40% of cancer patients respond to it [19]. Therefore, searching for reliable predictors or markers of cancer development has become an important topic in recent years. Genetic variations are considered to be potential cancer prediction markers. Among them, single-nucleotide polymorphisms (SNPs) have been proven to have an impact on human health and predisposition to certain diseases, including cancer [20,21,22,23]. Polymorphisms of the gene encoding TIM-3 have previously been reported to be associated with cancer susceptibility and patient OS. Moreover, the presence of specific TIM-3 SNPs was documented to correlate with TIM-3 expression, modifying cancer risk [24,25,26,27,28]; however, most published studies were conducted on Chinese populations, with a lack of data on Caucasian populations. This being the case, we aim to study the association of TIM-3 polymorphisms with ccRCC risk in the Caucasian population.
For our study, we selected two TIM-3 polymorphisms: rs1036199 and rs10057302. rs1036199 has previously been described as being associated with cancer risk and outcomes, but mostly in the Asian population, with only one study concerning RCC. Moreover, we investigated additional polymorphisms within the LGALS9 gene: rs3751093, rs4239242, and rs4794976, which were previously described in the context of autoimmune diseases [29,30]. All of the studied polymorphisms, as well as their gene localizations, are presented in Figure 1. To the best of our best knowledge to date, LGALS9 polymorphisms have not been studied in the context of neoplastic diseases, so our study is the first to undertake this problem in ccRCC.
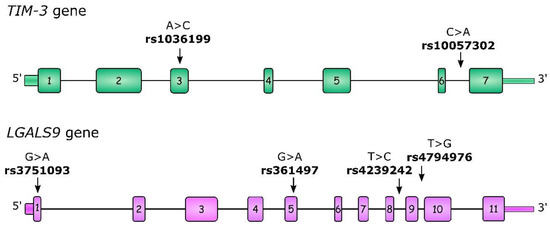
Figure 1.
Structure of the TIM-3 and LGALS9 genes as well as the localization of studied single-nucleotide polymorphisms (SNPs). Boxes indicate exons and lines indicate introns, 5′UTR and 3′UTR regions.
In summary, the aim of the present study is to analyze the influence of selected single-nucleotide polymorphisms in the TIM-3 and LGALS9 genes on ccRCC susceptibility and disease progression in the Polish population.
2. Results
2.1. Association between TIM-3 and LGALS9 SNPs and Susceptibility to ccRCC
Each polymorphism in the TIM-3 and LGALS9 genes were in Hardy–Weinberg equilibrium (HWE) in the control group; however, in the ccRCC group, we observed deviation from HWE for rs4794976 (LGALS9), with an overrepresentation of GG homozygotes (f = 0.13, p = 0.046). For other SNPs in the ccRCC group, there was no deviation from HWE.
The overall analysis of genotype and allele distribution for all of the studied SNPs in ccRCC patients and controls is presented in Table 1. We found that the genotype distribution of LGALS9 rs4794976 differed significantly between ccRCC patients and controls (p = 0.049), where the GG genotype individuals had a higher risk of disease, by about two-fold (OR = 1.91; 95% CI 1.13–3.22), compared to TT individuals. In the recessive model, carriers of a T allele (TT + GT genotypes) had about a two-fold decreased risk of ccRCC as compared to GG individuals (OR = 0.54; 95% CI 0.33–0.89; p = 0.015). Additionally, in an allelic analysis, the rs474976 G allele was associated with increased susceptibility to ccRCC (OR = 1.28; 95% CI 1.01–1.64; p = 0.044). We also noticed that the presence of a G allele in rs3751093 tends to have a protective role, decreasing the susceptibility to ccRCC by about 1.8-fold (OR = 0.55; 95% CI 0.30–1.02; p = 0.059), while the AA genotype increased this risk.

Table 1.
Genotype and allele distribution of TIM-3 and LGALS9 SNPs among ccRCC patients and controls.
Furthermore, we observed that rs10057302 (TIM-3) genotypes tend to be differently distributed between ccRCC patients and controls (p = 0.071, Table 1), where carriers of the rs10057302 A allele (AC + AA genotypes) had two times lower ccRCC risk (OR = 0.45; 95% CI 0.22–0.95; p = 0.027) than individuals with the CC genotype. In addition, an analysis of allele distribution also confirmed that allele A in rs10057302 significantly decreased the risk of ccRCC (OR = 0.44; 95% CI 0.21–0.90; p = 0.018). For the other studied SNPs (rs1036199, rs361497, and rs4239242), we did not observe any association with susceptibility to ccRCC in the overall analysis.
2.2. Association of TIM-3 and LGALS9 Polymorphisms with Clinical Features of ccRCC Patients
After stratification by gender, we found that, similarly to the relation observed in the whole ccRCC group, the genotype distribution of rs4794976 differed between patients and controls (Table 2), and this difference was close to significance (p = 0.06) in female patients. Moreover, similar to observations in the whole group of patients, in the recessive model presence of the T allele (TT + GT genotypes) decreased ccRCC risk in females by about two-fold (OR = 0.49; 95% CI 0.24–0.99; p = 0.047), while the GG genotype increased susceptibility to ccRCC by about two-fold. An analysis of allele distribution also confirmed that the G allele in rs4794976 significantly increased the risk of ccRCC in females (OR = 1.56; 95% CI 1.14–2.52; p = 0.01). In male patients, we did not observe any significant differences in genotype and allele distributions between patients and controls (Table S1).
Table 2.
Genotype and allele distribution of TIM-3 and LGALS9 SNPs among female patients and female controls.
When we considered the age of onset in relation to the median age of onset (age of 63 years), we noticed that, in patients older than 63, the presence of the rs4794976 GG genotype increased the risk of ccRCC development by two-fold (OR = 1.97; 95% CI 1.08–3.61; p = 0.030). Moreover, carriers of the rs3751093 AA genotype had a higher risk of disease in that age group by 2.47 times (OR = 2.47; 95% CI 1.22–4.98; p = 0.011) (Table S2).
When taking into consideration the metastatic status of ccRCC patients, we did not notice any significant differences in the genotype distribution for all of the investigated SNPs. Similarly, we did not observe any differences when stratifying by the presence of necrosis (data not presented). However, we noticed that the A allele in rs10057302 (AC + AA genotypes) was possessed more frequently in patients with tumors bigger than 70 mm compared to patients with smaller tumors (9.2% vs. 2.1%, OR = 4.39; p = 0.019) (Table S3).
2.3. Haplotype Analysis
SHEsis online software [31] was used to perform a haplotype analysis. We performed the haplotype analysis for TIM-3 and LGALS9 separately, where haplotypes with frequencies below 1% were not considered. Both of the analyses are shown, respectively, in Table 3 and Table 4. For TIM-3 we observed three haplotypes each for both the patients and the controls. In the case of LGALS9, the haplotype analysis showed the presence of six haplotypes in ccRCC and eight haplotypes in controls.
Table 3.
Haplotype distribution of TIM-3 SNPs between ccRCC patients and controls.
Table 4.
Haplotype distribution of LGALS9 SNPs between ccRCC patients and controls.
The global distribution of the TIM-3 haplotypes differed significantly between ccRCC patients and controls (global χ2 = 6.18, df = 2, p = 0.046) (Table 3), but after applying the Bonferroni correction this association lost significance. We noticed that the A A (rs1036199, rs10057302) haplotype is less frequent in patients than in controls (1.9% vs. 4.4%; p = 0.018). Considering this alongside the results of the genotype analysis, this points toward a protective function of the rs10057302 A allele against ccRCC development. In the case of LGALS9, the global distribution of haplotypes differed significantly between patients and controls (global χ2 = 18.30, df = 7, p = 0.011) (Table 4); however, after applying the Bonferroni correction this association lost significance. The A A C G (rs3751093, rs361497, rs4239242, and rs4794976) haplotype was more frequent in ccRCC patients than in controls (25.8% vs. 20.7%) and increased ccRCC risk (OR = 1.36; 95% CI 1.02–1.75; p = 0.034). Moreover, two other LGALS9 haplotypes, A A C T and A A C T, were very rare or not detected in ccRCC compared to controls, where their frequency was above 1%.
Furthermore, after stratification by gender, the haplotype analysis of the TIM-3 haplotypes did not show significant differences between female patients and female controls (global χ2 = 4.72, df = 2, p = 0.095) (Table S4); however, we noticed that, in female patients, the A C haplotype tends to be more frequent than in female controls (82% vs. 74%; p = 0.058). Moreover, the distribution of LGALS9 haplotypes differed between female patients and female controls (global χ2 = 17.08, df = 7, p = 0.029), but after applying the Bonferroni correction this association lost significance (Table S5). The A A C G haplotype was more frequent in female patients (29.4% vs. 19.6%) and increased ccRCC risk (OR = 1.68; 95% CI 1.08–2.6; p = 0.02), whereas the G G T T haplotype was less frequent in female patients (49.1% vs. 58.2%) and decreased ccRCC risk (OR = 0.67; 95% CI 0.46–0.98; p = 0.04). In the case of male patients, we did not see any significant differences in haplotype distributions (data not shown).
2.4. TIM-3 and LGALS9 Gene Polymorphisms in Relation to Overall Survival
TIM-3 and LGALS9 gene polymorphisms, as well as gender, age, stage of disease, size of tumor, and the absence or presence of metastasis as well as necrosis were subjected to an OS analysis. The analysis performed on the whole group of ccRCC patients confirmed that well-known risk factors, such as gender, stage of disease, age at diagnosis, tumor size, and the presence of metastasis as well as necrosis significantly influenced OS in our group of patients.
The results of the OS analysis are shown in Figure S1 and Table S6. In detail, in our ccRCC group male patients had a significantly shorter OS compared to female patients (mean ± SD: 98.11 ± 9.49 vs. 146.29 ± 17.66 months; p = 0.036), where females lived, on average, 4 years longer than males. As expected, the presence of metastasis and necrosis had a negative impact on OS. Patients with metastasis in other organs at the time of diagnosis lived over 8 years less than those without metastasis (mean ± SD: 42.9 ± 6.16 vs. 140.27 ± 11.89 months; p < 0.001). Similarly, the presence of necrosis decreased OS, and patients with no necrosis lived over 7 years longer than patients with present necrosis (mean ± SD: 95.7 ± 13.42 vs. 183.01 ± 9.99 months; p < 0.001). Predictably, patients above 63 years of age had a shorter OS time than their younger counterparts (mean ± SD: 109.16 ± 13.22 vs. 127.99 ± 13.95 months; p = 0.03). The clinical stage of disease was strongly related to OS, where mean OS for stages I, II, III, and IV was 138.4, 93.72, 91.22, and 70.57 months, respectively (p < 0.001). Additionally, patients with a tumor size above 70 mm lived on average 3.7 years less compared to patients with smaller tumors (mean ± SD: 62.09 ± 6.29 vs. 106.79 ± 5.67 months; p < 0.001).
In addition to well-known OS-influencing factors, we also performed a correlation analysis between the studied TIM-3 as well as LGALS9 polymorphisms and patient OS. This analysis showed that one of the studied SNPs significantly modified OS, while the remaining ones had no association with patient OS. A detailed OS analysis is presented in Figure 2 and Table S7. The presence of the C allele (CC + AC genotypes) in the rs1036199 of the TIM-3 gene shortened patient OS compared to AA individuals for more than 13 months (mean ± SD: 109.21 ± 14.38 vs. 122.74 ± 11.80 months; p = 0.017) (Figure 2A). For rs10057302 (TIM-3), rs3751093 (LGALS9), rs361497 (LGALS9), rs4239242 (LGALS9), and rs4794976 (LGALS9) we did not notice any significant correlation in relation to patient OS.
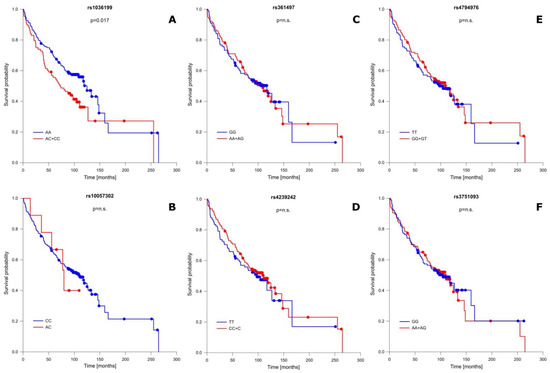
Figure 2.
Probability of survival in relation to TIM-3 and LGALS9 gene polymorphisms: (A) rs1036199 (TIM-3); (B) rs10057302 (TIM-3); (C) rs361497 (LGALS9); (D) rs4239242 (LGALS9); (E) rs4794976 (LGALS9); and (F) rs3751093 (LGALS9). n.s.—not significant.
2.5. Univariate and Multivariate Analysis of Risk Factors Influencing ccRCC Risk and Overall Patient Survival
In our study, we also performed univariate and multivariate Cox regression analyses of risk factors that influence ccRCC patient mortality. As expected, the results of the multivariate analysis confirmed the results of the univariate analysis and showed that, in addition to well-known factors associated with poorer prognoses and shorter OS (such as age at diagnosis, advanced stage of disease, the presence of metastasis and necrosis, a tumor size above 7 cm, and male gender), the presence of the C allele in the rs1036199 of TIM-3 is associated with shorter OS (Table 5).
Table 5.
Univariate and multivariate Cox regression analysis of risk factors’ influences on the mortality of ccRCC patients.
Next, we conducted a univariate and multivariate logistic regression analysis of the risk factors influencing ccRCC patients (versus the control group), which included all of the investigated polymorphisms of the TIM-3 and LGALS9 genes. Similarly, this analysis confirmed our results, showing that the possession of the rs10057302 A allele (AC + AA genotypes) decreased the risk of the development of ccRCC by more than two-fold (OR = 0.45; 95% CI 0.21–0.96; p = 0.039) (Table S8).
3. Discussion
ccRCC stands behind one of the highest mortalities among urological cancers due to its asymptomatic nature in the early stages of the disease and a high rate of metastasis in patients at the time of diagnosis. Therefore, there is an urgent need to identify biomarkers that would identify groups at risk of this disease. The lack of proven early diagnostic markers of ccRCC emphasizes the necessity for the identification of new diagnostic and prognostic markers for ccRCC.
The etiology of ccRCC is multifactorial, but it is evident that immunosurveillance is also an important factor that influences disease risk. The proper immune response is directly related to T cell activation, which is regulated by the balance between stimulatory and inhibitory signals provided by co-signaling molecules [32]. The importance of ICs in immunosurveillance was proven by the extraordinary results of immunotherapy based on an IC blockade. Nowadays, the blockade of CTLA-4 and PD-1 or PD-L1 is an approved treatment method in many cancers, including RCC [33]. The discovery of new immunotherapy targets would improve cancer management by expanding immunotherapy effectiveness among non-responders. The panel of immune checkpoints molecules is wide and includes TIM-3, which is a regulator of both innate and adaptive immune responses. TIM-3 is expressed on IFNγ-producing CD4+ (Th1) and CD8+ (Tc1) T cells, regulatory T cells, Th17 cells, NK cells, and on innate immune cells (macrophages and dendritic cells) [34]. The dysregulation of TIM-3 has been implicated in both autoimmune diseases and cancer [9,10,11,35,36]. In several solid tumors, increased TIM-3 expression has been shown to be associated with advanced disease and poorer prognoses [37]. Importantly, TIM-3 expression is primarily observed intratumorally, with minimal expression noted in peripheral T cells and regulatory T cells (Tregs). CD8+PD1+ T cells expressing high levels of TIM-3 exhibit the most severe exhausted phenotype among tumor-infiltrating lymphocytes (TILs). CD8+PD1+TIM3+ T cells fail to proliferate in response to antigens and produce reduced amounts of IL-2, TNF, and IFNγ [38,39]. All of these studies highlight the importance of TIM-3 in cancer pathogenesis.
There are currently several dozen registered clinical trials investigating anti-TIM-3 antibodies as a monotherapy or in combination with other drugs, mainly anti-PD-1 antibodies, but also with chemotherapy in various solid and hematologic tumors in different clinical settings (clinicaltrials.gov). Most of them are phase I or II, and only a few studies have results (published or not published yet). It is too early to draw conclusions regarding the clinical activities and safety profiles of different anti-TIM-3 antibodies and combination strategies. This treatment strategy has to be thoroughly evaluated as it might be a clinically significant possibility for overcoming PD-1 resistance in different tumors. There is also an important question regarding the safety profiles of combined treatments, as seen with the combination of anti-PD-1 and anti-CTLA-4 blockades in the past.
Many studies have shown that polymorphisms of the TIM-3 gene can be associated with cancer susceptibility and patient survival. Moreover, it has been shown that specific TIM-3 SNPs can modify TIM-3 expression, influencing disease risk [24,25,26,27,28]. In a few previous studies the presence of the rs1036199 SNP in the TIM-3 gene has been correlated with cancer risk and disease outcome. Bai et al. found that the distribution of rs1036199 genotypes differed between cases and controls. Moreover, patients carrying the rs1036199 AC genotype had a 2.81-fold higher risk of NSCLC and shorter OS than carriers of an AA genotype [24]. Similarly, Tong et al. observed that rs1036199 AC genotype and C allele carriers had increased susceptibility to pancreatic cancer. The presence of rs1036199 was also more frequent in patients with vascular infiltration than in those without [27]. In another study, Cheng et al. showed that the prevalence of the rs1036199 AC genotype and the C allele was increased in breast cancer patients compared to controls, especially in patients with metastasis, where the AC genotype was more common than in those without metastasis [26]. On the other hand, Wang et al. did not find any association of rs1036199 with breast cancer in Chinese women [28]. Wu et al. also showed that the TIM-3 polymorphism rs1036199 may not be associated with the risk of developing epithelial ovarian cancer (EOC), nor affected its clinical outcomes [40]. In the case of RCC, the presence of the rs1036199 SNP has been shown to have a significant correlation with RCC risk in the Chinese population. Moreover, the prevalence of the rs1036199 C allele was higher in RCC patients with metastasis than in those without metastasis. The haplotype analysis showed that a haplotype containing the rs1036199 C allele, T T C (rs10053538, rs10515746, and rs1036199), was correlated with RCC risk [25].
In our study, we did not observe any correlation between rs1036199 and ccRCC risk. Nevertheless, we found the association of rs1036199 with patient OS, suggesting the involvement of rs1036199 in disease progression in our group of ccRCC patients. We found that the presence of the rs1036199 C allele significantly decreased patient OS by more than 13 months. Moreover, this result was confirmed by a Cox regression analysis. This observation is in line with observations made by Bai et al. [24]. rs1036199 is located in exon 3, which is known to encode, along with exon 4, the TIM-3 mucin domain. The presence of rs1036199 leads to the exchange of allele A with C, resulting in a missense mutation that causes the substitution of arginine (R) with leucine (L) in position 140 (R140L). Arginine is a basic amino acid carrying a positive charge, whereas leucine is a non-polar hydrophobic amino acid. Therefore, this R140L modification may have an influence on the mucin domain structure of the TIM-3 protein, which may affect the ligand’s affinity with the TIM-3 receptor, thereby altering TIM-3 downstream signaling within the cell. Moreover, it has been shown that the mucin domain contains potential sites for O-linked glycosylation [41], an important modification in protein stability and activity. The potential influence of the rs1036199 SNP on mucin domain structure may also alter the proper O-linked glycosylation of the TIM-3 protein. In spite of this, until now there have been no studies performed on the functional consequences of rs1036199 alteration. This being the case, we can only hypothesize about its true biological consequence.
Our second studied polymorphism situated in the TIM-3 gene was rs10057302. We find that rs10057302 was significantly associated with disease risk, and that possessing the A allele (AC + AA genotypes) decreased the risk of ccRCC development by more than two times, while, conversely, the CC genotype increased the risk by two times. The rs10057302 SNP is located in intron 6 of the TIM-3 gene. To our knowledge, rs10057302 has not been studied previously in the context of cancer or any other disease. What is interesting is that, in the subgroup analysis, we noticed that patients with a tumor size above 7 cm possessed the rs10057302 A allele more frequently than those with smaller tumors. Moreover, a haplotype analysis of TIM-3 SNPs showed that the frequency of haplotype A A (rs1036199, rs10057302) was significantly lower in ccRCC patients than in controls. The results of a multivariate regression analysis confirmed that, among all of the studied SNPs, the rs10057302 A allele is significantly associated with decreased disease risk. Altogether, our results suggest that possessing the rs10057302 A allele may have a protective role against ccRCC development. A Kaplan–Meier analysis did not reveal any significant correlation between the presence of rs10057302 and patient survival time; however, in our cohort there is a limited number of individuals possessing the rs10057302 A allele. This being the case, studies with other groups on rs10057302‘s role in cancer are needed to confirm our observations.
In the present study, we also explored the relationships between SNPs in the gene encoding galectin-9 (LGALS9) and ccRCC susceptibility as well as disease outcome. Galectin-9 is a member of the galectin family of carbohydrate-binding proteins, which is characterized by the presence of two conserved carbohydrate recognition domains (CRDs) that bind galactose [42]. In humans, galectin-9 is widely distributed throughout various organ systems and tissues, with the highest expression in the spleen, stomach, colon, and lymph nodes [43]. Galectin-9 is an important pleiotropic immune modulator affecting numerous immune cell types; among others aspects, it is involved in the activation of innate immune responses [44] and the downregulation of Th17 [13] as well as Th1 responses [45]. Multiple studies have shown the capability of galectin-9 to bind to several receptors, while the best characterized is TIM-3 [18,46]. TIM-3-binding galectin-9 attenuates T cell expansion and effector functions in the tumor microenvironment [18]. Multiple studies have shown a multi-faceted role for galectin-9 that contributes to tumorigenesis via tumor cell transformation, cell cycle regulation, angiogenesis, and cell adhesion [47,48,49]. Galectin-9 expression is frequently altered in cancer and involved in several aspects of tumor progression [15,16,17,18], making galactin-9 an interesting potential prognostic marker and a therapeutic target for several malignancies.
So far, there have been no reports regarding associations between cancer and LGALS9 polymorphisms, despite galectin-9 being documented as playing an important role in cancer pathology. The first study on LGALS9 polymorphisms’ potential role in disease came from Rosen et al., who examined the association of LGALS9 gene variants with the development of advanced alcoholic liver disease (ALD). In this study, Rosen’s group found an association between four LGALS9 SNPs (rs732222, rs3751093, rs4239242, and rs4794976) and the risk of ALD [50]. In our study, we documented that the genotype distribution of rs4794976 differs significantly between ccRCC patients and controls, where the presence of the GG genotype increased the risk of disease by about 1.9-fold compared to the AA genotype. Moreover, we observed that the GG genotype significantly increased the risk of ccRCC in women (but not in men) and in patients older than 63 years old. Similar to our results, in ALD rs4794976 genotype frequency differed between studied groups, with an over-representation of rs4794976 G allele carriers (GG + GT genotypes) among individuals that developed ALD [50]. On the contrary, Xu’s group, investigating the association of LGALS9 polymorphisms with rheumatoid arthritis (RA), showed that rs4794976 allele T as well as TT and TT + TG genotypes were significantly associated with RA risk [30]. This difference may occur due to the different pathologies: RA is an autoimmune and inflammatory disease, whereas in cancer the immune system response is suppressed. This, in turn, would explain the opposite results in regard to rs4794976 occurrence. As we mentioned in our results for this SNP, we observed deviation from HWE in the patient group, while the control group was in complete HWE. This fact may confirm the association between rs4794976 and ccRCC risk, since, according to Lee et al., in the presence of an association with disease, cases do not need to be in HWE, and deviation from HWE of datasets of affected individuals is sufficient to discover relationships with disease [51].
Furthermore, we observed that the presence of the rs3751093 G allele may have a protective role, decreasing susceptibility to ccRCC by 1.8-fold. This observation was also seen in a subgroup analysis when age of onset was considered. Patients older than 63 years of age possessing the G allele were less susceptible to disease than patients with AA homozygotes. In RA, Xu et al. documented the decreased frequency of the rs3751093 GA genotype in RA patients compared to controls, suggesting its protective role in RA [30]. Additionally, Rosen’s group noticed that the rs3751093 GG genotype was less frequent in individuals prone to developing ALD compared to subjects who were protected from developing ALD. Moreover, the expression levels of galectin-9 transcripts were lower in PBMCs treated with ethanol carrying the rs3751093 GG genotype compared to PBMCs treated with ethanol carrying rs3751093 AA and AG genotypes [50]. Further studies on rs3751093′s role in cancer are needed to confirm our results.
For rs4239242, in RA there are two studies reporting distinct results. In Vilar’s study, the rs4239242 TT genotype was positively correlated with the incidence of RA, and the TC genotype was more frequent in controls than in RA patients [29], whereas Xu’s group did not report any significant relationship between rs4239242 and RA [30]. Additionally, in ALD the rs4239242TT genotype was associated with a lower risk of developing ALD. Moreover, PBMCs carrying the rs4239242 TT genotype showed lower levels of galectin-9 transcripts after ethanol stimulation compared to CC and CT genotypes [50]. In our study, we did not observe any correlation of rs4239242 with ccRCC risk. Differences in reported results probably arise due to different types of studied diseases, where specific polymorphisms can have diverse effects on disease pathogenesis.
The association between LGALS9 SNPs and patient survival has not been studied previously by others. Our Kaplan–Meier analysis on the influence of investigated LGALS9 SNPs on patient OS in ccRCC did not reveal any significant correlation. Thus, in our study, LGALS9 SNPs did not show any association with ccRCC progression.
Our haplotype analysis showed that the A A C G (rs3751093, rs361497, rs4239242, and rs4794976) haplotype was more common in patients and may be considered as a risk factor for ccRCC, whereas A A C T appeared to have a protective role. In RA, the G T G C G (rs3751093, rs4239242, rs4794976, rs4795835, and rs732222) haplotype was less prevalent in RA patients compared to controls, while the G T T C G haplotype was positively correlated with RA risk [30]. Alternatively, in ALD, the G T G G T haplotype (rs3751093, rs4794976, rs4239242, rs3763959, and rs732222) was negatively correlated with ALD, while G C G G T was positively correlated with ALD risk [50]. Additionally, in this case, differences in haplotype frequencies between studies would arise from different types of studied diseases, which make it impossible to directly compare results.
In our present work, we also conducted univariate and multivariate logistic regression analyses of risk factors influencing ccRCC patients, including all of the investigated polymorphisms. These analyses showed that possessing the rs10057302 A allele (AC + AA genotype) decreases the risk of the development of ccRCC. Furthermore, we performed univariate and multivariate Cox regression analyses of risk factors that influence the mortality of ccRCC patients. As expected, several clinical factors, such as female gender, young age, no malignancy, lack of necrosis, early disease stage, and a tumor size below 7 cm, were associated with better OS of ccRCC patients in both the univariate and multivariate analyses. Moreover, these analyses confirmed our finding that the presence of the rs1036199 AA genotype is a risk factor influencing patient OS.
Limitations of our study are the lack of clinical data for the control group as well as mismatched ages of patients and controls. For the control group, we only have data on gender, age, and lack of cancer diseases. For some controls we also have data about smoking and some anthropometrical data which were not relevant to the study. We realize that the control group is not matched in relation to age, and that healthy individuals could develop cancer in future; however, the incidence of renal cell cancer is, on average, about 1 per 10,000 cases (different in men and women). In light of this, the chance that in the control group there would be a significant number of people who at a later age would develop cancer and distort the obtained results is small. Another limitation was the inability to investigate the functional role of studied polymorphisms and their effect on protein expression. On the other hand, the strengths of this study include the long period of patient observation, which lasted more than 10 years. Additional research into the underlying mechanisms influenced by specific SNPs has to be elicited to further confirm our findings. Finally, studies on larger groups of patients as well as on other populations are needed to confirm our findings.
4. Conclusions
For the first time, we showed that SNPs of the gene encoding galectin-9 could be associated with susceptibility to cancer. In particular, rs4794976 of the LGALS9 gene may be considered a low penetrating risk factor for the development of ccRCC. Additionally, we found that rs10057302 of TIM-3 can have a protective role in ccRCC, whereas rs1036199 of the TIM-3 gene showed a negative correlation with ccRCC progression. Moreover, there was evidence suggesting that variants of rs4794976, as well as rs10057302, may also relate to the risk of ccRCC in females and older patients. In conclusion, our study showed an association of TIM-3 and LGALS9 polymorphisms with ccRCC risk and outcomes; however, extended studies on larger groups of patients and the functional evaluation of studied SNPs are needed to confirm our results.
5. Materials and Methods
5.1. ccRCC Patients
The group of patients enrolled in this study consisted of 237 ccRCC patients (151 male and 86 females) diagnosed at the Department of Urology and Oncologic Urology at Wroclaw Medical University. Patients were diagnosed between 2009 and 2012, while samples were collected within a period of 2010 to 2012. The studies involving human participants were reviewed and approved by the Bioethical Committee of Wroclaw Medical University. The DNA used in the presented study was isolated from patients recruited for the previous project approved by the Ethics Committee of Wroclaw Medical University (KB 55/2010). For the purpose of this study (reuse of the material), we obtained additional approvals from the Ethics Committee of Wroclaw Medical University (KB 587/2020 and KB 755/2022). Patients provided their written informed consent to participate in this study. Overall survival was assessed from the date of surgery to the date of death from any cause or up to 24 January 2020, when data collection was completed. Patients’ characteristics are presented in Table 6.
Table 6.
Characteristics of the ccRCC group.
5.2. Controls
The control group comprised 410 (258 males and 148 females) subjects from the same geographic region as ccRCC patients. Blood samples from healthy subjects were collected by the Wrocław Blood Bank or donated by employees of the Ludwik Hirszfeld Institute of Immunology and Experimental Therapy. The studies involving human participants were reviewed and approved by the Bioethical Committee of Wrocław Medical University, Wrocław, Poland. Participants provided their written informed consent to participate in this study.
5.3. SNP Selection
Four of six selected SNPs, rs1036199 (TIM-3), rs3751093 (LGALS9), rs4239242 (LGALS9), and rs4794976 (LGALS9), have been studied previously by other groups in the context of cancer risk (only TIM-3 SNPs) and RA risk (TIM-3 and LGALS9 SNPs). In this study we also selected two new previously unstudied SNPs, rs10057302 (TIM-3) and rs361497 (LGALS9), using the UCSC database, available at https://genome.ucsc.edu/index.html accessed on 27 November 2022. The localization of each SNP is shown in Figure 1, and extended information about each SNP is provided in Table S9.
5.4. DNA Isolation and SNP Genotyping
Genomic DNA was isolated from refrozen blood samples by an Invisorb Spin Blood Mini Kit (Stratec Molecular, Berlin, Germany) or a QIAamp DNA Blood Mini Kit (Qiagen, Hilden, Germany) according to the manufacturers’ instructions. Three SNPs were genotyped using TaqMan Genotyping Master Mix (Applied Biosystems, Frederic, MD, USA) and TaqMan assays. ID: rs1036199 (TIM-3) C___2082038_1_, rs10057302 (TIM-3) C__29607693_10, and rs4794976 (LGALS9) C__29024730_10. All reactions were run on a ViiA7 Real-Time PCR System (Applied Biosystems, Singapore, Singapore).
SNP rs3751093 (LGALS9) was genotyped using the tetra-primer amplification refractory mutation system–polymerase chain reaction (ARMS–PCR). Primers were designed using Primer1 online software (http://primer1.soton.ac.uk/primer1.html, accessed on 11 February 2022). The primers used in ARMS–PCR include forward inner primer: 5′-GCGGCGGAGAGATGGCCTTCATCA-3′; reverse inner primer: 5′-ACTCAGGTAGGGAGCCTGGGATCC-3′; forward outer primer: 5′- GCTGGGAGTGCCTACTTCCCTCTGTG-3′; and reverse outer primer: 5′- GTTCTCTTTGGGATGCCCCCACCC-3′. The PCR was prepared in a volume of 10 µL with 100–150 ng of DNA, a mix of primers in a 1:1:5:5 ratio (F_out:R_out:F_in:R_in), 0.2 Mm Dntp Mix (Thermo Scientific, Vilnus, Lithuania), and DreamTaq Green DNA Polymerase (Thermo Scientific, Vilnus, Lithuania). All of the reactions were run on a T100 Thermal Cycler (BioRad, Singapore, Singapore). The protocol used in the thermal cycler was as follows: initial denaturation at 95 °C for 3 min, followed by 32 cycles of denaturation at 95 °C for 30 s per cycle, combined annealing and extension for 1 min at 72 °C, and final extension for 5 min at 72 °C. Products of PCR reactions were separated on 2% agarose gel and visualized with the help of a UV trans-illuminator VOO 7237 (Vilber Lourmat, Marne la Valee, France.
SNPs rs361497 (LGALS9) and rs4239242 (LGALS9) were genotyped using polymerase chain reaction-restriction fragment length polymorphism (PCR-RFLP). Rs361497 was detected using 5′-TGCCTGCCTGGTCTCTC-3′ (forward primer) and 5′-GGTCACTGTGGCAGTGGT-3′ (reverse primer), and digested using BglI restriction enzyme (Thermo Scientific, Vilnus, Lithuania). Rs4239242 was detected using 5′-CGATGCCTTTCATCACCACCA-3′ (forward primer) and 5′-CACCTCCTTCTTGGGTCTGAT-3′ (reverse primer), and digested using EcoRI Fast Digest restriction enzyme (Thermo Scientific, Vilnus, Lithuania). The PCR was prepared in a volume of 10 µL with 50–100 ng of DNA, 400 Nm concentration of each primer (forward and reverse), 0.2 Mm Dntp Mix (Thermo Scientific, Vilnus, Lithuania), and Taq DNA Polymerase (EurX, Gdansk, Poland). All reactions were run on At100 Thermal Cycler (BioRad, Singapore, Singapore). The protocol used in the thermal cycler was as follows: initial denaturation at 95 °C for 3 min, followed by 35 cycles of denaturation at 95 °C for 30 s per cycle, annealing at 60 °C for 45 s and extension for 1 min at 72 °C, and final extension for 5 min at 72 °C. PCR products were next digested with selected restriction enzymes. RFLP digestion was carried out in a volume of 15 Μl with 1.5 units of the restriction enzyme and 5–10 Μl (0.1–0.5 μg) of PCR product in O buffer (BglI) or Fast Digest buffer (EcoRI FD) (Thermo Scientific, Vilnus, Lithuania) for 1.5 h (BglI) or 0.5 h (EcoRI FD) at 37 °C. Digested products were separated on 2% agarose gel and visualized with the help of a UV trans-illuminator VOO 7237 (Vilber Lourmat, Marne la Valee, France).
5.5. Statistical Analyses
Statistical analyses were performed using Statistica 13.1 (TIBCO, Inc., Palo Alto, CA, USA) and PQStat v.1.8.0.476 software (Poznan, Poland). For measurable variables, the means, medians, and standard deviations were calculated. All of the investigated quantitative variables were checked with the Shapiro–Wilk test. For all of the genotyped TIM-3 and LGALS9 polymorphisms the evaluation of Hardy–Weinberg equilibrium (HWE) was performed independently for ccRCC patients and healthy controls by comparing the observed and expected frequencies of genotypes by using the χ2 test. The χ2 test was used to compare categorical data between ccRCC patients and controls. Odds ratios (ORs) and 95% confidence intervals (95% CIs) were calculated using a binary logistics regression model to evaluate the relationship between studied polymorphisms and susceptibility to ccRCC. Haplotype frequencies for pairs of alleles were determined using the online software SHEsis [31,52], where haplotypes with frequencies below 0.01 were not considered. Differences between groups were considered statistically significant if p < 0.05.
Survival analysis (OS) was performed using a Kaplan–Meier estimator in SigmaPlot 11.0 software (Systat Software, San Jose, CA, USA). The log-rank test was used to compare patient survival against selected clinical variables.
Univariate and multivariate Cox proportional hazard regression models were used to investigate factors associated with the mortality of ccRCC patients. Independent variables examined included age at diagnosis, stage of disease (II, III, and IV, ref. I), metastasis (present, ref. no), necrosis (present, ref. no), tumor size (>70 mm, ref. ≤ 70 mm), sex (ref. female), rs1036199 (AC + CC, ref. AA), rs10057302 (AC + AA, ref. CC), rs3751093 (AG + AA, ref. GG), rs361497 (AG + AA, ref. GG), rs4239242 (CT + CC, ref. TT), and rs4794976 (CT + GG, ref. TT). Variables with p < 0.20 in the univariate analysis were entered into the multivariate model. Variables that were found to be significant (p < 0.05) in both the univariate and multivariate analyses were considered to be factors associated with mortality.
Supplementary Materials
The following supporting information can be downloaded at: https://www.mdpi.com/article/10.3390/ijms24032042/s1.
Author Contributions
Conceptualization, L.K. and A.A.; methodology, A.A. and L.K.; formal analysis, A.A., K.P. and L.K.; investigation, A.A., A.T. and A.D.; writing—original draft preparation, A.A. and L.K.; writing—reviewing and editing K.T. and L.K.; visualization, A.A.; patients’ recruitment and clinical characteristics, K.T., B.M., and T.S.; data curation, K.T. and A.A.; supervision, L.K.; project administration, L.K.; funding, L.K., B.M. and T.S. All authors have read and agreed to the published version of the manuscript.
Funding
This research was funded by a grant from the Foundation of Count Jakub Potocki (Fundacja im. hr. Jakuba Potockiego) on the basis of the decision taken by the Foundation Board on 16.12.2019 as well as by a research grant from Wroclaw Medical University, SUBZ.C090.22.057. The funding institutions had no role in the design of the study, the collection, analysis, and interpretation of data, and in the writing of the manuscript.
Institutional Review Board Statement
Patient samples were collected during the period of 2010 to 2012. The studies involving human participants were reviewed and approved by the Bioethical Committee of Wroclaw Medical University. The DNA used in the presented study was isolated from patients recruited for the previous project approved by the Ethics Committee of Wroclaw Medical University (KB 55/2010). For the purpose of this study (reuse of the material), we obtained additional approvals from the Ethics Committee of Wroclaw Medical University (KB 587/2020 and KB 755/2022).
Informed Consent Statement
Informed consent was obtained from all subjects involved in the study.
Data Availability Statement
The original contributions are presented within the article and in the supplementary materials. Additional data are available upon reasonable request from the corresponding author.
Acknowledgments
The authors want to thank all of the patients and healthy volunteers for agreeing to participate in this study and donating their blood. We are grateful to Nafeesa Moksud for her help with the English editing.
Conflicts of Interest
The authors declare no conflict of interest.
References
- Global Cancer Observatory. Available online: https://gco.iarc.fr/today/home (accessed on 10 September 2022).
- Padala, S.A.; Barsouk, A.; Thandra, K.C.; Saginala, K.; Mohammed, A.; Vakiti, A.; Rawla, P.; Barsouk, A. Epidemiology of renal cell carcinoma. World J. Oncol. 2020, 11, 79–87. [Google Scholar] [CrossRef] [PubMed]
- Muglia, V.F.; Prando, A. Renal cell carcinoma: Histological classification and correlation with imaging findings. Radiol. Bras. 2015, 48, 166–174. [Google Scholar] [CrossRef]
- Deleuze, A.; Saout, J.; Dugay, F.; Peyronnet, B.; Mathieu, R.; Verhoest, G.; Bensalah, K.; Crouzet, L.; Laguerre, B.; Belaud-Rotureau, M.A.; et al. Immunotherapy in renal cell carcinoma: The future is now. Int. J. Mol. Sci. 2020, 21, 2532. [Google Scholar] [CrossRef] [PubMed]
- Dyck, L.; Mills, K.H.G. Immune checkpoints and their inhibition in cancer and infectious diseases. Eur. J. Immunol. 2017, 47, 765–779. [Google Scholar] [CrossRef] [PubMed]
- Karabon, L.; Partyka, A.; Ciszak, L.; Pawlak-Adamska, E.; Tomkiewicz, A.; Bojarska-Junak, A.; Roliński, J.; Wołowiec, D.; Wrobel, T.; Frydecka, I.; et al. Abnormal expression of BTLA and CTLA-4 immune checkpoint molecules in chronic lymphocytic leukemia patients. J. Immunol. Res. 2020, 2020, 6545921. [Google Scholar] [CrossRef] [PubMed]
- Kitsou, M.; Ayiomamitis, G.; Zaravinos, A. High expression of immune checkpoints is associated with the TIL load, mutation rate and patient survival in colorectal cancer. Int. J. Oncol. 2020, 57, 237–248. [Google Scholar] [CrossRef]
- Weimer, P.; Wellbrock, J.; Sturmheit, T.; Oliveira-Ferrer, L.; Ding, Y.; Menzel, S.; Witt, M.; Hell, L.; Schmalfeldt, B.; Bokemeyer, C.; et al. Tissue-specific expression of TIGIT, PD-1, TIM-3, and CD39 by γδ T cells in ovarian cancer. Cells 2022, 11, 964. [Google Scholar] [CrossRef]
- Gao, X.; Zhu, Y.; Li, G.; Huang, H.; Zhang, G.; Wang, F.; Sun, J.; Yang, Q.; Zhang, X.; Lu, B. Tim-3 expression characterizes regulatory T cells in tumor tissues and is associated with lung cancer progression. PLoS ONE 2012, 7, e30676. [Google Scholar] [CrossRef]
- Piao, Y.-R.; Jin, Z.-H.; Yuan, K.-C.; Jin, X.-S. Analysis of Tim-3 as a therapeutic target in prostate cancer. Tumor Biol. 2014, 35, 11409–11414. [Google Scholar] [CrossRef][Green Version]
- Yang, M.; Yu, Q.; Liu, J.; Fu, W.; Cao, Y.; Yu, L.; Shao, S.; Wang, X.; Niu, H.; Wang, Y. T-cell immunoglobulin mucin-3 expression in bladder urothelial carcinoma: Clinicopathologic correlations and association with survival. J. Surg. Oncol. 2015, 112, 430–435. [Google Scholar] [CrossRef]
- Das, M.; Zhu, C.; Kuchroo, V.K. Tim-3 and its role in regulating anti-tumor immunity. Immunol. Rev. 2017, 276, 97–111. [Google Scholar] [CrossRef] [PubMed]
- Oomizu, S.; Arikawa, T.; Niki, T.; Kadowaki, T.; Ueno, M.; Nishi, N.; Yamauchi, A.; Hirashima, M. Galectin-9 suppresses Th17 cell development in an IL-2-dependent but tim-3-independent manner. Clin. Immunol. 2012, 143, 51–58. [Google Scholar] [CrossRef] [PubMed]
- Zhu, C.; Anderson, A.C.; Schubart, A.; Xiong, H.; Imitola, J.; Khoury, S.J.; Zheng, X.X.; Strom, T.B.; Kuchroo, V.K. The TIM-3 ligand galectin-9 negatively regulates T helper type 1 immunity. Nat. Immunol. 2005, 6, 1245–1252. [Google Scholar] [CrossRef] [PubMed]
- Fu, H.; Liu, Y.; Xu, L.; Liu, W.; Fu, Q.; Liu, H.; Zhang, W.; Xu, J. Galectin-9 predicts postoperative recurrence and survival of patients with clear-cell renal cell carcinoma. Tumor Biol. 2015, 36, 5791–5799. [Google Scholar] [CrossRef] [PubMed]
- Jikuya, R.; Kishida, T.; Sakaguchi, M.; Yokose, T.; Yasui, M.; Hashizume, A.; Tatenuma, T.; Mizuno, N.; Muraoka, K.; Umemoto, S.; et al. Galectin-9 expression as a poor prognostic factor in patients with renal cell carcinoma. Cancer Immunol. Immunother. 2020, 69, 2041–2051. [Google Scholar] [CrossRef] [PubMed]
- Ju, M.-H.; Byun, K.-D.; Park, E.-H.; Lee, J.-H.; Han, S.-H. Association of galectin 9 expression with immune cell infiltration, programmed cell death ligand-1 expression, and patient’s clinical outcome in triple-negative breast cancer. Biomedicines 2021, 9, 1383. [Google Scholar] [CrossRef]
- Yang, R.; Sun, L.; Li, C.F.; Wang, Y.H.; Yao, J.; Li, H.; Yan, M.; Chang, W.C.; Hsu, J.M.; Cha, J.H.; et al. Galectin-9 interacts with PD-1 and Tim-3 to regulate T cell death and is a target for cancer immunotherapy. Nat. Commun. 2021, 12, 832. [Google Scholar] [CrossRef]
- Shen, H.; Yang, E.S.; Conry, M.; Fiveash, J.; Contreras, C.; Bonner, J.A.; Shi, L.Z. Predictive biomarkers for immune checkpoint blockade and opportunities for combination therapies. Genes Dis. 2019, 6, 232–246. [Google Scholar] [CrossRef] [PubMed]
- Partyka, A.; Tupikowski, K.; Kolodziej, A.; Zdrojowy, R.; Halon, A.; Malkiewicz, B.; Dembowski, J.; Frydecka, I.; Karabon, L. Association of 3′ nearby gene BTLA polymorphisms with the risk of renal cell carcinoma in the Polish population. Urol. Oncol. Semin. Orig. Investig. 2016, 34, 419.e13–419.e19. [Google Scholar] [CrossRef]
- Tupikowski, K.; Partyka, A.; Kolodziej, A.; Dembowski, J.; Debinski, P.; Halon, A.; Zdrojowy, R.; Frydecka, I.; Karabon, L. Ctla-4 and CD28 genes’ polymorphisms and renal cell carcinoma susceptibility in the Polish population—A prospective study. Tissue Antigens 2015, 86, 353–361. [Google Scholar] [CrossRef]
- Wagner, M.; Tupikowski, K.; Jasek, M.; Tomkiewicz, A.; Witkowicz, A.; Ptaszkowski, K.; Karpinski, P.; Zdrojowy, R.; Halon, A.; Karabon, L. SNP-SNP interaction in genes encoding PD-1/PD-L1 axis as a potential risk factor for clear cell renal cell carcinoma. Cancers 2020, 12, 3521. [Google Scholar] [CrossRef] [PubMed]
- Wagner, M.; Jasek, M.; Karabon, L. Immune checkpoint molecules—Inherited variations as markers for cancer risk. Front. Immunol. 2021, 11, 606721. [Google Scholar] [CrossRef] [PubMed]
- Bai, J.; Li, X.; Tong, D.; Shi, W.; Song, H.; Li, Q. T-cell immunoglobulin- and mucin-domain-containing molecule 3 gene polymorphisms and prognosis of non-small-cell lung cancer. Tumor Biol. 2013, 34, 805–809. [Google Scholar] [CrossRef] [PubMed]
- Cai, C.; Wang, L.; Wu, Z.; Li, M.; Chen, W.; Sun, Y. T-cell immunoglobulin- and mucin-domain-containing molecule 3 gene polymorphisms and renal cell carcinoma. DNA Cell Biol. 2012, 31, 1285–1289. [Google Scholar] [CrossRef] [PubMed]
- Cheng, S.; Ju, Y.; Han, F.; Wang, Y.; Xu, Y.; Qu, T.; Lu, Z. T Cell Immunoglobulin- and Mucin-Domain-Containing Molecule 3 Gene Polymorphisms and Susceptibility to Invasive Breast Cancer. Ann. Clin. Lab. Sci. 2017, 47, 668–675. [Google Scholar] [PubMed]
- Tong, D.; Zhou, Y.; Chen, W.; Deng, Y.; Li, L.; Jia, Z.; Qi, D. T cell immunoglobulin- and mucin-domain-containing molecule 3 gene polymorphisms and susceptibility to pancreatic cancer. Mol. Biol. Rep. 2012, 39, 9941–9946. [Google Scholar] [CrossRef]
- Wang, Z.; Liu, X.; Wang, X.; Chong, T.; Lin, S.; Wang, M.; Ma, X.; Liu, K.; Xu, P.; Feng, Y.; et al. Polymorphisms in Tim-3 and breast cancer susceptibility in Chinese women: A case-control study. Oncotarget 2016, 7, 43703–43712. [Google Scholar] [CrossRef]
- Vilar, K.D.; Pereira, M.C.; Tavares Dantas, A.; de Melo Rêgo, M.J.; Pitta, I.D.; Pinto Duarte, Â.L.; da Rocha Pitta, M.G. Galectin-9 gene (LGALS9) polymorphisms are associated with rheumatoid arthritis in Brazilian patients. PLoS ONE 2019, 14, e0223191. [Google Scholar] [CrossRef]
- Xu, W.D.; Wu, Q.; He, Y.W.; Huang, A.F.; Lan, Y.Y.; Fu, L.; Zhou, J.; Liu, X.Y. Gene polymorphisms of LGALS2, LGALS3 and LGALS9 in patients with rheumatoid arthritis. Cell. Immunol. 2021, 368, 104419. [Google Scholar] [CrossRef]
- Shi, Y.Y.; He, L. SHEsis, a powerful software platform for analyses of linkage disequilibrium, haplotype construction, and genetic association at polymorphism loci. Cell Res. 2005, 15, 97–98. [Google Scholar] [CrossRef]
- Zhang, Y.; Zheng, J. Functions of immune checkpoint molecules beyond immune evasion. In Advances in Experimental Medicine and Biology; Springer: Singapore, 2020; pp. 201–226. [Google Scholar] [CrossRef]
- Thana, M.; Wood, L. Immune checkpoint inhibitors in genitourinary malignancies. Curr. Oncol. 2020, 27, 69–77. [Google Scholar] [CrossRef] [PubMed]
- Zeidan, A.M.; Komrokji, R.S.; Brunner, A.M. Tim-3 pathway dysregulation and targeting in cancer. Expert Rev. Anticancer Ther. 2021, 21, 523–534. [Google Scholar] [CrossRef] [PubMed]
- Kamal, A.M.; Wasfey, E.F.; Elghamry, W.R.; Sabry, O.M.; Elghobary, H.A.; Radwan, S.M. Genetic signature of CTLA-4, BTLA, tim-3 and LAG-3 molecular expression in colorectal cancer patients: Implications in diagnosis and survival outcomes. Clin. Biochem. 2021, 96, 13–18. [Google Scholar] [CrossRef] [PubMed]
- Skejoe, C.; Hansen, A.S.; Stengaard-Pedersen, K.; Junker, P.; Hoerslev-Pedersen, K.; Hetland, M.L.; Oestergaard, M.; Greisen, S.; Hvid, M.; Deleuran, M.; et al. T-cell immunoglobulin and mucin domain 3 is upregulated in rheumatoid arthritis, but insufficient in controlling inflammation. Am. J. Clin. Exp. Immunol. 2022, 11, 34–44. [Google Scholar]
- Zhang, Y.; Cai, P.; Liang, T.; Wang, L.; Hu, L. Tim-3 is a potential prognostic marker for patients with solid tumors: A systematic review and meta-analysis. Oncotarget 2017, 8, 31705–31713. [Google Scholar] [CrossRef] [PubMed]
- Fourcade, J.; Sun, Z.; Benallaoua, M.; Guillaume, P.; Luescher, I.F.; Sander, C.; Kirkwood, J.M.; Kuchroo, V.; Zarour, H.M. Upregulation of Tim-3 and PD-1 expression is associated with tumor antigen–specific CD8+ T cell dysfunction in melanoma patients. J. Exp. Med. 2010, 207, 2175–2186. [Google Scholar] [CrossRef]
- Granier, C.; Dariane, C.; Combe, P.; Verkarre, V.; Urien, S.; Badoual, C.; Roussel, H.; Mandavit, M.; Ravel, P.; Sibony, M.; et al. Tim-3 expression on tumor-infiltrating PD-1+CD8+ T cells correlates with poor clinical outcome in renal cell carcinoma. Cancer Res. 2017, 77, 1075–1082. [Google Scholar] [CrossRef]
- Wu, J.-L.; Zhao, J.; Zhang, H.-B.; Zuo, W.-W.; Li, Y.; Kang, S. Genetic variants and expression of the TIM-3 gene are associated with clinical prognosis in patients with epithelial ovarian cancer. Gynecol. Oncol. 2020, 159, 270–276. [Google Scholar] [CrossRef]
- Joller, N.; Kuchroo, V.K. Tim-3, LAG-3, and TIGIT. In Current Topics in Microbiology and Immunology; Springer: Cham, Switzerland, 2017; pp. 127–156. [Google Scholar] [CrossRef]
- Wada, J.; Kanwar, Y.S. Identification and characterization of galectin-9, a novel β-galactoside-binding mammalian lectin. J. Biol. Chem. 1997, 272, 6078–6086. [Google Scholar] [CrossRef]
- Fagerberg, L.; Hallström, B.M.; Oksvold, P.; Kampf, C.; Djureinovic, D.; Odeberg, J.; Habuka, M.; Tahmasebpoor, S.; Danielsson, A.; Edlund, K.; et al. Analysis of the human tissue-specific expression by genome-wide integration of transcriptomics and antibody-based proteomics. Mol. Cell. Proteom. 2014, 13, 397–406. [Google Scholar] [CrossRef]
- John, S.; Mishra, R. Galectin-9: From cell biology to complex disease dynamics. J. Biosci. 2016, 41, 507–534. [Google Scholar] [CrossRef] [PubMed]
- Pang, N.; Alimu, X.; Chen, R.; Muhashi, M.; Ma, J.; Chen, G.; Zhao, F.; Wang, L.; Qu, J.; Ding, J. Activated galectin-9/TIM3 promotes Treg and suppresses Th1 effector function in chronic lymphocytic leukemia. FASEB J. 2021, 35, e21556. [Google Scholar] [CrossRef] [PubMed]
- Cao, E.; Zang, X.; Ramagopal, U.A.; Mukhopadhaya, A.; Fedorov, A.; Fedorov, E.; Zencheck, W.D.; Lary, J.W.; Cole, J.L.; Deng, H.; et al. T cell immunoglobulin mucin-3 crystal structure reveals a galectin-9-independent ligand-binding surface. Immunity 2007, 26, 311–321. [Google Scholar] [CrossRef] [PubMed]
- Aanhane, E.; Schulkens, I.A.; Heusschen, R.; Castricum, K.; Leffler, H.; Griffioen, A.W.; Thijssen, V.L. Different angioregulatory activity of monovalent galectin-9 isoforms. Angiogenesis 2018, 21, 545–555. [Google Scholar] [CrossRef] [PubMed]
- Akashi, E.; Fujihara, S.; Morishita, A.; Tadokoro, T.; Chiyo, T.; Fujikawa, K.; Kobara, H.; Mori, H.; Iwama, H.; Okano, K.; et al. Effects of galectin-9 on apoptosis, cell cycle and autophagy in human esophageal adenocarcinoma cells. Oncol. Rep. 2017, 38, 506–514. [Google Scholar] [CrossRef]
- Pally, D.; Banerjee, M.; Hussain, S.; Kumar, R.V.; Petersson, A.; Rosendal, E.; Gunnarsson, L.; Peterson, K.; Leffler, H.; Nilsson, U.J.; et al. Galectin-9 signaling drives breast cancer invasion through extracellular matrix. ACS Chem. Biol. 2022, 17, 1376–1386. [Google Scholar] [CrossRef]
- Rosen, H.R.; Golden-Mason, L.; Daly, A.K.; Yang, I.; Day, C.P. Variants in the LGALS9 gene are associated with development of liver disease in heavy consumers of alcohol. Clin. Gastroenterol. Hepatol. 2016, 14, 762–768. [Google Scholar] [CrossRef]
- Lee, W.-C. Searching for disease-susceptibility loci by testing for Hardy-Weinberg disequilibrium in a gene bank of affected individuals. Am. J. Epidemiol. 2003, 158, 397–400. [Google Scholar] [CrossRef]
- Li, Z.; Zhang, Z.; He, Z.; Tang, W.; Li, T.; Zeng, Z.; He, L.; Shi, Y. A partition-ligation-combination-subdivision EM algorithm for haplotype inference with multiallelic markers: Update of the SHEsis (http://analysis.bio-x.cn). Cell Res. 2009, 19, 519–523. [Google Scholar] [CrossRef]


Disclaimer/Publisher’s Note: The statements, opinions and data contained in all publications are solely those of the individual author(s) and contributor(s) and not of MDPI and/or the editor(s). MDPI and/or the editor(s) disclaim responsibility for any injury to people or property resulting from any ideas, methods, instructions or products referred to in the content. |
© 2023 by the authors. Licensee MDPI, Basel, Switzerland. This article is an open access article distributed under the terms and conditions of the Creative Commons Attribution (CC BY) license (https://creativecommons.org/licenses/by/4.0/).