Article

Protective Effects of Lactobacillus gasseri against High-Cholesterol Diet-Induced Fatty Liver and Regulation of Host Gene Expression Profiles

School of Pharmaceutical Sciences, Nanjing Tech University, Nanjing 211816, China
*
Authors to whom correspondence should be addressed.
These authors contributed equally to this work.
Int. J. Mol. Sci. 2023, 24(3), 2053; https://doi.org/10.3390/ijms24032053
Submission received: 23 December 2022 / Revised: 11 January 2023 / Accepted: 17 January 2023 / Published: 20 January 2023
(This article belongs to the Section Molecular Genetics and Genomics)

Abstract

:
Fatty liver is one of the most pervasive liver diseases worldwide. Probiotics play an important role in the progression of liver disease, but their effects on host regulation are poorly understood. This study investigated the protective effects of lactobacillus gasseri (L. gasseri) against high-cholesterol diet (HCD)-induced fatty liver injury using a zebrafish larvae model. Liver pathology, lipid accumulation, oxidative stress and hepatic inflammation were evaluated to demonstrate the changes in a spectrum of hepatic injury. Moreover, multiple indexes on host gene expression profiles were comprehensively characterized by RNA screening. The results showed that treatment with L. gasseri ameliorated HCD-induced morphological and histological alterations, lipid regulations, oxidative stress and macrophage aggregation in the liver of zebrafish larvae. Furthermore, the enrichment of the Kyoto Encyclopedia of Genes and Genomes (KEGG) pathway revealed that the core pathways of L. gasseri regulation were interleukin-17 (IL-17) signaling, phosphoinositide 3-kinase (PI3K)-AKT signaling pathway, the regulation of lipolysis and adipocytes and fatty acid elongation and estrogen signaling. The genes at key junction nodes, hsp90aa1.1, kyat3, hsd17b7, irs2a, myl9b, ptgs2b, cdk21 and papss2a were significantly regulated by L. gasseri administration. To conclude, the current research extends our understanding of the protective effects of L. gasseri against fatty liver and provides potential therapeutic options for fatty liver treatment.

1. Introduction

In recent years, fatty liver has become the most common chronic liver disease worldwide, with an occurrence rate of 25% [1]. The main feature of fatty liver is excessive liver fat accumulation (over 5%), which is associated with various liver diseases such as non-alcoholic steatohepatitis (NASH), liver fibrosis, cirrhosis and hepatocellular carcinoma (HCC) [2,3,4]. Fatty liver is also closely related to several adverse health conditions, including obesity, insulin resistance, type 2 diabetes and cardiovascular disease, etc. [5]. Nowadays, the options for the therapeutic treatment of fatty liver are still limited due to the multiple pathogenesis factors. The only effective strategies for the treatment of fatty liver are reducing the body mass index through exercising and dieting [6]. Thus, the search for new potential therapeutic agents is of paramount importance. The “two-hit” theory is the classical pathogenesis of fatty liver, which states that the hepatic overlord-lipid accumulation and oxidative stress are the two main factors contributing to the development of fatty liver [7,8]. Therefore, therapeutic strategies for fatty liver primarily focus on reducing hepatic lipid and oxidative stress.
Probiotics are considered to be live bacteria or micro-ecological regulators. When consumed in adequate amounts, probiotics can improve the health of the host by regulating the immune response and metabolism [9,10,11]. A large number of studies have confirmed the anti-obesity effect of probiotics, while other reports suggested that probiotics can reduce liver steatosis, which demonstrates that targeting microbiota for fatty liver seems reasonable [12,13,14]. Lactobacilli constitute an integral part of the normal gastrointestinal microbiota and are involved in improving host metabolism [15] and intestinal immune function [16,17,18], enhancing host resistance against infection and peritoneal macrophages [19]. The study of Wong et al. demonstrated that Lactobacilli treatment reduced liver steatosis and liver enzymes in the fatty liver animal model [20]. Therefore, the modulation of the gut microbiome with probiotics can be considered a promising strategy for the regulation of obesity-related comorbidities.
Lactobacillus gasseri (L. gasseri) is one of the predominant strains of lactic acid bacteria in the human small intestine, which has been reported to contribute to immune regulation, the prevention of bacterial and viral infection, reducing allergic symptoms, the inhibition of lipid absorption and has an anti-tumor effect [21,22,23]. L. gasseri can be isolated from the oral cavity, digestive tract, feces, vaginal cavity and areola and is considered to be a probiotic candidate with great research value [24,25]. A study analysis shows that L. gasseri SBT2055 can reduce postprandial lipid absorption and significantly reduce obesity [26,27]. However, the exact effects of L. gasseri and the mechanisms are still unclarified. In the present study, a fatty liver model based on zebrafish larvae was used to investigate the protective activities of L. gasseri against high-cholesterol diet (HCD)-induced fatty liver.

2. Results

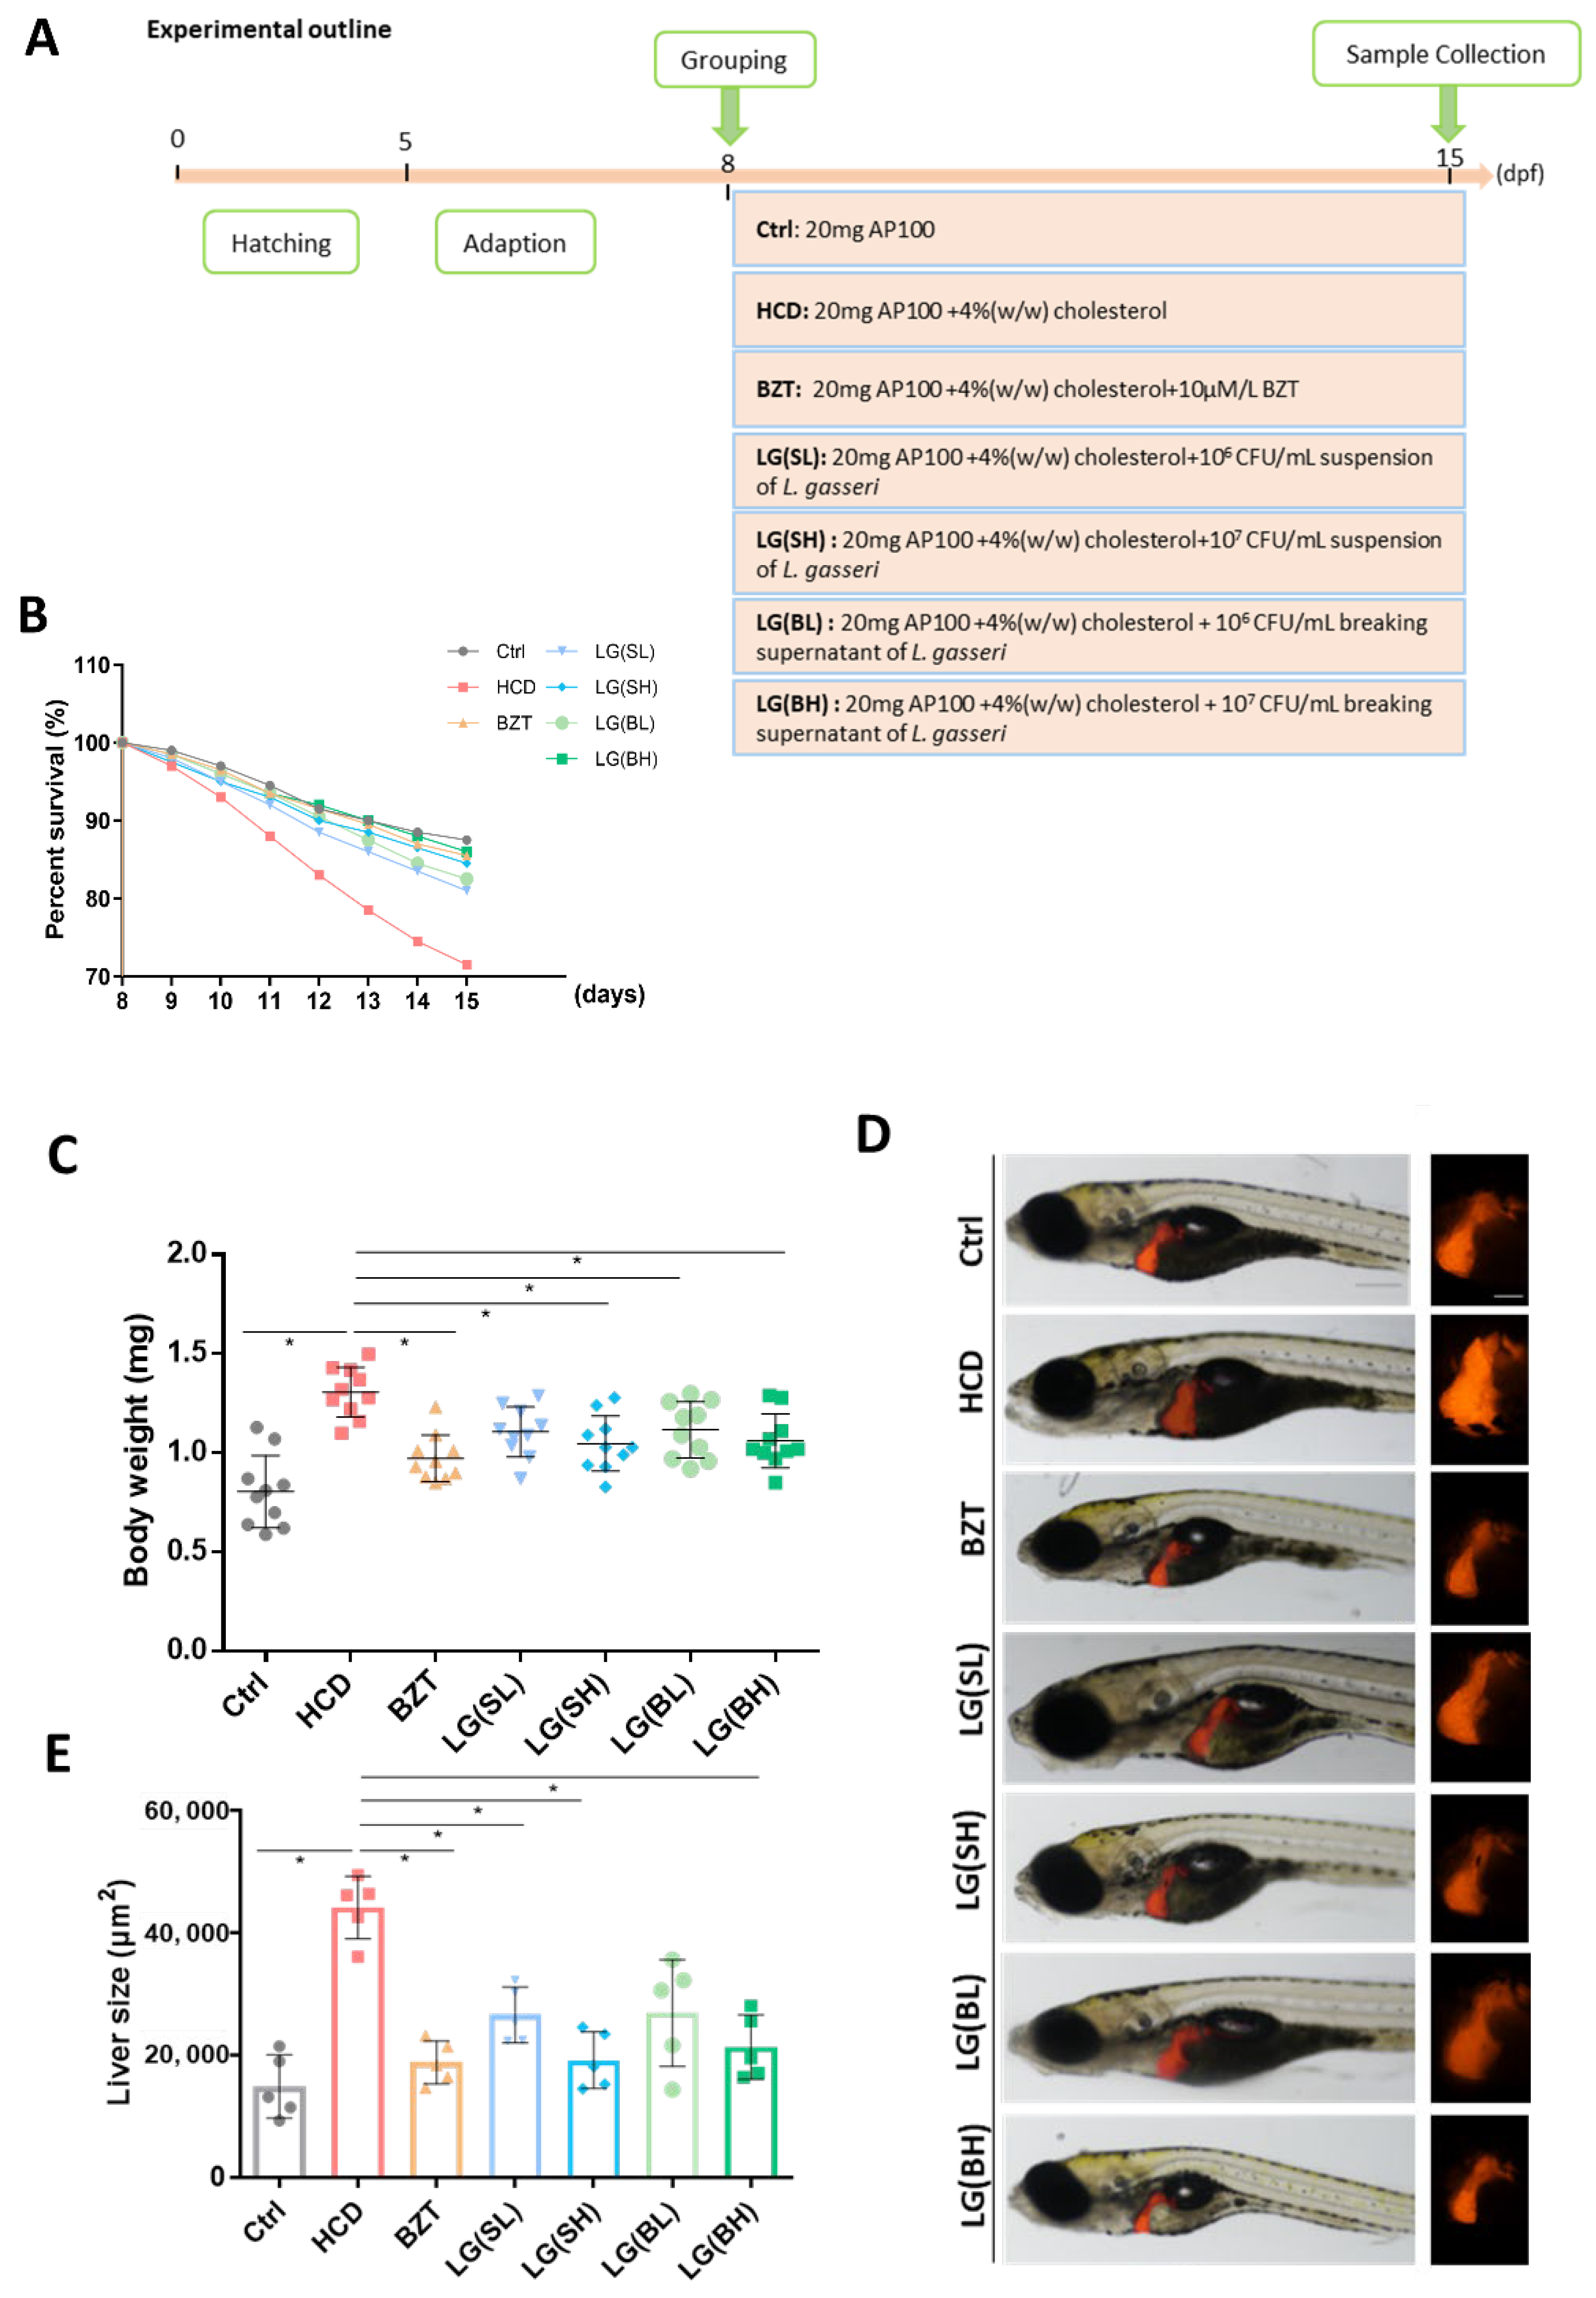
2.1. Treatment with L. gasseri Ameliorated HCD-Induced Mortality and Morphological Changes of Zebrafish Larvae

The effects of L. gasseri on HCD (containing 4% cholesterol w/w) induced liver injury were tested on zebrafish larvae from 8 to 15 dpf with BZT as the positive control (Figure 1A). Four groups of L. gasseri administration were set with the cells (L. gasseri suspension) and the cell-free culture supernatants (L. gasseri breaking supernatant). After seven days of stimulation with HCD, the survival rate of zebrafish larvae was found to continuously decrease (Figure 1B). However, after one-week administration of L. gasseri, the decreasing survival rates were all relieved in both L. gasseri suspension (LG (SL) and LG (SH)) and L. gasseri breaking supernatant (LG (BL) and LG (BH)) groups. The percent survival curves of L. gasseri and BZT group were almost the same in variation trend (Figure 1B). Therefore, L. gasseri increased the survival rate of HCD-induced zebrafish larvae. The body weight of zebrafish larvae after the HCD treatment showed a statistical increase compared to the control. Notably, the groups fed with a high concentration of L. gasseri showed a significant reduction in body weight to a level comparable to that of the control and BZT groups, indicating that the L. gasseri had a weight-losing effect in HCD-induced larval zebrafish (Figure 1C). The transgenic fish Tg (lfabp10: dsRed) expressing red fluorescent protein (DsRed) in hepatocytes was applied with the same grouping to detect the gross liver morphology and liver size. As shown in Figure 1D, the area of red fluorescence was increased significantly in the HCD-treated groups as compared to the control. Notably, the size of red fluorescence in L. gasseri groups was reduced significantly compared to HCD groups. The quantitative statistics of the liver area presented a significant trend in a dose-dependent manner (Figure 1E).

2.2. L. gasseri Administration Attenuated HCD-Induced Fatty Liver on Lipid Accumulation and Histological Changes in Zebrafish Larvae

Subsequently, liver pathological changes in the liver of the corresponding groups were examined using H&E staining. In Figure 2A, zebrafish livers are indicated with red arrows. It could be observed that in normal liver tissue, the hepatocytes with clear polygonal shapes were joined together by a tight junction and with well-preserved cytoplasm and prominent nucleus. However, in the HCD-treatment groups, macrovesicular steatosis was obviously visible. The liver presented various tiny and large vacuoles, with loose cell-to-cell contact, dissociated and irregularly shaped cells and macrovacuoles. After L. gasseri treatment for one week, the deterioration of liver histological changes was obviously reversed. Moreover, the Nile red staining results showed that the average red fluorescence intensity in the liver was remarkably strengthened in the HCD treatment group as compared to the control (Figure 2B). However, the average intensity of the L. gasseri administered groups was comparatively weaker than the HCD groups. The improvement effects of various concentrations and different processed ways of L. gasseri on lipid deposition were almost equal to BZT, which revealed that L. gasseri might have a potential role in the alleviation of HCD-induced liver steatosis in neutral lipid deposition.

2.3. L. gasseri Supplementation Alleviated HCD-Induced Fatty Liver on Oxidative Stress and Macrophage Aggregation in the Liver of Zebrafish Larvae

To demonstrate the effects of L. gasseri on HCD-induced oxidant attack in zebrafish larvae liver, DCFH-DA, a fluorescent dye for ROS, was used to stain the oxidative stress product ROS in vivo. As shown in Figure 3A, the fluorescence of the liver (outlined with a dashed yellow line) was increasingly distributed in the HCD modeling groups as compared to the controls and was weakened after the treatments of L. gasseri in different ways. The quantification of green fluorescence intensity indicated that L. gasseri reduced the HCD-induced widespread ROS significantly (p < 0.05) (Figure 3A,B). Moreover, the activities of nonenzymatic antioxidant MDA were evaluated by biochemical assays. It was shown that the content quantification of the MDA presented a significantly higher level in the HCD treatment groups, while L. gasseri performed a remarkable function in reducing the levels of MDA in vivo (Figure 3C).
To further understand if L. gasseri had an effect on the inflammatory response caused by HCD, the infiltration of macrophages in the liver was examined using the reporter transgenic line Tg (mpx:mCherry). The visualized results showed that macrophage infiltration was remarkably increased in the HCD treatment groups (Figure 3D). BZT alleviated HCD-induced macrophage aggregation in the liver of zebrafish larvae. Similarly, different forms and concentrations of L. gasseri treatments all decreased macrophage accumulation in the liver. The degree of macrophage infiltration reduction is analyzed in Figure 3E. All exhibited an increase in the number of liver macrophages after feeding with HCD, while the L. gasseri supplementation can restrain macrophage aggregation.

2.4. Transcriptome Profiling of HCD Revealed Hepatic Steatosis Injuries in Zebrafish Liver

To identify the potential molecular function of L. gasseri in cholesterol-induced high-fatty liver, the RNAs isolated from zebrafish liver of HCD, L. gasseri treatments and Ctrl with three biological replicates were sequenced, and transcript expression was comparatively analyzed mapping to the zebrafish RefSeq database. Compared with the vehicle control groups, a total of 400 differentially expressed genes (DEGs) were identified, including 276 up- and 124 down-regulated DEGs (|log2FC| > 0, Q value < 0.05). By hierarchical clustering based on DEG expression patterns, as shown in Figure 4A, the HCD were clustered in a similar relationship and well separated from all of the control samples (Ctrl), suggesting that there were substantial changes were caused by cholesterol induction in zebrafish liver. Volcano maps of the expression distribution of these DEGs are displayed according to their fold change, of which the top 15 functional DEGs were labeled (Figure 4B).
To broaden the understanding of the functional categories of the DEGs, GO functional enrichment was characterized through DAVID analysis for annotation. The Q value was calculated using a hypergeometric test and the enriched term or pathway with Q < 0.05 was considered significant. The enrichment of the upregulated GO term showed that variations in DEGs linked with the biological process (BP) were significantly enriched in macrophage chemotaxis, leukocyte-migration-involved inflammatory response, the activation of MAPKKK activity, cyclooxygenase pathway and DNA integration (Figure 4(Ca)). In the matter of molecular function (MF), the DEGs of the enzymes responsible for lipid metabolism, such as cholesterol 25 hydroxylase activity, cytotoxicity oxidase enzymes, such as peroxidase, and ferroxidase activity were significantly enriched after HCD induction (Figure 4(Cb)). The cellular component (CC) was mainly enriched in the transcription factor complex (Figure 4(Cc)). Correspondingly, the down-regulated GO term showed that variations in DEGs associated with BP were mainly enriched in the glucose metabolic process, glucose homeostasis, cholesterol biosynthetic process and steroid and sterol biosynthetic processes (Figure 4(Cd)). MF were significantly enriched in enzymes, such as ubiquitin-protein ligase activity and sterol 14-demethylase activity (Figure 4(Ce)). With regard to CC, downregulated DEGs were significantly enriched in lipid droplet and mitochondrial intermembrane space protein transporter complex, etc. (Figure 4(Cf)).
DEGs were subjected to KEGG pathway analysis to identify the associated pathways and molecular interactions to further predict the molecular mechanism of cholesterol in the liver. Items with corrected Q < 0.05 were considered to be significant or enriched. The KEGG gene set biological process database (c2. KEGG. v4.0) from the Molecular Signatures Database was used for enrichment analysis. As shown in the green dashed circle of Figure 4D,E, the top 20 enriched KEGG pathways associated with up-and down-regulated mRNA transcripts were presented, respectively. The interleukin-17 (IL-17) signaling pathway, phosphoinositide 3-kinase (PI3K)-AKT signaling pathway and leukocyte transendothelial migration were highly related to HCD-induced liver inflammation reaction. In addition, the p53 signaling pathway, glycosaminoglycan biosynthesis–heparan sulfate/heparin and primary bile acid biosynthesis were also involved in liver hepatic steatosis processes. Moreover, HCD also affected fatty acid elongation, as well as steroid biosynthesis and ovarian steroidogenesis and selenocompound metabolism, implying that the HCD-induced hepatic steatosis injury might be associated with hormone regulation.

2.5. Potential Functional Mechanisms of L. gasseri on Gene Expression Profiles of HCD-Induced Hepatic Steatosis Injury

To unravel the transcriptional programs regulated by L. gasseri, we further performed RNA-seq comparison analysis of Ctrl, HCD and LG (BH). In the principal component analysis (PCA), the samples of the same treatment group were clustered together, demonstrating a significant divergence (p  <  0.05) among the control, HCD and LG (BH) (Figure 5A). The violin plot displayed the distribution of log2 (TPM + 1) of gene expression, indicating the decreased gene expression of Ctrl and LG (BH) relative to HCD (Figure 5B). The Venn diagram in Figure 5C displayed that there were 140 overlapping DEGs between HCD vs. Ctrl and LG (BH) vs. HCD (|log2FC| > 0, Q value < 0.05). The differential cluster heat map showed the fold change (log2 fold change) of the overlapping 140 DEGs, the majority of which (106) were upregulated by HCD and downregulated after the treatment with L. gasseri (Figure 5D). This group included keratin 96 (krt96), histone deacetylase 10 (hdac10), elongases of very long-chain fatty acids 7b (elovl7b), insulin receptor substrate 2a (irs2a), glycine N-methyltransferase (gnmt), EH-domain-containing 1a (ehd1a), myosin, light chain 9b (myl9b), C-X9-C motif containing 1 (cmc1), Rab acceptor 1 (rabac1), claudin 15-like b (cldn15lb), membrane-spanning 4-domains, subfamily A, member 17A.9 (ms4a17a.9), pleckstrin homology-like domain family A member 2 (phlda2), Rho guanine nucleotide exchange factor (GEF) 3 (arhgef3l), prostaglandin–endoperoxide synthase 2b (ptgs2b), troponin I4b, tandem duplicate 1 (tnni4b.1), transmembrane protein 104 (tmem104), mesoderm-induction early response 1, family member 3 b (mier3b), cyclin-dependent kinase 21 (cdk21), potassium voltage-gated channel, subfamily H (eag-related), member 6b (kcnh6b), NADPH oxidase organizer 1a (noxo1a), actinin, alpha 2b (actn2b), phorbol-12-myristate-13-acetate-induced protein 1 (pmaip1), 3’-phosphoadenosine 5’-phosphosulfate synthase 2a (papss2a), ciliogenesis and planar polarity effector complex subunit 1 (cplane1), nectin cell adhesion molecule 4b (nectin4b), chemokine (C-X-C motif) ligand 18b (cxcl18b), integrin subunit beta 7 (itgb7), membrane-spanning 4-domains, subfamily A, member 17a.2 (ms4a17a.2), protein tyrosine phosphatase non-receptor type 21 (ptpn21). With regards, 34 DEGs were downregulated in HCD but upregulated after L. gasseri treatment, including ms4a17a.8, importin 13 (ipo13), N-deacetylase/N-sulfotransferase (heparan glucosaminyl) 1a (ndst1a), transcription factor 4 (tcf4), ubiquitin interaction motif containing 1 (uimc1), heat shock protein 90, alpha (cytosolic), class A member 1, tandem duplicate 1 (hsp90aa1.1), kynurenine aminotransferase 3 (kyat3), RNA-binding protein, mRNA-processing factor 2a (rbpms2a), reticulon 4a (rtn4a), solute carrier family 7 member 2 (slc7a2), ELMO-domain-containing 2 (elmod2), SET and MYND-domain-containing 2b (smyd2b), eukaryotic elongation factor, selenocysteine-tRNA-specific (eefsec), claudin 15b (cldn15b), hydroxysteroid (17-beta) dehydrogenase 7 (hsd17b7) (Supplement Tables S1 and S2).
The KEGGs of the overlapping DEGs were evaluated to gain detailed functional insights into the mechanism of the ameliorating effect of L. gasseri on HCD-induced fatty liver. It was shown that the fatty acids elongation, monobactam biosynthesis, the regulation of lipolysis in adipocytes were significantly associated with L. gasseri modulation. Leukocyte transendothelial migration was affected by L. gasseri, which was consistent with the results of macrophage migration (Figure 5E). The IL-17 signaling pathway, PI3K-AKT signaling pathway and oxytocin signaling pathway were also involved in L. gasseri regulation. Moreover, L. gasseri was active in the signaling related to steroids hormone biosynthesis, steroids biosynthesis, as well as an estrogen signaling pathway, ovarian steroidogenesis. It was shown that selenocompound metabolism was affected by L. gasseri, with the regulation of two key genes, papss2. Changes in primary bile acid biosynthesis and heparin, related to hepatic steatosis, were also moderated by L. gasseri.
The KEGG pathways of the 140 overlapping DEGs between HCD vs. Ctrl and LG (BH) vs. HCD were ranked by the number of genes on the pathway, and the top 10 pathways with the largest node connections number of genes were selected to construct the KEGG pathway relationship network (Figure 5F). Each node, indicated by pink squares, represented one KEGG pathway. The correlated pathways and genes were connected by black edges. The network was constructed based on the results of the KEGG pathway analysis and KEGG database, which indicated that the core pathways of L. gasseri regulation were IL-17 signaling, PI3K-Akt signaling, cGMP-PKG signaling, focal adhesion and tight junction, the regulation of lipolysis and adipocytes and fatty acid elongation, estrogen signaling, selenocompound metabolism and other metabolism signaling.
Additionally, the expression of genes at key junction nodes was analyzed based on the RNA-sequencing results (Figure 6A). Of these genes, it was shown that hsp90aa1.1, kyat3, hsd17b7 were significantly upregulated in the L. gasseri-treated groups compared to the HCD model groups. Moreover, the expression of irs2a, myl9b, ptgs2b, cdk21 and papss2a were remarkably increased by HCD, and L. gasseri played critical roles in reducing their expression levels to normal stages. Afterward, these genes were selected to be subjected to an mRNA expression validation experiment with qRT-PCR (Figure 6B). The results confirmed that the expression levels of hsp90aa1.1, kyat3 and hsd17b7 were decreased after HCD treatment, and the lowering effect was reversed by LG administration. In contrast, the expression levels of irs2a, myl9b, ptgs2b, cdk21 and papss2a, which were increased after HCD induction, and were reduced to varying degrees by L. gasseri, indicating that these genes may potentially explain the inhibitory mechanism of L. gasseri on HCD-induced liver injury.

3. Discussion

Cholesterol accumulation is considered to be one of the factors contributing to the development of fatty liver [28]. Furthermore, recent studies have confirmed that a cholesterol-rich diet may cause liver inflammation and lowering cholesterol levels can ameliorate NASH, indicating that decreasing cholesterol levels might be used therapeutically [29,30]. Previous studies revealed a cholesterol-lowering potential of various lactobacilli, such as L. acidophilus ATCC 4962, L. fermentum [31,32], and L. gasseri SBT2055 [33]. In the high-fat model, L. acidophilus NS1 was found to reduce obesity and liver lipid accumulation. At the same time, L. acidophilus ATCC 43121 showed a positive effect on sterols excretion in feces [9,34]. Furthermore, the intake of L. plantarum and L. fermentum MJM60397 decreased cholesterol levels in serum [35,36]. L. gasseri reduced total and low-density lipoprotein (LDL) cholesterol as well as triglycerides in rats [33]. L. gasseri increased fat droplet size, which is associated with lower absorption and digestion [37]. L. gasseri can also reinforce the excretion of acidic steroids in feces and decrease the reabsorption of bile acids [33]. The current research further confirmed that L. gasseri intake reduced cholesterol levels and reduced liver steatosis. Moreover, in this study, the ndst1 gene was downregulated in the HCD group, which is associated with the increased accumulation of triglyceride-rich lipoproteins [38]. All of these facts suggest that L. gasseri is a promising probiotic capable of ameliorating fatty liver progression.
One of the main contributors to the development of fatty liver is excessive intrahepatic triglyceride and lipid deposition [39]. The number of intrahepatic triglycerides was related to the triglyceride content, increased ratio of saturated and unsaturated fatty acids and lipolysis [40]. Lipolysis is an essential process for cell metabolism [41]. The dysregulation of this process contributes significantly to the generation of ROS and the progression of metabolic diseases, such as fatty liver [41]. According to previous research, patients with fatty liver had 50% higher rates of lipolysis [39]. The results obtained from our HCD zebrafish model also indicated increased rates of lipolysis, which corresponds to the previous reports. Additionally, we detected a decreased expression of the cholesterol biosynthesis-related gene hsd17b7 in the HCD group, which was partially relieved after L. gasseri treatment [42].
Probiotics are used to modulate the composition of the gut microbiome and contribute to various processes, such as the production of bacterial toxins, intestinal barrier fortification as well as the production of antimicrobial substances [43]. Probiotics also take part in the production of various anti-inflammatory cytokines and reduce pro-inflammatory cytokines, such as tumor necrosis factor-alpha (TNFα) [44,45,46]. Our results are in line with recent studies showing that treatment with L. gasseri has been shown to restore altered gut barrier function, as well as reduce inflammation in the intestine, lipid accumulation, and oxidative stress [47,48,49,50,51].
Oxidative stress plays a crucial role in fatty liver. The excessive production of reactive oxygen species (ROS) at the intestinal level and subsequent onset of oxidative stress contribute greatly to the damage of proteins, lipids, DNA and organelles, leading to inflammation, apoptosis and fatty liver progression [52,53]. For fatty liver, mitochondria dysfunction is the primary source of ROS, which is tightly connected to the endoplasmic reticulum stress [54]. Furthermore, lipid peroxidation and the production of MDA aggravate fatty liver by inducing liver steatosis [55]. The results obtained in current research showed that treatment with L. gasseri reduced ROS production and MDA content (Figure 3A, B) in HCD-fed zebrafish group. It corresponds to the findings of previous studies, where L. gasseri SBT2055 also showed protective effects against oxidative stress via activation of the Nrf2-ARE pathway in mammalian cells [56]. Additionally, L. brevis and L. plantarum were able to reduce intestinal oxidative stress and inflammation and contribute to intestinal barrier integrity in animal models [57,58]. Therefore, it is evident that probiotic consumption decreases the levels of oxidative stress via the regulation of antioxidant signaling pathways, stimulating the production of antioxidant metabolites (glutathione, butyrate, and folate) and inhibiting the ROS-producing enzymes [59,60]. Enhancing defenses against oxidative stress via probiotic consumption and the modulation of gut microbiota composition might be a promising strategy for the treatment of metabolic disorders.
IL-17 is a member of the crucial proinflammatory cytokine family [61]. IL-17 participates in the protection of the gut mucosa in HCD metabolic disorders and impacts the progression of fatty liver and NASH through the gut microbiota [61]. However, the exact nature of how it mediates the development of fatty liver remains unknown [61]. Our gene profiling results have confirmed high levels of IL-17 expression in the HCD-fed zebrafish group, indicating the connection between fatty liver development and IL-17 levels, which correlates with the findings of various research [62,63,64,65]. Gene ptgs2b (also known as COX-2), associated with inflammation and prostaglandins synthesis, was found to be related to the development of steatohepatitis in methionine- and choline-deficient (MCD) mice, was highly overexpressed in our HCD fed zebrafish group [66]. Recent studies revealed that IL-17 limits the excessive permeability of the gut barrier through the IL-17 receptor adaptor protein Act-1 [67]. The study of He et al. has further confirmed that IL-17 deficient mice showed disturbed intestinal barrier and altered GM, which promoted the development of fatty liver [61]. On the contrary, the latest Mendelian randomization study showed that IL-17 was related to the increased risk of fatty liver development [68]. Additionally, IL-17 showed an effect on the GM composition and fatty liver in an HFD mouse model via the yet unknown mechanism [69]. In this work, the levels of ptgs2b decreased drastically after treatment with L. gasseri. Together, these studies suggest a close relationship between IL-17 and fatty liver. Further research is required to determine the role of IL-17 in fatty liver development and progression.
Tumor-suppressor factor p53 has been studied for years and has become a point of interest for liver disease research due to its role in multiple signaling pathways that induce apoptosis, cell cycle arrest, cell differentiation and angiogenesis [70,71]. The latest research revealed that p53 has a major function in the development of fatty liver [72,73,74]. P53 contributes to the accumulation of lipid droplets [75] and lipid metabolism [76,77,78] and promotes the development of obesity by regulating adipose tissue differentiation [79]. Furthermore, there is a growing amount of evidence that p53 is involved in various forms of hepatocellular injury [80,81,82,83,84]. Our findings further confirmed elevated p53 signaling pathways in the HCD zebrafish model (Figure 4D). Thus, it is clear that p53 is associated with fatty liver; however, several previous studies obtained controversial results. A number of studies have, in fact, shown that activated p53 is essential to fatty liver development [76,83,85], while others pointed out that inhibition of p53 led to the aggravation of liver steatosis [81,86,87,88,89].
Estrogens contribute to the regulation of multiple organ systems, as well as the regulation of liver lipid metabolism [90]. According to the results obtained from a transgenic mouse model, the liver showed the highest response to estrogen [91]. Thus, estrogen deficiency can lead to increased liver lipid deposition and disturbances in liver energy metabolism [92]. Mostly, estrogen performs its functions through the interaction with steroid nuclear hormone receptors, estrogen receptor alpha (Erα) or estrogen receptor beta (ERβ) [90]. Unliganded ERα and ERβ bind to Hsp90. Hsp90, together with p23 and immunophilin, form a large molecular complex to keep ERα stable and inactive [93]. The inhibition of Hsp90 leads to ERα ubiquitination and subsequent proteasomal degradation [94,95]. Our findings revealed the downregulation of Hsp90aa.1 gene in the HCD zebrafish group, which indicates that Estrogen action is disrupted in fatty liver disease. After treatment with L. gasseri, the expression level of Hsp90aa.1 was increased.
Overall, this study demonstrated that L. gasseri attenuated fatty liver progression by the attenuation of oxidative stress, as well as lipid accumulation and inflammation, and regulation of host gene expression profiles. Therefore, L. gasseri is a promising probiotic that can be used for the treatment of fatty liver.

4. Materials and Methods

4.1. Bacteria Cultivation

Lactobacillus gasseri M01 GDMCC60781 (L. gasseri M01) was a laboratory-conserved strain deposited in GDMCC (Guangdong Microbial Culture Collection Center, Guangzhou, China) [96]. In this research, L. gasseri M01 was revived, activated and grown in Man Rogosa Sharpe (MRS) broth at 37 °C for 12 h in accordance with the previous study [96].

4.2. Zebrafish Husbandry

Zebrafish were raised in compliance with the compliance with Institutional Animal Care and Use Committee (IACUC) guidelines of Nanjing Tech University for laboratory animal use. Adult wild-type zebrafish (Tübingen line) were obtained from Nanjing Yaoshunyu Biotechnology Co., Ltd. (Nanjing, China) and maintained in accordance with the standard procedures as described previously [97]. Transgenic zebrafish embryos with macrophages labeled with mCherry, Tg (mpx:mCherry) were provided by China Zebrafish Research Center (CZRC). Transgenic zebrafish embryos Tg (lfabp:dsRed) were gifted from Professor Mingfang He’s lab (School of Biological and Pharmaceutical Engineering, Nanjing Tech University, Nanjing, China). Fish spawning was implemented artificially by light stimulation, with the male–female mating ratio of 1:2. All of the embryos were maintained in a closed flow-through system with 14 h–10 h light-dark cycle at a temperature of 28 ± 0.5 °C [98]. The embryos were not used for experimental treatments when the fertilization rate was lower than 85%.

4.3. Preparation of High Cholesterol Diet and Bacteria

Cholesterol (purity: ≥92.5%) was purchased from Sigma-Aldrich (St. Louis, MO, USA). Bezafibrate (purity: ≥98%, BZT) was obtained from Aladdin (Shanghai, China). BZT was the positive control drug, which was dissolved in dimethyl sulfoxide (DMSO, Nanjing Chemical Reagent Co. Ltd., Nanjing, China) with water to a final concentration of 10 µM/L (DMSO 0.001% v/v) [55]. Zebrafish larvae, after three days fertilization, were fed basic food, paramecium culture and AP100 (Shanghai FishBio Co., Ltd., Shanghai, China) daily. The HCD was prepared by mixing cholesterol and basic food in ether (2 mL ether per gram of food) and then using a 60 °C water bath to volatilize the ether of the HCD [55]. The final cholesterol concentration in HCD was 4% (w/w) [99]. The present study was carried out with both the cells (L. gasseri suspension) and the cell-free culture supernatants (L. gasseri breaking supernatant). The L. gasseri suspension was prepared by centrifuging the L. gasseri culturing medium at 4000 rpm for 5 min, discarding the supernatant, washing the cells 3 times with phosphate-buffered saline (PBS) and then 3 times with zebrafish culture water; L. gasseri breaking supernatant was prepared by ultrasonic treatment of L. gasseri suspension. The ultrasonic treatment time was 25 min, with 5 s pauses every 3 s. Then, the supernatant was collected by centrifuge at 12,000× g rpm for 10 min. The L. gasseri suspension and L. gasseri breaking supernatant were diluted to 106 and 107 CFU/mL with culture water as low and high concentrations, respectively.

4.4. Grouping of Experimental Animals

Eight-day post-fertilization (dpf) zebrafish larvae were randomly divided into 7 groups (n = 100 per group) and fed different diets as follows: (1) Control (Ctrl), AP100 (20 mg/tank per day); (2) high cholesterol diet treated groups (HCD), AP100 (20 mg/tank per day) and 4% (w/w) cholesterol; (3) Bezafibrate-treated groups (BZT), AP100 (20 mg/tank per day), 4% (w/w) cholesterol and 10 µM/L BZT; (4) L. gasseri suspension groups with low concentration of bacteria (LG (SL)), AP100 (20 mg/tank per day), 4% (w/w) cholesterol and 106 CFU/mL suspension of L. gasseri; (5) LG (SH) groups, AP100 (20 mg/tank per day), 4% (w/w) cholesterol and 107 CFU/mL suspension of L. gasseri; (6) LG (BL) groups, AP100 (20 mg/tank per day), 4% (w/w) cholesterol and 106 CFU/mL breaking supernatant of L. gasseri; (7) LG (BH) groups, AP100 (20 mg/tank per day), 4% (w/w) cholesterol and 107 CFU/mL breaking supernatant of L. gasseri. All of the groups were maintained following the schedule of Figure 1A.

4.5. Biochemical Analysis

The content of the malondialdehyde (MDA) levels was measured using a commercial assay kit (Nanjing Jiancheng Bioengineering Institute, Nanjing, China), following the manufacturer’s instructions. The quantitation of reactive oxygen species (ROS) was detected with the Reactive Oxygen Species Assay Kit (Beyotime Biotechnology, Shanghai, China), according to the manufacturer’s instructions. Briefly, 30 zebrafish larvae from the groups above were defrosted and homogenized with 10 volumes of iced PBS (pH 7.4) for 20 min. The homogenate was then centrifuged by cryogenic centrifuge (Thermo Fisher Scientific, Waltham, MA, USA) at 4000× g rpm for 5 min, and the supernatant was collected for the biochemical tests. All of the measurements were repeated three times.

4.6. Histopathological Analysis

Zebrafish larvae were fixed with 4% paraformaldehyde in phosphate-buffered saline (P6748, Sigma-Aldrich, St. Louis, MO, USA) and paraffin-embedded. Microtome was used to slice the larvae into 5 μm thickness sections, and the slices were stained with hematoxylin and eosin (H&E). H&E (H-3404, Vector labs) staining was carried out following the manufacturer’s protocols. The pathological features of histopathology were analyzed based on the previous study [100]. At least five sections from each treatment group were microphotographed using an inverted microscope (Nikon ECLIPSE Ts2, Tokyo, Japan).

4.7. Nile Red Staining

Nile red is a lipophilic fluorescent substance that labels triglycerides and fatty acids with red fluorescence. In this study, Nile red (purity: ≥95%) purchased from Macklin (Shanghai, China) was dissolved with acetone to 2 mg/mL and then diluted with water to the final concentration of 1 mg/mL. The zebrafish larvae were stained with the Nile red solution in the dark for 30 min and washed with water three times. After cleaning, the zebrafish larvae were anesthetized with 0.05% tricaine and kept in sodium carboxymethyl cellulose (CMC-Na) (4%). The photomicrograph was immediately performed under an emission maximum of about 638 nm using a fluorescence stereoscope (Nikon ECLIPSE Ts2, Tokyo, Japan).

4.8. Quantification of Reactive Oxygen Species (ROS)

For in vivo ROS detection, 15 living zebrafish larvae at 7 dpf in each group were randomly collected and stained with 100 μM of 2′,7′-dichlorodihydrofluorescein (DCFH-DA, Beyotime Biotechnology, Shanghai, China) for 40 min, following the instructions. After rinsing with water three times for 5 min each, at diacetate, at least 10 fish from each group were photographed at the excitation of 488 nm wavelength (Nikon ECLIPSE Ti2E, Tokyo, Japan).

4.9. Real-Time Quantitative PCR (qRT-PCR) Analysis

A total of 30 zebrafish larvae of each group were sacrificed to extract the total RNA using Trizol reagent (Invitrogen, Carlsbad, CA, USA) and purified using the RNease Mini Kit (Qiagen, Valencia, CA, USA). The concentrations of the total RNA were quantified using a nucleic acid and protein spectrophotometer (Nano-300, Aosheng Instrument Co., Ltd., Hangzhou, China). HiScript II qRT SuperMix (Vazyme, Nanjing, China) was used to perform the reverse transcription for cDNA synthesis. The qPCR was implemented on the StepOnePlus Real-Time PCR System (Applied Biosystems, Foster City, CA, USA) by adding the ChamQTM Universal SYBR qPCR Master Mix (Vazyme, Nanjing, China) following the manufacturer’s protocol. The qPCR was performed with 2 min for template annealing at 95 °C, 40 cycles of amplification at 95 °C for 10 s, 60 °C for 30 s, and a final extension at 95 °C for 15 s and 60 °C for 2 min. Primers (Table 1) were designed using PRIMER 5 software and purchased from GenScript, Nanjing China. The 2−∆∆Ct method was used to calculate the expression levels of each targeting mRNA by normalizing it to glyceraldehyde-3-phosphate dehydrogenase (Gapdh) [101]. All of the samples were determined in triplicate.

4.10. RNA Transcriptomic Analysis

The total RNA was isolated, and the RNA quality was assessed using an Agilent 2100 Bioanalyzer (Agilent Technologies, Palo Alto, CA, USA). RNA sequencing was implemented after the construction of the library using the TruSeq PE Cluster Kit V3-cBot-HS (Illumina, NEB, USA). All libraries were loaded into the same lane of the HiSeq 2000 (TruSeq SBS KIT-HS V3, Illumina, Santa Clara, CA, USA) at Beijing Genomics Institute (Shenzhen, China). The raw reads obtained were filtered through SOAPnuke (v1.5.2) to remove low-quality reads and linker sequences. The clean reads were mapped to the zebrafish reference sequence database (Danio rerio, UCSC version danRer7, 2010) with TopHat2.0 (http://ccb.jhu.edu/software/tophat/index.shtml, accessed on 2 December 2020) [102]. DESeq2 (v1.4.5) was used to identify the differentially expressed genes (DEGs) between groups. The parameters for assessing transcripts with differential expression were Q value <  0.05 and |log2FC|  >  1 [103]. The heatmap was generated with Heatmap (v1.0.8) according to the identified differentially expressed genes in each sample. The DEGs were analyzed with GO (http://www.geneontology.org/, accessed on 7 December 2020), the Database for Annotation, Visualization and Integrated Discovery (DAVID), KEGG (http://www.kegg.jp/kegg/pathway.html, accessed on 7 December 2020) enrichment annotation and BGI online system, Dr. Tom (BGI-Shenzhen, Shenzhen, China) to take insight to the changes in gene expression and signaling.

4.11. Statistical Analysis

All of the experiments were repeated independently at least three times. Statistical analysis was performed through GraphPad Prism 6 (GraphPad Software, San Diego, CA, USA). The difference between the treatment groups and the corresponding control was compared by one-way analysis of variance (ANOVA) with Tukey’s honestly significant difference test (Tukey’s HSD) at the significance p-value < 0.05. All of the data were presented as mean values ± standard deviation (SD). The fluorescence intensity was evaluated with digital images produced using the Image J software (developed by the National Institutes of Health) as described [104].

Supplementary Materials

The following supporting information can be downloaded at: https://www.mdpi.com/article/10.3390/ijms24032053/s1.

Author Contributions

Y.Z. and C.T. conceived and designed the experiments; T.H., X.L., H.W., Z.C., S.C. and L.Z. performed all experiments; Y.Z., N.L., H.W. and Z.D. analyzed data; T.H., N.L. and Y.Z. wrote and reviewed the manuscript. All authors have read and agreed to the published version of the manuscript.

Funding

This work was supported by grants from the National Natural Science Foundation of China (No. 31701279) and Xiamen Municipal Science and Technology Bureau-Xiamen City Division of Funding Management Project (No. 3502Z20203016).

Institutional Review Board Statement

This study was approved by the ethics committee of Nanjing Tech University.

Informed Consent Statement

Not applicable.

Data Availability Statement

The data that to support the findings of this study are available from the corresponding author upon request.

Acknowledgments

We thank Mingfang He in Nanjing Tech University in China for the gift of transgenic zebrafish and Zhiyuan Gong at the National University of Singapore for valuable suggestions about this research.

Conflicts of Interest

The authors declare no competing interests.

References

  1. Goh, B.B.; Mccullough, A.J. Natural History of Nonalcoholic Fatty Liver Disease. Dig. Dis. Sci. 2016, 61, 1226–1233. [Google Scholar] [CrossRef] [PubMed]
  2. Longo, D.L.; Diehl, A.M.; Day, C. Cause, Pathogenesis, and Treatment of Nonalcoholic Steatohepatitis. N. Engl. J. Med. 2017, 377, 2063–2072. [Google Scholar]
  3. Ying, L.; Yan, F.; Zhao, Y.; Gao, H.; Williams, B.R.; Hu, Y.; Li, X.; Tian, R.; Xu, P.; Wang, Y. (-)-Epigallocatechin-3-gallate and atorvastatin treatment down-regulates liver fibrosis-related genes in non-alcoholic fatty liver disease. Clin. Exp. Pharmacol. Physiol. 2017, 44, 1180–1191. [Google Scholar] [CrossRef] [PubMed]
  4. Wong, R.J.; Aguilar, M.; Cheung, R.; Perumpail, R.B.; Harrison, S.A.; Younossi, Z.M.; Ahmed, A. Onalcoholic Steatohepatitis Is the Second Leading Etiology of Liver Disease Among Adults Awaiting Liver Transplantation in the United States. Gastroenterology 2015, 148, 547–555. [Google Scholar] [CrossRef]
  5. Haddad, T.M.; Hamdeh, S.; Kanmanthareddy, A.; Alla, V.M. Nonalcoholic fatty liver disease and the risk of clinical cardiovascular events: A systematic review and meta-analysis. Diabetes Metab. Syndr. 2017, 11, S209–S216. [Google Scholar] [CrossRef]
  6. Miyoshi, M.; Ogawa, A.; Higurashi, S.; Kadooka, Y. Anti-obesity effect of Lactobacillus gasseri SBT2055 accompanied by inhibition of pro-inflammatory gene expression in the visceral adipose tissue in diet-induced obese mice. Eur. J. Nutr. 2014, 53, 599–606. [Google Scholar] [CrossRef]
  7. Malaguarnera, M.; Rosa, M.D.; Nicoletti, F.; Malaguarnera, L. Molecular mechanisms involved in NAFLD progression. J. Mol. Med. 2009, 87, 679. [Google Scholar] [CrossRef]
  8. Qin, G.; Ma, J.; Huang, Q.; Yin, H.; Han, J.; Li, M.; Deng, Y.; Wang, B.; Hassan, W.; Shang, J. Isoquercetin Improves Hepatic Lipid Accumulation by Activating AMPK Pathway and Suppressing TGF-β Signaling on an HFD-Induced Nonalcoholic Fatty Liver Disease Rat Model. Int. J. Mol. Sci. 2018, 19, 4126. [Google Scholar] [CrossRef] [Green Version]
  9. Park, S.S.; Lee, Y.J.; Song, S.; Kim, B.; Kang, H.; Oh, S.; Eungseok, K. Lactobacillus acidophilus ns1 attenuates diet-induced obesity and fatty liver. J. Endocrinol. 2018, 237, 87–100. [Google Scholar] [CrossRef]
  10. Yu, Y.; Dunaway, S.; Champer, J.; Kim, J.; Alikhan, A. Changing our microbiome: Probiotics in dermatology. Br. J. Dermatol. 2020, 182, 39–46. [Google Scholar] [CrossRef] [Green Version]
  11. Tilg, H.; Cani, P.D.; Mayer, E.A. Gut microbiome and liver diseases. Gut 2016, 65, 2035. [Google Scholar] [CrossRef] [PubMed]
  12. Harakeh, S.M.; Imran, K.; Taha, K.; Elie, B.; Almasaudi, S.B.; Bahijri, S.M.; Alfadul, S.M.; Ajabnoor, G.M.A.; Azhar, E.I. Gut Microbiota: A Contributing Factor to Obesity. Front. Cell. Infect. Microbiol. 2016, 6, 95. [Google Scholar] [CrossRef] [PubMed] [Green Version]
  13. Leung, C.; Rivera, L.; Furness, J.B.; Angus, P.W. The role of the gut microbiota in NAFLD. Nat. Rev. Gastroenterol. Hepatol. 2016, 13, 412–425. [Google Scholar] [CrossRef] [PubMed]
  14. Hu, H.; Lin, A.; Kong, M.; Yao, X.; Liu, H. Intestinal microbiome and NAFLD: Molecular insights and therapeutic perspectives. J. Gastroenterol. 2020, 55, 142–158. [Google Scholar] [CrossRef] [Green Version]
  15. Fernandes, C.F.; Shahani, K.M.; Amer, M.A. Therapeutic role of dietary lactobacilli and lactobacillic fermented dairy products. Fems Microbiol. Lett. 1987, 46, 343–356. [Google Scholar] [CrossRef]
  16. Kato, I.; Kobayashi, S.; Yokokura, T.; Mutai, M. Antitumor activity of Lactobacillus casei in mice. Gan. Gann Jpn. J. Cancer Res. 1981, 72, 517–523. [Google Scholar]
  17. Perdigon, G.; De Macias, M.E.; Alvarez, S.; Oliver, G.; de Ruiz Holgado, A.A. Effect of perorally administered lactobacilli on macrophage activation in mice. Infect. Immun. 1986, 53, 404–410. [Google Scholar] [CrossRef] [Green Version]
  18. Perdigon, G.; Alvarez, S.; Nader, D.; Roux, M.E.; Pesce, D. The Oral Administration of Lactic Acid Bacteria Increase the Mucosal Intestinal Immunity in Response to Enteropathogens. J. Food Prot. 1990, 53, 404–410. [Google Scholar] [CrossRef]
  19. Sato, K. Enhancement of host resistance against Listeria infection by Lactobacillus casei: Role of macrophages. Infect. Immun. 1984, 44, 445–451. [Google Scholar] [CrossRef] [Green Version]
  20. Wong, W.S.; Wong, L.H.; Chim, M.L.; Chu, C.W.; Yeung, K.W.; Li, C.T.; Chan, L.Y. Treatment of nonalcoholic steatohepatitis with probiotics. A proof-of-concept study. Ann. Hepatol. 2013, 12, 256–262. [Google Scholar] [CrossRef]
  21. Miyazawa, K.; Kawase, M.; Kubota, A.; Yoda, K.; He, F. Heat-killed Lactobacillus gasseri can enhance immunity in the elderly in a doubleblind, placebo-controlled clinical study. Benef. Microbes 2012, 6, 1–9. [Google Scholar]
  22. Motevaseli, E.; Shirzad, M.; Akrami, S.M.; Mousavi, A.S.; Mirsalehian, A.; Modarressi, M.H. Normal and tumour cervical cells respond differently to vaginal lactobacilli, independent of pH and lactate. J. Med. Microbiol. 2013, 62, 1065–1072. [Google Scholar] [CrossRef] [PubMed]
  23. Kasuga, G.; Tanaka, M.; Harada, Y.; Nagashima, H.; Masuda, T. Homologous Expression and Characterization of Gassericin T and Gassericin S, a Novel Class IIb Bacteriocin Produced by Lactobacillus gasseri LA327. Appl. Environ. Microbiol. 2019, 85, e02815-18. [Google Scholar] [CrossRef] [PubMed]
  24. Reuter, G. The Lactobacillus and Bifidobacterium microflora of the human intestine: Composition and succession. Curr. Issues Intest. Microbiol. 2001, 2, 43–53. [Google Scholar]
  25. Marín, M.; Arroyo, R.; Jiménez, E.; Gómez, A.; Fernández, L.; Rodríguez, J. Cold storage of human milk: Effect on its bacterial composition. J. Pediatr. Gastroenterol. Nutr. 2009, 49, 343–348. [Google Scholar] [CrossRef]
  26. Sato, M.; Uzu, K.; Yoshida, T.; Hamad, E.M.; Kawakami, H.; Matsuyama, H.; Abd El-Gawad, I.A.; Imaizumi, K. Effects of milk fermented by Lactobacillus gasseri SBT2055 on adipocyte size in rats. Br. J. Nutr. 2008, 99, 1013–1017. [Google Scholar] [CrossRef] [Green Version]
  27. Ogawa, A.; Kadooka, Y.; Kato, K.; Shirouchi, B.; Sato, M. Lactobacillus gasseri SBT2055 reduces postprandial and fasting serum non-esterified fatty acid levels in Japanese hypertriacylglycerolemic subjects. Lipids Heal. Dis. 2014, 13, 1–8. [Google Scholar] [CrossRef] [Green Version]
  28. Lee, N.Y.; Shin, M.J.; Youn, G.S.; Yoon, S.J.; Choi, Y.R.; Kim, H.S.; Gupta, H.; Han, S.H.; Kim, B.K.; Lee, D.Y.; et al. Lactobacillus attenuates progression of nonalcoholic fatty liver disease by lowering cholesterol and steatosis. Clin. Mol. Hepatol. 2021, 27, 110–124. [Google Scholar] [CrossRef]
  29. Arguello, G.; Balboa, E.; Arrese, M.; Zanlungo, S. Recent insights on the role of cholesterol in non-alcoholic fatty liver disease. Biochim. Et Biophys. Acta (BBA)-Mol. Basis Dis. 2015, 1852, 1765–1778. [Google Scholar] [CrossRef] [Green Version]
  30. Tomita, K.; Teratani, T.; Suzuki, T.; Shimizu, M.; Sato, H.; Narimatsu, K.; Okada, Y.; Kurihara, C.; Irie, R.; Yokoyama, H. Free cholesterol accumulation in hepatic stellate cells: Mechanism of liver fibrosis aggravation in nonalcoholic steatohepatitis in mice. Hepatology 2014, 59, 154–169. [Google Scholar] [CrossRef]
  31. Liong, M.-T.; Dunshea, F.R.; Shah, N.P. Effects of a synbiotic containing Lactobacillus acidophilus ATCC 4962 on plasma lipid profiles and morphology of erythrocytes in hypercholesterolaemic pigs on high-and low-fat diets. Br. J. Nutr. 2007, 98, 736–744. [Google Scholar] [CrossRef] [PubMed] [Green Version]
  32. Simons, L.A.; Amansec, S.G.; Conway, P. Effect of Lactobacillus fermentum on serum lipids in subjects with elevated serum cholesterol. Nutr. Metab. Cardiovasc. Dis. 2006, 16, 531–535. [Google Scholar] [CrossRef] [PubMed]
  33. Mahboubi, M. Lactobacillus gasseri as a Functional Food and Its Role in Obesity. Int. J. Med. Rev. 2019, 6, 59–64. [Google Scholar] [CrossRef]
  34. Park, Y.-H.; Kim, J.-G.; Shin, Y.-W.; Kim, S.-H.; Whang, K.-Y. Effect of dietary inclusion of Lactobacillus acidophilus ATCC 43121 on cholesterol metabolism in rats. J. Microbiol. Biotechnol. 2007, 17, 655–662. [Google Scholar]
  35. Palaniyandi, S.A.; Damodharan, K.; Suh, J.-W.; Yang, S.H. Probiotic characterization of cholesterol-lowering Lactobacillus fermentum MJM60397. Probiotics Antimicrob. Proteins 2020, 12, 1161–1172. [Google Scholar] [CrossRef]
  36. Fuentes, M.C.; Lajo, T.; Carrión, J.M.; Cuné, J. Cholesterol-lowering efficacy of Lactobacillus plantarum CECT 7527, 7528 and 7529 in hypercholesterolaemic adults. Br. J. Nutr. 2013, 109, 1866–1872. [Google Scholar] [CrossRef] [Green Version]
  37. Ogawa, A.; Kobayashi, T.; Sakai, F.; Kadooka, Y.; Kawasaki, Y. Lactobacillus gasseri SBT2055 suppresses fatty acid release through enlargement of fat emulsion size in vitro and promotes fecal fat excretion in healthy Japanese subjects. Lipids Health Dis. 2015, 14, 1–10. [Google Scholar] [CrossRef] [Green Version]
  38. MacArthur, J.M.; Bishop, J.R.; Stanford, K.I.; Wang, L.; Bensadoun, A.; Witztum, J.L.; Esko, J.D. Liver heparan sulfate proteoglycans mediate clearance of triglyceride-rich lipoproteins independently of LDL receptor family members. J. Clin. Investig. 2007, 117, 153–164. [Google Scholar] [CrossRef]
  39. Sunny, N.E.; Parks, E.J.; Browning, J.D.; Burgess, S.C. Excessive hepatic mitochondrial TCA cycle and gluconeogenesis in humans with nonalcoholic fatty liver disease. Cell Metab. 2011, 14, 804–810. [Google Scholar] [CrossRef] [Green Version]
  40. Saponaro, C.; Sabatini, S.; Gaggini, M.; Carli, F.; Rosso, C.; Positano, V.; Armandi, A.; Caviglia, G.P.; Faletti, R.; Bugianesi, E. Adipose tissue dysfunction and visceral fat are associated to hepatic insulin resistance and severity of NASH even in lean individuals. Liver Int. 2022, 42, 2418–2427. [Google Scholar] [CrossRef]
  41. Paul, B.; Henne, W.M. How cells flex their PEX to fine-tune lipolysis in NAFLD. Nat. Metab. 2021, 3, 1591–1593. [Google Scholar] [CrossRef] [PubMed]
  42. Aregger, M.; Lawson, K.A.; Billmann, M.; Costanzo, M.; Tong, A.H.; Chan, K.; Rahman, M.; Brown, K.R.; Ross, C.; Usaj, M. Systematic mapping of genetic interactions for de novo fatty acid synthesis identifies C12orf49 as a regulator of lipid metabolism. Nat. Metab. 2020, 2, 499–513. [Google Scholar] [CrossRef] [PubMed]
  43. Campagnoli, L.I.M.; Marchesi, N.; Vairetti, M.; Pascale, A.; Ferrigno, A.; Barbieri, A. Age-Related NAFLD: The Use of Probiotics as a Supportive Therapeutic Intervention. Cells 2022, 11, 2827. [Google Scholar] [CrossRef]
  44. Azad, M.A.K.; Sarker, M.; Wan, D. Immunomodulatory Effects of Probiotics on Cytokine Profiles. BioMed. Res. Int. 2018, 2018, 8063647. [Google Scholar] [CrossRef] [Green Version]
  45. María Remes-Troche, J.; Coss-Adame, E.; Ángel Valdovinos-Díaz, M.; Gómez-Escudero, O.; Eugenia Icaza-Chávez, M.; Antonio Chávez-Barrera, J.; Zárate-Mondragón, F.; Antonio Velarde-Ruíz Velasco, J.; Rafael Aceves-Tavares, G.; Antonio Lira-Pedrín, M.; et al. Lactobacillus acidophilus LB: A useful pharmabiotic for the treatment of digestive disorders. Ther. Adv. Gastroenterol. 2020, 13, 1756284820971201. [Google Scholar] [CrossRef]
  46. Sánchez, B.; Delgado, S.; Blanco-Míguez, A.; Lourenço, A.; Gueimonde, M.; Margolles, A. Probiotics, gut microbiota, and their influence on host health and disease. Mol. Nutr. Food Res. 2017, 61, 1600240. [Google Scholar] [CrossRef] [Green Version]
  47. Chen, L.; Li, H.; Li, J.; Chen, Y.; Yang, Y. Lactobacillus rhamnosus GG treatment improves intestinal permeability and modulates microbiota dysbiosis in an experimental model of sepsis. Int. J. Mol. Med. 2019, 43, 1139–1148. [Google Scholar] [CrossRef] [PubMed] [Green Version]
  48. Forsyth, C.B.; Farhadi, A.; Jakate, S.M.; Tang, Y.; Shaikh, M.; Keshavarzian, A. Lactobacillus GG treatment ameliorates alcohol-induced intestinal oxidative stress, gut leakiness, and liver injury in a rat model of alcoholic steatohepatitis. Alcohol 2009, 43, 163–172. [Google Scholar] [CrossRef] [Green Version]
  49. Tao, Y.; Drabik, K.A.; Waypa, T.S.; Musch, M.W.; Alverdy, J.C.; Schneewind, O.; Chang, E.B.; Petrof, E.O. Soluble factors from Lactobacillus GG activate MAPKs and induce cytoprotective heat shock proteins in intestinal epithelial cells. Am. J. Physiol. Cell Physiol. 2006, 290, C1018–C1030. [Google Scholar] [CrossRef] [PubMed] [Green Version]
  50. Park, J.S.; Choi, J.W.; Jhun, J.; Kwon, J.Y.; Lee, B.I.; Yang, C.W.; Park, S.H.; Cho, M.L. Lactobacillus acidophilus Improves Intestinal Inflammation in an Acute Colitis Mouse Model by Regulation of Th17 and Treg Cell Balance and Fibrosis Development. J. Med. Food 2018, 21, 215–224. [Google Scholar] [CrossRef] [Green Version]
  51. Vemuri, R.; Shinde, T.; Gundamaraju, R.; Gondalia, S.V.; Karpe, A.V.; Beale, D.J.; Martoni, C.J.; Eri, R. Lactobacillus acidophilus DDS-1 Modulates the Gut Microbiota and Improves Metabolic Profiles in Aging Mice. Nutrients 2018, 10, 1255. [Google Scholar] [CrossRef] [Green Version]
  52. Gonzalez, A.; Huerta-Salgado, C.; Orozco-Aguilar, J.; Aguirre, F.; Tacchi, F.; Simon, F.; Cabello-Verrugio, C. Role of Oxidative Stress in Hepatic and Extrahepatic Dysfunctions during Nonalcoholic Fatty Liver Disease (NAFLD). Oxidative Med. Cell. Longev. 2020, 2020, 1617805. [Google Scholar] [CrossRef]
  53. Conti, V.; Izzo, V.; Corbi, G.; Russomanno, G.; Manzo, V.; De Lise, F.; Di Donato, A.; Filippelli, A. Antioxidant Supplementation in the Treatment of Aging-Associated Diseases. Front. Pharmacol. 2016, 7, 24. [Google Scholar] [CrossRef] [PubMed] [Green Version]
  54. Kanda, T.; Matsuoka, S.; Yamazaki, M.; Shibata, T.; Nirei, K.; Takahashi, H.; Kaneko, T.; Fujisawa, M.; Higuchi, T.; Nakamura, H. Apoptosis and non-alcoholic fatty liver diseases. World J. Gastroenterol. 2018, 24, 2661. [Google Scholar] [CrossRef]
  55. Ma, J.; Yin, H.; Li, M.; Deng, Y.; Ahmad, O.; Qin, G.; He, Q.; Li, J.; Gao, K.; Zhu, J. A comprehensive study of high cholesterol diet-induced larval zebrafish model: A short-time in vivo screening method for non-alcoholic fatty liver disease drugs. Int. J. Biol. Sci. 2019, 15, 973. [Google Scholar] [CrossRef]
  56. Kobatake, E.; Nakagawa, H.; Seki, T.; Miyazaki, T. Protective effects and functional mechanisms of Lactobacillus gasseri SBT2055 against oxidative stress. PLoS ONE 2017, 12, e0177106. [Google Scholar] [CrossRef] [PubMed]
  57. Jiang, X.; Gu, S.; Liu, D.; Zhao, L.; Xia, S.; He, X.; Chen, H.; Ge, J. Lactobacillus brevis 23017 Relieves Mercury Toxicity in the Colon by Modulation of Oxidative Stress and Inflammation Through the Interplay of MAPK and NF-κB Signaling Cascades. Front. Microbiol. 2018, 9, 2425. [Google Scholar] [CrossRef] [PubMed]
  58. Chen, K.; Liu, Y.; Cheng, Y.; Yan, Q.; Zhou, C.; He, Z.; Zeng, J.; He, J.; Tan, Z. Supplementation of Lactobacillus plantarum or Macleaya cordata Extract Alleviates Oxidative Damage Induced by Weaning in the Lower Gut of Young Goats. Animals 2020, 10, 548. [Google Scholar] [CrossRef] [PubMed] [Green Version]
  59. Amaretti, A.; di Nunzio, M.; Pompei, A.; Raimondi, S.; Rossi, M.; Bordoni, A. Antioxidant properties of potentially probiotic bacteria: In vitro and in vivo activities. Appl. Microbiol. Biotechnol. 2013, 97, 809–817. [Google Scholar] [CrossRef] [PubMed]
  60. Wang, Y.; Wu, Y.; Wang, Y.; Xu, H.; Mei, X.; Yu, D.; Wang, Y.; Li, W. Antioxidant Properties of Probiotic Bacteria. Nutrients 2017, 9, 521. [Google Scholar] [CrossRef] [Green Version]
  61. He, S.; Cui, S.; Song, W.; Jiang, Y.; Chen, H.; Liao, D.; Lu, X.; Li, J.; Chen, X.; Peng, L. Interleukin-17 Weakens the NAFLD/NASH Process by Facilitating Intestinal Barrier Restoration Depending on the Gut Microbiota. Mbio 2022, 13, e03688-21. [Google Scholar] [CrossRef] [PubMed]
  62. Harley, I.T.W.; Stankiewicz, T.E.; Giles, D.A.; Softic, S.; Flick, L.M.; Cappelletti, M.; Sheridan, R.; Xanthakos, S.A.; Steinbrecher, K.A.; Sartor, R.B.; et al. IL-17 signaling accelerates the progression of nonalcoholic fatty liver disease in mice. Hepatology 2014, 59, 1830–1839. [Google Scholar] [CrossRef] [PubMed]
  63. Meng, F.; Wang, K.; Aoyama, T.; Grivennikov, S.I.; Paik, Y.; Scholten, D.; Cong, M.; Iwaisako, K.; Liu, X.; Zhang, M. Interleukin-17 signaling in inflammatory, Kupffer cells, and hepatic stellate cells exacerbates liver fibrosis in mice. Gastroenterology 2012, 143, 765–776.e3. [Google Scholar] [CrossRef] [PubMed] [Green Version]
  64. Garidou, L.; Pomié, C.; Klopp, P.; Waget, A.; Charpentier, J.; Aloulou, M.; Giry, A.; Serino, M.; Stenman, L.; Lahtinen, S. The gut microbiota regulates intestinal CD4 T cells expressing RORγt and controls metabolic disease. Cell Metab. 2015, 22, 100–112. [Google Scholar] [CrossRef] [Green Version]
  65. Gomes, A.L.; Teijeiro, A.; Burén, S.; Tummala, K.S.; Yilmaz, M.; Waisman, A.; Theurillat, J.-P.; Perna, C.; Djouder, N. Metabolic inflammation-associated IL-17A causes non-alcoholic steatohepatitis and hepatocellular carcinoma. Cancer Cell 2016, 30, 161–175. [Google Scholar] [CrossRef]
  66. Yu, J.; Ip, E.; dela Peña, A.; Hou, J.Y.; Sesha, J.; Pera, N.; Hall, P.; Kirsch, R.; Leclercq, I.; Farrell, G.C. COX-2 induction in mice with experimental nutritional steatohepatitis: Role as pro-inflammatory mediator. Hepatology 2006, 43, 826–836. [Google Scholar] [CrossRef]
  67. Lee, J.S.; Tato, C.M.; Joyce-Shaikh, B.; Gulen, M.F.; Cayatte, C.; Chen, Y.; Blumenschein, W.M.; Judo, M.; Ayanoglu, G.; McClanahan, T.K. Interleukin-23-independent IL-17 production regulates intestinal epithelial permeability. Immunity 2015, 43, 727–738. [Google Scholar] [CrossRef] [Green Version]
  68. Chen, J.; Zhou, H.; Jin, H.; Liu, K. Role of Inflammatory Factors in Mediating the Effect of Lipids on Nonalcoholic Fatty Liver Disease: A Two-Step, Multivariable Mendelian Randomization Study. Nutrients 2022, 14, 4434. [Google Scholar] [CrossRef]
  69. Bi, Y.; Li, C.; Liu, L.; Zhou, J.; Li, Z.; Deng, H.; Wu, C.; Han, Y.; Song, Y.; Tan, Y. IL-17A-dependent gut microbiota is essential for regulating diet-induced disorders in mice. Sci. Bull. 2017, 62, 1052–1063. [Google Scholar] [CrossRef] [Green Version]
  70. Zhang, X.; Lin, Y.; Lin, S.; Li, C.; Gao, J.; Feng, Z.; Wang, J.; Zhang, J.; Zhang, H.; Zhang, Y.; et al. Silencing of functional p53 attenuates NAFLD by promoting HMGB1-related autophagy induction. Hepatol. Int. 2020, 14, 828–841. [Google Scholar] [CrossRef]
  71. Yan, Z.; Miao, X.; Zhang, B.; Xie, J. p53 as a double-edged sword in the progression of non-alcoholic fatty liver disease. Life Sci. 2018, 215, 64–72. [Google Scholar] [CrossRef] [PubMed]
  72. Prokesch, A.; Graef, F.A.; Madl, T.; Kahlhofer, J.; Heidenreich, S.; Schumann, A.; Moyschewitz, E.; Pristoynik, P.; Blaschitz, A.; Knauer, M. Liver p53 is stabilized upon starvation and required for amino acid catabolism and gluconeogenesis. FASEB J. 2017, 31, 732. [Google Scholar] [CrossRef] [PubMed] [Green Version]
  73. Yahagi, N.; Shimano, H.; Matsuzaka, T.; Sekiya, M.; Najima, Y.; Okazaki, S.; Okazaki, H.; Tamura, Y.; Iizuka, Y.; Inoue, N. p53 involvement in the pathogenesis of fatty liver disease. J. Biol. Chem. 2004, 279, 20571–20575. [Google Scholar] [CrossRef] [PubMed] [Green Version]
  74. Guillen-Sacoto, M.J.; Martinez, A.F.; Abe, Y.; Kruszka, P.; Weiss, K.; Everson, J.L.; Bataller, R.; Kleiner, D.E.; Ward, J.M.; Sulik, K.K. Human germline hedgehog pathway mutations predispose to fatty liver. J. Hepatol. 2017, 67, 809–817. [Google Scholar] [CrossRef]
  75. Deisenroth, C.; Itahana, Y.; Tollini, L.; Jin, A.; Zhang, Y. p53-Inducible DHRS3 is an endoplasmic reticulum protein associated with lipid droplet accumulation. J. Biol. Chem. 2011, 286, 28343–28356. [Google Scholar] [CrossRef]
  76. Goldstein, I.; Rotter, V. Regulation of lipid metabolism by p53–fighting two villains with one sword. Trends Endocrinol. Metab. 2012, 23, 567–575. [Google Scholar] [CrossRef]
  77. Kung, C.-P.; Basu, S.; Murphy, M.E. A link between TP53 polymorphisms and metabolism. Mol. Cell. Oncol. 2016, 3, e1173769. [Google Scholar] [CrossRef] [Green Version]
  78. Parrales, A.; Iwakuma, T. p53 as a regulator of lipid metabolism in cancer. Int. J. Mol. Sci. 2016, 17, 2074. [Google Scholar] [CrossRef] [Green Version]
  79. Molchadsky, A.; Ezra, O.; Amendola, P.; Krantz, D.; Kogan-Sakin, I.; Buganim, Y.; Rivlin, N.; Goldfinger, N.; Folgiero, V.; Falcioni, R. p53 is required for brown adipogenic differentiation and has a protective role against diet-induced obesity. Cell Death Differ. 2013, 20, 774–783. [Google Scholar] [CrossRef]
  80. Younossi, Z.M.; Koenig, A.B.; Abdelatif, D.; Fazel, Y.; Henry, L.; Wymer, M. Global epidemiology of nonalcoholic fatty liver disease—Meta-analytic assessment of prevalence, incidence, and outcomes. Hepatology 2016, 64, 73–84. [Google Scholar] [CrossRef] [Green Version]
  81. Derdak, Z.; Villegas, K.A.; Harb, R.; Wu, A.M.; Sousa, A.; Wands, J.R. Inhibition of p53 attenuates steatosis and liver injury in a mouse model of non-alcoholic fatty liver disease. J. Hepatol. 2013, 58, 785–791. [Google Scholar] [CrossRef] [PubMed] [Green Version]
  82. Dibra, D.; Xia, X.; Mitra, A.; Cutrera, J.J.; Lozano, G.; Li, S. Mutant p53 in concert with an interleukin-27 receptor alpha deficiency causes spontaneous liver inflammation, fibrosis, and steatosis in mice. Hepatology 2016, 63, 1000–1012. [Google Scholar] [CrossRef] [Green Version]
  83. Porteiro, B.; Fondevila, M.F.; Delgado, T.C.; Iglesias, C.; Imbernon, M.; Iruzubieta, P.; Crespo, J.; Zabala-Letona, A.; Fernø, J.; González-Terán, B. Hepatic p63 regulates steatosis via IKKβ/ER stress. Nat. Commun. 2017, 8, 1–19. [Google Scholar] [CrossRef] [PubMed]
  84. Tomita, K.; Teratani, T.; Suzuki, T.; Oshikawa, T.; Yokoyama, H.; Shimamura, K.; Nishiyama, K.; Mataki, N.; Irie, R.; Minamino, T. p53/p66Shc-mediated signaling contributes to the progression of non-alcoholic steatohepatitis in humans and mice. J. Hepatol. 2012, 57, 837–843. [Google Scholar] [CrossRef] [PubMed]
  85. Xie, F.; Jia, L.; Lin, M.; Shi, Y.; Yin, J.; Liu, Y.; Chen, D.; Meng, Q. ASPP 2 attenuates triglycerides to protect against hepatocyte injury by reducing autophagy in a cell and mouse model of non-alcoholic fatty liver disease. J. Cell. Mol. Med. 2015, 19, 155–164. [Google Scholar] [CrossRef] [PubMed]
  86. Derdak, Z.; Lang, C.H.; Villegas, K.A.; Tong, M.; Mark, N.M.; Suzanne, M.; Wands, J.R. Activation of p53 enhances apoptosis and insulin resistance in a rat model of alcoholic liver disease. J. Hepatol. 2011, 54, 164–172. [Google Scholar] [CrossRef] [Green Version]
  87. Farrell, G.C.; Larter, C.Z.; Hou, J.Y.; Zhang, R.H.; Yeh, M.M.; Williams, J.; Dela Peňa, A.; Francisco, R.; Osvath, S.R.; Brooling, J. Apoptosis in experimental NASH is associated with p53 activation and TRAIL receptor expression. J. Gastroenterol. Hepatol. 2009, 24, 443–452. [Google Scholar] [CrossRef]
  88. Yokoyama, M.; Okada, S.; Nakagomi, A.; Moriya, J.; Shimizu, I.; Nojima, A.; Yoshida, Y.; Ichimiya, H.; Kamimura, N.; Kobayashi, Y. Inhibition of endothelial p53 improves metabolic abnormalities related to dietary obesity. Cell Rep. 2014, 7, 1691–1703. [Google Scholar] [CrossRef] [Green Version]
  89. Panasiuk, A.; Dzieciol, J.; Panasiuk, B.; Prokopowicz, D. Expression of p53, Bax and Bcl-2 proteins in hepatocytes in non-alcoholic fatty liver disease. World J. Gastroenterol. WJG 2006, 12, 6198. [Google Scholar] [CrossRef]
  90. Palmisano, B.T.; Zhu, L.; Stafford, J.M. Role of estrogens in the regulation of liver lipid metabolism. In Sex and Gender Factors Affecting Metabolic Homeostasis, Diabetes and Obesity; Springer: Cham, Switzerland, 2017; pp. 227–256. [Google Scholar]
  91. Ciana, P.; Raviscioni, M.; Mussi, P.; Vegeto, E.; Que, I.; Parker, M.G.; Lowik, C.; Maggi, A. In vivo imaging of transcriptionally active estrogen receptors. Nat. Med. 2003, 9, 82–86. [Google Scholar] [CrossRef] [PubMed]
  92. Duan, Z.; Ji, X.; Zhu, Y.; Zhao, D.; Han, K.; Gu, S.; Ma, L.; Jin, S.; Chen, J.; Li, T. Effects of Sheep Bone Collagen Peptide on Liver Lipid Deposition in Ovariectomized Rats. J. Nutr. Sci. Vitaminol. 2022, 68, 320–330. [Google Scholar] [CrossRef] [PubMed]
  93. Johnson, J.L.; Toft, D.O. A novel chaperone complex for steroid receptors involving heat shock proteins, immunophilins, and p23. J. Biol. Chem. 1994, 269, 24989–24993. [Google Scholar] [CrossRef]
  94. Roe, S.M.; Prodromou, C.; O’Brien, R.; Ladbury, J.E.; Piper, P.W.; Pearl, L.H. Structural basis for inhibition of the Hsp90 molecular chaperone by the antitumor antibiotics radicicol and geldanamycin. J. Med. Chem. 1999, 42, 260–266. [Google Scholar] [CrossRef] [PubMed]
  95. Maloney, A.; Workman, P. HSP90 as a new therapeutic target for cancer therapy: The story unfolds. Expert Opin. Biol. Ther. 2002, 2, 3–24. [Google Scholar] [CrossRef]
  96. Zhao, Y.; Wang, T.; Chen, Z.; Ren, H.; Song, P.; Zhu, Y.; Liang, S.; Tzeng, C. Development and Evaluation of a Thermosensitive In Situ Gel Formulation for Intravaginal Delivery of Lactobacillus gasseri. Pharmaceutics 2022, 14, 1934. [Google Scholar] [CrossRef]
  97. Zhao, Y.; Liu, Y.; Sun, J.; Sha, H.; Yang, Y.; Ye, Q.; Yang, Q.; Huang, B.; Yu, Y.; Huang, H. Acute toxic responses of embryo-larval zebrafish to zinc pyrithione (ZPT) reveal embryological and developmental toxicity. Chemosphere 2018, 205, 62–70. [Google Scholar] [CrossRef]
  98. Zhao, Y.; Wang, H.-L.; Li, T.-T.; Yang, F.; Tzeng, C.-M. Baicalin ameliorates dexamethasone-induced osteoporosis by regulation of the RANK/RANKL/OPG signaling pathway. Drug Des. Dev. Ther. 2020, 14, 195. [Google Scholar] [CrossRef] [Green Version]
  99. Chen, B.; Zheng, Y.-M.; Zhang, J.-P. Comparative study of different diets-induced NAFLD models of zebrafish. Front. Endocrinol. 2018, 9, 366. [Google Scholar] [CrossRef]
  100. Henderson, J.M.; Polak, N.; Chen, J.; Roediger, B.; Weninger, W.; Kench, J.G.; McCaughan, G.W.; Zhang, H.E.; Gorrell, M.D. Multiple liver insults synergize to accelerate experimental hepatocellular carcinoma. Sci. Rep. 2018, 8, 1–12. [Google Scholar] [CrossRef] [Green Version]
  101. Gao, H.; Bu, Y.; Wu, Q.; Wang, X.; Chang, N.; Lei, L.; Chen, S.; Liu, D.; Zhu, X.; Hu, K. Mecp2 regulates neural cell differentiation by suppressing the Id1 to Her2 axis in zebrafish. J. Cell Sci. 2015, 128, 2340–2350. [Google Scholar] [CrossRef] [PubMed] [Green Version]
  102. Lam, S.H.; Wu, Y.L.; Vega, V.B.; Miller, L.D.; Spitsbergen, J.; Tong, Y.; Zhan, H.; Govindarajan, K.R.; Lee, S.; Mathavan, S. Conservation of gene expression signatures between zebrafish and human liver tumors and tumor progression. Nat. Biotechnol. 2006, 24, 73–75. [Google Scholar] [CrossRef] [PubMed]
  103. Love, M.I.; Huber, W.; Anders, S. Moderated estimation of fold change and dispersion for RNA-seq data with DESeq2. Genome Biol. 2014, 15, 1–21. [Google Scholar] [CrossRef] [PubMed] [Green Version]
  104. Zhao, Y.; Huang, X.; Ding, T.W.; Gong, Z. Enhanced angiogenesis, hypoxia and neutrophil recruitment during Myc-induced liver tumorigenesis in zebrafish. Sci. Rep. 2016, 6, 1–12. [Google Scholar] [CrossRef] [PubMed]
Figure 1. Effects of L. gasseri on high cholesterol diet (HCD)-induced mortality and liver morphological changes of zebrafish larvae. (A) Experimental outline of the feeding protocols. (B) Percent survival of zebrafish larvae from 8 to 15 days post fertilization (dpf), n = 30. (C) Body weight was measured at 15 dpf (n = 10). (D) Representative images of morphological alterations of transgenic zebrafish Tg (lfabp10:dsRed) liver under the same subdivided groups. The liver was labeled with DsRed. Scale bars = 100 µm. (E) Quantification of the liver size of Tg (lfabp10: dsRed) in each group, n = 5. Data were represented as mean ± SD. * p < 0.05.
Ijms 24 02053 g001
Figure 2. Effects of L. gasseri on HCD-induced fatty liver on lipid accumulation and histological changes in zebrafish larvae. (A) H&E staining and Nile red staining. Zebrafish livers were indicated with the red arrows in H&E sections and framed with a yellow box in Nile red sections. Scale bars = 100 µm. (B) Qualifications of Nile red staining by the relative red fluorescence intensity using ImageJ (n = 5). Data were represented as mean ± SD. * p < 0.05.
Ijms 24 02053 g002aIjms 24 02053 g002b
Figure 3. Effects of L. gasseri on HCD-induced oxidative stress and macrophage aggregation in the liver of zebrafish larval. (A) Reactive oxygen species (ROS) staining with 2′,7′-dichlorodihydrofluorescein (DCFH-DA). Liver was outlined with yellow dot circles. (B) Quantification of ROS staining by measuring the green fluorescence density of zebrafish liver (n = 10). (C) Detection of the contents of malondialdehyde (MDA) in vivo (n = 10). (D) Infiltration of macrophages in the liver was examined using the reporter transgenic line Tg (mpx:mCherry). Macrophages were labeled with red fluorescence. Liver was indicated with blue dot circles. (E) Quantification of the number of macrophages in the liver of zebrafish (n = 10). Scale bars = 100 µm. Values were represented as mean ± SD. * p < 0.05.
Ijms 24 02053 g003
Figure 4. Transcriptome profiling of HCD-induced alternations of gene expression during liver injury in zebrafish larvae. (A) Hierarchical clustering of RNA-Sequencing data showed differentially expressed genes (DEGs) between Ctrl and HCD-induced groups (|log2FC| > 0, Q value < 0.05) by Pearson correlation method without mean centering. High and low levels of gene expression were represented by red and blue. (B) Volcano plots of identified DEGs of log2 (fold change) versus-log10 (Q value). The up-regulated DEGs are indicated with red dots, and the down-regulated DEGs are indicated with blue dots. Grey dots represent non-DEGs. (C) GO annotation, including biological process (BP) (a,d), molecular function (MF) (b,e) and cellular component (CC) (c,f) were characterized by DAVID analysis. (D) KEGG pathway analysis of DEGs. The top 20 enriched KEGG pathways associated with up- and down-regulated mRNA transcripts were presented in bar charts (a,b). Q < 0.05 were considered to be enriched.
Ijms 24 02053 g004
Figure 5. Transcriptomic analysis of gene expression pattern after L. gasseri administration. (A) Principal component analysis (PCA) of the samples, including Ctrl, HCD and LG (BH). (B) Violin plot displayed the distribution of log2 (TPM + 1) of gene expressed in each group. TPM, transcript per million. The white dot marks the mean value of the distribution, and the black bar corresponds to the 25th (bottom) and 75th (top) percentile range. (C) Venn diagram showed the overlapping DEGs between HCD vs. Ctrl and LG (BH) vs. HCD (|log2FC| > 0, Q value < 0.05). (D) Differential cluster heat map of fold change (log2 fold change) of the overlapping 140 DEGs using Pearson correlation method without mean centering. (E) KEGG enrichment of the overlapping 140 DEGs. (F) The top 10 KEGG pathway relationship network with the largest node connections number of genes. The correlated pathways and genes were connected by black edges.
Ijms 24 02053 g005aIjms 24 02053 g005b
Figure 6. The expression of identified genes at key junction nodes in KEGG pathway relationship network. (A) The RNA-sequencing analysis of the expression of hsp90aa1.1, kyat3, hsd17b7, irs2a, myl9b, ptgs2b, cdk21 and papss2a in experimental groups. (B) Validation of screened genes by qRT-PCR test. Log2 (fold change) between treatment samples and control were calculated by the −∆∆CT method of three biologically independent replicates. Data are shown as the means ± SD. * p < 0.05.
Ijms 24 02053 g006
Table 1. Primers sequences.
GeneGene IDForward SequenceReverse Sequence
papss2a777719GCAAGTTGTAGGCACCAGAGCCATGACGGATGTTGTCACC
hsd17b7768185TAGCTTAGCCTTGAACCGCCTGGTATTTGGCCATCGGGTC
cdk21569515CTGAAGCCTGACAATGTGCTGCAAGCCAATTACCTCAAAGA
myl9b406493CTGCTTCGATGAGGAGGGATGGCTCCGTGTTTGAGGATTC
iras2a393285CTCCGAGGTGGCATCAGTTACCCCCTTCACTTGCAGTCCGTATT
ptgs2b559020CCCCAGAGTACTGGAAACCAACATGGCCCGTTGACATTAT
hsp90aa1.130591AGGCCTTTGTGCCGGATTTATTGCAGTGGGGTGTTTATGC
kyat3393315TGGAATGTGGGACAGAACCAGCCAACAGCCTCCTGTAATG
gapdh317743CCAACTGCCTGGCTCCTTCCCATCAACGGTCTTCTGTG
Disclaimer/Publisher’s Note: The statements, opinions and data contained in all publications are solely those of the individual author(s) and contributor(s) and not of MDPI and/or the editor(s). MDPI and/or the editor(s) disclaim responsibility for any injury to people or property resulting from any ideas, methods, instructions or products referred to in the content.

