

Raman Spectroscopy as a Tool to Study the Pathophysiology of Brain Diseases
 , and
, and 
Abstract
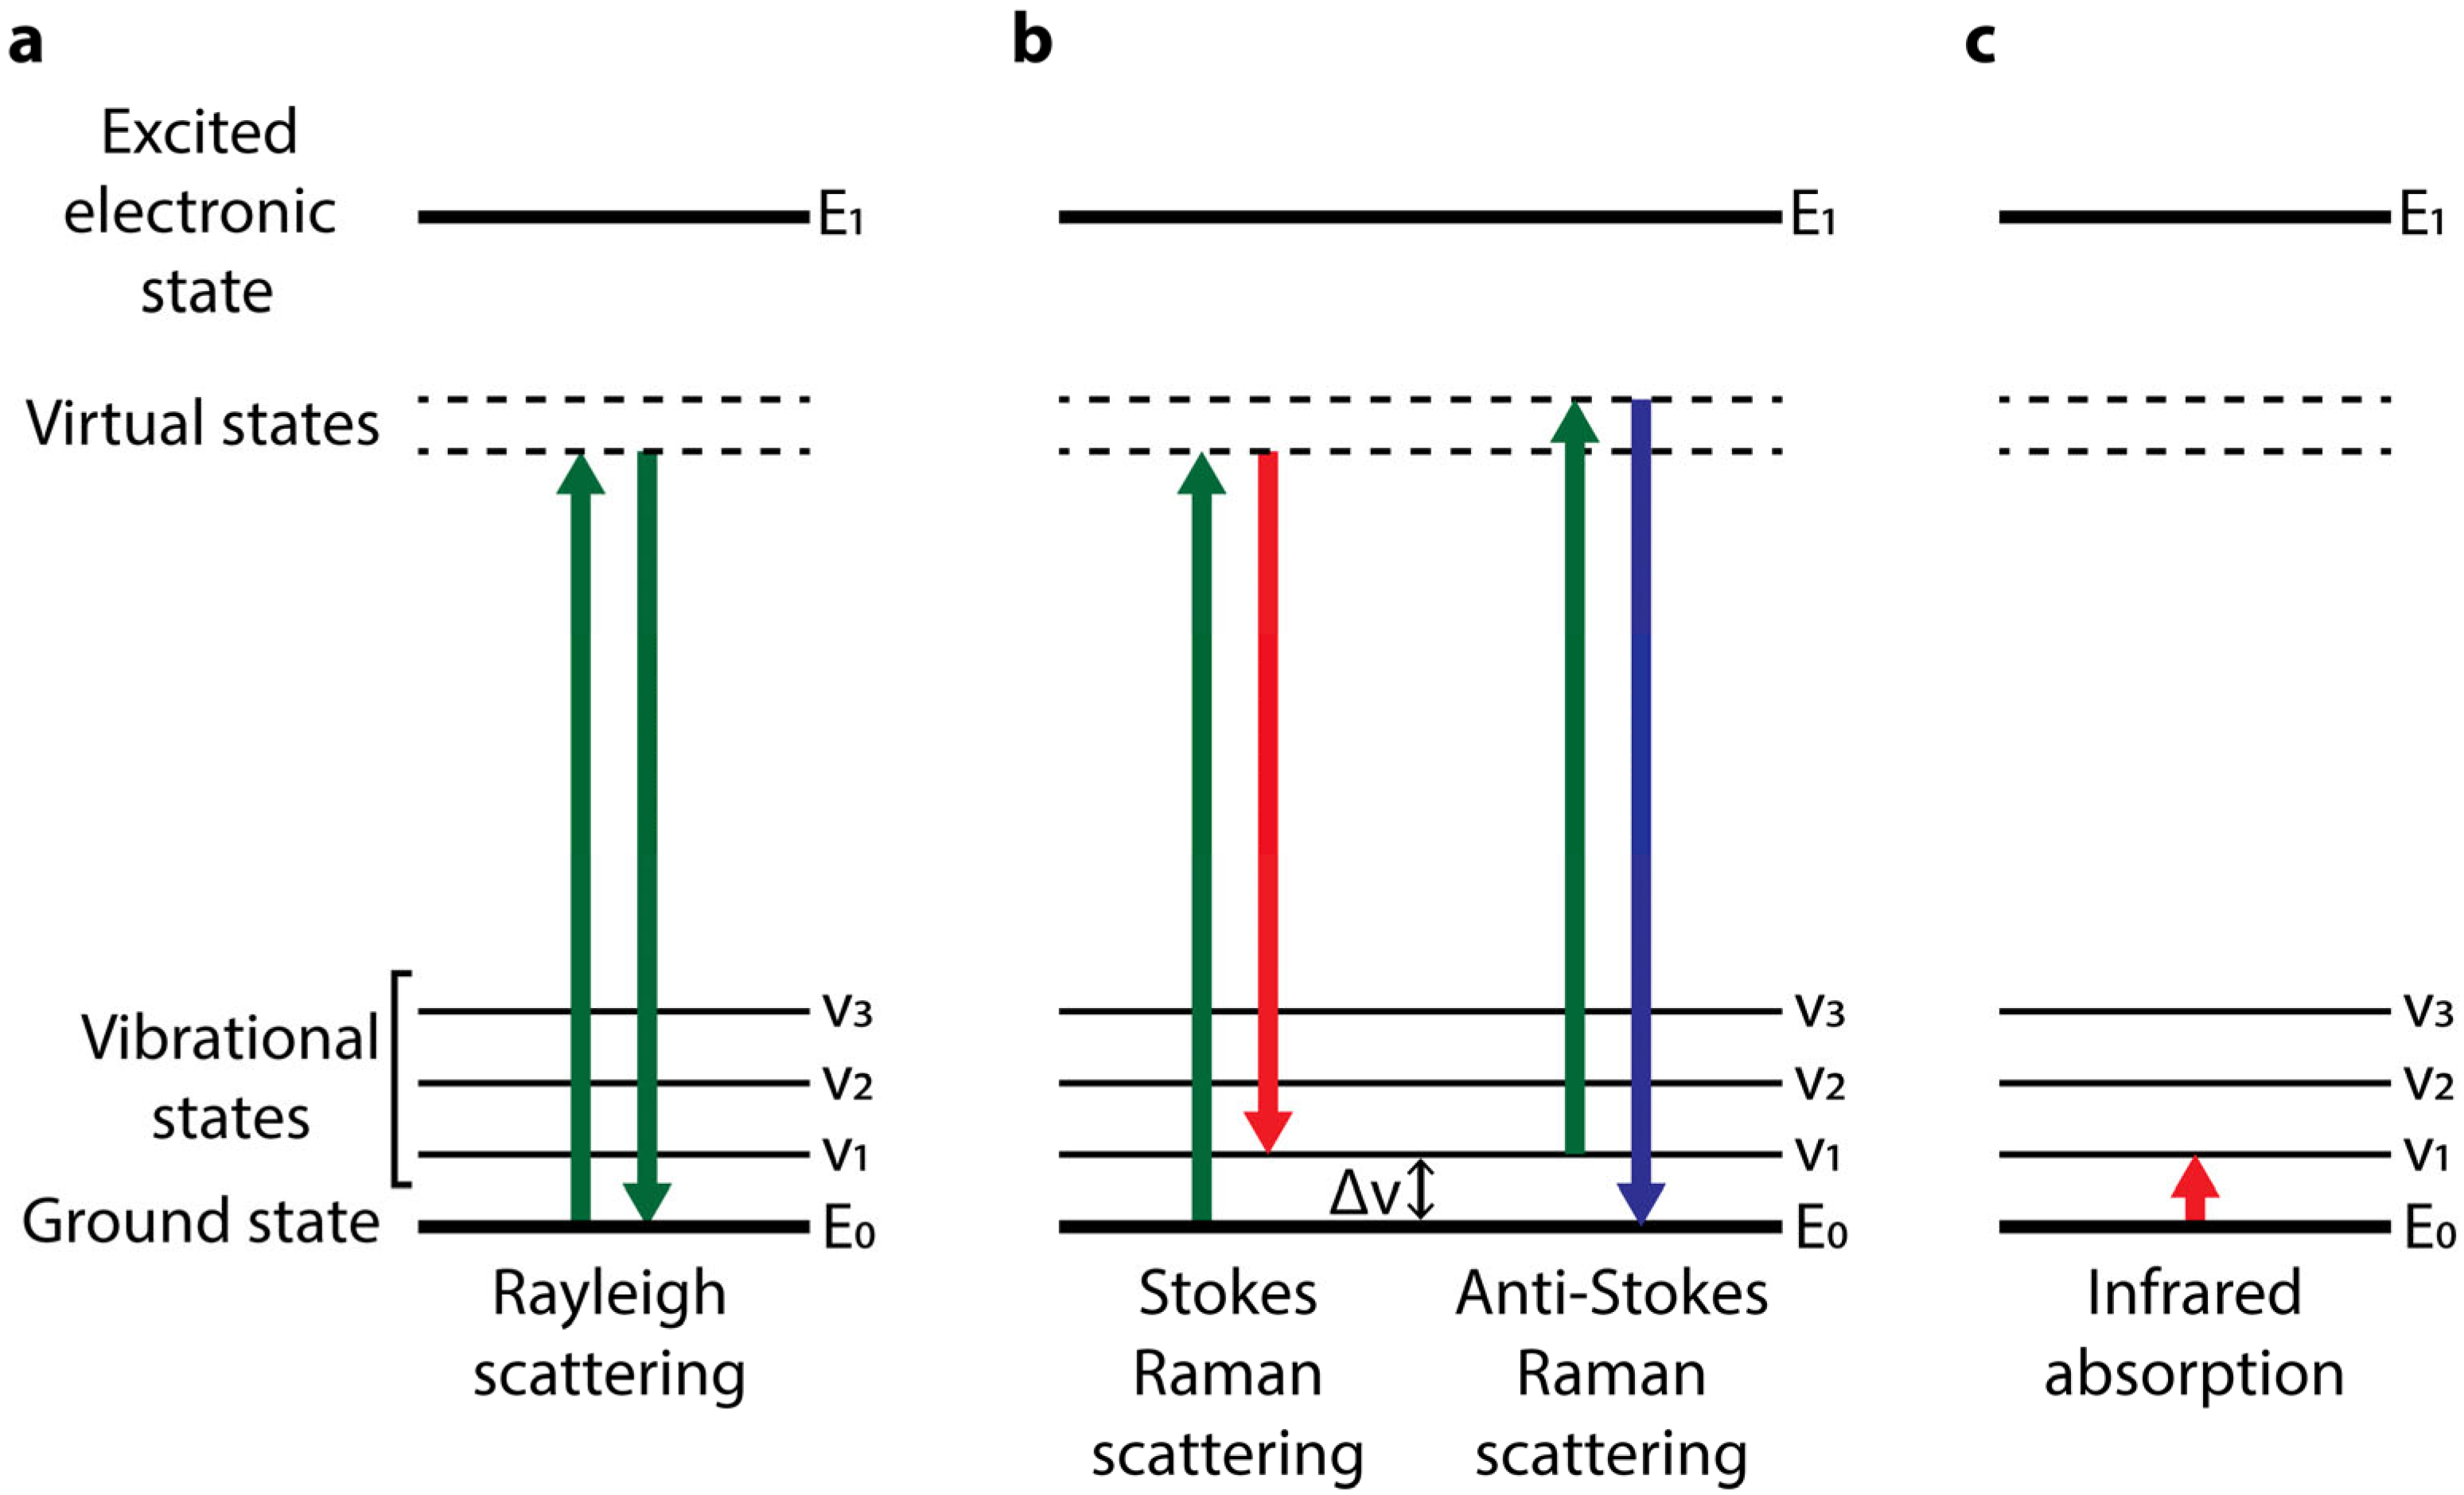
:1. Raman Scattering
2. Raman Spectroscopy of Biomolecules
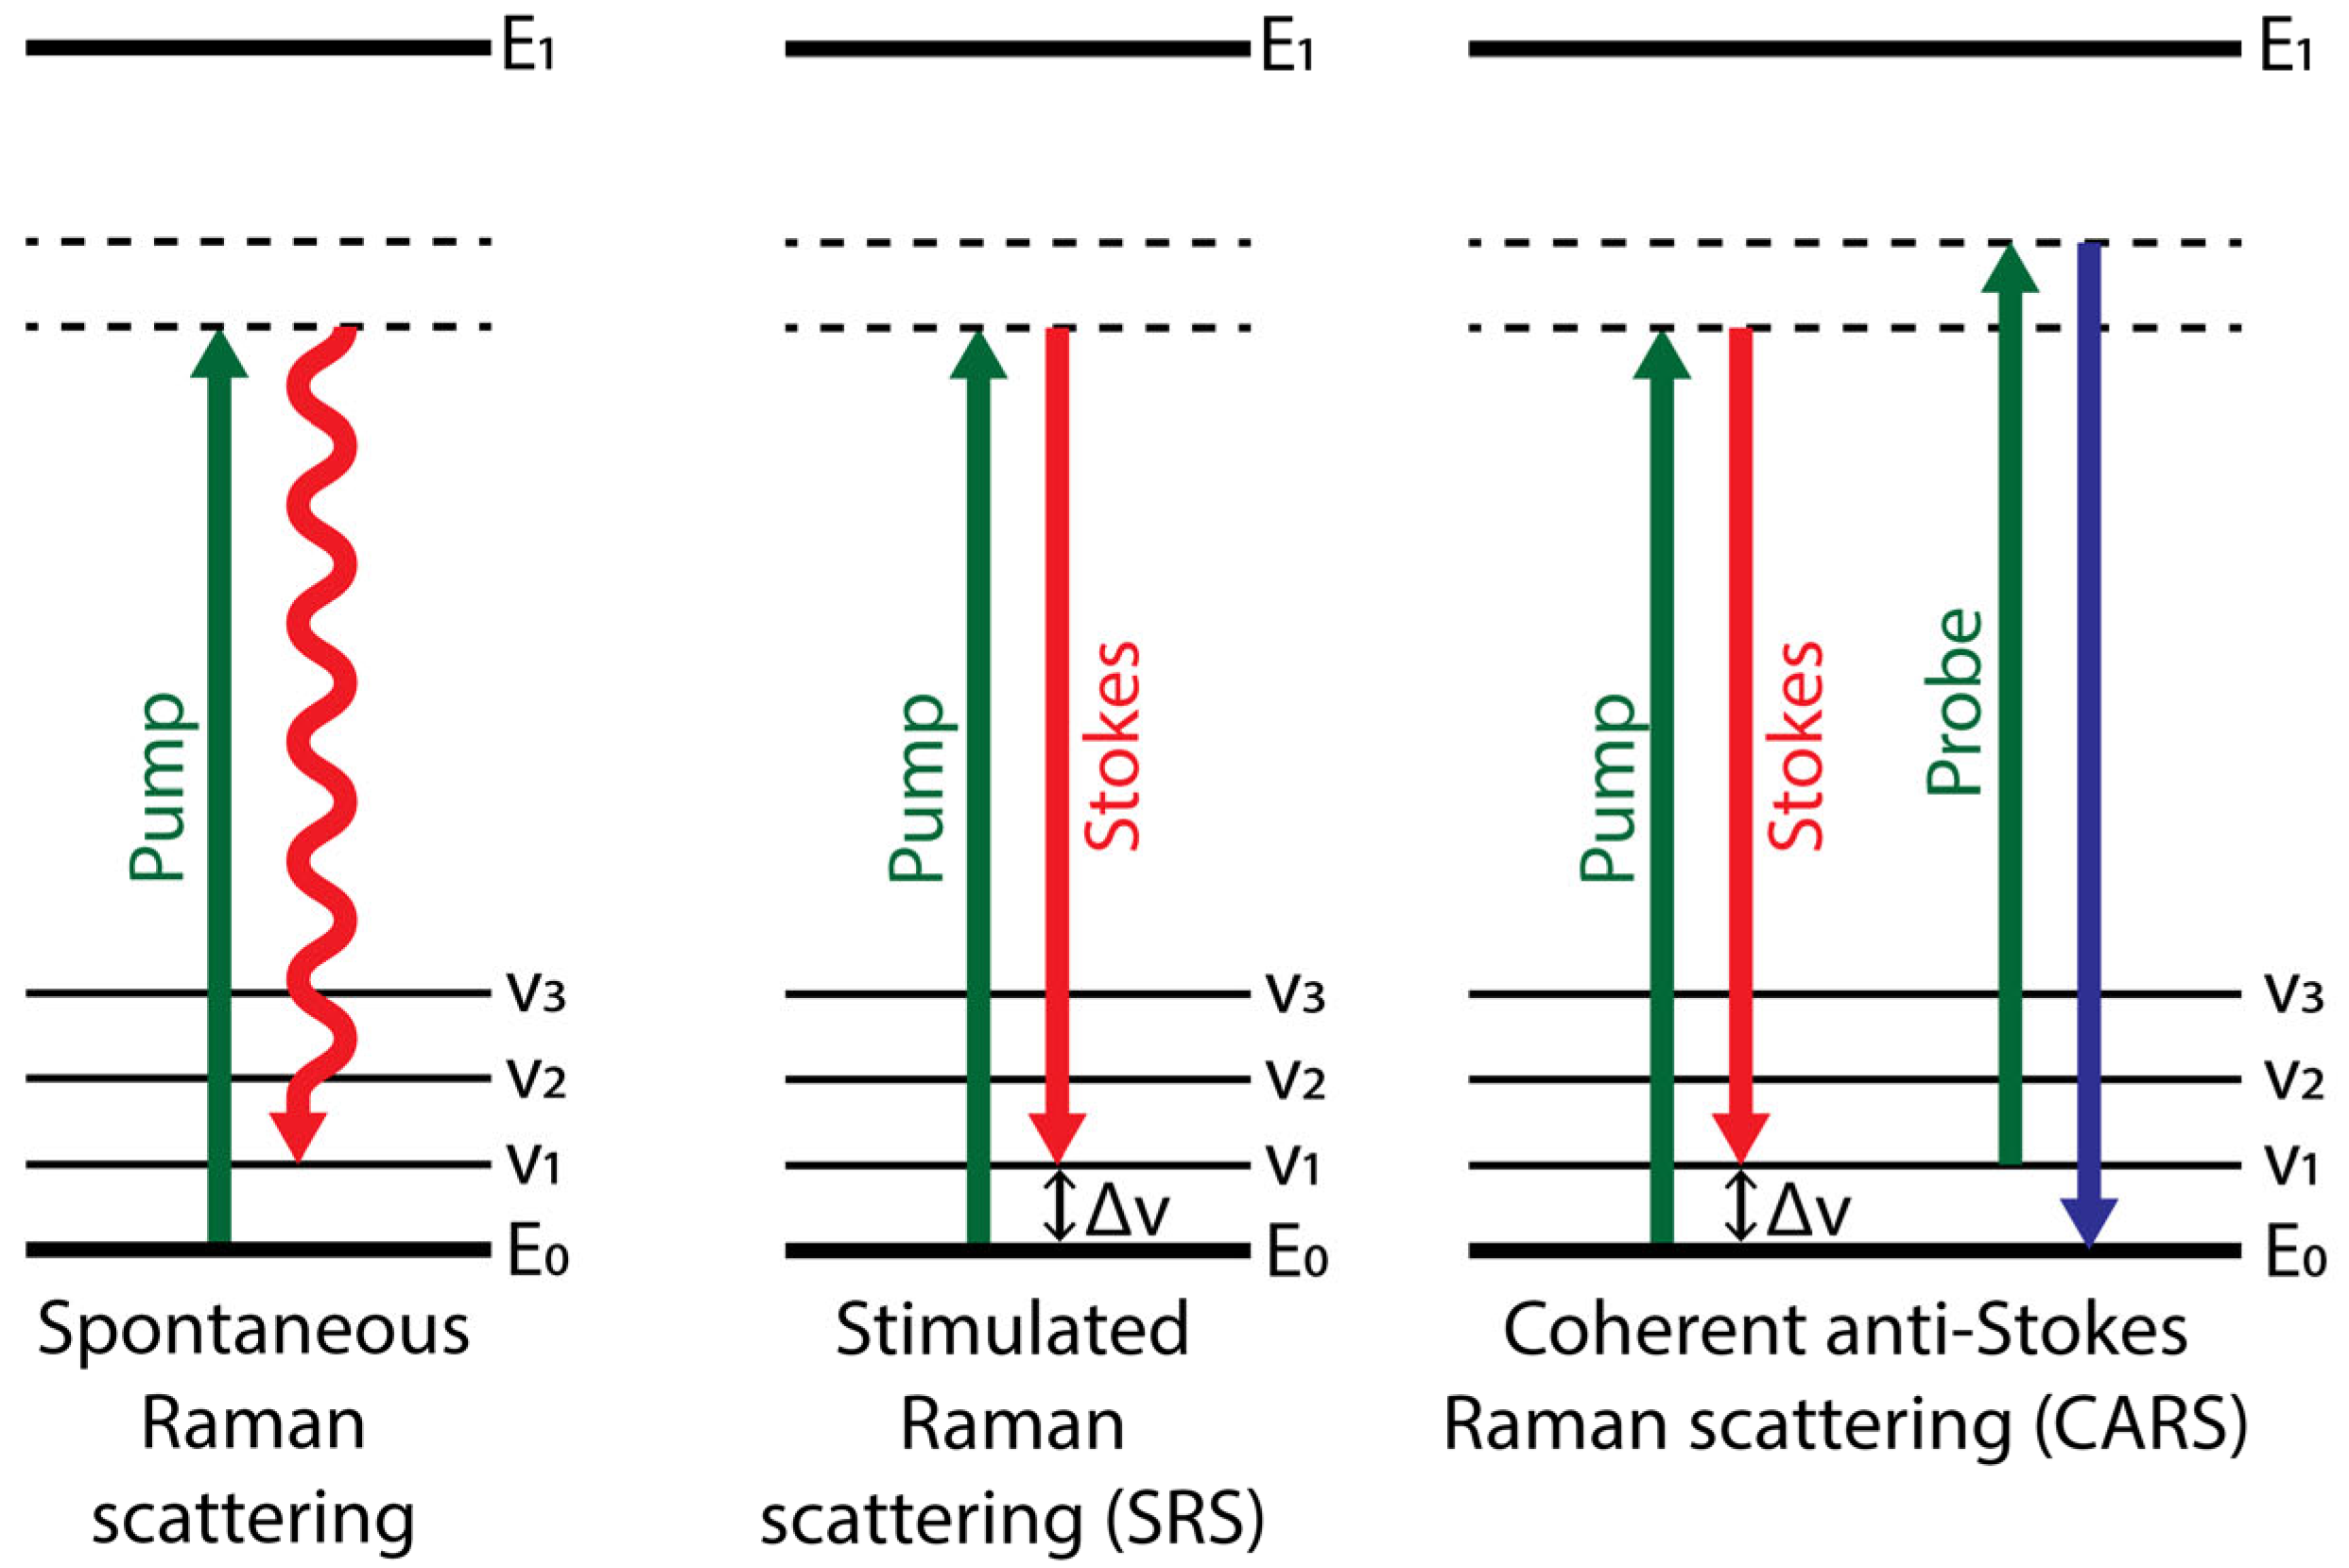
2.1. Modes of Raman Spectroscopy and Imaging
2.2. Raman Tags
3. Raman Spectroscopy in Brain Pathophysiology
3.1. Traumatic Brain Injury and Ischemia
3.2. Neurodegenerative Diseases
3.3. Cancer
4. Concluding Remarks
Author Contributions
Funding
Institutional Review Board Statement
Informed Consent Statement
Data Availability Statement
Conflicts of Interest
References
- Raman, C.V.; Krishnan, K.S. A New Type of Secondary Radiation. Nature 1928, 121, 501–502. [Google Scholar] [CrossRef]
- Smith, E.; Dent, G. Modern Raman Spectroscopy: A Practical Approach; Wiley: New York, NY, USA, 2004; ISBN 9781119440598. [Google Scholar]
- Ferraro, J.R.; Nakamoto, K.; Brown, C.W. Introductory Raman Spectroscopy, 2nd ed.; Elsevier Inc.: Amsterdam, The Netherlands, 2003; ISBN 9780122541056. [Google Scholar]
- Long, D.A. The Raman Effect: A Unified Treatment of the Theory of Raman Scattering by Molecules; Wiley: New York, NY, USA, 2002; ISBN 978-0-471-49028-9. [Google Scholar]
- Shipp, D.W.; Sinjab, F.; Notingher, I. Raman Spectroscopy: Techniques and Applications in the Life Sciences. Adv. Opt. Photonics 2017, 9, 315. [Google Scholar] [CrossRef] [Green Version]
- Colthup, N.B.; Daly, L.H.; Wiberley, S.E. Introduction to Infrared and Raman Spectroscopy, 2nd ed.; Academic Press: Cambridge, MA, USA, 1975. [Google Scholar]
- De Gelder, J.; De Gussem, K.; Vandenabeele, P.; Moens, L. Reference Database of Raman Spectra of Biological Molecules. J. Raman Spectrosc. 2007, 38, 1133–1147. [Google Scholar] [CrossRef]
- Notingher, I. Raman Spectroscopy Cell-Based Biosensors. Sensors 2007, 7, 1343–1358. [Google Scholar] [CrossRef] [Green Version]
- Petry, R.; Schmitt, M.; Popp, J. Raman Spectroscopy—A Prospective Tool in the Life Sciences. Chemphyschem 2003, 4, 14–30. [Google Scholar] [CrossRef]
- Colaianni, S.E.M.; Nielsen, O.F. Low-Frequency Raman Spectroscopy. J. Mol. Struct. 1995, 347, 267–283. [Google Scholar] [CrossRef]
- Bartels, R.A.; Oron, D.; Rigneault, H. Low Frequency Coherent Raman Spectroscopy. J. Phys. Photonics 2021, 3, 042004. [Google Scholar] [CrossRef]
- Chou, K.C. Low-Frequency Motions in Protein Molecules. Beta-Sheet and Beta-Barrel. Biophys. J. 1985, 48, 289–297. [Google Scholar] [CrossRef] [Green Version]
- Brooks, B.; Karplus, M. Normal Modes for Specific Motions of Macromolecules: Application to the Hinge-Bending Mode of Lysozyme. Proc. Natl. Acad. Sci. USA 1985, 82, 4995–4999. [Google Scholar] [CrossRef] [Green Version]
- Turton, D.A.; Senn, H.M.; Harwood, T.; Lapthorn, A.J.; Ellis, E.M.; Wynne, K. Terahertz Underdamped Vibrational Motion Governs Protein-Ligand Binding in Solution. Nat. Commun. 2014, 5, 3999. [Google Scholar] [CrossRef]
- Kalanoor, B.S.; Ronen, M.; Oren, Z.; Gerber, D.; Tischler, Y.R. New Method to Study the Vibrational Modes of Biomolecules in the Terahertz Range Based on a Single-Stage Raman Spectrometer. ACS Omega 2017, 2, 1232–1240. [Google Scholar] [CrossRef] [PubMed] [Green Version]
- Soffer, Y.; Raanan, D.; Oron, D. Low Frequency Collinear Pre-Resonant Impulsive Stimulated Raman Microspectroscopy. ACS Photonics 2020, 7, 3481–3488. [Google Scholar] [CrossRef]
- Ren, L.; Hurwitz, I.; Raanan, D.; Oulevey, P.; Oron, D.; Silberberg, Y. Terahertz Coherent Anti-Stokes Raman Scattering Microscopy. Optica 2019, 6, 52. [Google Scholar] [CrossRef]
- Lippert, J.L.; Tyminski, D.; Desmeules, P.J. Determination of the Secondary Structure of Proteins by Laser Raman Spectroscopy. J. Am. Chem. Soc. 1976, 98, 7075–7080. [Google Scholar] [CrossRef] [PubMed]
- Williams, R.W. Protein Secondary Structure Analysis Using Raman Amide I and Amide III Spectra. Method. Enzymol. 1986, 130, 311–331. [Google Scholar] [CrossRef]
- Maiti, N.C.; Apetri, M.M.; Zagorski, M.G.; Carey, P.R.; Anderson, V.E. Raman Spectroscopic Characterization of Secondary Structure in Natively Unfolded Proteins: A-Synuclein. J. Am. Chem. Soc. 2004, 126, 2399–2408. [Google Scholar] [CrossRef]
- Benevides, J.M.; Thomas, G.J. Characterization of DNA Structures by Raman Spectroscopy: High-Salt and Low-Salt Forms of Double Helical Poly(DG-DC) in H2O and D2O Solutions and Application to B, Z and A-DNA. Nucleic Acids Res. 1983, 11, 5747–5761. [Google Scholar] [CrossRef] [Green Version]
- Czamara, K.; Majzner, K.; Pacia, M.Z.; Kochan, K.; Kaczor, A.; Baranska, M. Raman Spectroscopy of Lipids: A Review. J. Raman Spectrosc. 2015, 46, 4–20. [Google Scholar] [CrossRef]
- Noestheden, M.; Hu, Q.; Tay, L.-L.; Tonary, A.M.; Stolow, A.; Mackenzie, R.; Tanha, J.; Pezacki, J.P. Synthesis and Characterization of CN-Modified Protein Analogues as Potential Vibrational Contrast Agents. Bioorg. Chem. 2007, 35, 284–293. [Google Scholar] [CrossRef]
- Yamakoshi, H.; Dodo, K.; Okada, M.; Ando, J.; Palonpon, A.; Fujita, K.; Kawata, S.; Sodeoka, M. Imaging of Edu, an Alkyne-Tagged Cell Proliferation Probe, by Raman Microscopy. J. Am. Chem. Soc. 2011, 133, 6102–6105. [Google Scholar] [CrossRef]
- Patil, C.A.; Pence, I.J.; Lieber, C.A.; Mahadevan-Jansen, A. 1064 Nm Dispersive Raman Spectroscopy of Tissues with Strong Near-Infrared Autofluorescence. Opt. Lett. 2014, 39, 303. [Google Scholar] [CrossRef] [PubMed]
- Hamada, K.; Fujita, K.; Smith, N.I.; Kobayashi, M.; Inouye, Y.; Kawata, S. Raman Microscopy for Dynamic Molecular Imaging of Living Cells. J. Biomed. Opt. 2008, 13, 1. [Google Scholar] [CrossRef] [PubMed]
- Palonpon, A.F.; Ando, J.; Yamakoshi, H.; Dodo, K.; Sodeoka, M.; Kawata, S.; Fujita, K. Raman and SERS Microscopy for Molecular Imaging of Live Cells. Nat. Protoc. 2013, 8, 677–692. [Google Scholar] [CrossRef] [PubMed]
- Rocha-Mendoza, I.; Licea-Rodriguez, J.; Marro, M.; Olarte, O.E.; Plata-Sanchez, M.; Loza-Alvarez, P. Rapid Spontaneous Raman Light Sheet Microscopy Using Cw-Lasers and Tunable Filters. Biomed. Opt. Express 2015, 6, 3449–3461. [Google Scholar] [CrossRef] [PubMed] [Green Version]
- Oshima, Y.; Kimura, T.; Kajiura-Kobayashi, H.; Naruse, K.; Sato, H.; Nonaka, S. Light Sheet-Excited Spontaneous Raman Imaging of a Living Fish by Optical Sectioning in a Wide Field Raman Microscope. Opt. Express 2012, 20, 16195–16204. [Google Scholar] [CrossRef]
- Okuno, M.; Hamaguchi, H. Multifocus Confocal Raman Microspectroscopy for Fast Multimode Vibrational Imaging of Living Cells. Opt. Lett. 2010, 35, 4096–4098. [Google Scholar] [CrossRef] [Green Version]
- Schlücker, S.; Schaeberle, M.D.; Huffman, S.W.; Levin, I.W. Raman Microspectroscopy: A Comparison of Point, Line, and Wide-Field Imaging Methodologies. Anal. Chem. 2003, 75, 4312–4318. [Google Scholar] [CrossRef]
- Wang, N.; Cao, H.; Wang, L.; Ren, F.; Zeng, Q.; Xu, X.; Liang, J.; Zhan, Y.; Chen, X. Recent Advances in Spontaneous Raman Spectroscopic Imaging: Instrumentation and Applications. Curr. Med. Chem. 2020, 27, 6188–6207. [Google Scholar] [CrossRef] [PubMed]
- Serebrennikova, K.V.; Berlina, A.N.; Sotnikov, D.V.; Zherdev, A.V.; Dzantiev, B.B. Raman Scattering-Based Biosensing: New Prospects and Opportunities. Biosensors 2021, 11, 512. [Google Scholar] [CrossRef]
- Saar, B.G.; Freudiger, C.W.; Reichman, J.; Stanley, C.M.; Holtom, G.R.; Xie, X.S. Video-Rate Molecular Imaging In Vivo with Stimulated Raman Scattering. Science 2010, 330, 1368–1370. [Google Scholar] [CrossRef]
- Cheng, J.; Volkmer, A.; Book, L.D.; Xie, X.S. Multiplex Coherent Anti-Stokes Raman Scattering Microspectroscopy and Study of Lipid Vesicles. J. Phys. Chem. B 2002, 106, 8493–8498. [Google Scholar] [CrossRef]
- Wurpel, G.W.H.; Schins, J.M.; Müller, M. Chemical Specificity in Three-Dimensional Imaging with Multiplex Coherent Anti-Stokes Raman Scattering Microscopy. Opt. Lett. 2002, 27, 1093–1095. [Google Scholar] [CrossRef] [Green Version]
- Müller, M.; Schins, J.M. Imaging The Thermodynamic State of Lipid Membranes with Multiplex CARS Microscopy. J. Phys. Chem. B 2002, 106, 3715–3723. [Google Scholar] [CrossRef]
- Pezacki, J.P.; Blake, J.A.; Danielson, D.C.; Kennedy, D.C.; Lyn, R.K.; Singaravelu, R. Chemical Contrast for Imaging Living Systems: Molecular Vibrations Drive CARS Microscopy. Nat. Chem. Biol. 2011, 7, 137–145. [Google Scholar] [CrossRef] [PubMed]
- Evans, C.L.; Potma, E.O.; Puoris’haag, M.; Côté, D.; Lin, C.P.; Xie, X.S. Chemical Imaging of Tissue In Vivo with Video-Rate Coherent Anti-Stokes Raman Scattering Microscopy. Proc. Natl. Acad. Sci. USA 2005, 102, 16807–16812. [Google Scholar] [CrossRef] [PubMed] [Green Version]
- Nie, S.; Emory, S.R. Probing Single Molecules and Single Nanoparticles by Surface-Enhanced Raman Scattering. Science 1997, 275, 1102–1106. [Google Scholar] [CrossRef]
- Le Ru, E.C.; Blackie, E.; Meyer, M.; Etchegoin, P.G. Surface Enhanced Raman Scattering Enhancement Factors: A Comprehensive Study. J. Phys. Chem. C 2007, 111, 13794–13803. [Google Scholar] [CrossRef]
- Kneipp, J. Interrogating Cells, Tissues, and Live Animals with New Generations of Surface-Enhanced Raman Scattering Probes and Labels. ACS Nano 2017, 11, 1136–1141. [Google Scholar] [CrossRef]
- Vitol, E.A.; Orynbayeva, Z.; Friedman, G.; Gogotsi, Y. Nanoprobes for Intracellular and Single Cell Surface-Enhanced Raman Spectroscopy (SERS). J. Raman Spectrosc. 2012, 43, 817–827. [Google Scholar] [CrossRef]
- Lenzi, E.; De Aberasturi, D.J.; Henriksen-Lacey, M.; Piñeiro, P.; Muniz, A.J.; Lahann, J.; Liz-Marzán, L.M. SERS and Fluorescence-Active Multimodal Tessellated Scaffolds for Three-Dimensional Bioimaging. ACS Appl. Mater. Interfaces 2022, 14, 20708–20719. [Google Scholar] [CrossRef]
- Lenzi, E.; Henriksen-Lacey, M.; Molina, B.; Langer, J.; De Albuquerque, C.D.L.; De Aberasturi, D.J.; Liz-Marzán, L.M. Combination of Live Cell Surface-Enhanced Raman Scattering Imaging with Chemometrics to Study Intracellular Nanoparticle Dynamics. ACS Sensors 2022, 7, 1747–1756. [Google Scholar] [CrossRef]
- Ishitsuka, K.; Koide, M.; Yoshida, M.; Segawa, H.; Leproux, P.; Couderc, V.; Watanabe, M.M.; Kano, H. Identification of Intracellular Squalene in Living Algae, Aurantiochytrium Mangrovei with Hyper-Spectral Coherent Anti-Stokes Raman Microscopy Using a Sub-Nanosecond Supercontinuum Laser Source. J. Raman Spectrosc. 2017, 48, 8–15. [Google Scholar] [CrossRef] [Green Version]
- Liao, C.S.; Wang, P.; Wang, P.; Li, J.; Lee, H.J.; Eakins, G.; Cheng, J.X. Spectrometer-Free Vibrational Imaging by Retrieving Stimulated Raman Signal from Highly Scattered Photons. Sci. Adv. 2015, 1. [Google Scholar] [CrossRef] [Green Version]
- Chen, A.J.; Li, J.; Jannasch, A.; Mutlu, A.S.; Wang, M.C.; Cheng, J.X. Fingerprint Stimulated Raman Scattering Imaging Reveals Retinoid Coupling Lipid Metabolism and Survival. Chemphyschem 2018, 19, 2500–2506. [Google Scholar] [CrossRef]
- Hashimoto, A.; Yamaguchi, Y.; Chiu, L.D.; Morimoto, C.; Fujita, K.; Takedachi, M.; Kawata, S.; Murakami, S.; Tamiya, E. Time-Lapse Raman Imaging of Osteoblast Differentiation. Sci. Rep. 2015, 5, 12529. [Google Scholar] [CrossRef] [Green Version]
- Hobro, A.J.; Pavillon, N.; Fujita, K.; Ozkan, M.; Coban, C.; Smith, N.I. Label-Free Raman Imaging of The Macrophage Response to the Malaria Pigment Hemozoin. Analyst 2015, 140, 2350–2359. [Google Scholar] [CrossRef]
- Fu, D.; Yang, W.; Xie, X.S. Label-Free Imaging of Neurotransmitter Acetylcholine at Neuromuscular Junctions with Stimulated Raman Scattering. J. Am. Chem. Soc. 2017, 139, 583–586. [Google Scholar] [CrossRef] [PubMed]
- Morimoto, T.; Chiu, L.D.; Kanda, H.; Kawagoe, H.; Ozawa, T.; Nakamura, M.; Nishida, K.; Fujita, K.; Fujikado, T. Using Redox-Sensitive Mitochondrial Cytochrome Raman Bands for Label-Free Detection of Mitochondrial Dysfunction. Analyst 2019, 144, 2531–2540. [Google Scholar] [CrossRef] [PubMed]
- Krafft, C.; Schmitt, M.; Schie, I.W.; Cialla-May, D.; Matthäus, C.; Bocklitz, T.; Popp, J. Label-Free Molecular Imaging of Biological Cells and Tissues by Linear and Nonlinear Raman Spectroscopic Approaches. Angew. Chem. Int. Ed. Engl. 2017, 56, 4392–4430. [Google Scholar] [CrossRef] [PubMed]
- Dodo, K.; Fujita, K.; Sodeoka, M. Raman Spectroscopy for Chemical Biology Research. J. Am. Chem. Soc. 2022, 144, 19651–19667. [Google Scholar] [CrossRef]
- Zhao, Z.; Shen, Y.; Hu, F.; Min, W. Applications of Vibrational Tags in Biological Imaging by Raman Microscopy. Analyst 2017, 142, 4018–4029. [Google Scholar] [CrossRef] [PubMed]
- Bakthavatsalam, S.; Dodo, K.; Sodeoka, M. A Decade of Alkyne-Tag Raman Imaging (ATRI): Applications in Biological Systems. RSC Chem. Biol. 2021, 2, 1415–1429. [Google Scholar] [CrossRef] [PubMed]
- Weeks, T.; Schie, I.; Den Hartigh, L.J.; Rutledge, J.C.; Huser, T. Lipid-Cell Interactions in Human Monocytes Investigated by Doubly-Resonant Coherent Anti-Stokes Raman Scattering Microscopy. J. Biomed. Opt. 2011, 16, 021117. [Google Scholar] [CrossRef] [PubMed] [Green Version]
- Shen, Y.; Xu, F.; Wei, L.; Hu, F.; Min, W. Live-Cell Quantitative Imaging of Proteome Degradation by Stimulated Raman Scattering. Angew. Chem. Int. Ed. Engl. 2014, 53, 5596–5599. [Google Scholar] [CrossRef] [PubMed] [Green Version]
- Matthäus, C.; Krafft, C.; Dietzek, B.; Brehm, B.R.; Lorkowski, S.; Popp, J. Noninvasive Imaging of Intracellular Lipid Metabolism in Macrophages by Raman Microscopy in Combination with Stable Isotopic Labeling. Anal. Chem. 2012, 84, 8549–8556. [Google Scholar] [CrossRef]
- Fu, D.; Yu, Y.; Folick, A.; Currie, E.; Farese, R.V.; Tsai, T.H.; Xie, X.S.; Wang, M.C. In Vivo Metabolic Fingerprinting of Neutral Lipids with Hyperspectral Stimulated Raman Scattering Microscopy. J. Am. Chem. Soc. 2014, 136, 8820–8828. [Google Scholar] [CrossRef] [Green Version]
- Van Manen, H.J.; Kraan, Y.M.; Roos, D.; Otto, C. Single-Cell Raman and Fluorescence Microscopy Reveal the Association of Lipid Bodies with Phagosomes in Leukocytes. Proc. Natl. Acad. Sci. USA 2005, 102, 10159–10164. [Google Scholar] [CrossRef] [Green Version]
- Potma, E.O.; Xie, X.S. Direct Visualization of Lipid Phase Segregation in Single Lipid Bilayers with Coherent Anti-Stokes Raman Scattering Microscopy. Chemphyschem 2005, 6, 77–79. [Google Scholar] [CrossRef]
- Gaber, B.P.; Yager, P.; Peticolas, W.L. Deuterated Phospholipids as Nonperturbing Components for Raman Studies of Biomembranes. Biophys. J. 1978, 22, 191–207. [Google Scholar] [CrossRef] [Green Version]
- Alfonso-García, A.; Pfisterer, S.G.; Riezman, H.; Ikonen, E.; Potma, E.O. D38-Cholesterol as a Raman Active Probe for Imaging Intracellular Cholesterol Storage. J. Biomed. Opt. 2016, 21, 061003. [Google Scholar] [CrossRef]
- Shen, Y.; Zhao, Z.; Zhang, L.; Shi, L.; Shahriar, S.; Chan, R.B.; Paolo, G.D.; Min, W. Metabolic Activity Induces Membrane Phase Separation in Endoplasmic Reticulum. Proc. Natl. Acad. Sci. USA 2017, 114, 13394–13399. [Google Scholar] [CrossRef] [PubMed] [Green Version]
- Dodo, K.; Sato, A.; Tamura, Y.; Egoshi, S.; Fujiwara, K.; Oonuma, K.; Nakao, S.; Terayama, N.; Sodeoka, M. Synthesis of Deuterated Γ-Linolenic Acid and Application for Biological Studies: Metabolic Tuning and Raman Imaging. Chem. Commun. 2021, 57, 2180–2183. [Google Scholar] [CrossRef] [PubMed]
- Wei, L.; Shen, Y.; Xu, F.; Hu, F.; Harrington, J.K.; Targoff, K.L.; Min, W. Imaging Complex Protein Metabolism in Live Organisms by Stimulated Raman Scattering Microscopy with Isotope Labeling. ACS Chem. Biol. 2015, 10, 901–908. [Google Scholar] [CrossRef] [PubMed] [Green Version]
- Wei, L.; Yu, Y.; Shen, Y.; Wang, M.C.; Min, W. Vibrational Imaging of Newly Synthesized Proteins in Live Cells by Stimulated Raman Scattering Microscopy. Proc. Natl. Acad. Sci. USA 2013, 110, 11226–11231. [Google Scholar] [CrossRef] [PubMed] [Green Version]
- Van Manen, H.J.; Lenferink, A.; Otto, C. Noninvasive Imaging of Protein Metabolic Labeling in Single Human Cells Using Stable Isotopes and Raman Microscopy. Anal. Chem. 2008, 80, 9576–9582. [Google Scholar] [CrossRef]
- Du, J.; Su, Y.; Qian, C.; Yuan, D.; Miao, K.; Lee, D.; Ng, A.H.C.; Wijker, R.S.; Ribas, A.; Levine, R.D.; et al. Raman-Guided Subcellular Pharmaco-Metabolomics for Metastatic Melanoma Cells. Nat. Commun. 2020, 11, 4830. [Google Scholar] [CrossRef]
- Hu, F.; Wei, L.; Zheng, C.; Shen, Y.; Min, W. Live-Cell Vibrational Imaging of Choline Metabolites by Stimulated Raman Scattering Coupled with Isotope-Based Metabolic Labeling. Analyst 2014, 139, 2312–2317. [Google Scholar] [CrossRef] [Green Version]
- Yamakoshi, H.; Dodo, K.; Palonpon, A.; Ando, J.; Fujita, K.; Kawata, S.; Sodeoka, M. Alkyne-Tag Raman Imaging for Visualization of Mobile Small Molecules in Live Cells. J. Am. Chem. Soc. 2012, 134, 20681–20689. [Google Scholar] [CrossRef]
- Yamakoshi, H.; Palonpon, A.F.; Dodo, K.; Ando, J.; Kawat, S.S.; Fujita, K.; Sodeoka, M. Simultaneous Imaging of Protonated and Deprotonated Carbonylcyanide P-Trifluoromethoxyphenylhydrazone in Live Cells by Raman Microscopy. Chem. Commun. 2014, 50, 1341–1343. [Google Scholar] [CrossRef]
- Chong, H.; Xue, J.; Xiong, S.; Cong, Z.; Ding, X.; Zhu, Y.; Liu, Z.; Chen, T.; Feng, Y.; He, L.; et al. A Lipopeptide HIV-1/2 Fusion Inhibitor with Highly Potent In Vitro, Ex Vivo, and In Vivo Antiviral Activity. J. Virol. 2017, 91, e00288-17. [Google Scholar] [CrossRef]
- Fujioka, H.; Shou, J.; Kojima, R.; Urano, Y.; Ozeki, Y.; Kamiya, M. Multicolor Activatable Raman Probes for Simultaneous Detection of Plural Enzyme Activities. J. Am. Chem. Soc. 2020, 142, 20701–20707. [Google Scholar] [CrossRef] [PubMed]
- Wei, L.; Chen, Z.; Shi, L.; Long, R.; Anzalone, A.V.; Zhang, L.; Hu, F.; Yuste, R.; Cornish, V.W.; Min, W. Super-Multiplex Vibrational Imaging. Nature 2017, 544, 465–470. [Google Scholar] [CrossRef] [PubMed]
- Lee, D.; Qian, C.; Wang, H.; Li, L.; Miao, K.; Du, J.; Shcherbakova, D.M.; Verkhusha, V.V.; Wang, L.V.; Wei, L. Toward Photoswitchable Electronic Pre-Resonance Stimulated Raman Probes. J. Chem. Phys. 2021, 154, 135102. [Google Scholar] [CrossRef] [PubMed]
- Shou, J.; Ozeki, Y. Photoswitchable Stimulated Raman Scattering Spectroscopy and Microscopy. Opt. Lett. 2021, 46, 2176. [Google Scholar] [CrossRef] [PubMed]
- Shi, L.; Klimas, A.; Gallagher, B.; Cheng, Z.; Fu, F.; Wijesekara, P.; Miao, Y.; Ren, X.; Zhao, Y.; Min, W. Super-Resolution Vibrational Imaging Using Expansion Stimulated Raman Scattering Microscopy. Adv. Sci. 2022, 9, E2200315. [Google Scholar] [CrossRef]
- Gong, L.; Zheng, W.; Ma, Y.; Huang, Z. Higher-Order Coherent Anti-Stokes Raman Scattering Microscopy Realizes Label-Free Super-Resolution Vibrational Imaging. Nat. Photonics 2020, 14, 115–122. [Google Scholar] [CrossRef]
- Xiong, H.; Qian, N.; Miao, Y.; Zhao, Z.; Chen, C.; Min, W. Super-Resolution Vibrational Microscopy by Stimulated Raman Excited Fluorescence. Light Sci. Appl. 2021, 10, 87. [Google Scholar] [CrossRef]
- De Albuquerque, C.D.L.; Schultz, Z.D. Super-Resolution Surface-Enhanced Raman Scattering Imaging of Single Particles in Cells. Anal. Chem. 2020, 92, 9389–9398. [Google Scholar] [CrossRef]
- Lv, X.; Gong, L.; Lin, S.; Jin, P.; Huang, Z. Super-Resolution Stimulated Raman Scattering Microscopy with the Phase-Shifted Spatial Frequency Modulation. Opt. Lett. 2022, 47, 4552–4555. [Google Scholar] [CrossRef]
- Lee, H.; Yoo, H.; Moon, G.; Toh, K.-A.; Mochizuki, K.; Fujita, K.; Kim, D. Super-Resolved Raman Microscopy Using Random Structured Light Illumination: Concept and Feasibility. J. Chem. Phys. 2021, 155, 144202. [Google Scholar] [CrossRef]
- Wei, L.; Hu, F.; Shen, Y.; Chen, Z.; Yu, Y.; Lin, C.C.; Wang, M.C.; Min, W. Live-Cell Imaging of Alkyne-Tagged Small Biomolecules by Stimulated Raman Scattering. Nat. Method. 2014, 11, 410. [Google Scholar] [CrossRef] [PubMed] [Green Version]
- Hong, S.; Chen, T.; Zhu, Y.; Li, A.; Huang, Y.; Chen, X. Live-Cell Stimulated Raman Scattering Imaging of Alkyne-Tagged Biomolecules. Angew. Chemie Int. Ed. 2014, 53, 5827–5831. [Google Scholar] [CrossRef] [PubMed]
- Cui, J.; Matsuoka, S.; Kinoshita, M.; Matsumori, N.; Sato, F.; Murata, M.; Ando, J.; Yamakoshi, H.; Dodo, K.; Sodeoka, M. Novel Raman-Tagged Sphingomyelin that Closely Mimics Original Raft-Forming Behavior. Bioorg. Med. Chem. 2015, 23, 2989–2994. [Google Scholar] [CrossRef] [PubMed] [Green Version]
- Ando, J.; Kinoshita, M.; Cui, J.; Yamakoshi, H.; Dodo, K.; Fujita, K.; Murata, M.; Sodeoka, M. Sphingomyelin Distribution in Lipid Rafts of Artificial Monolayer Membranes Visualized by Raman Microscopy. Proc. Natl. Acad. Sci. USA 2015, 112, 4558–4563. [Google Scholar] [CrossRef] [Green Version]
- Lee, H.J.; Zhang, W.; Zhang, D.; Yang, Y.; Liu, B.; Barker, E.L.; Buhman, K.K.; Slipchenko, L.V.; Dai, M.; Cheng, J.X. Assessing Cholesterol Storage in Live Cells and C. Elegans by Stimulated Raman Scattering Imaging of Phenyl-Diyne Cholesterol. Sci. Rep. 2015, 5, 7930. [Google Scholar] [CrossRef] [Green Version]
- Yamaguchi, S.; Matsushita, T.; Izuta, S.; Katada, S.; Ura, M.; Ikeda, T.; Hayashi, G.; Suzuki, Y.; Kobayashi, K.; Tokunaga, K.; et al. Chemically-Activatable Alkyne-Tagged Probe for Imaging Microdomains in Lipid Bilayer Membranes. Sci. Rep. 2017, 7, 41007. [Google Scholar] [CrossRef] [Green Version]
- Hu, F.; Chen, Z.; Zhang, L.; Shen, Y.; Wei, L.; Min, W. Vibrational Imaging of Glucose Uptake Activity in Live Cells and Tissues by Stimulated Raman Scattering. Angew. Chem. Int. Ed. Engl. 2015, 54, 9821–9825. [Google Scholar] [CrossRef] [Green Version]
- De Moliner, F.; Knox, K.; Gordon, D.; Lee, M.; Tipping, W.J.; Geddis, A.; Reinders, A.; Ward, J.M.; Oparka, K.; Vendrell, M. A Palette of Minimally Tagged Sucrose Analogues for Real-Time Raman Imaging of Intracellular Plant Metabolism. Angew. Chem. Int. Ed. Engl. 2021, 60, 7637–7642. [Google Scholar] [CrossRef]
- Hu, F.; Lamprecht, M.R.; Wei, L.; Morrison, B.; Min, W. Bioorthogonal Chemical Imaging of Metabolic Activities in Live Mammalian Hippocampal Tissues with Stimulated Raman Scattering. Sci. Rep. 2016, 6, 39660. [Google Scholar] [CrossRef] [Green Version]
- Chen, Z.; Paley, D.W.; Wei, L.; Weisman, A.L.; Friesner, R.A.; Nuckolls, C.; Min, W. Multicolor Live-Cell Chemical Imaging by Isotopically Edited Alkyne Vibrational Palette. J. Am. Chem. Soc. 2014, 136, 8027–8033. [Google Scholar] [CrossRef]
- Woodhouse, N.; Majer, J.; Marshall, P.; Hood, S.; Notingher, I. Quantification of Drugs in Brain and Liver Mimetic Tissue Models Using Raman Spectroscopy. Appl. Spectrosc. 2022, 11394. [Google Scholar] [CrossRef] [PubMed]
- Vanden-Hehir, S.; Cairns, S.A.; Lee, M.; Zoupi, L.; Shaver, M.P.; Brunton, V.G.; Williams, A.; Hulme, A.N. Alkyne-Tagged PLGA Allows Direct Visualization of Nanoparticles In Vitro and Ex Vivo by Stimulated Raman Scattering Microscopy. Biomacromolecules 2019, 20, 4008–4014. [Google Scholar] [CrossRef] [PubMed] [Green Version]
- Tanuma, M.; Kasai, A.; Bando, K.; Kotoku, N.; Harada, K.; Minoshima, M.; Higashino, K.; Kimishima, A.; Arai, M.; Ago, Y.; et al. Direct Visualization of an Antidepressant Analog Using Surface-Enhanced Raman Scattering in the Brain. JCI Insight 2020, 5. [Google Scholar] [CrossRef] [PubMed] [Green Version]
- Chesnut, R.M.; Marshall, L.F.; Klauber, M.R.; Blunt, B.A.; Baldwin, N.; Eisenberg, H.M.; Jane, J.A.; Marmarou, A.; Foulkes, M.A. The Role of Secondary Brain Injury in Determining Outcome from Severe Head Injury. J. Trauma 1993, 34, 216–222. [Google Scholar] [CrossRef]
- Semple, B.D.; Bye, N.; Rancan, M.; Ziebell, J.M.; Morganti-Kossmann, M.C. Role of CCL2 (MCP-1) in Traumatic Brain Injury (TBI): Evidence from Severe TBI Patients and CCL2-/- Mice. J. Cereb. Blood Flow Metab. 2010, 30, 769–782. [Google Scholar] [CrossRef]
- Cheng, G.; Kong, R.H.; Zhang, L.M.; Zhang, J.N. Mitochondria in Traumatic Brain Injury and Mitochondrial-Targeted Multipotential Therapeutic Strategies. Br. J. Pharmacol. 2012, 167, 699–719. [Google Scholar] [CrossRef] [Green Version]
- Deng, Y.; Thompson, B.M.; Gao, X.; Hall, E.D. Temporal Relationship of Peroxynitrite-Induced Oxidative Damage, Calpain-Mediated Cytoskeletal Degradation and Neurodegeneration after Traumatic Brain Injury. Exp. Neurol. 2007, 205, 154–165. [Google Scholar] [CrossRef] [Green Version]
- Belli, A.; Sen, J.; Petzold, A.; Russo, S.; Kitchen, N.; Smith, M. Metabolic Failure Precedes Intracranial Pressure Rises in Traumatic Brain Injury: A Microdialysis Study. Acta Neurochir. 2008, 150, 461–469. [Google Scholar] [CrossRef]
- Ercole, A.; Magnoni, S.; Vegliante, G.; Pastorelli, R.; Surmacki, J.; Bohndiek, S.E.; Zanier, E.R. Current and Emerging Technologies for Probing Molecular Signatures of Traumatic Brain Injury. Front. Neurol. 2017, 8. [Google Scholar] [CrossRef] [Green Version]
- Tay, L.L.; Tremblay, R.G.; Hulse, J.; Zurakowski, B.; Thompson, M.; Bani-Yaghoub, M. Detection of Acute Brain Injury by Raman Spectral Signature. Analyst 2011, 136, 1620–1626. [Google Scholar] [CrossRef]
- Surmacki, J.M.; Ansel-Bollepalli, L.; Pischiutta, F.; Zanier, E.R.; Ercole, A.; Bohndiek, S.E. Label-Free Monitoring of Tissue Biochemistry Following Traumatic Brain Injury Using Raman Spectroscopy. Analyst 2016, 142, 132–139. [Google Scholar] [CrossRef] [PubMed]
- Kawon, K.; Setkowicz, Z.; Drozdz, A.; Janeczko, K.; Chwiej, J. The Methods of Vibrational Microspectroscopy Reveals Long-Term Biochemical Anomalies within the Region of Mechanical Injury within the Rat Brain. Spectrochim. Acta A Mol. Biomol. Spectrosc. 2021, 263. [Google Scholar] [CrossRef] [PubMed]
- Banbury, C.; Styles, I.; Eisenstein, N.; Zanier, E.R.; Vegliante, G.; Belli, A.; Logan, A.; Oppenheimer, P.G. Spectroscopic Detection of Traumatic Brain Injury Severity and Biochemistry from the Retina. Biomed. Opt. Express 2020, 11, 6249. [Google Scholar] [CrossRef] [PubMed]
- Mowbray, M.; Banbury, C.; Rickard, J.J.S.; Davies, D.J.; Oppenheimer, P.G. Development and Characterization of a Probe Device toward Intracranial Spectroscopy of Traumatic Brain Injury. ACS Biomater. Sci. Eng. 2021, 7, 1252–1262. [Google Scholar] [CrossRef]
- Gao, X.; Boryczka, J.; Zheng, P.; Kasani, S.; Yang, F.; Engler-Chiurazzi, E.B.; Simpkins, J.W.; Wigginton, J.G.; Wu, N. A “Hot Spot”-Enhanced Paper Lateral Flow Assay for Ultrasensitive Detection of Traumatic Brain Injury Biomarker S-100β in Blood Plasma. Biosens. Bioelectron. 2021, 177, 112967. [Google Scholar] [CrossRef] [PubMed]
- Rickard, J.J.S.; Di-Pietro, V.; Smith, D.J.; Davies, D.J.; Belli, A.; Oppenheimer, P.G. Rapid Optofluidic Detection of Biomarkers for Traumatic Brain Injury via Surface-Enhanced Raman Spectroscopy. Nat. Biomed. Eng. 2020, 4, 610–623. [Google Scholar] [CrossRef]
- Qureshi, A.I.; Qureshi, M.H.; Lien, L.M.; Lee, J.T.; Jeng, J.S.; Hu, C.J.; Lai, T.C.; Liu, C.H.; Chen, C.H.; Chen, P.L.; et al. One-Year Risk of Recurrent Stroke and Death Associated with Vertebrobasilar Artery Stenosis and Occlusion in A Cohort of 10,515 Patients. Cerebrovasc. Dis. 2019, 47, 40–47. [Google Scholar] [CrossRef]
- Vernino, S.; Brown, R.D.; Sejvar, J.J.; Sicks, J.R.D.; Petty, G.W.; O’Fallon, M.W. Cause-Specific Mortality after First Cerebral Infarction. Stroke 2003, 34, 1828–1832. [Google Scholar] [CrossRef] [Green Version]
- Vilela, P.; Rowley, H.A. Brain Ischemia: CT and MRI Techniques in Acute Ischemic Stroke. Eur. J. Radiol. 2017, 96, 162–172. [Google Scholar] [CrossRef]
- Saver, J.L. Time Is Brain—Quantified. Stroke 2006, 37, 263–266. [Google Scholar] [CrossRef]
- Vymazal, J.; Rulseh, A.M.; Keller, J.; Janouskova, L. Comparison of CT and MR Imaging in Ischemic Stroke. Insights Imaging 2012, 3, 619. [Google Scholar] [CrossRef] [PubMed] [Green Version]
- Russo, V.; Candeloro, P.; Malara, N.; Perozziello, G.; Iannone, M.; Scicchitano, M.; Mollace, R.; Musolino, V.; Gliozzi, M.; Carresi, C.; et al. Key Role of Cytochrome C for Apoptosis Detection Using Raman Microimaging in an Animal Model of Brain Ischemia with Insulin Treatment. Appl. Spectrosc. 2019, 73, 1208–1217. [Google Scholar] [CrossRef] [PubMed] [Green Version]
- Jung, G.B.; Kang, S.W.; Lee, G.J.; Kim, D. Biochemical Characterization of the Brain Hippocampal Areas after Cerebral Ischemia-Reperfusion Using Raman Spectroscopy. Appl. Spectrosc. 2018, 72, 1479–1486. [Google Scholar] [CrossRef] [PubMed]
- Fan, Y.; Chen, C.; Xie, X.; Yang, B.; Wu, W.; Yue, F.; Lv, X.; Chen, C. Rapid Noninvasive Screening of Cerebral Ischemia and Cerebral Infarction Based on Tear Raman Spectroscopy Combined with Multiple Machine Learning Algorithms. Lasers Med. Sci. 2022, 37, 417–424. [Google Scholar] [CrossRef] [PubMed]
- Crimmins, E.M. Lifespan and Healthspan: Past, Present, and Promise. Gerontologist 2015, 55, 901–911. [Google Scholar] [CrossRef] [Green Version]
- Von Campenhausen, S.; Bornschein, B.; Wick, R.; Bötzel, K.; Sampaio, C.; Poewe, W.; Oertel, W.; Siebert, U.; Berger, K.; Dodel, R. Prevalence and Incidence of Parkinson’s Disease in Europe. Eur. Neuropsychopharmacol. 2005, 15, 473–490. [Google Scholar] [CrossRef]
- Hebert, L.E.; Weuve, J.; Scherr, P.A.; Evans, D.A. Alzheimer Disease in the United States (2010–2050) Estimated Using the 2010 Census. Neurology 2013, 80, 1778–1783. [Google Scholar] [CrossRef] [Green Version]
- Niu, H.; Álvarez-Álvarez, I.; Guillén-Grima, F.; Aguinaga-Ontoso, I. Prevalence and Incidence of Alzheimer’s Disease in Europe: A Meta-Analysis. Neurologia 2017, 32, 523–532. [Google Scholar] [CrossRef]
- Devitt, G.; Howard, K.; Mudher, A.; Mahajan, S. Raman Spectroscopy: An Emerging Tool in Neurodegenerative Disease Research and Diagnosis. ACS Chem. Neurosci. 2018, 9, 404–420. [Google Scholar] [CrossRef]
- Kurouski, D.; Van Duyne, R.P.; Lednev, I.K. Exploring the Structure and Formation Mechanism of Amyloid Fibrils by Raman Spectroscopy: A Review. Analyst 2015, 140, 4967–4980. [Google Scholar] [CrossRef]
- Li, H.; Lantz, R.; Du, D. Vibrational Approach to the Dynamics and Structure of Protein Amyloids. Molecules 2019, 24, 186. [Google Scholar] [CrossRef] [PubMed] [Green Version]
- Wilkosz, N.; Czaja, M.; Seweryn, S.; Skirlinska-Nosek, K.; Szymonski, M.; Lipiec, E.; Sofinska, K. Molecular Spectroscopic Markers of Abnormal Protein Aggregation. Molecules 2020, 25, 2498. [Google Scholar] [CrossRef] [PubMed]
- Polykretis, P.; Banchelli, M.; D’Andrea, C.; De Angelis, M.; Matteini, P. Raman Spectroscopy Techniques for The Investigation and Diagnosis of Alzheimer’s Disease. Front. Biosci. Schol. Ed. 2022, 14, 22. [Google Scholar] [CrossRef] [PubMed]
- León-Bejarano, F.; Méndez, M.O.; Alba, A.; Rodríguez-Leyva, I.; González, F.J.; Rodríguez-Aranda, M.D.C.; Guevara, E.; Guirado-López, R.A.; Ramírez-Elías, M.G. Raman Spectroscopy Study of Skin Biopsies from Patients with Parkinson’s Disease: Trends in Alpha-Synuclein Aggregation from the Amide I Region. Appl. Spectrosc. 2022, 76, 1317–1328. [Google Scholar] [CrossRef]
- Sevgi, F.; Brauchle, E.M.; Carvajal Berrio, D.A.; Schenke-Layland, K.; Casadei, N.; Salker, M.S.; Riess, O.; Singh, Y. Imaging of A-Synuclein Aggregates in a Rat Model of Parkinson’s Disease Using Raman Microspectroscopy. Front. Cell Dev. Biol. 2021, 9. [Google Scholar] [CrossRef]
- Schipper, H.M.; Kwok, C.S.; Rosendahl, S.M.; Bandilla, D.; Maes, O.; Melmed, C.; Rabinovitch, D.; Burns, D.H. Spectroscopy of Human Plasma for Diagnosis of Idiopathic Parkinson’s Disease. Biomark. Med. 2008, 2, 229–238. [Google Scholar] [CrossRef]
- Chen, P.; Tian, Q.; Baek, S.J.; Shang, X.L.; Park, A.; Liu, Z.C.; Yao, X.Q.; Wang, J.Z.; Wang, X.H.; Cheng, Y.; et al. Laser Raman Detection of Platelet as a Non-Invasive Approach for Early And Differential Diagnosis of Alzheimer’s Disease. Laser Phys. Lett. 2011, 8, 547–552. [Google Scholar] [CrossRef]
- Park, A.; Baek, S.J.; Shen, A.; Hu, J. Detection of Alzheimer’s Disease by Raman Spectra of Rat’s Platelet with a Simple Feature Selection. Chemom. Intell. Lab. Syst. 2013, 121, 52–56. [Google Scholar] [CrossRef]
- Carmona, P.; Molina, M.; López-Tobar, E.; Toledano, A. Vibrational Spectroscopic Analysis of Peripheral Blood Plasma of Patients with Alzheimer’s Disease. Anal. Bioanal. Chem. 2015, 407, 7747–7756. [Google Scholar] [CrossRef] [Green Version]
- Carmona, P.; Molina, M.; Calero, M.; Bermejo-Pareja, F.; Martínez-Martín, P.; Toledano, A. Discrimination Analysis of Blood Plasma Associated with Alzheimer’s Disease Using Vibrational Spectroscopy. J. Alzheimers Dis. 2013, 34, 911–920. [Google Scholar] [CrossRef]
- Zhang, L.; Cao, K.; Su, Y.; Hu, S.; Liang, X.; Luo, Q.; Luo, H. Colorimetric and Surface-Enhanced Raman Scattering Dual-Mode Magnetic Immunosensor for Ultrasensitive Detection of Blood Phosphorylated Tau in Alzheimer’s Disease. Biosens. Bioelectron. 2022, 222, 114935. [Google Scholar] [CrossRef] [PubMed]
- Carlomagno, C.; Banfi, P.I.; Gualerzi, A.; Picciolini, S.; Volpato, E.; Meloni, M.; Lax, A.; Colombo, E.; Ticozzi, N.; Verde, F.; et al. Human Salivary Raman Fingerprint as Biomarker for the Diagnosis of Amyotrophic Lateral Sclerosis. Sci. Rep. 2020, 10, 10175. [Google Scholar] [CrossRef] [PubMed]
- Carlomagno, C.; Bertazioli, D.; Gualerzi, A.; Picciolini, S.; Andrico, M.; Rodà, F.; Meloni, M.; Banfi, P.I.; Verde, F.; Ticozzi, N.; et al. Identification of the Raman Salivary Fingerprint of Parkinson’s Disease through the Spectroscopic𠅌omputational Combinatory Approach. Front. Neurosci. 2021, 15, 1309. [Google Scholar] [CrossRef] [PubMed]
- Gualerzi, A.; Picciolini, S.; Carlomagno, C.; Terenzi, F.; Ramat, S.; Sorbi, S.; Bedoni, M. Raman Profiling of Circulating Extracellular Vesicles for the Stratification of Parkinson’s Patients. Nanomedicine 2019, 22, 102097. [Google Scholar] [CrossRef] [PubMed]
- Carlomagno, C.; Cabinio, M.; Picciolini, S.; Gualerzi, A.; Baglio, F.; Bedoni, M. SERS-Based Biosensor for Alzheimer Disease Evaluation through the Fast Analysis of Human Serum. J. Biophotonics 2020, 13, E201960033. [Google Scholar] [CrossRef] [PubMed]
- Farmanfarma, K.K.; Mohammadian, M.; Shahabinia, Z.; Hassanipour, S.; Salehiniya, H. Brain Cancer in the World: An Epidemiological Review. World Cancer Res. J. 2019, 6, E1356. [Google Scholar] [CrossRef]
- Williamson, M.R.; Klug, M.G.; Schwartz, G.G. Brain Cancer Incidence Rates and the Presence of Nuclear Reactors in US States: A Hypothesis-Generating Study. Environ. Geochem. Health 2021, 43, 3967–3975. [Google Scholar] [CrossRef]
- Aldape, K.; Brindle, K.M.; Chesler, L.; Chopra, R.; Gajjar, A.; Gilbert, M.R.; Gottardo, N.; Gutmann, D.H.; Hargrave, D.; Holland, E.C.; et al. Challenges to Curing Primary Brain Tumours. Nat. Rev. Clin. Oncol. 2019, 16, 509–520. [Google Scholar] [CrossRef] [PubMed] [Green Version]
- Louis, D.N.; Perry, A.; Reifenberger, G.; Von Deimling, A.; Figarella-Branger, D.; Cavenee, W.K.; Ohgaki, H.; Wiestler, O.D.; Kleihues, P.; Ellison, D.W. The 2016 World Health Organization Classification of Tumors of The Central Nervous System: A Summary. Acta Neuropathol. 2016, 131, 803–820. [Google Scholar] [CrossRef] [Green Version]
- Davis, M.E. Epidemiology and Overview of Gliomas. Semin. Oncol. Nurs. 2018, 34, 420–429. [Google Scholar] [CrossRef]
- Ostrom, Q.T.; Cioffi, G.; Gittleman, H.; Patil, N.; Waite, K.; Kruchko, C.; Barnholtz-Sloan, J.S. CBTRUS Statistical Report: Primary Brain and Other Central Nervous System Tumors Diagnosed in the United States in 2012–2016. Neuro. Oncol. 2019, 21, V1–V100. [Google Scholar] [CrossRef]
- Huntoon, K.; Toland, A.M.S.; Dahiya, S. Meningioma: A Review of Clinicopathological and Molecular Aspects. Front. Oncol. 2020, 10, 579599. [Google Scholar] [CrossRef] [PubMed]
- Lilo, T.; Morais, C.L.M.; Shenton, C.; Ray, A.; Gurusinghe, N. Revising Fourier-Transform Infrared (FT-IR) and Raman Spectroscopy towards Brain Cancer Detection. Photodiagnosis Photodyn. Ther. 2022, 38, 102785. [Google Scholar] [CrossRef] [PubMed]
- Tashibu, K. Analysis of Water Content in Rat Brain Using Raman Spectroscopy. No To Shinkei 1990, 42, 999–1004. [Google Scholar] [PubMed]
- Gajjar, K.; Heppenstall, L.D.; Pang, W.; Ashton, K.M.; Trevisan, J.; Patel, I.I.; Llabjani, V.; Stringfellow, H.F.; Martin-Hirsch, P.L.; Dawson, T.; et al. Diagnostic Segregation of Human Brain Tumours Using Fourier-Transform Infrared and/or Raman Spectroscopy Coupled with Discriminant Analysis. Anal. Method. 2013, 5, 89–102. [Google Scholar] [CrossRef]
- Iturrioz-Rodríguez, N.; De Pasquale, D.; Fiaschi, P.; Ciofani, G. Discrimination of Glioma Patient-Derived Cells from Healthy Astrocytes by Exploiting Raman Spectroscopy. Spectrochim. Acta A Mol. Biomol. Spectrosc. 2022, 269, 120773. [Google Scholar] [CrossRef]
- Stevens, A.R.; Stickland, C.A.; Harris, G.; Ahmed, Z.; Oppenheimer, P.G.; Belli, A.; Davies, D.J. Raman Spectroscopy as a Neuromonitoring Tool in Traumatic Brain Injury: A Systematic Review and Clinical Perspectives. Cells 2022, 11, 1227. [Google Scholar] [CrossRef]
- Aguiar, R.P.; Falcão, E.T.; Pasqualucci, C.A.; Silveira, L. Use of Raman Spectroscopy to Evaluate the Biochemical Composition of Normal and Tumoral Human Brain Tissues for Diagnosis. Lasers Med. Sci. 2022, 37, 121–133. [Google Scholar] [CrossRef]
- Kirsch, M.; Schackert, G.; Salzer, R.; Krafft, C. Raman Spectroscopic Imaging for In Vivo Detection of Cerebral Brain Metastases. Anal. Bioanal. Chem. 2010, 398, 1707–1713. [Google Scholar] [CrossRef]
- Krafft, C.; Belay, B.; Bergner, N.; Romeike, B.F.M.; Reichart, R.; Kalff, R.; Popp, J. Advances in Optical Biopsy—Correlation of Malignancy and Cell Density of Primary Brain Tumors Using Raman Microspectroscopic Imaging. Analyst 2012, 137, 5533. [Google Scholar] [CrossRef]
- Aguiar, R.P.; Silveira, L.; Falcão, E.T.; Pacheco, M.T.T.; Zângaro, R.A.; Pasqualucci, C.A. Discriminating Neoplastic and Normal Brain Tissues In Vitro through Raman Spectroscopy: A Principal Components Analysis Classification Model. Photomed. Laser Surg. 2013, 31, 595–604. [Google Scholar] [CrossRef] [PubMed]
- Abramczyk, H.; Imiela, A. The Biochemical, Nanomechanical and Chemometric Signatures of Brain Cancer. Spectrochim. Acta A Mol. Biomol. Spectrosc. 2018, 188, 8–19. [Google Scholar] [CrossRef] [PubMed]
- Depciuch, J.; Tołpa, B.; Witek, P.; Szmuc, K.; Kaznowska, E.; Osuchowski, M.; Król, P.; Cebulski, J. Raman and FTIR Spectroscopy in Determining the Chemical Changes in Healthy Brain Tissues and Glioblastoma Tumor Tissues. Spectrochim. Acta A Mol. Biomol. Spectrosc. 2020, 225, 117526. [Google Scholar] [CrossRef] [PubMed]
- Zhang, C.; Han, Y.; Sun, B.; Zhang, W.; Liu, S.; Liu, J.; Lv, H.; Zhang, G.; Kang, X. Label-Free Serum Detection Based on Raman Spectroscopy for The Diagnosis and Classification of Glioma. J. Raman Spectrosc. 2020, 51, 1977–1985. [Google Scholar] [CrossRef]
- Kopec, M.; Błaszczyk, M.; Radek, M.; Abramczyk, H. Raman Imaging and Statistical Methods for Analysis Various Type of Human Brain Tumors and Breast Cancers. Spectrochim. Acta A Mol. Biomol. Spectrosc. 2021, 262, 120091. [Google Scholar] [CrossRef] [PubMed]
- Riva, M.; Sciortino, T.; Secoli, R.; D’Amico, E.; Moccia, S.; Fernandes, B.; Nibali, M.C.; Gay, L.; Rossi, M.; De Momi, E.; et al. Glioma Biopsies Classification Using Raman Spectroscopy and Machine Learning Models on Fresh Tissue Samples. Cancers 2021, 13, 1073. [Google Scholar] [CrossRef] [PubMed]
- Nygren, C.; Von Holst, H.; Månsson, J.E.; Fredman, P. Increased Levels of Cholesterol Esters in Glioma Tissue and Surrounding Areas of Human Brain. Br. J. Neurosurg. 1997, 11, 216–220. [Google Scholar] [CrossRef] [PubMed]
- Lu, F.-K.; Calligaris, D.; Olubiyi, O.I.; Norton, I.; Yang, W.; Santagata, S.; Xie, X.S.; Golby, A.J.; Agar, N.Y.R. Label-Free Neurosurgical Pathology with Stimulated Raman Imaging. Cancer Res. 2016, 76, 3451–3462. [Google Scholar] [CrossRef] [PubMed] [Green Version]
- Kalkanis, S.N.; Kast, R.E.; Rosenblum, M.L.; Mikkelsen, T.; Yurgelevic, S.M.; Nelson, K.M.; Raghunathan, A.; Poisson, L.M.; Auner, G.W. Raman Spectroscopy to Distinguish Grey Matter, Necrosis, and Glioblastoma Multiforme in Frozen Tissue Sections. J. Neuro Oncol. 2014, 116, 477–485. [Google Scholar] [CrossRef] [PubMed]
- Jermyn, M.; Mok, K.; Mercier, J.; Desroches, J.; Pichette, J.; Saint-Arnaud, K.; Bernstein, L.; Guiot, M.-C.; Petrecca, K.; Leblond, F. Intraoperative Brain Cancer Detection with Raman Spectroscopy in Humans. Sci. Transl. Med. 2015, 7, 274ra19. [Google Scholar] [CrossRef] [PubMed]
- Pekmezci, M.; Morshed, R.A.; Chunduru, P.; Pandian, B.; Young, J.; Villanueva-Meyer, J.E.; Tihan, T.; Sloan, E.A.; Aghi, M.K.; Molinaro, A.M.; et al. Detection of Glioma Infiltration at the Tumor Margin Using Quantitative Stimulated Raman Scattering Histology. Sci. Rep. 2021, 11, 12162. [Google Scholar] [CrossRef] [PubMed]
- Orringer, D.A.; Pandian, B.; Niknafs, Y.S.; Hollon, T.C.; Boyle, J.; Lewis, S.; Garrard, M.; Hervey-Jumper, S.L.; Garton, H.J.L.; Maher, C.O.; et al. Rapid Intraoperative Histology of Unprocessed Surgical Specimens via Fibre-Laser-Based Stimulated Raman Scattering Microscopy. Nat. Biomed. Eng. 2017, 1, 0027. [Google Scholar] [CrossRef] [PubMed] [Green Version]
- Jabarkheel, R.; Ho, C.-S.; Rodrigues, A.J.; Jin, M.C.; Parker, J.J.; Mensah-Brown, K.; Yecies, D.; Grant, G.A. Rapid Intraoperative Diagnosis of Pediatric Brain Tumors Using Raman Spectroscopy: A Machine Learning Approach. Neuro Oncol. Adv. 2022, 4, Vdac118. [Google Scholar] [CrossRef] [PubMed]
Disclaimer/Publisher’s Note: The statements, opinions and data contained in all publications are solely those of the individual author(s) and contributor(s) and not of MDPI and/or the editor(s). MDPI and/or the editor(s) disclaim responsibility for any injury to people or property resulting from any ideas, methods, instructions or products referred to in the content. |
© 2023 by the authors. Licensee MDPI, Basel, Switzerland. This article is an open access article distributed under the terms and conditions of the Creative Commons Attribution (CC BY) license (https://creativecommons.org/licenses/by/4.0/).
Share and Cite
Terrones, O.; Olazar-Intxausti, J.; Anso, I.; Lorizate, M.; Nieto-Garai, J.A.; Contreras, F.-X. Raman Spectroscopy as a Tool to Study the Pathophysiology of Brain Diseases. Int. J. Mol. Sci. 2023, 24, 2384. https://doi.org/10.3390/ijms24032384
Terrones O, Olazar-Intxausti J, Anso I, Lorizate M, Nieto-Garai JA, Contreras F-X. Raman Spectroscopy as a Tool to Study the Pathophysiology of Brain Diseases. International Journal of Molecular Sciences. 2023; 24(3):2384. https://doi.org/10.3390/ijms24032384
Chicago/Turabian StyleTerrones, Oihana, June Olazar-Intxausti, Itxaso Anso, Maier Lorizate, Jon Ander Nieto-Garai, and Francesc-Xabier Contreras. 2023. "Raman Spectroscopy as a Tool to Study the Pathophysiology of Brain Diseases" International Journal of Molecular Sciences 24, no. 3: 2384. https://doi.org/10.3390/ijms24032384