2.1. Modeling of Membrane Currents
The ion currents through the plasma membrane play a central role in the modelling. In light of this, it will first be analyzed whether fundamental measurement results can be described with the reference model, and how well the associated parameters meet the experimentally obtained quantities. This appeared necessary, since very little information on the exact method of parameter determination or on the basis of the experiment is contained in the pertaining publications [
36,
37].
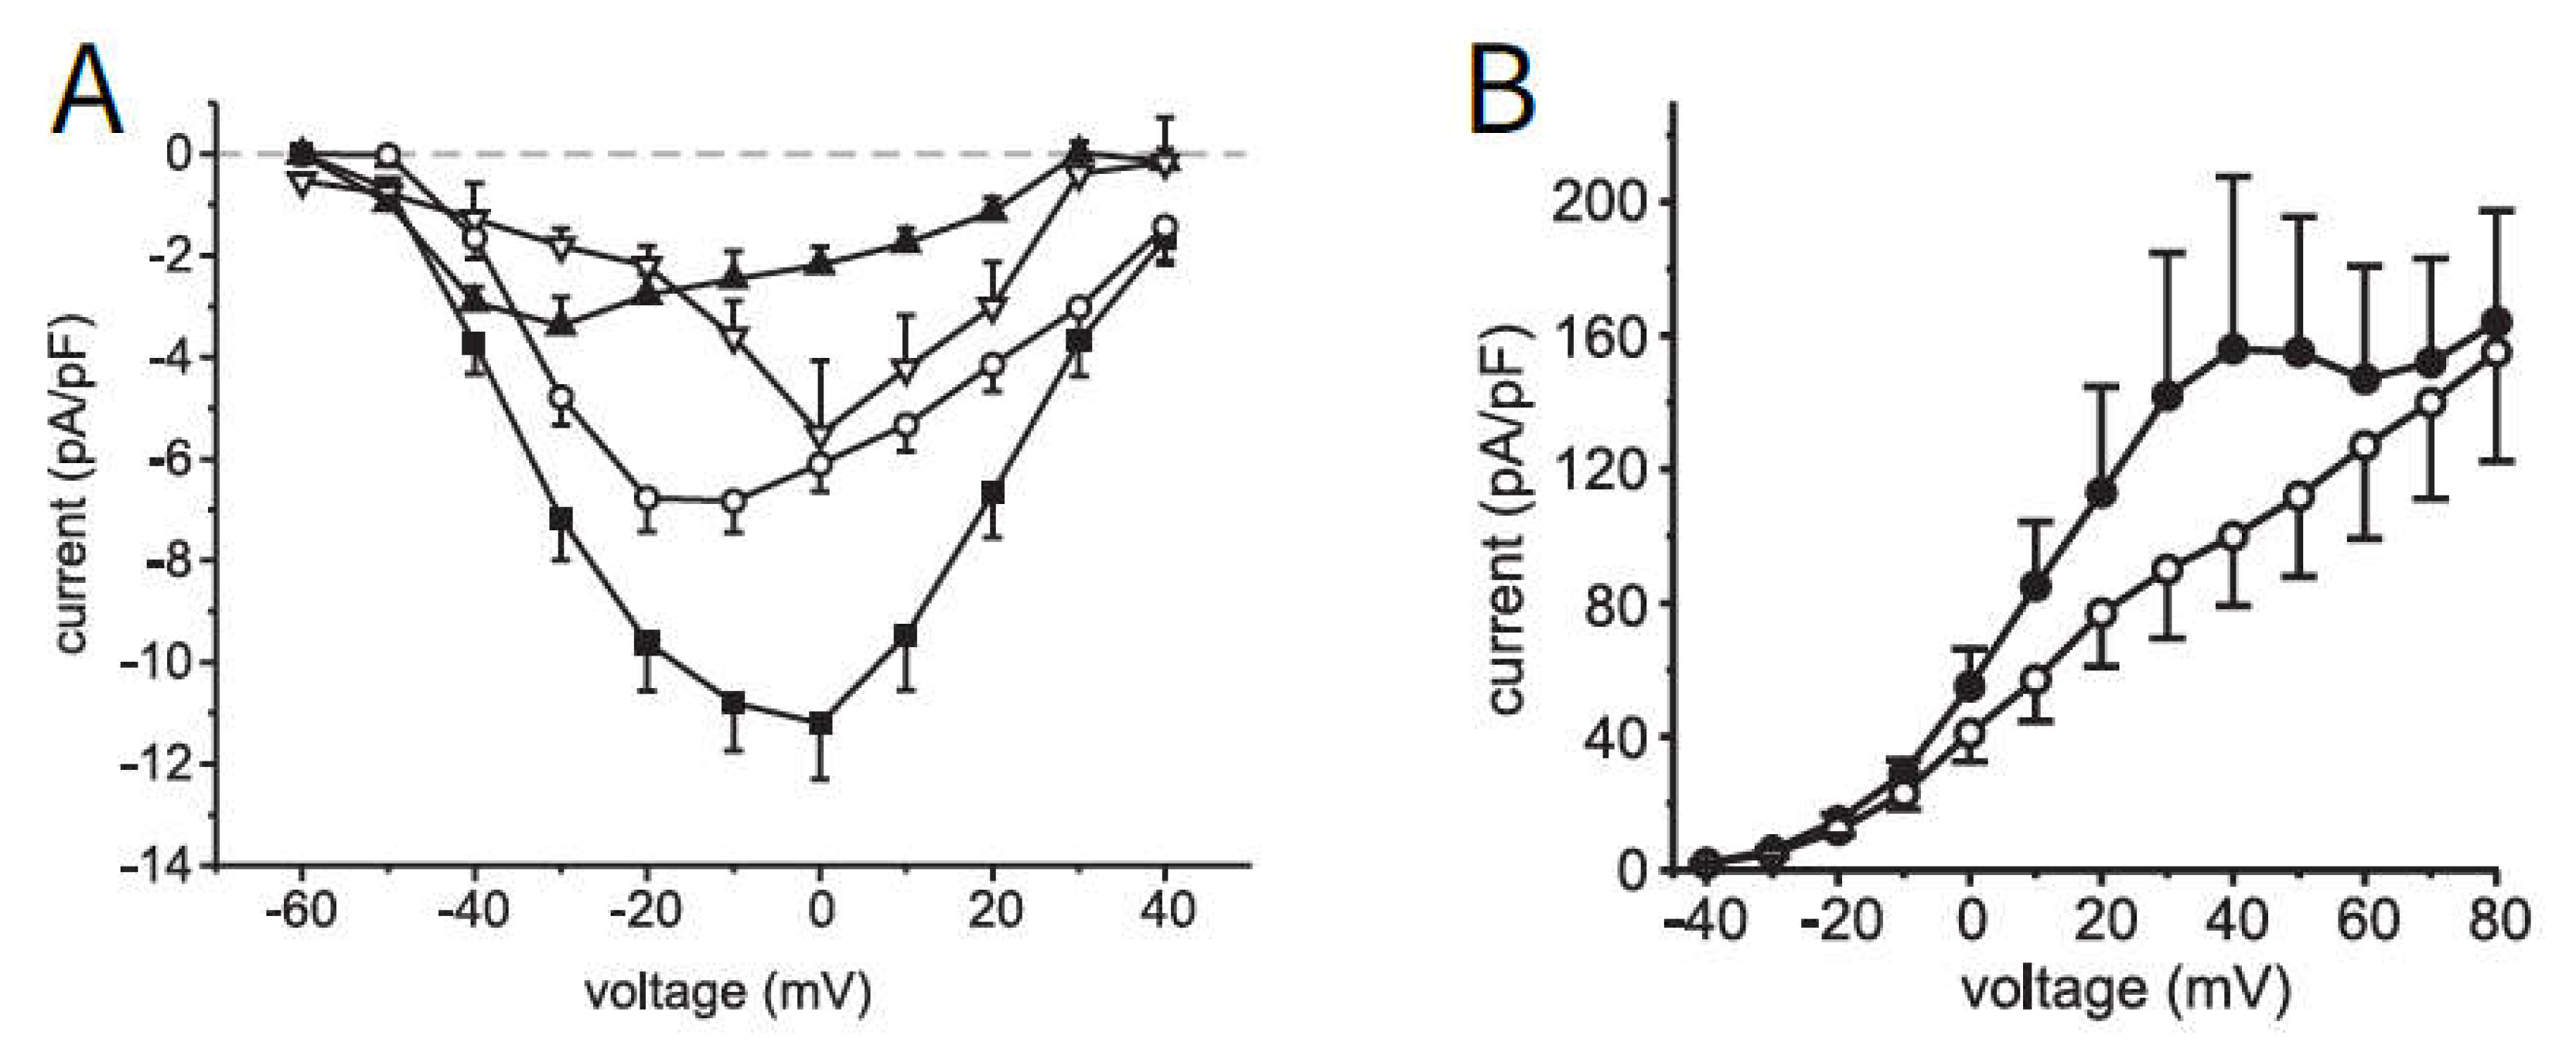
In beta cells, the pattern of action potential spiking results mainly from the currents flowing through the voltage-dependent potassium and Ca
2+ channels, whereby the transmembrane voltage determines both the open probability of the channels and the driving force of the ion current. To test the descriptive power of the equations and the given set of parameters, the fluxes through potassium and Ca
2+ channels in human beta cells published by [
38] were chosen (see
Figure 1).
The Ca
2+ current (left, A, the total current, marked as ■, is to be considered here) is characterized by the fact that at negative voltages the Ca
2+ channels are only rarely open (
in
Table A2,
Appendix B is very small), which is why the corresponding current is also small. The probability of the channel being open increases with increasing voltage (
becomes larger), but at the same time, the distance to the Ca
2+ equilibrium potential
decreases, which reduces the driving force and, consequently, the current.
The outward current through the potassium channels (right, B, the current without the addition of Co2+, an inhibitor of Ca2+ influx, is marked as ●) is also influenced by the above factors. Since the potassium equilibrium potential is in the negative range, the current increases with increasing voltage. The shoulder is caused by the current through the large-conductance Ca2+-activated K channels (BK channels), reacting to the opening of voltage-dependent Ca2+ channels.
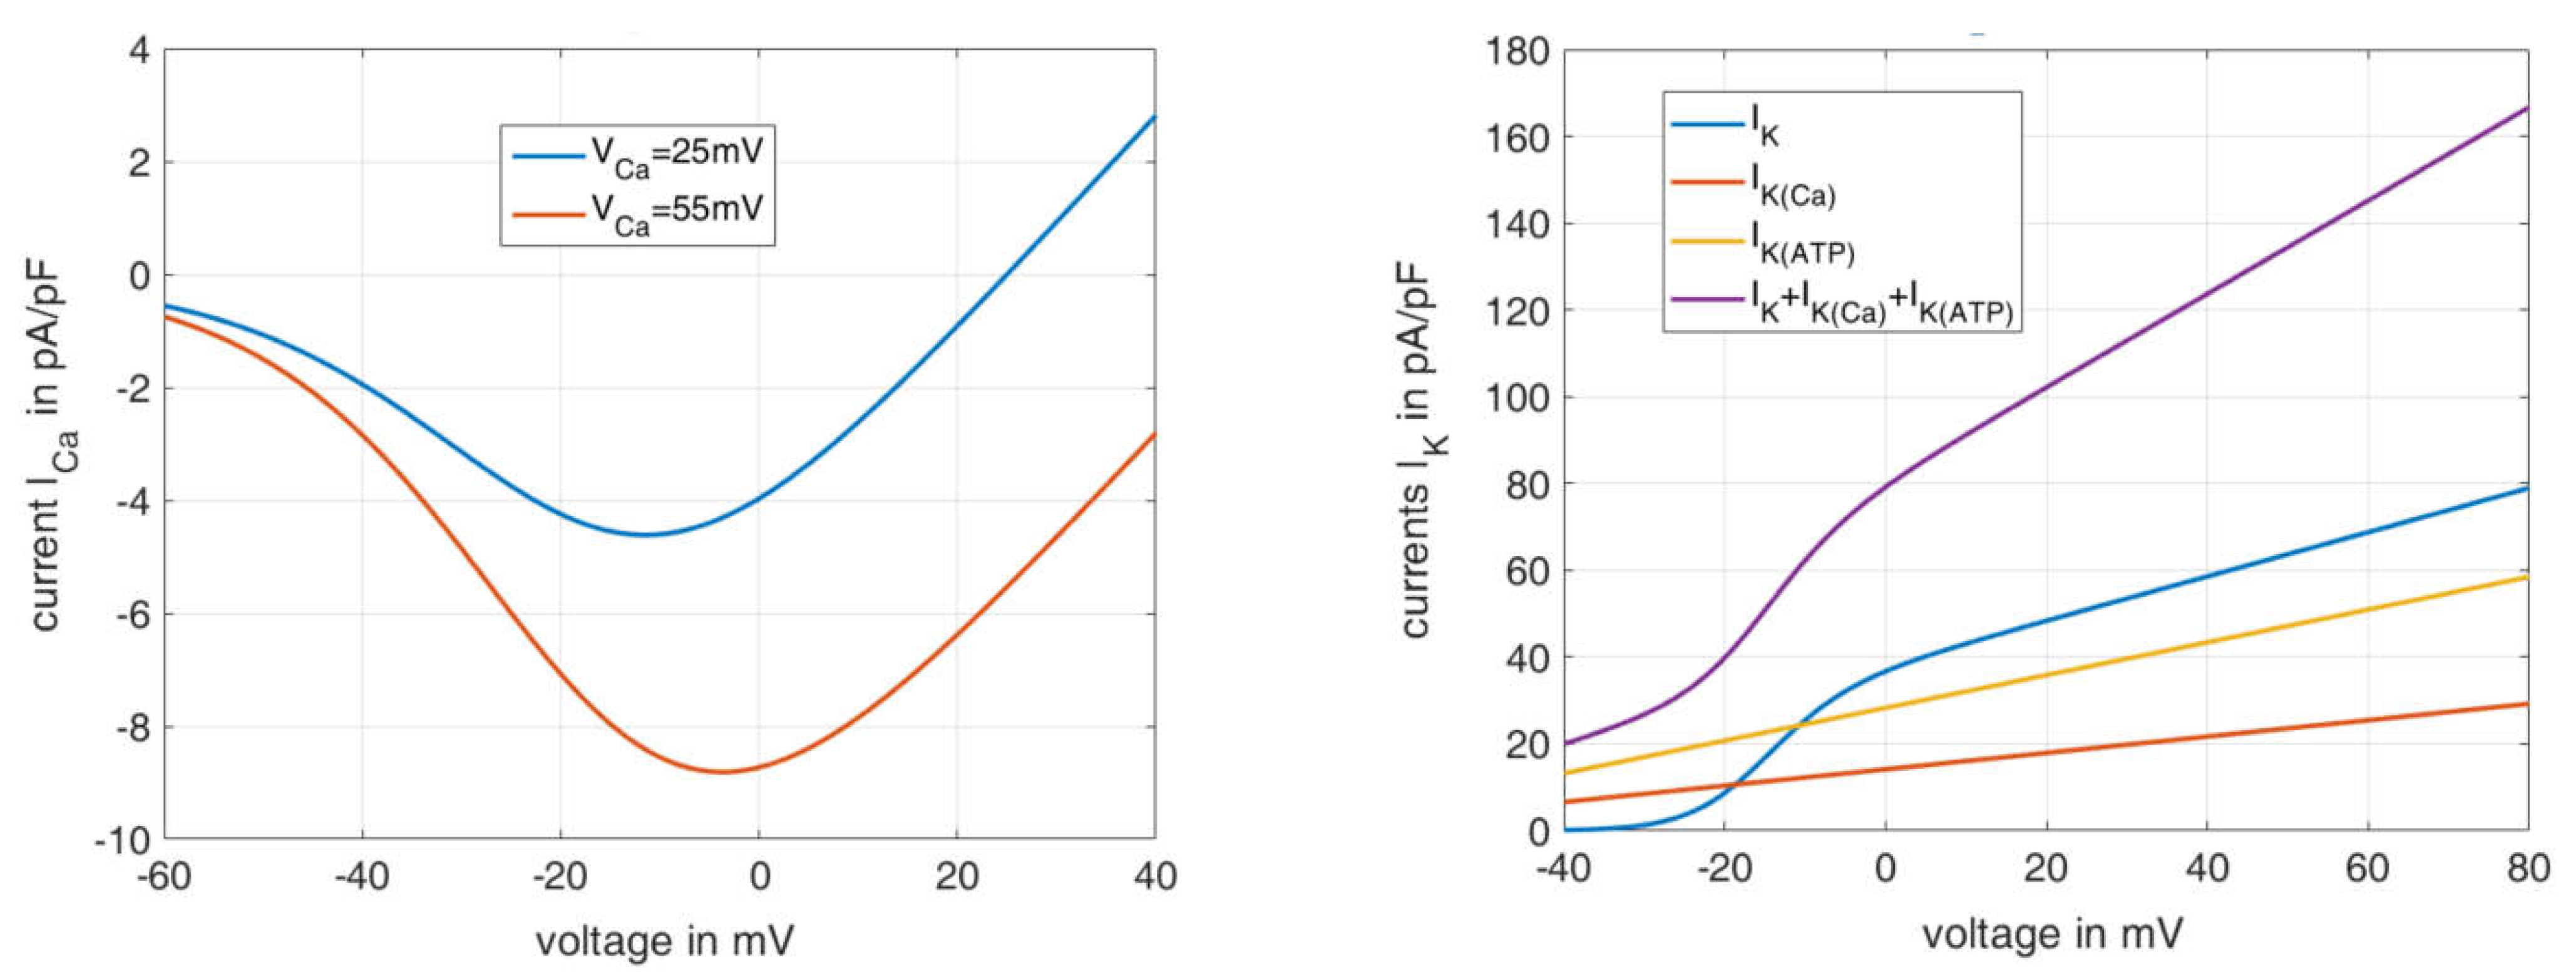
Figure 2 shows the current–voltage relations for the Ca
2+ flux (left) and the K
+ flux (right), as calculated according to the associated formulas in
Table A2,
Appendix B. The course of the Ca
2+ current is shown for two different equilibrium Ca
2+ voltages
These can take on very different values due to the variability of the cytosolic Ca
2+ concentration. If a
value of 25 mV is set as in the reference model [
36], the formula describes the blue curve, which deviates strongly from the sum of the measured Ca
2+ currents shown in
Figure 1A. If, on the other hand, the
value is set to 55 mV, the resulting orange curve represents the measured values well, both qualitatively and quantitatively.
The right panel in
Figure 2 depicts the curves of the individual potassium ion currents depending on the voltage. For simplification, the steady state is assumed here for
(i.e.,
), and open channels are assumed for
and
. The violet curve can be compared with the curves in
Figure 1 on the right. The increase between −20 mV and 0 mV can also be seen very well here, and its causation by the opening of the
channels can be clearly identified (blue curve). A remaining difference is a shoulder with a peak at 40 mV, which does not appear, since the Ca
2+ influx through voltage-dependent Ca
2+ channels and its effect on
were not included in the calculation.
These comparisons between measurements and simulation confirm the potential of the existing equations to represent complex phenomena. On the other hand, it also becomes clear that moderate changes in the parameters can have marked consequences on the system’s behavior.
2.2. Inflence of Agents
In this chapter, the reaction of the membrane potential to a set of insulinotropic stimuli is examined. In addition to glucose, which acts as a nutrient secretagogue (see above), the purely depolarizing stimuli, KCl and tolbutamide, are considered. Increasing the extracellular K+ concentration raises the potassium equilibrium potential, and tolbutamide reduces the outwardly directed K+ current by closing KATP channels.
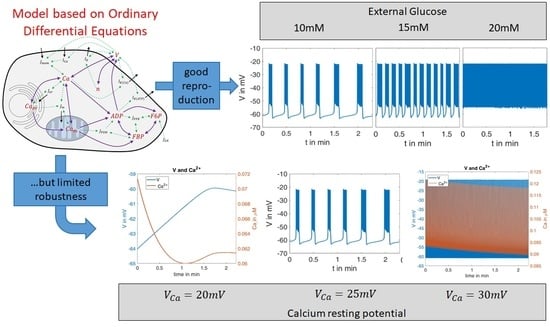
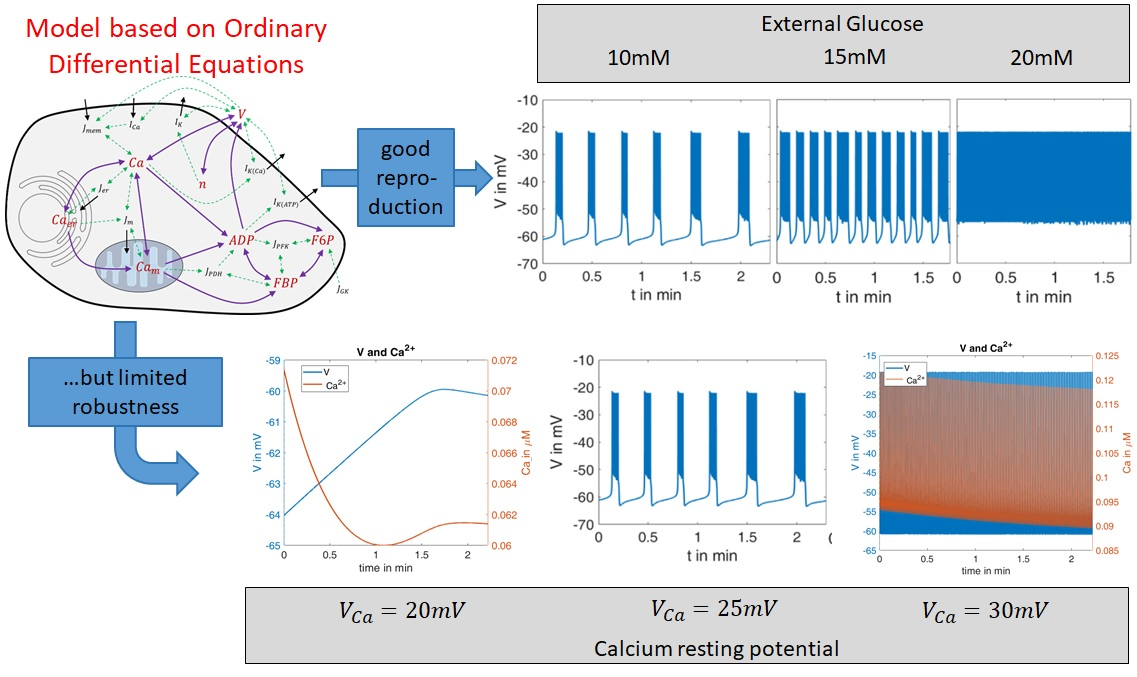
2.2.1. Variation of Glucose Concentration
To test how well the model describes the changes of action potential spiking in response to stimulatory glucose concentrations, the measurements published by [
39] were chosen. The development of the action potential pattern is depicted in
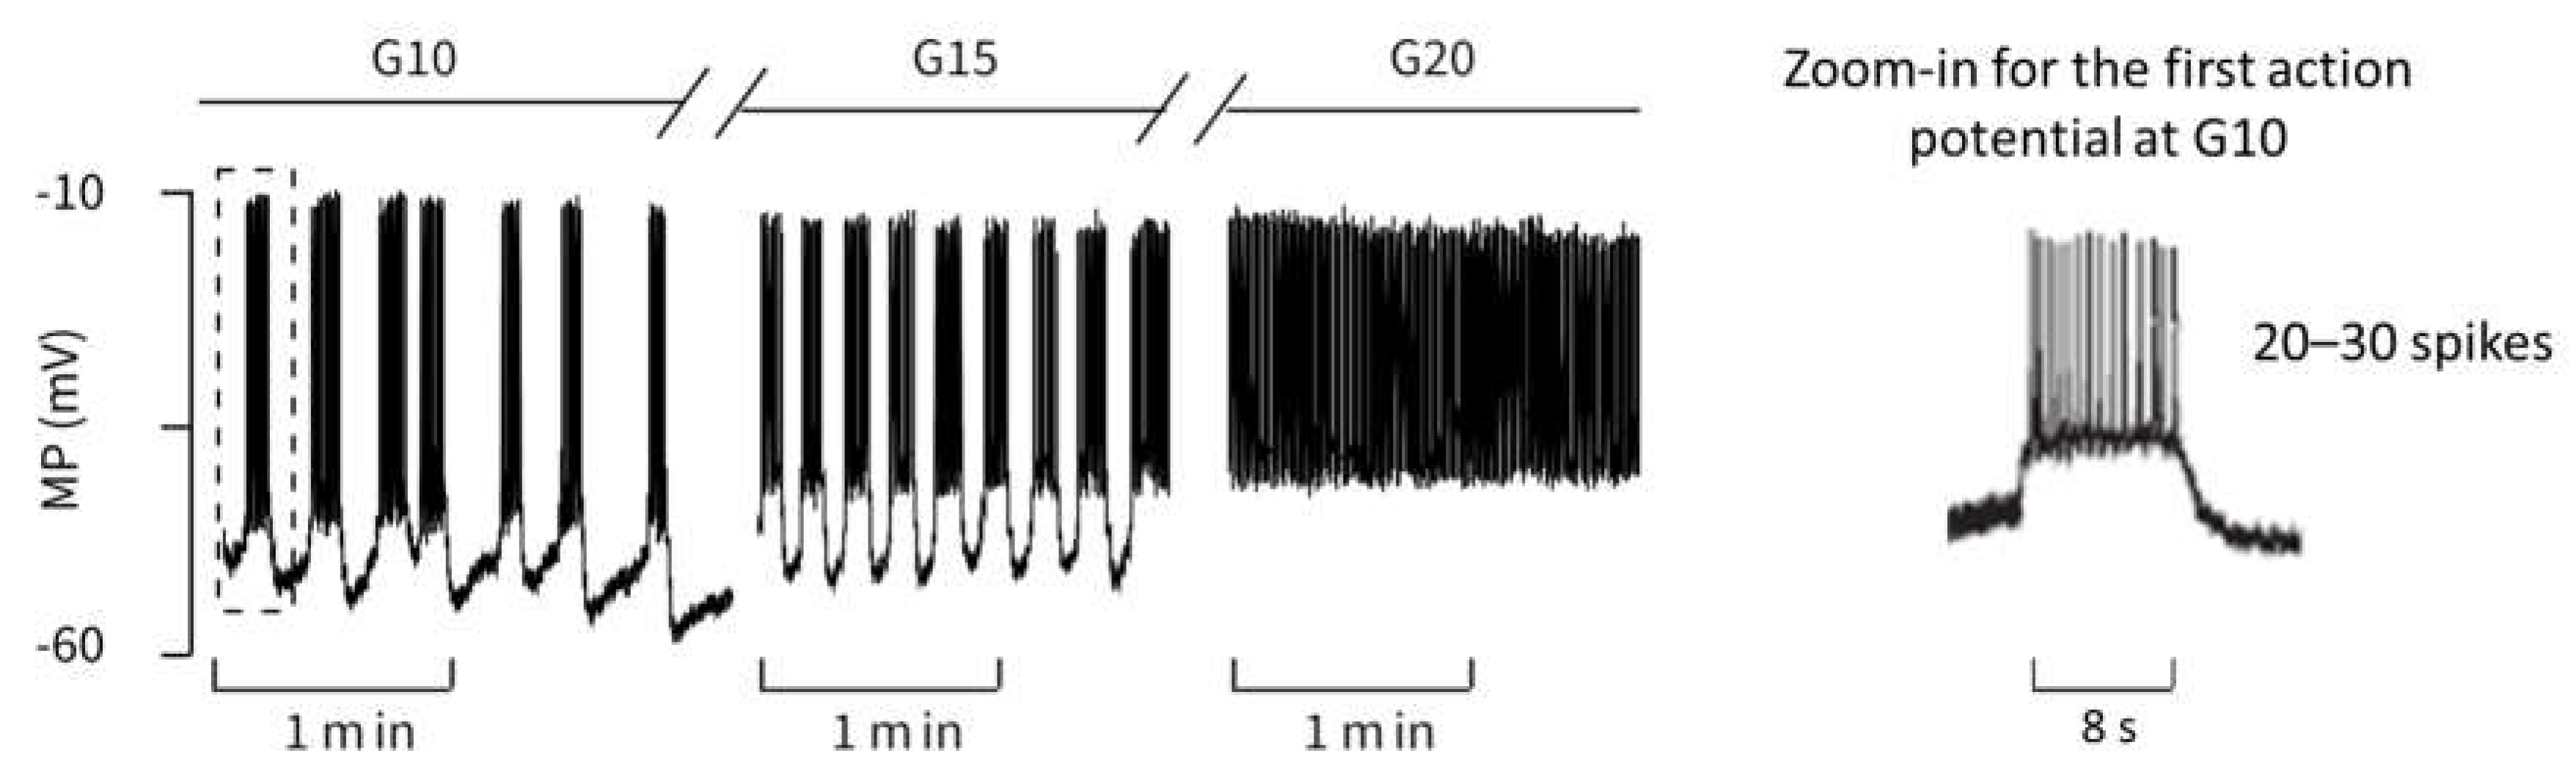
Figure 3. It shows oscillations on different time scales (seconds and hundredths of a second). The high-frequency oscillations represent bursts of action potentials that last a few seconds, separated from each other by electrically silent phases of variable length. At all stimulatory glucose concentrations, the membrane potential oscillates between ca. −45 mV and −10 mV during the action potential bursting, and falls to about −55 mV during the interspersed repolarization phases. The measurements show that raising the glucose concentration to higher values diminishes the distance between the bursting phases until no repolarization occurs at 20 mM glucose.
To compare this measurement with the simulation, it was purposive to introduce a factor
to the ADP-term in the equation describing the relation between ATP and ADP (cf. Equation (A7) in
Table A1,
Appendix B), since the extracellular glucose concentration is not an explicit component of the model proposed by [
36].
Actually, in the most recent publication by this group [
40] a separate parameter G was included in the equations, but the effect of
, as used in the present paper, is mathematically comparable. A high value of
accelerates the decrease of ADP with increasing extracellular glucose concentrations. With respect to the reference parameter set, the
value is set to
for a glucose concentration of 10 mM, to match the measured curve as closely as possible.
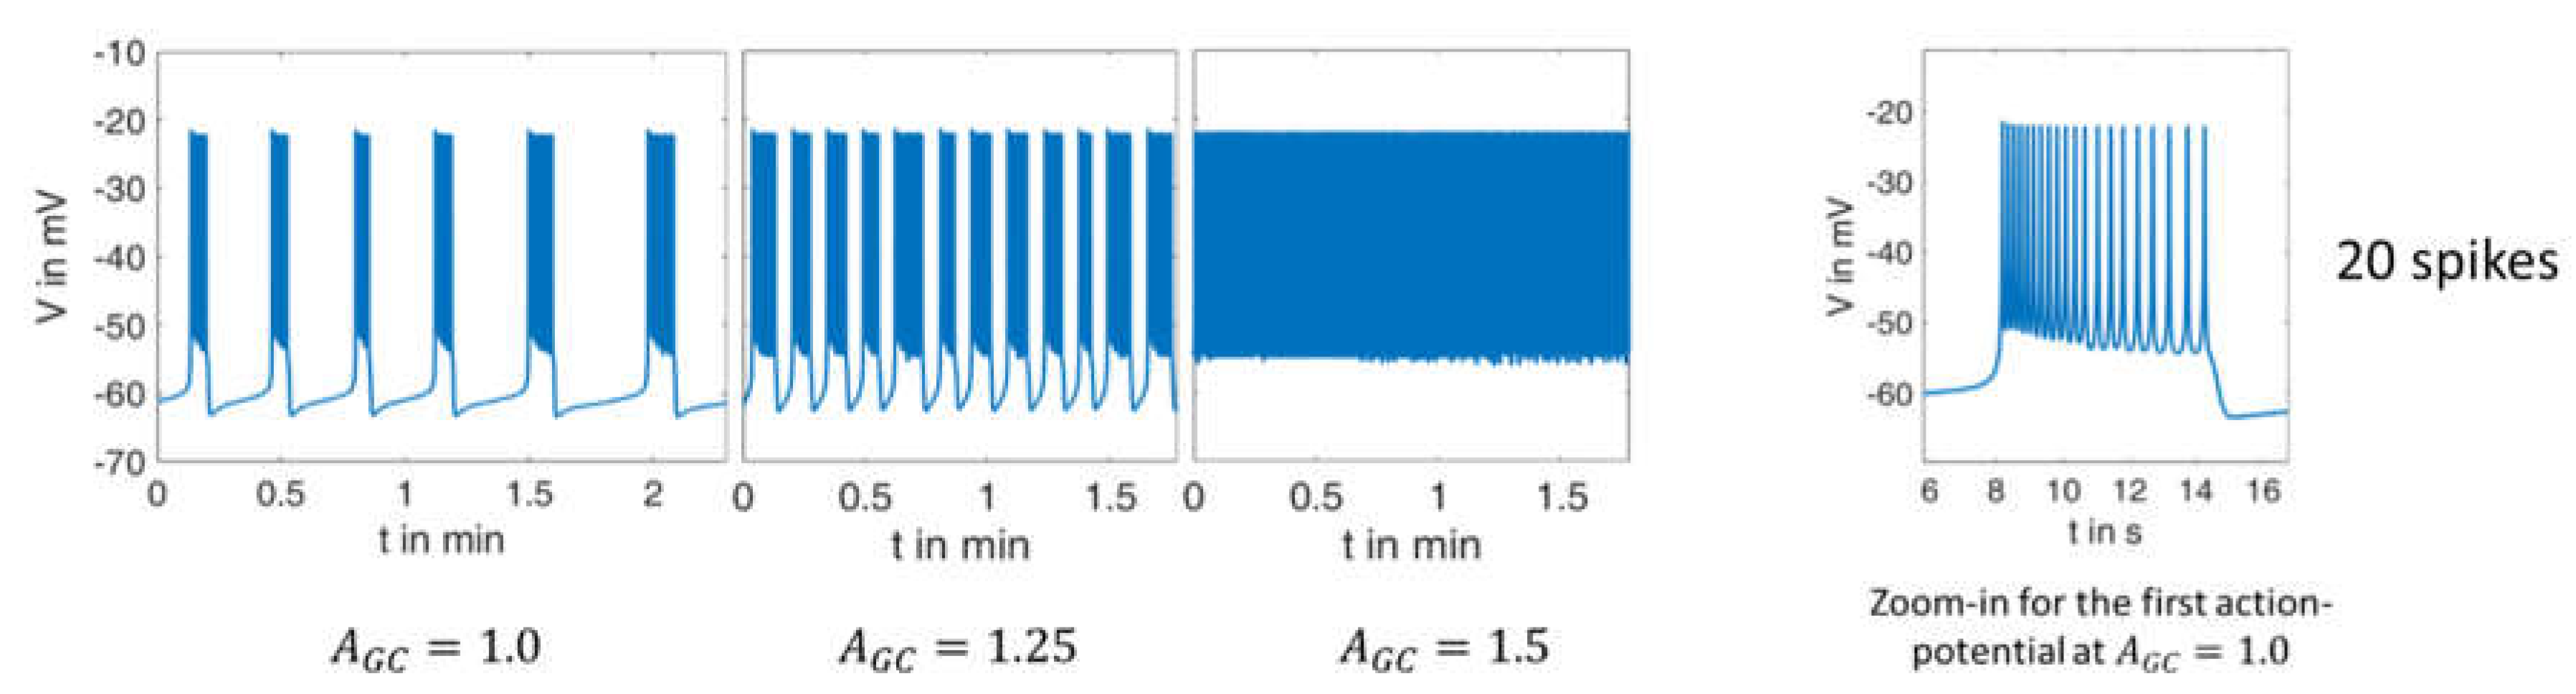
Figure 4 shows the calculated courses of the membrane potential and allows a direct comparison with the measurement in
Figure 3. The agreement between both is excellent in many respects, and it particularly concerns the following:
The quantitative values of the membrane potential (except for the small deviations in the maximum potential during the bursts).
The characteristics of the curves (alternation between high-frequency and low-frequency fractions).
The length and variability of the phases between the action potentials. In particular, the ability to reproduce this variability with a set of deterministic ordinary differential equations is very remarkable.
The number of action potentials in the considered time interval.
Zoom-ins of the first action potential in each case are depicted on right-hand panels in
Figure 3 and
Figure 4. The authors do not have raw data for the measurement from the literature [
39] in
Figure 3, but from the representation and time scale, it can be read that the duration of this first action potential is approximately 8 s, during which about 20–30 spikes occur. The distance between the spikes is particularly small at the beginning. This property can be compared with the zoom-in from the simulation in
Figure 4. Here, the duration of the first action potential is approximately 6 s, in which there are exactly 20 spikes. From this, it can be concluded from the comparison between the measurement and the simulation that
The values for that achieve the best possible agreement at higher glucose concentrations were sought for the model, and gave (. Thus, the relation between the extracellular glucose and the AGCvalue is not linear, which is easily recognizable from the fact that a 50% increase () results in a depolarization pattern that fits the experimental observations obtained with 20 mM glucose, but not those with 15 mM glucose. If one now compares simulation and measurement from the point of view of varying glucose supply, the following conclusions can be drawn:
In the simulation as well as in the measurement, the time between two bursts of action potentials shortens with increasing (increasing glucose supply).
At or , respectively, there are practically no more resting phases; action potentials are permanently present.
In the experimental registrations, the peak value of the action potentials decreases with increasing and time; in the simulation, this value remains nearly constant (at about ).
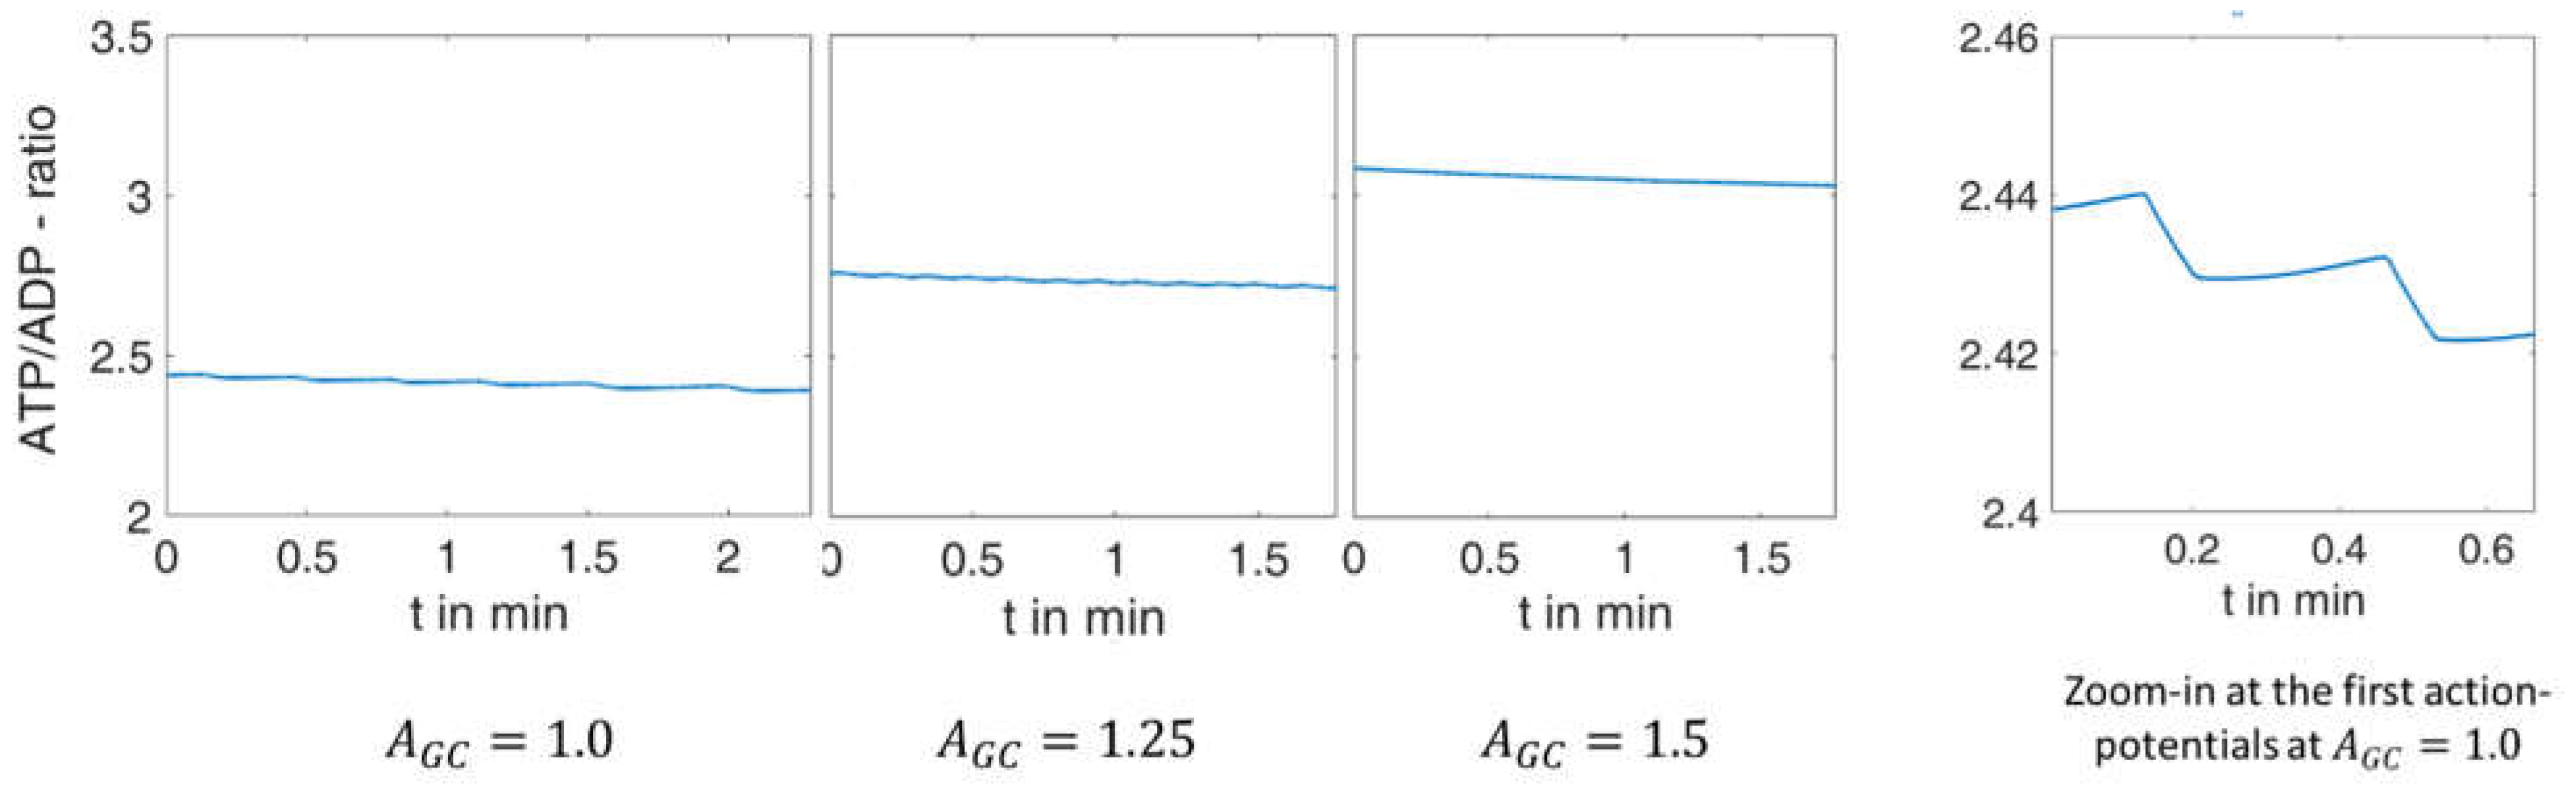
As a further characteristic, the ratio of ATP/ADP can be specified for these systems at each point in time. The corresponding curve is shown in
Figure 5.
This figure shows that the model modification described above couples the ATP/ADP ratio to the increasing extracellular glucose concentration, a relation that has repeatedly been demonstrated experimentally [
42,
43]. Primarily, this feature affects the mean value. During the electrical activity, a decrease in the ATP/ADP ratio does occur over time (best seen in the zoom-in to the right), but this is orders of magnitude smaller than that due to a decrease in glucose concentration.
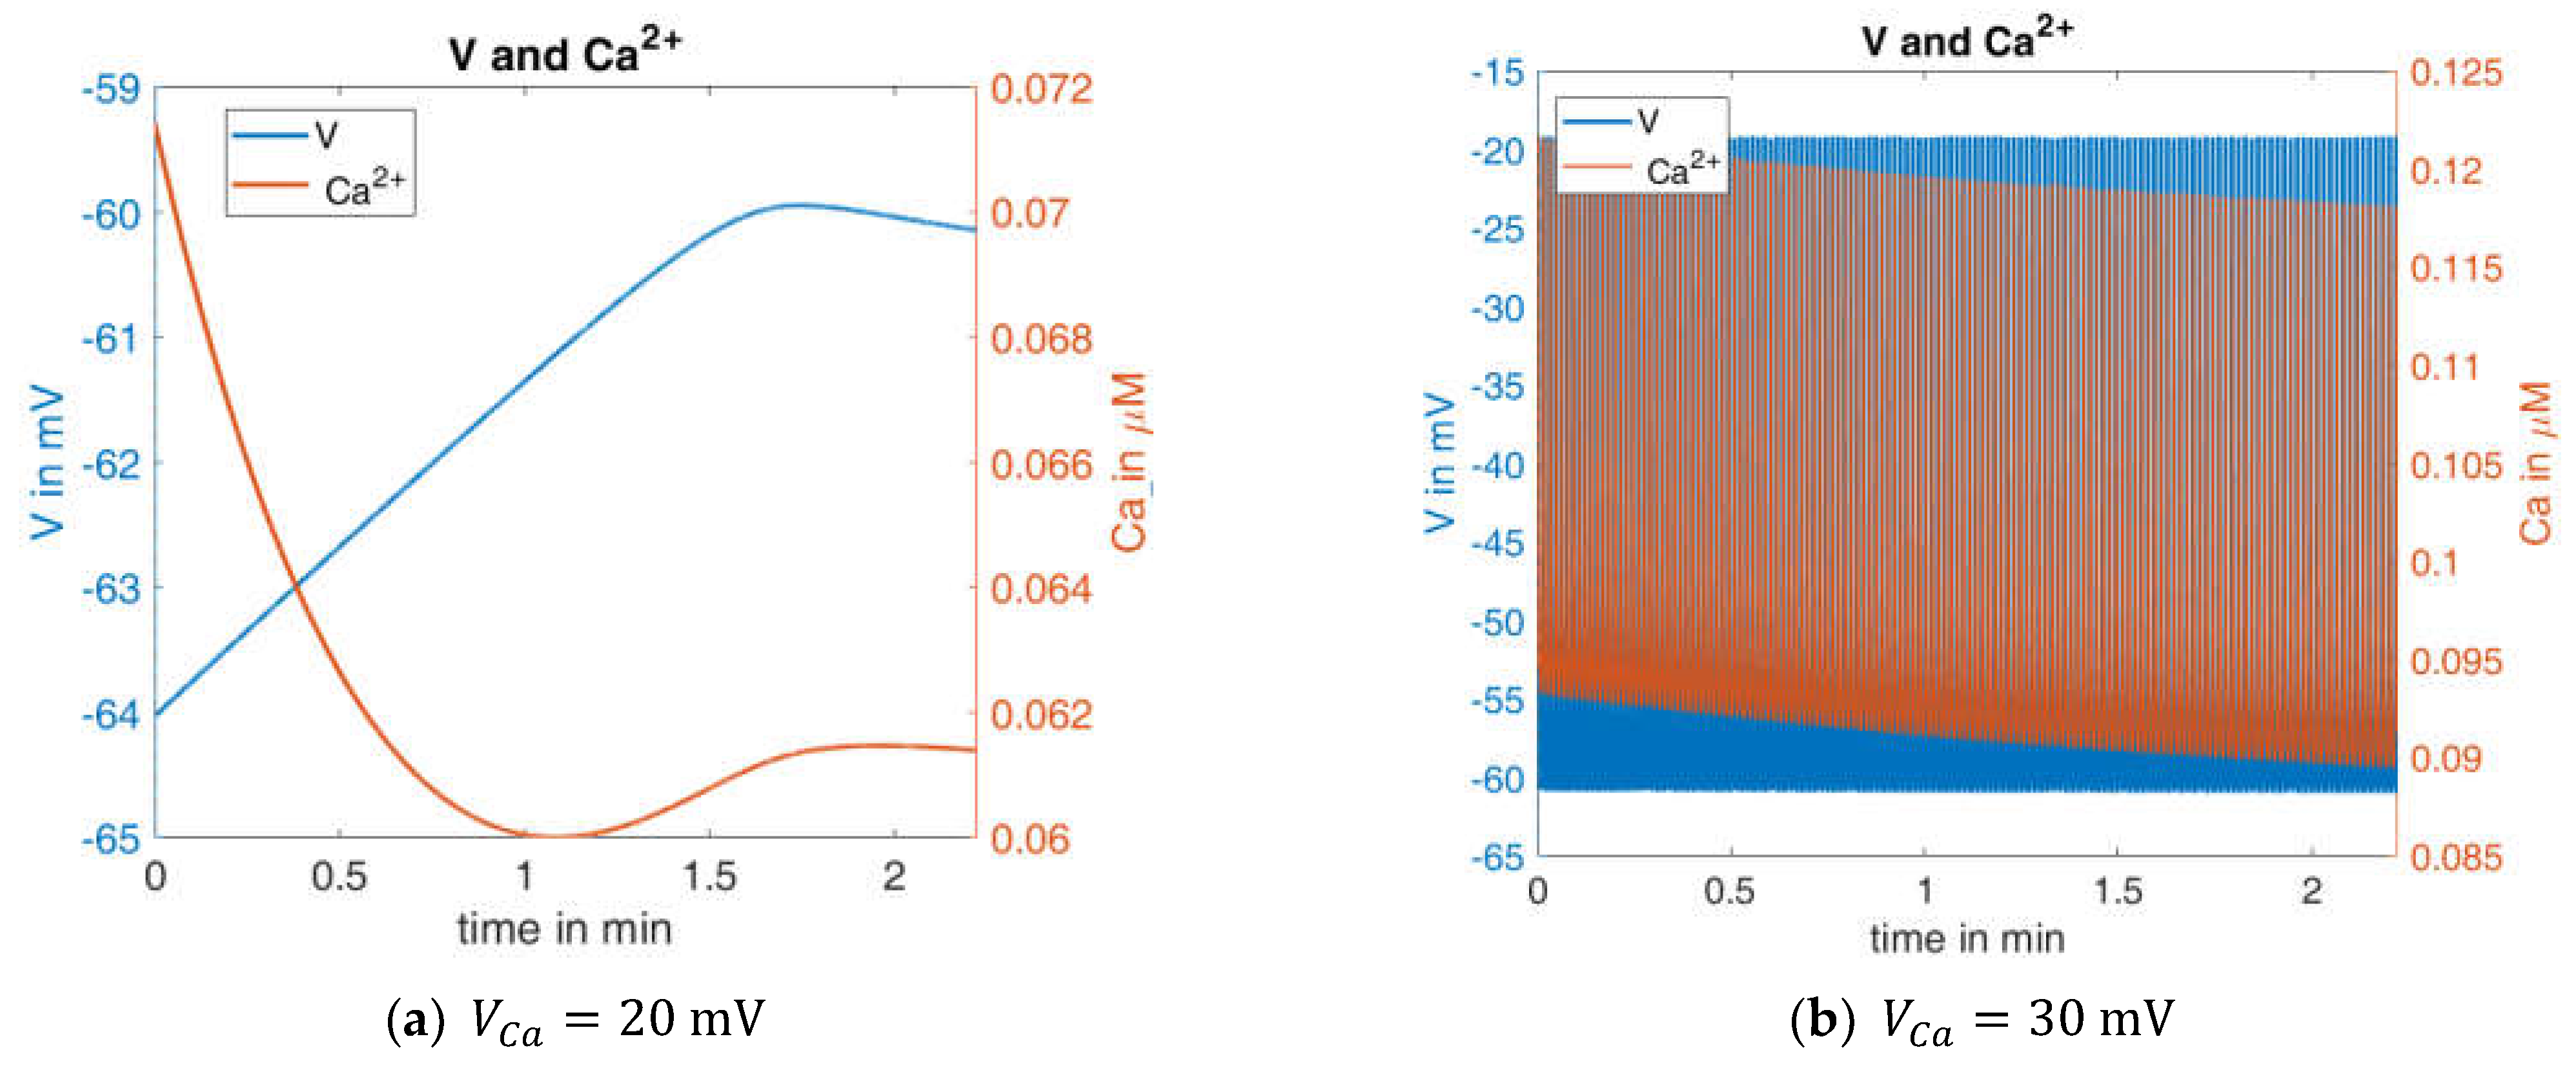
In order to test the robustness of the model, the values of one of the parameters were changed. In beta cells, the influx of Ca
2+ forms the upstroke of the action potential [
44]. At a given open probability of the Ca
2+ channels, the flux is proportional to the difference between the actual membrane potential, which is typically in the negative range, and the Ca
2+ equilibrium potential (
), which is in the positive range. Consequently, the larger the value of
is, the larger the flux will be.
was only moderately changed; it decreased from 25 mV to 20 mV and increased from 25 mV to 30 mV.
In
Figure 6, left panel shows the curves of
and
for the first interval (G10,
). The blue curve can be directly compared with the left curve in
Figure 4. When
is reduced to 20 mV, no action potentials occur. The membrane potential and the cytosolic Ca
2+ concentration change only marginally over time, and then reach a steady state. In the case of an increased
value (30 mV,
Figure 6, right panel), the behavior is virtually the opposite; continuous large-amplitude action potentials are accompanied by a high-frequency oscillation of the cytosolic Ca
2+ concentration.
This extreme reaction to a moderate change of one model parameter is an indication of how much the informative value of this model depends on the right choice of the model parameters. Since it cannot be assumed that a real beta cell has a similar sensitivity to the Ca2+ equilibrium potential, a further evolution of the model seems necessary to improve its robustness.
2.2.2. Variation of K+ Concentration
Raising the extracellular K
+ concentration from a physiological value of about 5 mM to 30 or 40 mM, or even higher, is a widely used experimental procedure to elicit a Ca
2+ influx via voltage-dependent Ca
2+ channels. The resultant increase of the cytosolic Ca
2+ is sufficient to stimulate the secretion of insulin [
45]. To test the ability of the model to correctly describe a complex pattern of the cytosolic Ca
2+ concentration in response to changes in the extracellular K
+ concentration, we chose the measurement published by [
39] and depicted in
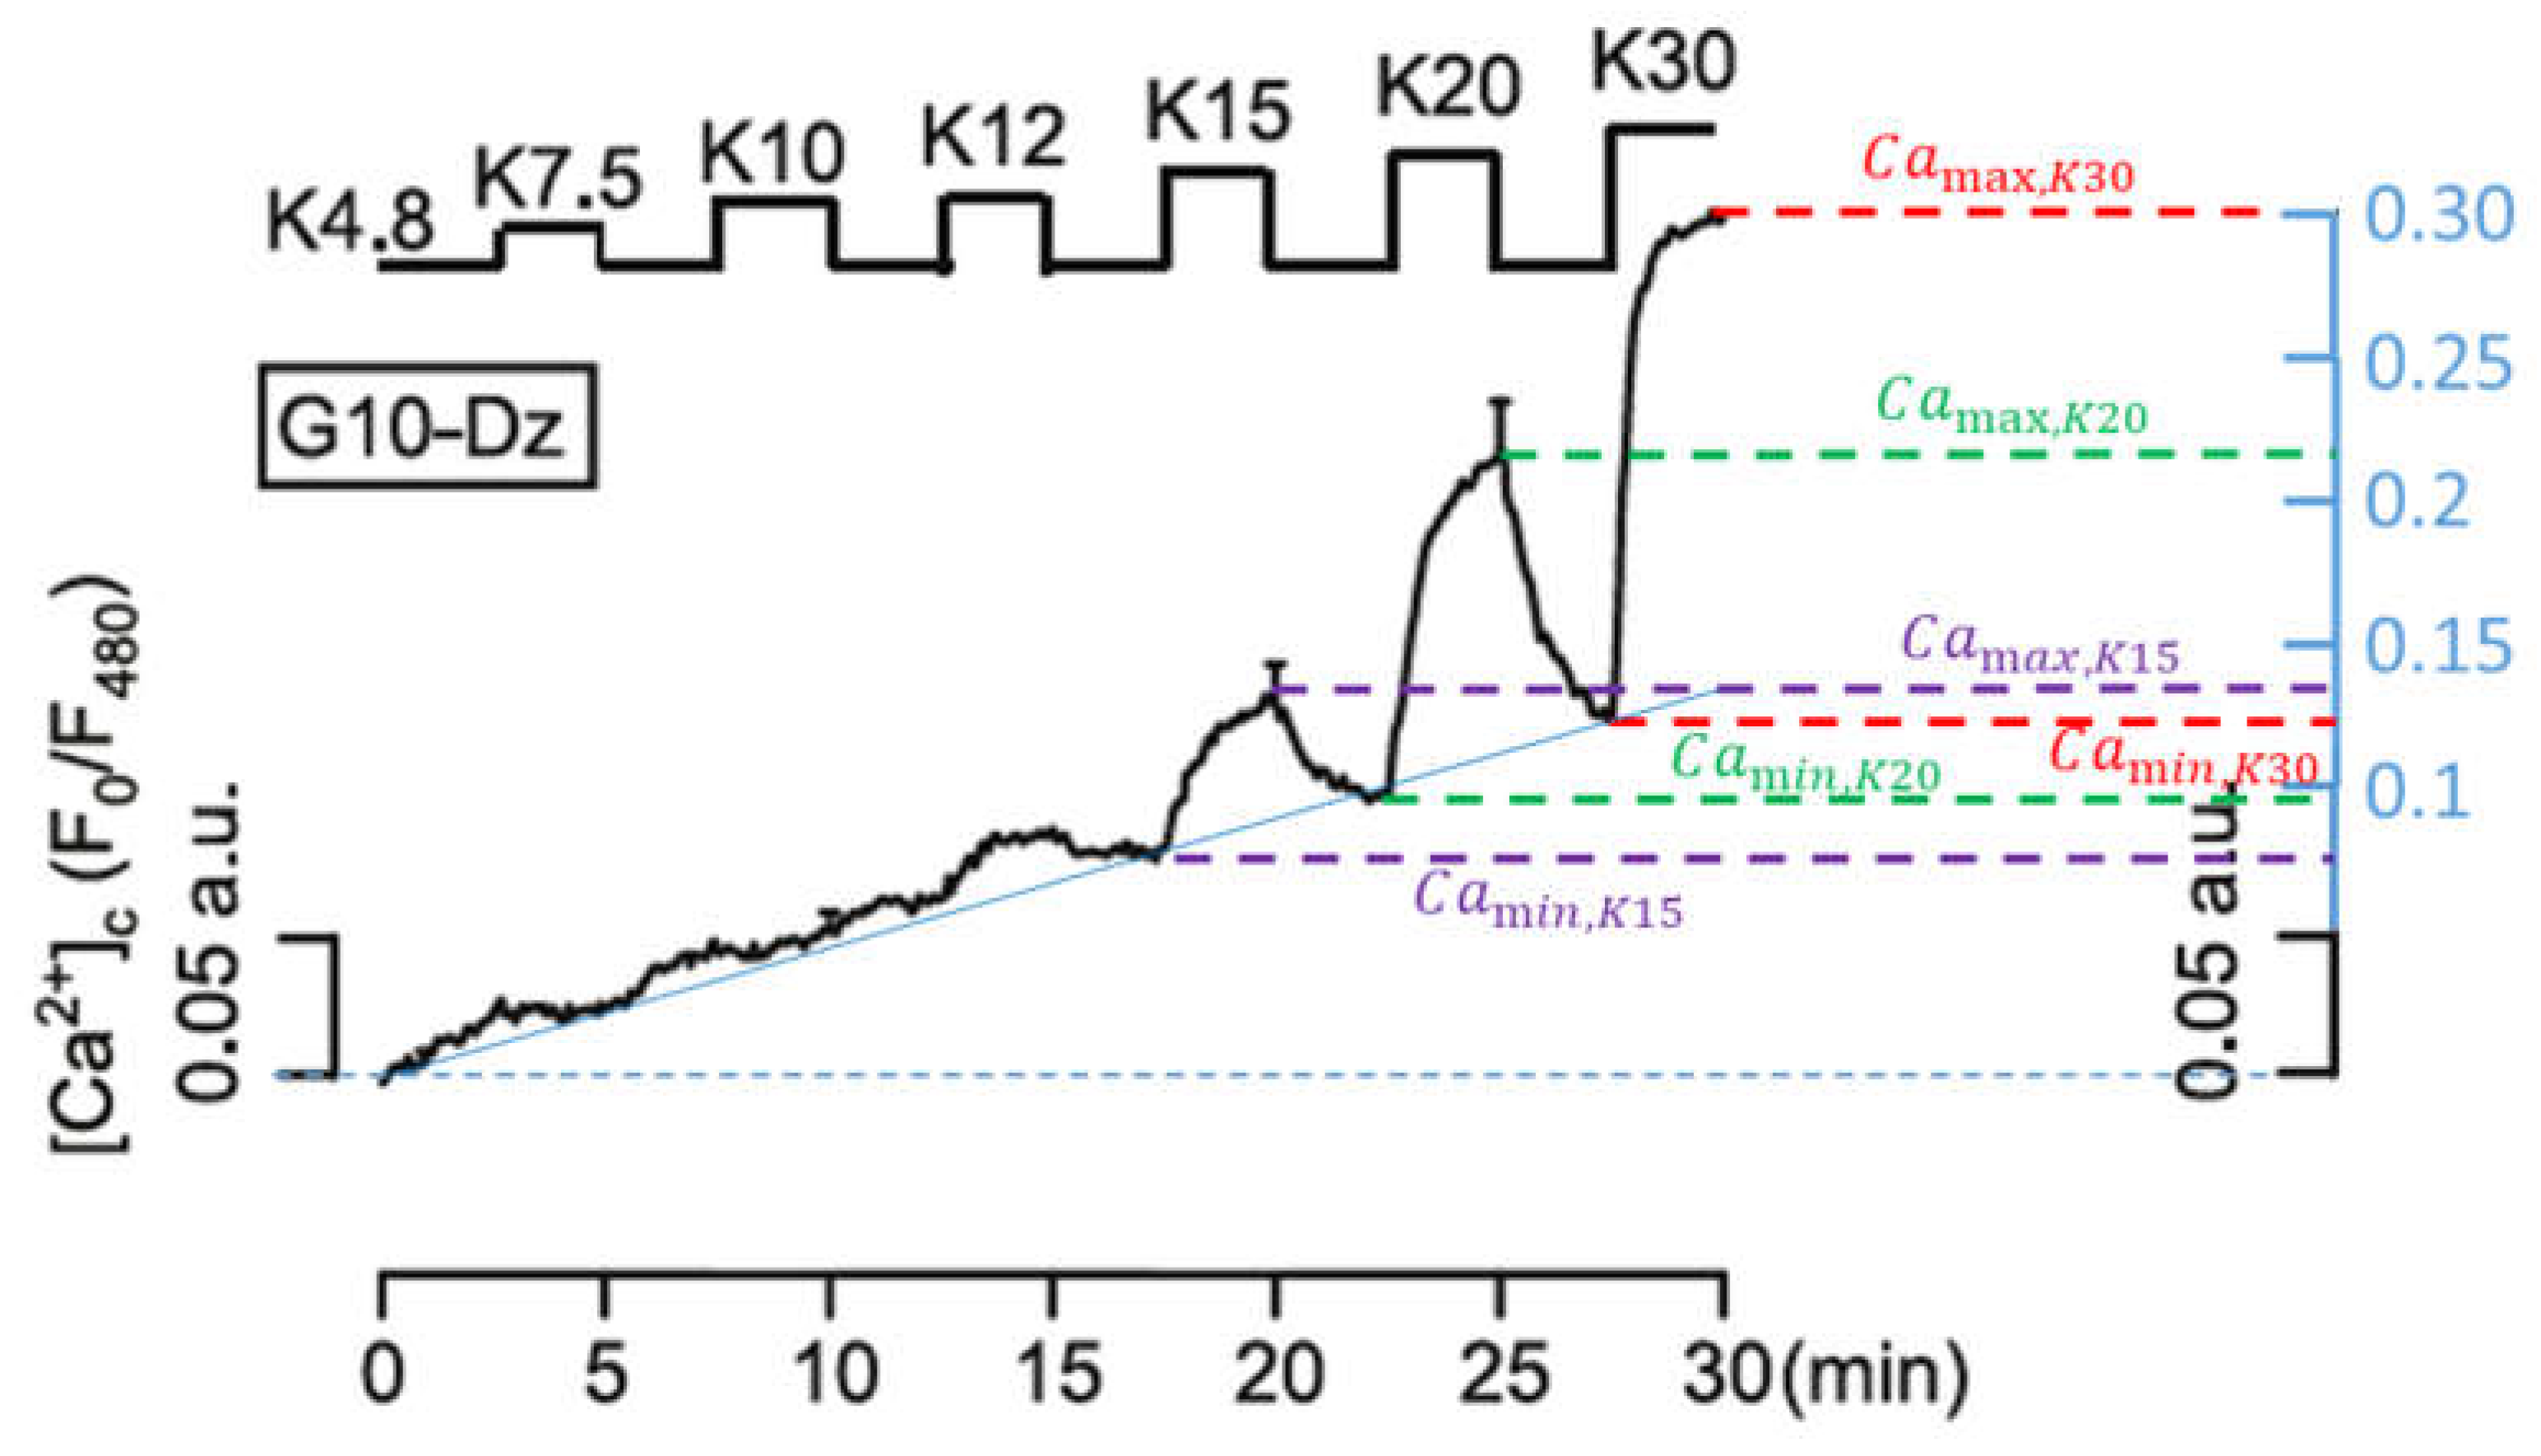
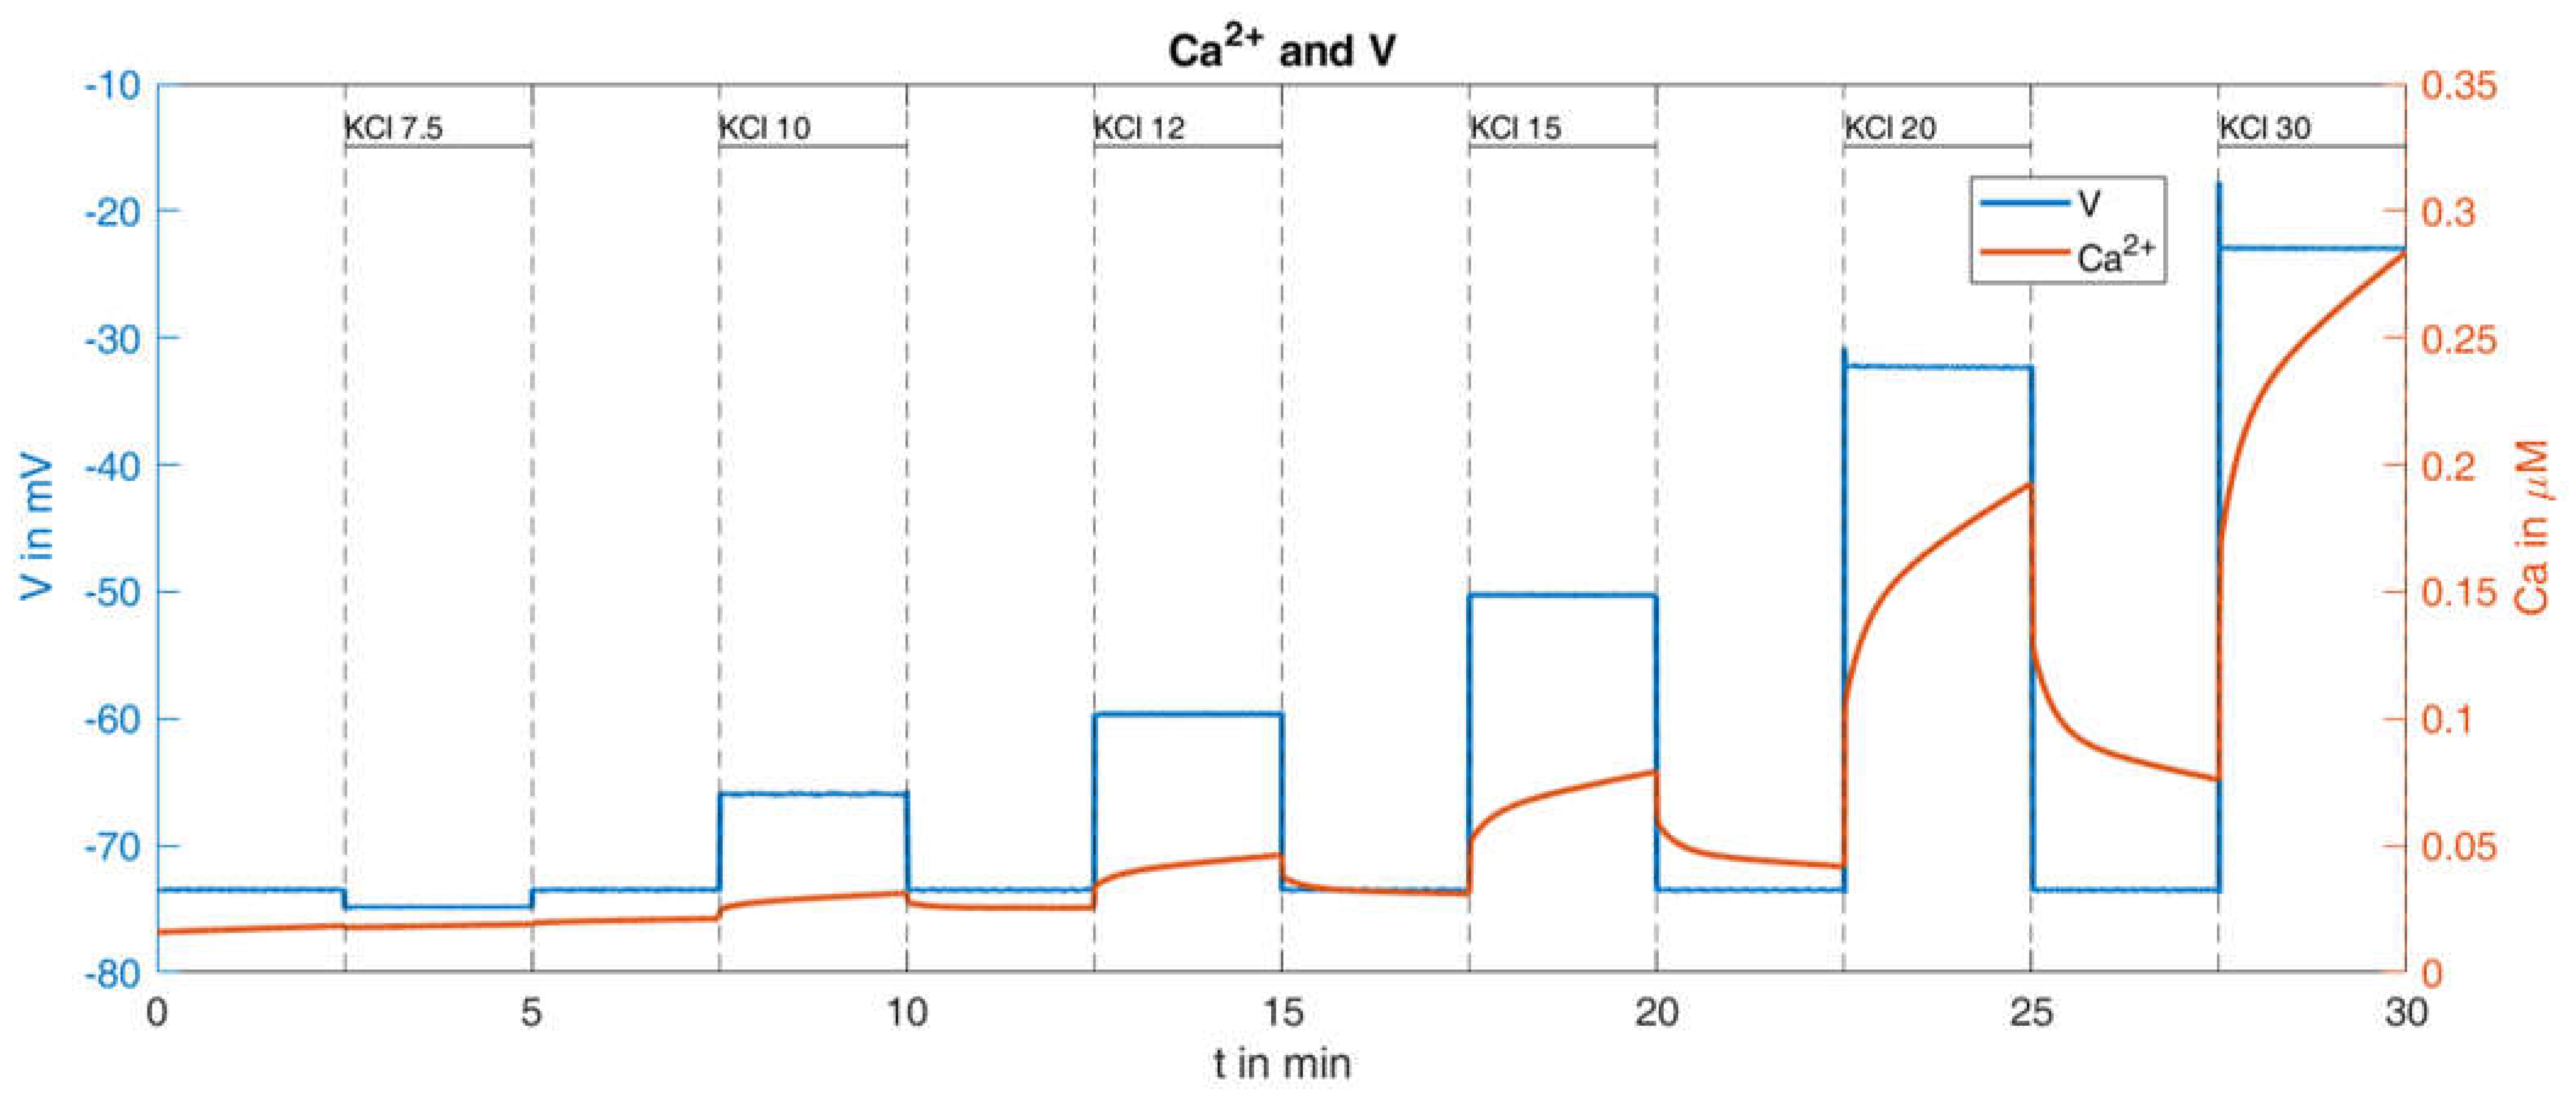
Figure 7. Here, the potassium concentration is increased stepwise from 7.5 mM to 30 mM, interrupted by
intervals at the physiological value of 4.8 mM. The authors of the present paper have added the blue scale on the right of the figure to further quantify the results, in order to be able to compare individual quantities with the simulations.
Up to the increase in the potassium concentrations to
, a nearly continuous (linear over time, see solid blue line) increase of the cytosolic Ca
2+ concentration predominates until a self-reinforcing effect occurs due to progressively stronger depolarisation, which causes the Ca
2+ concentration to rise rapidly before it decreases again rapidly with a reduction in the potassium concentration. The difference between the temporary maxima (right before the potassium concentration is reduced again) and the temporary minima (immediately before the potassium concentration is increased again), increases with increasing potassium concentrations. These are clearly readable, especially in the last three oscillations (cf.
Figure 7), and are listed in
Table 1:
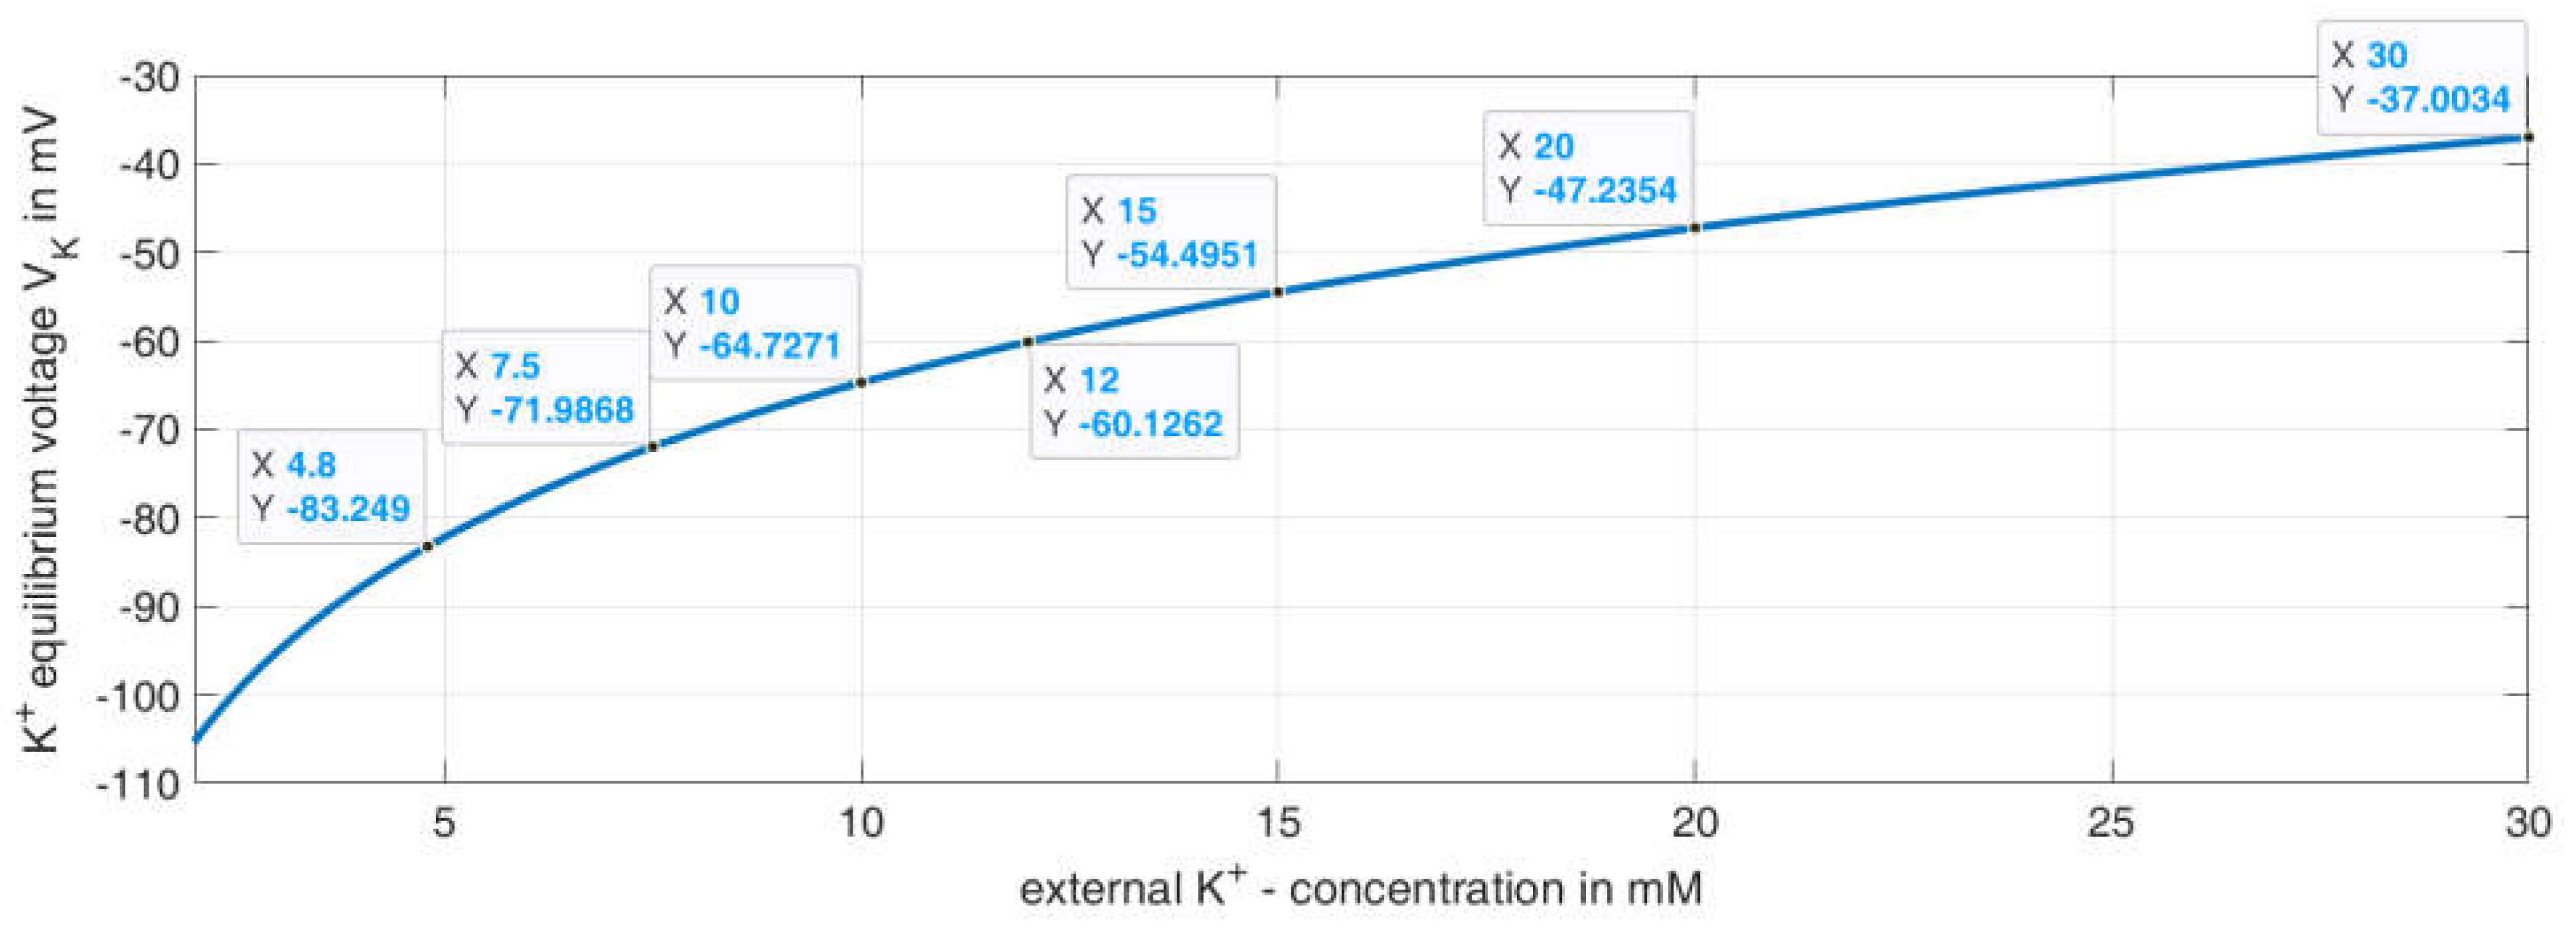
For the model, the influence of the changing potassium concentration is taken into account via the potassium equilibrium potential
. For this purpose, the value of
is changed abruptly for the respective time intervals, using the Nernst equation as a basis, and assuming a temperature of
and an intracellular potassium concentration of
:
This formula generated the curve for
depending on the extracellular K+ concentration, as shown in
Figure 8. The data tips represent the values used for the given K
+ concentrations in the model.
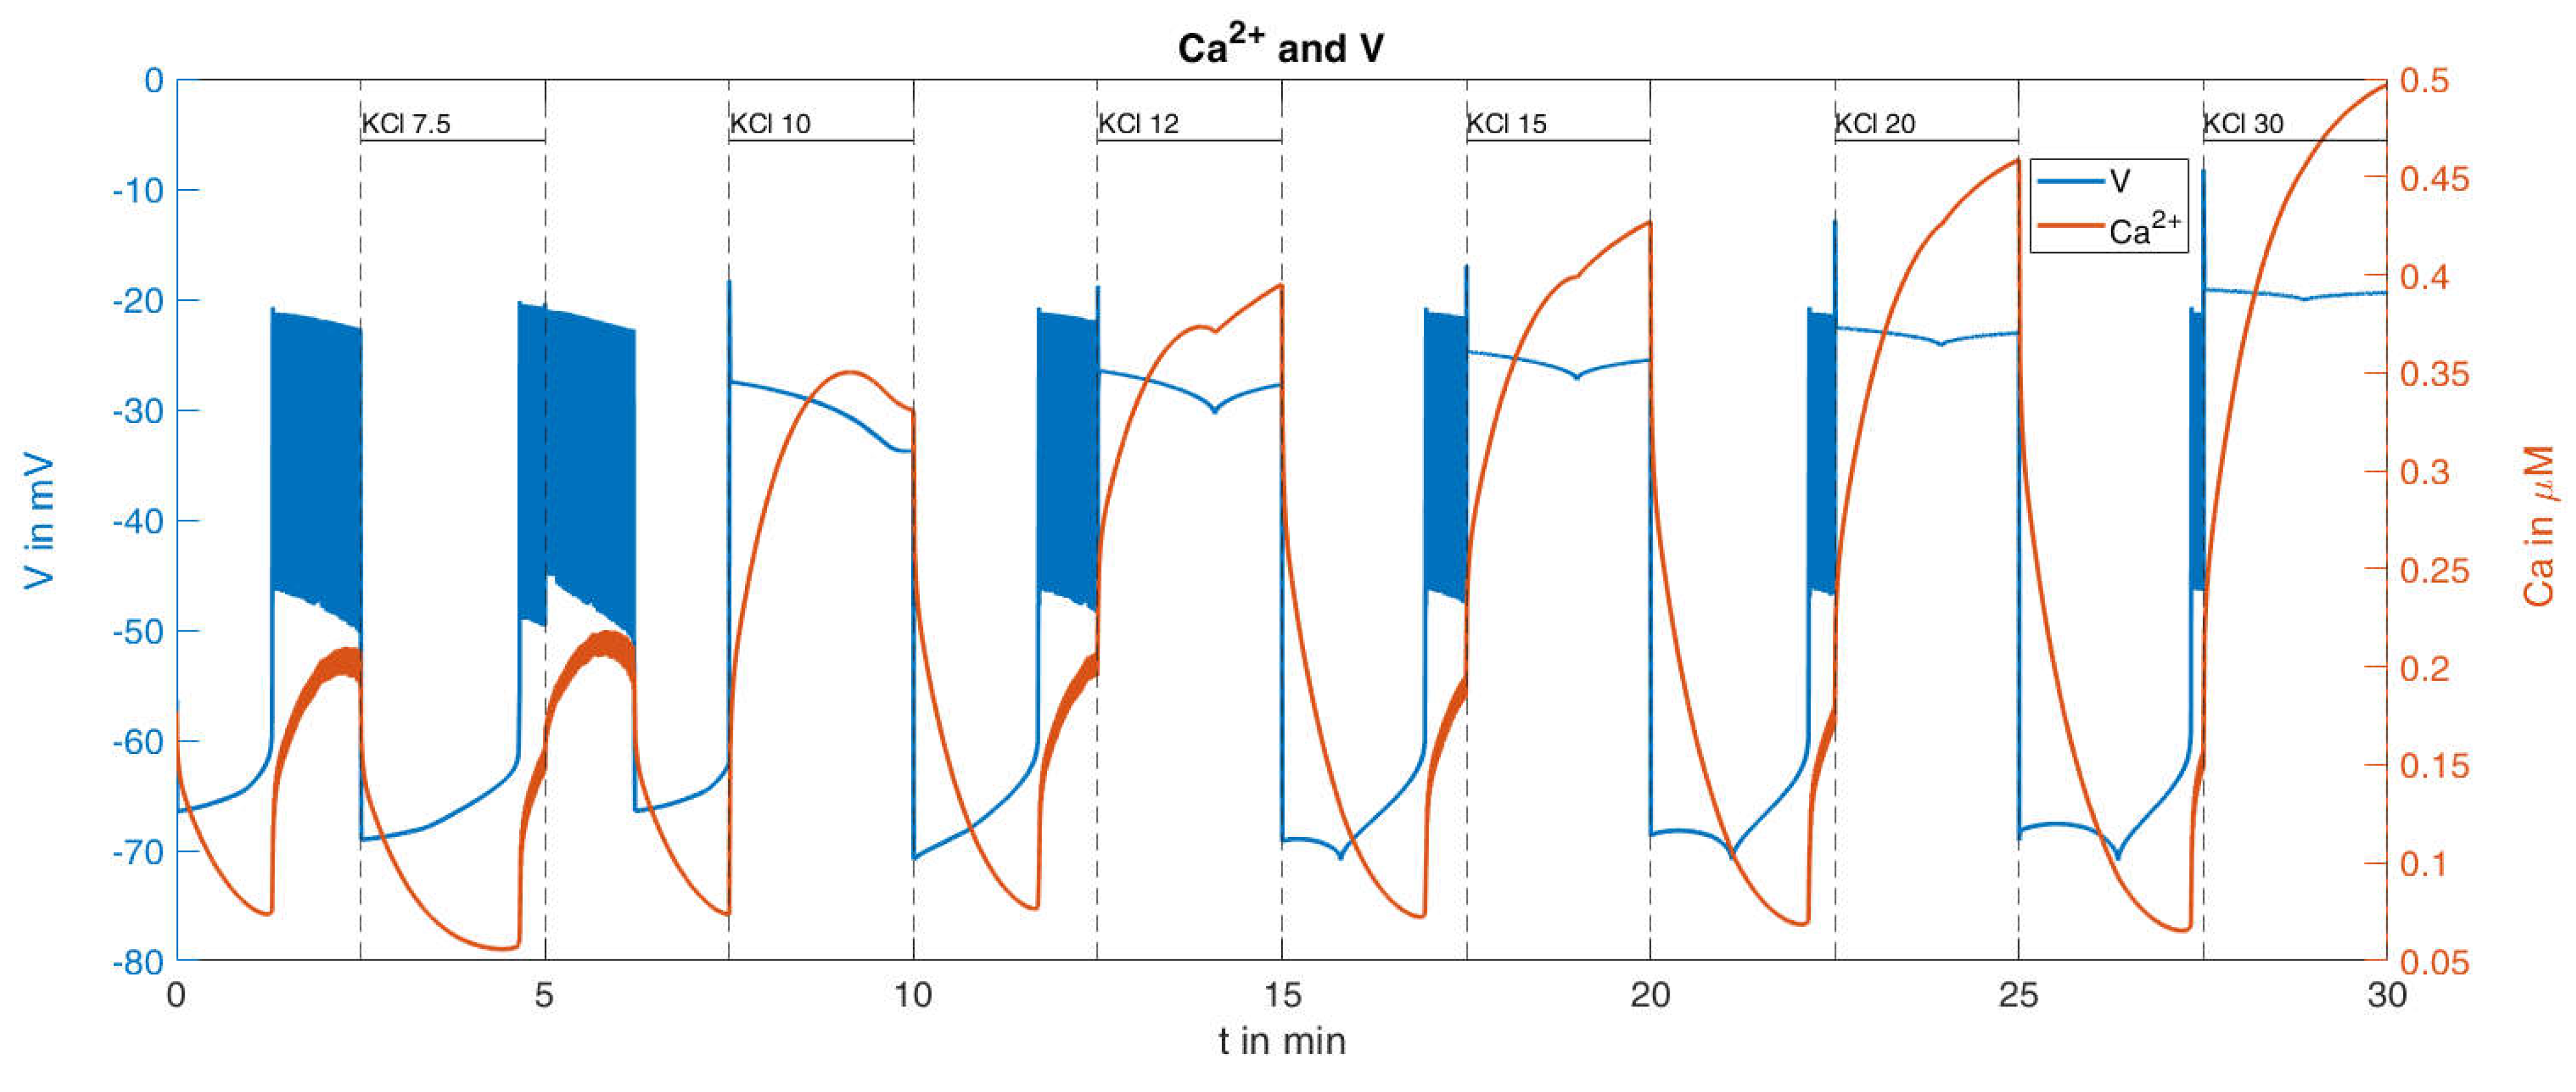
With this procedure and the parameters set from the reference [
36], the response of the cytosolic Ca
2+ concentration and of the plasma membrane potential was simulated (
Figure 9). With respect to the Ca
2+ values (orange curve in
Figure 9), certain similarities within the measurements can be seen, such as the increasing rise of the peaks for increasing K
+ concentrations; however, clear differences are also visible, such as the Ca
2+ increases at the low K
+ concentrations. In particular, the bursts of action potentials (blue curve in
Figure 9), occurring even before the K
+ concentration was raised, are a cause for concern. Since the potassium channels remain open during K
+ depolarization, no action potentials are generated by the beta cells [
46]. In the given example, the open state of the KATP channels, which make up the major part of the K
+ conductance, was ensured by the presence of diazoxide.
The consideration of this influence was not a major purpose of the reference model [
36] and was therefore not taken into account. In the model, the permeability of the KATP channels is essentially determined by the parameter
, compare
Table A2 in
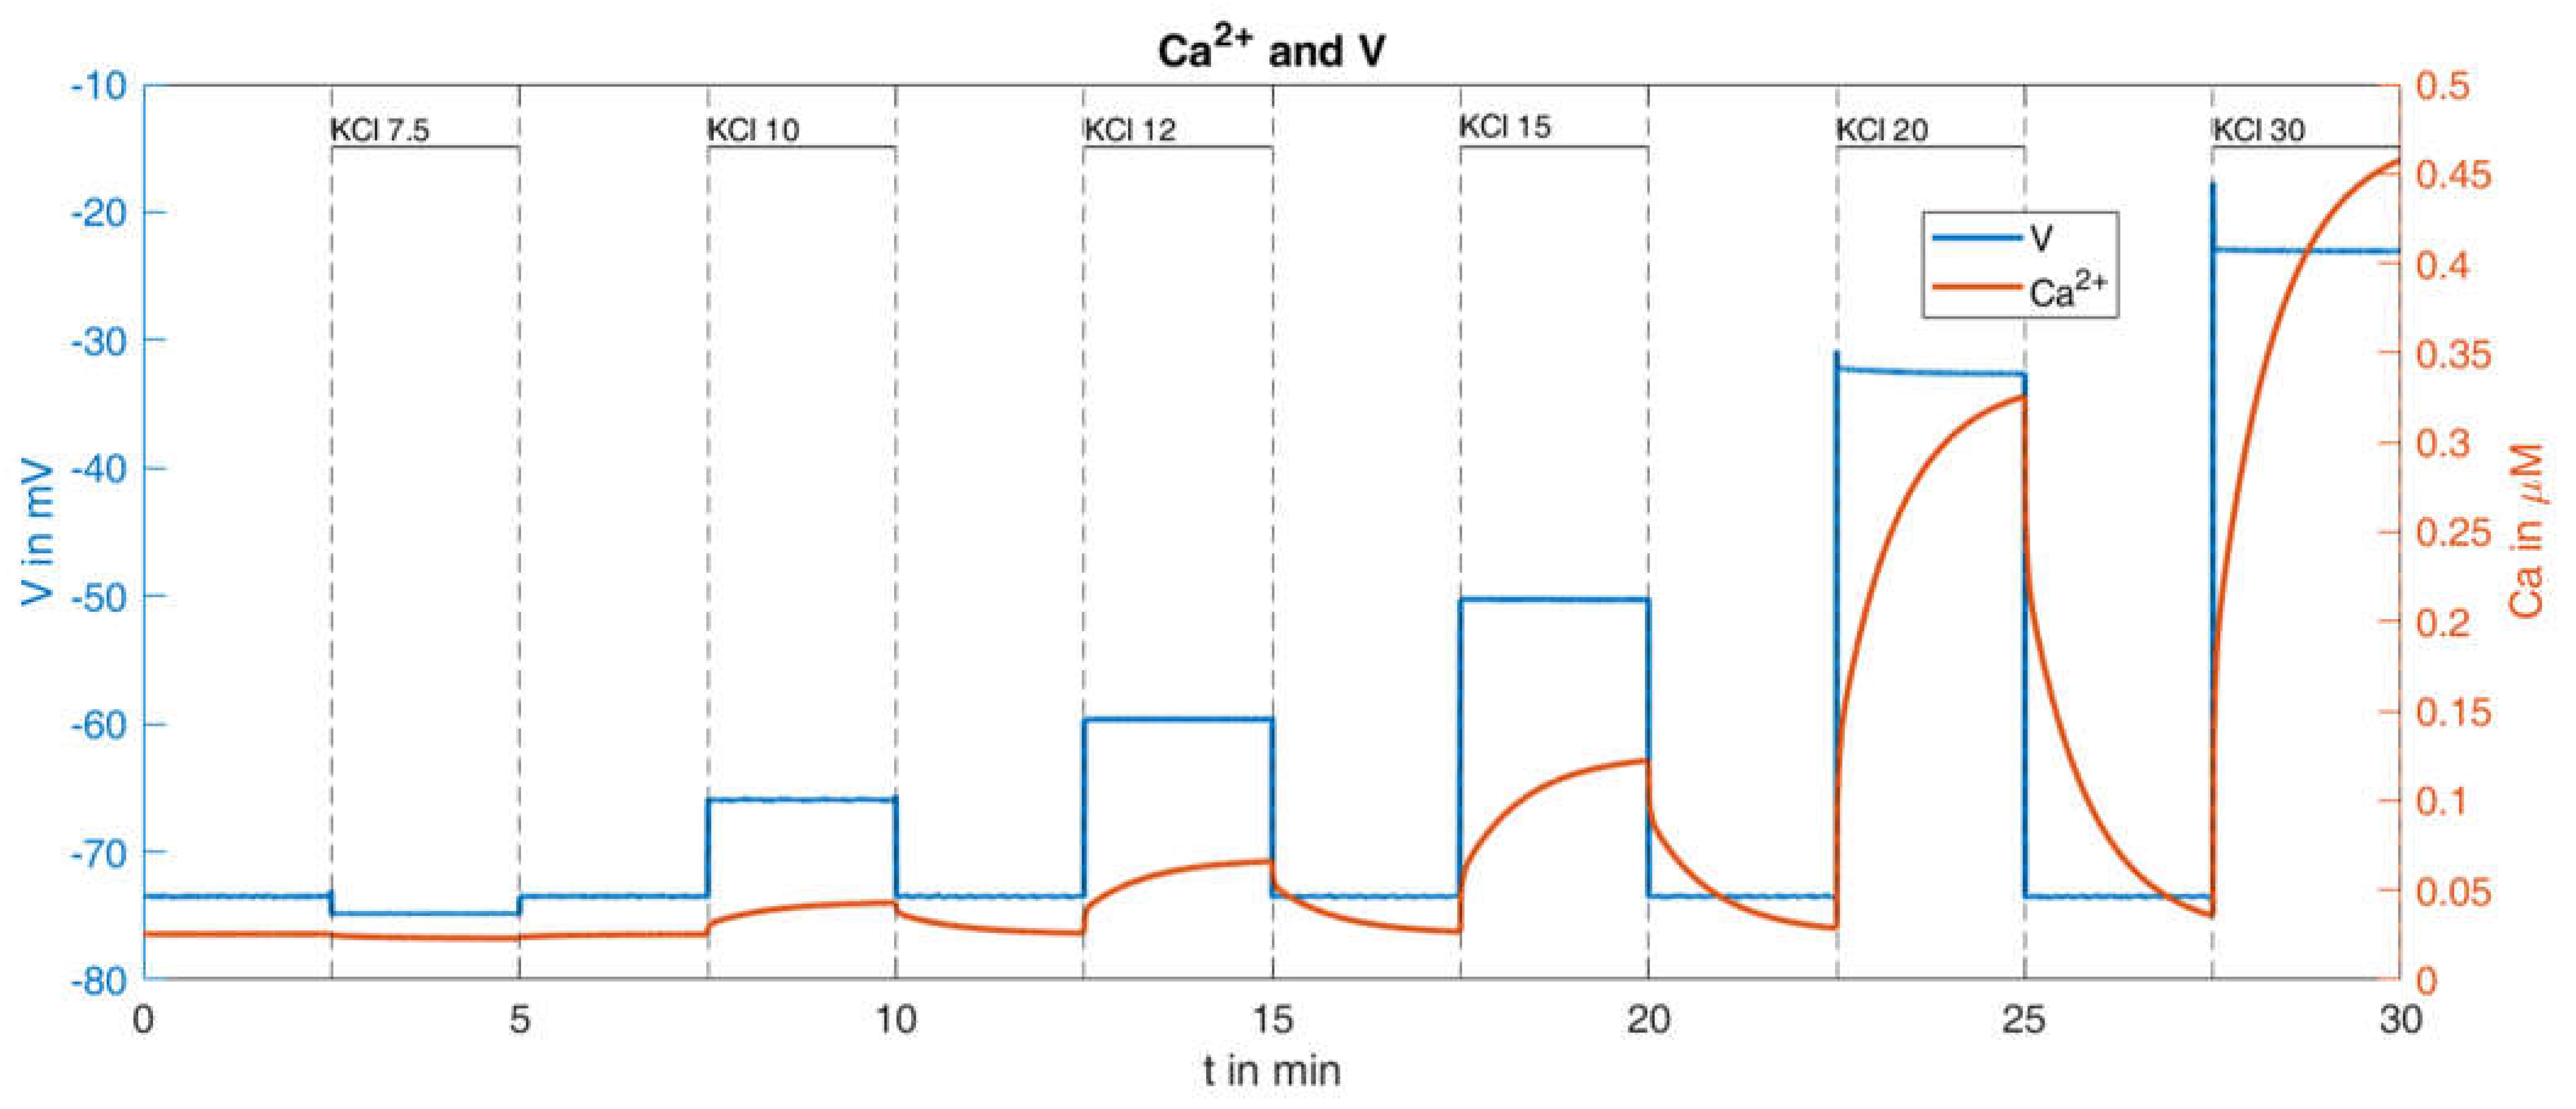
Appendix B. In the simulation described above, this value fluctuates slightly around a value of about 0.006. In order to adequately incorporate the influence of diazoxide, the parameter was subsequently set to the constant value of
, i.e., about five times as large as the reference value. This means that the KATP channels are significantly more permeable than in the calculated reference configuration. Keeping all other parameters unchanged, the curves shown in
Figure 10 are obtained.
This change of parameter results in the absence of action potentials, and the rise of the cytosolic Ca
2+ concentration shows greater similarity with the measurement. The quantitative comparison between the simulation results and the measurement is presented in
Table 2:
It turns out that this relatively small change in system parameters matches the simulation much better to the measured behavior than the original set of parameters.
The remaining difference between the simulated Ca
2+ response and the measured Ca
2+ response is largely caused by the lacking linear increase of the minimal values between the K
+ depolarizations. This was addressed by decreasing the terms describing the exchange of Ca
2+ between the ER and the cytosol and between the mitochondria and the cytosol (see Equation (A4) in
Table A1,
Appendix B). While a decrease to 50% resulted in a very modest increase, a decrease to 10% generated a clearly visible increase, see
Figure 11.
In conclusion, the model as such is very able to reproduce kinetic responses to a mechanistically simple stimulation with considerable robustness.
2.2.3. Effects of Pharmacological Block of KATP Channels by Tolbutamide
In contrast to the depolarization maneuver by high extracellular K
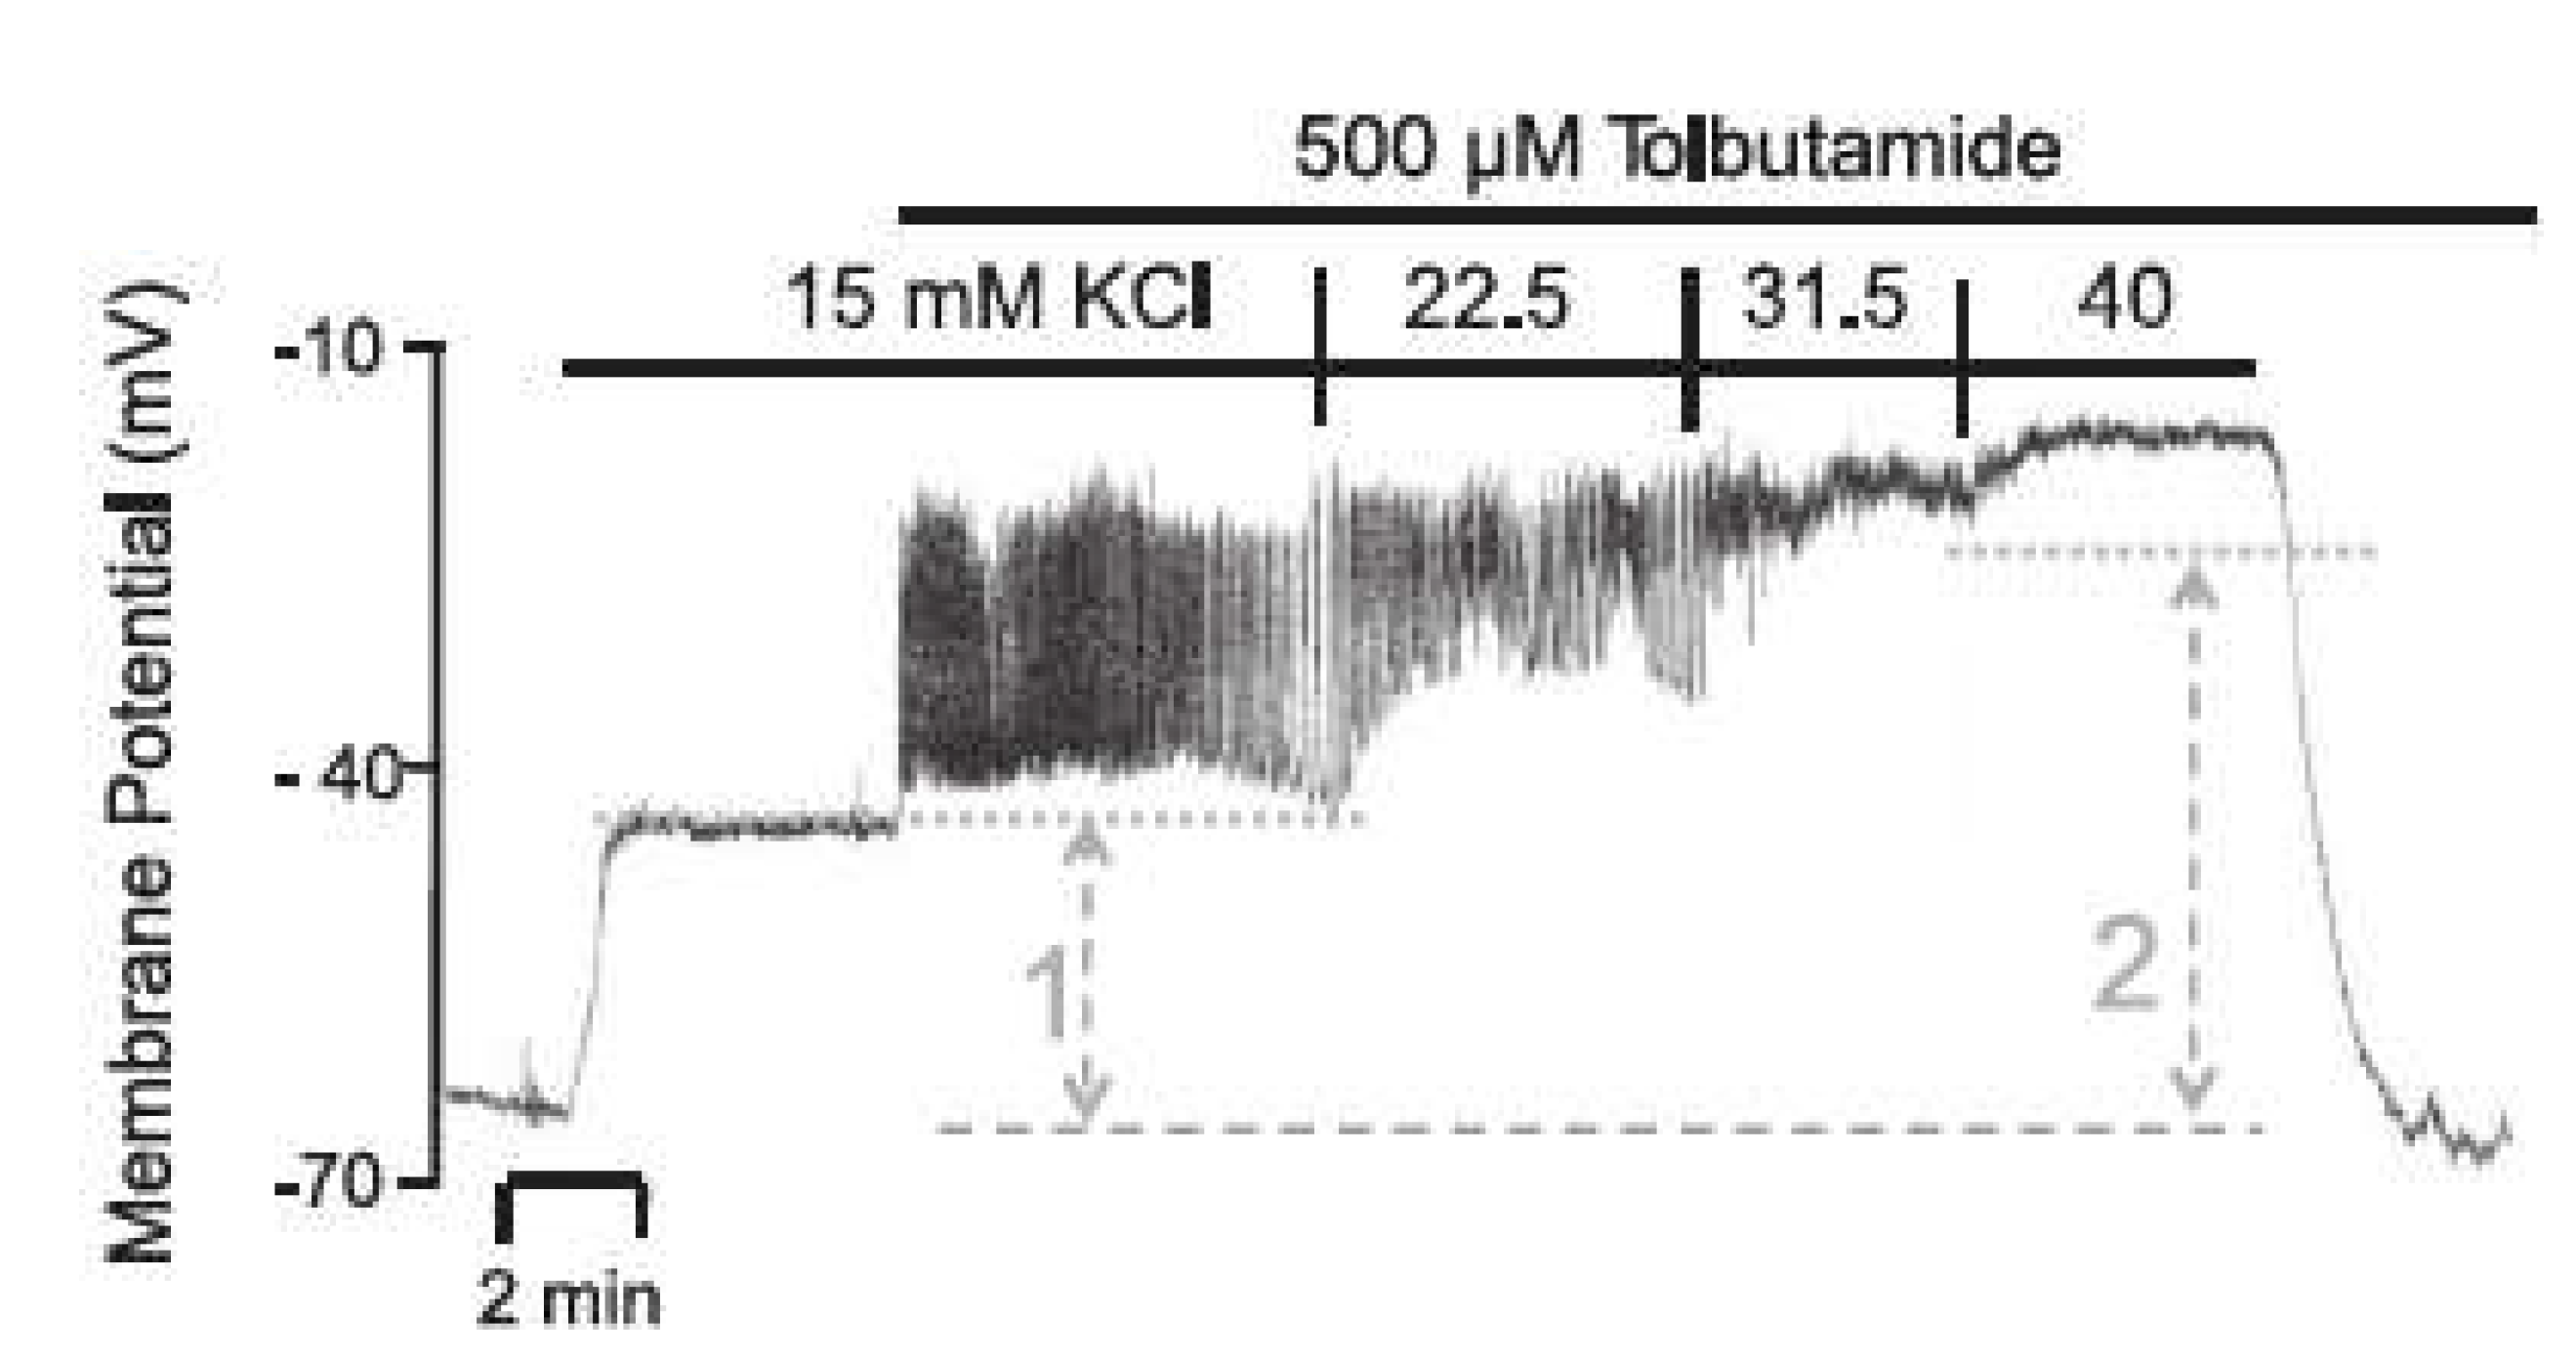
+ concentration, the block of KATP channels produces a depolarization of the beta cell with action potential spiking. A virtually complete closure of the channels can be achieved by 500 μM of the sulfonylurea, tolbutamide. Interestingly, the amplitude of the action potentials diminishes to virtual non-existence when the extracellular K
+ concentration is raised from 15 mM to 40 mM [
47], see
Figure 12.
The addition of 15 mM KCl leads to a moderate depolarization of the membrane potential (comparable to the behavior in
Section 2.2.2). Only after the addition of tolbutamide and the resulting blockade of the KATP channels does a rapid depolarization of the membrane potential occur, as the depolarizing Ca
2+ influx can no longer be balanced by a repolarizing K
+ efflux. The additional depolarization opens the potassium channels through which the current
now leads to potassium efflux, which decreases the membrane potential before Ca
2+ influx again predominates and the membrane potential rises again. With the subsequent increase in the extracellular K
+ concentration, the K
+ equilibrium potential
is increased, whereby all repolarizing K
+ currents are diminished, inhibiting the generation of action potentials.
The simulation accounts for the addition of tolbutamide in the way that, according to Hill’s equation, the parameter
is modified, which considers the permeability of the ATP-dependent potassium channels. Specifically, in this model extension, the tolbutamide concentration
determines the tolbutamide-dependent permeability according to Equation (3):
with the half-effect concentration of
[
48] and the HILL exponent
, it can be obtained for the case
, which corresponds to a very low residual permeability.
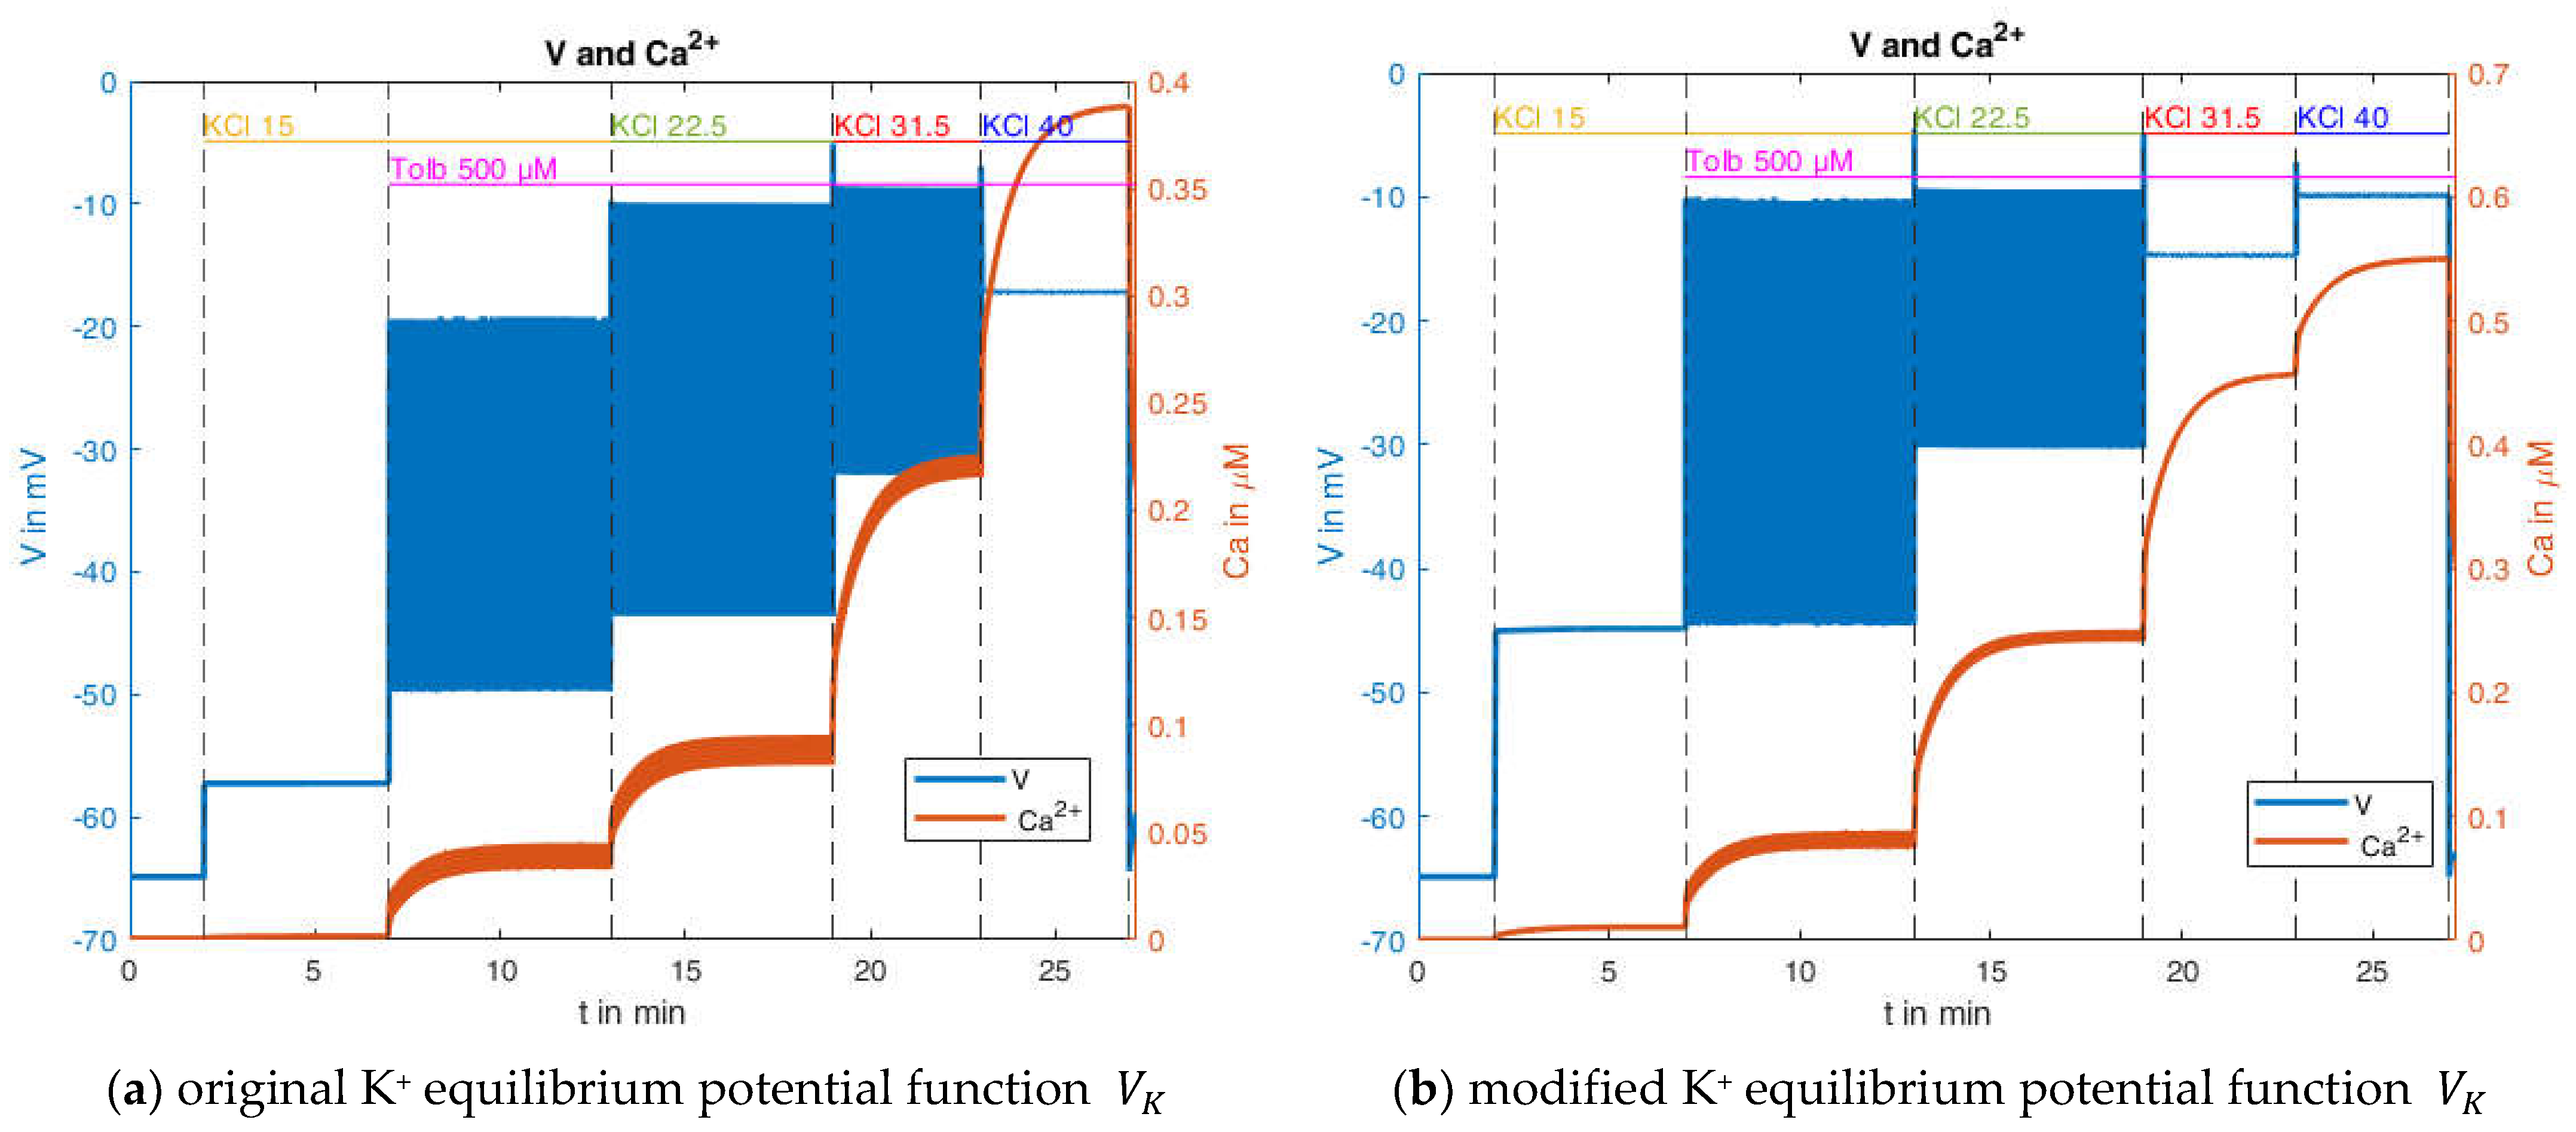
With the slight modification of
and
(without these there would be no bursts) the behavior depicted in
Figure 13a can be generated. It bears considerable resemblance to the experimental measurement shown in
Figure 12. There are no bursts in the presence of 15 mM KCl, but the membrane potential is already elevated; however, the value of about −57 mV is still significantly below that of the measurement. With the addition of tolbutamide, the action potentials become visible. With a further increase of the KCl concentration to 22.5 mM, the mean membrane potential continues to rise, but the amplitude of the action potentials increases too, which does not conform with the measurement. With the increase to 30 mM KCl, the mean membrane potential continues to increase, but the amplitude of the oscillation decreases, which is closer to the characteristic of the measurement. Finally, at 40 mM KCl, the bursting ends, as in the measurement.
For these calculations, the equilibrium potentials according to Equation (2) have been used, which exclusively considers potassium ions. While the potassium conductance is by far dominating at the resting state, other conductances through voltage-dependent channels play a role during prolonged depolarization. To account for this influence phenomenologically and to get first ideas on this effect, another simulation was performed, wherein the potential calculated according to Equation (2) was artificially increased by 10 mV. The curves resulting from this modification are shown in
Figure 13b. The simulated membrane potential curve now closely resembles the one in the measurement. The membrane potential before the addition of tolbutamide is −45 mV, and the mean membrane potential during action potential spiking agrees better with the measurement. Furthermore, the marked decrease in action potential amplitude is now also evident when the K
+ concentration is increased from 15 mM to 22.5 mM.
2.3. Influence of the Measurement Itself
As mentioned in
Section 1.3, the cytosolic Ca
2+ concentration is usually measured by fluorescent indicators, whereas the plasma membrane potential is best measured by electrophysiological techniques. Thus, it is possible to combine the measurement of the membrane potential with the microfluorimetric measurement of the cytosolic Ca
2+ concentration. Due to the fact that the occurring voltages and currents are very small, there are high demands on the measurement system itself, especially to exclude a feedback effect of the measurement on the system behavior.
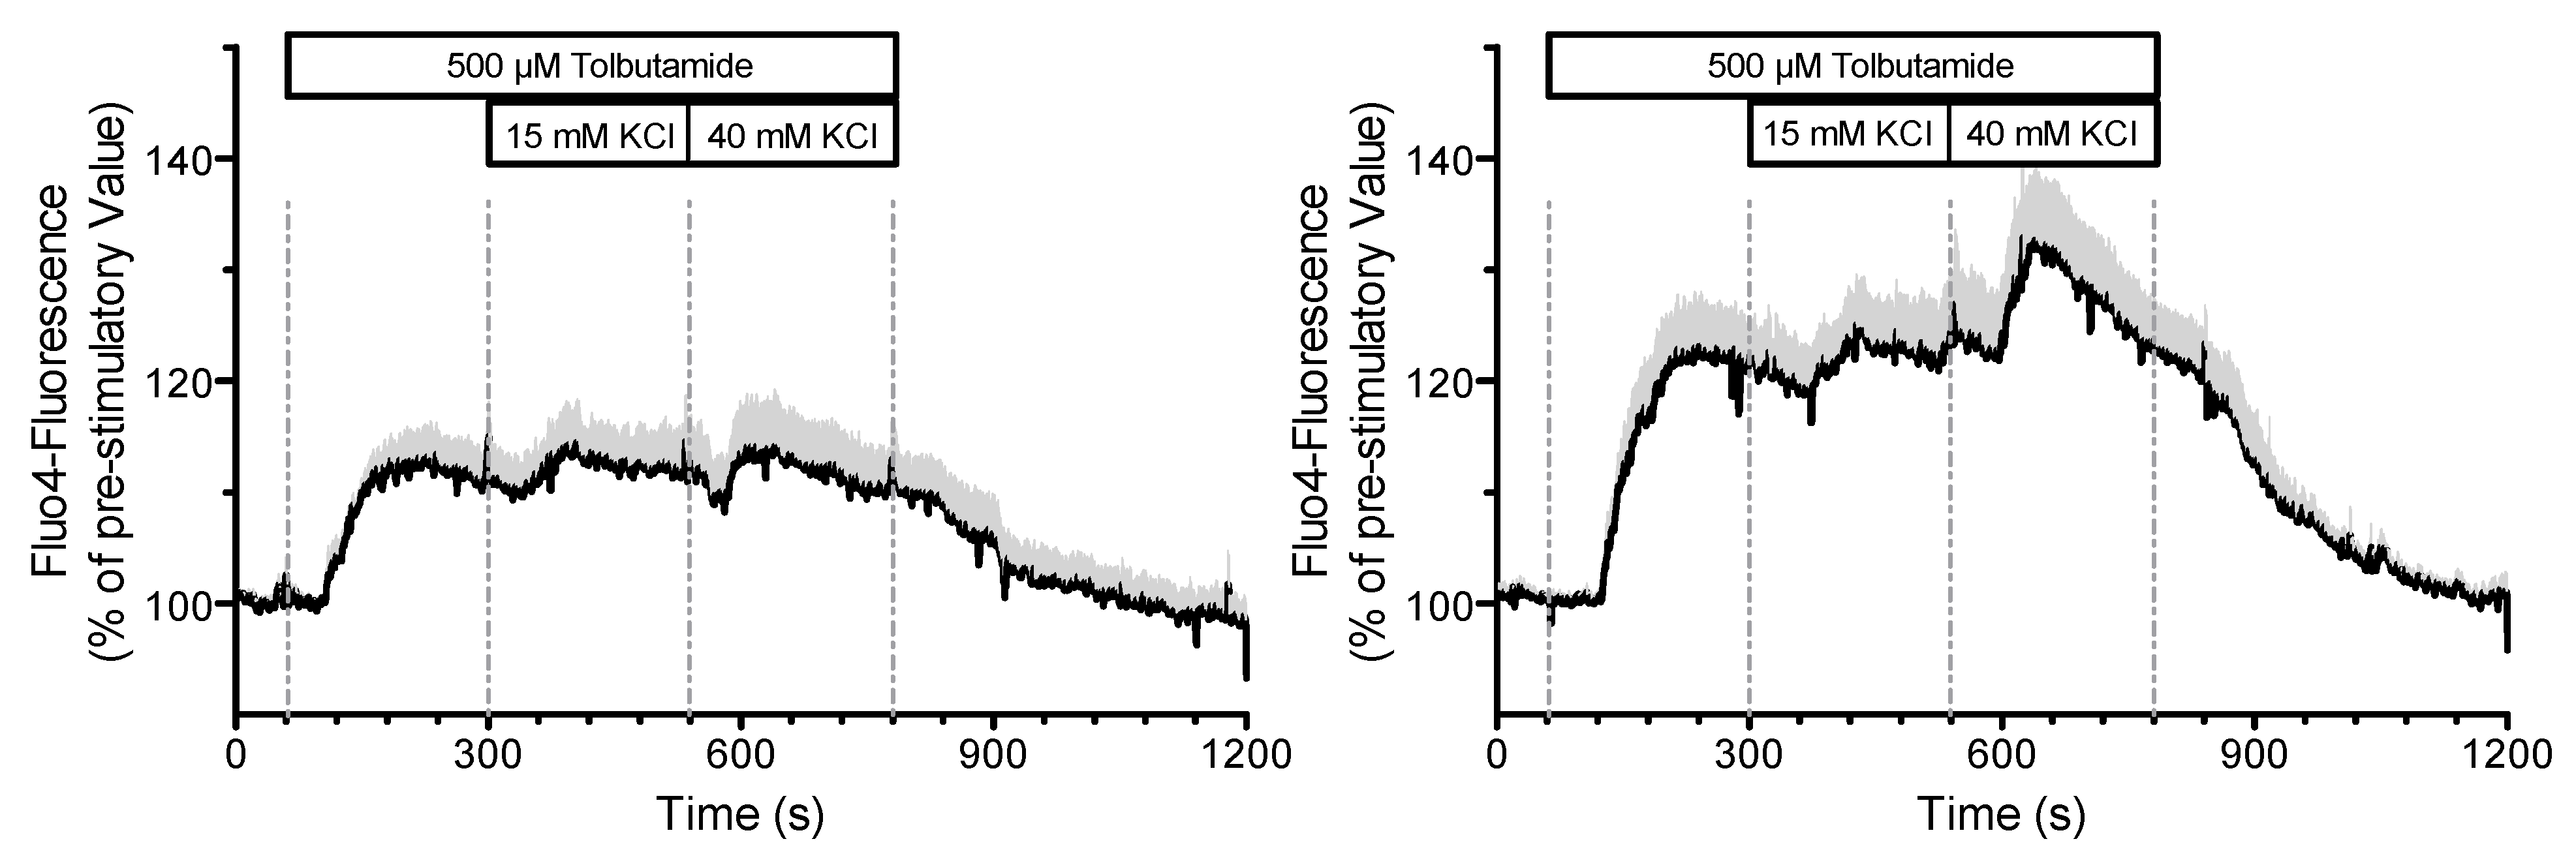
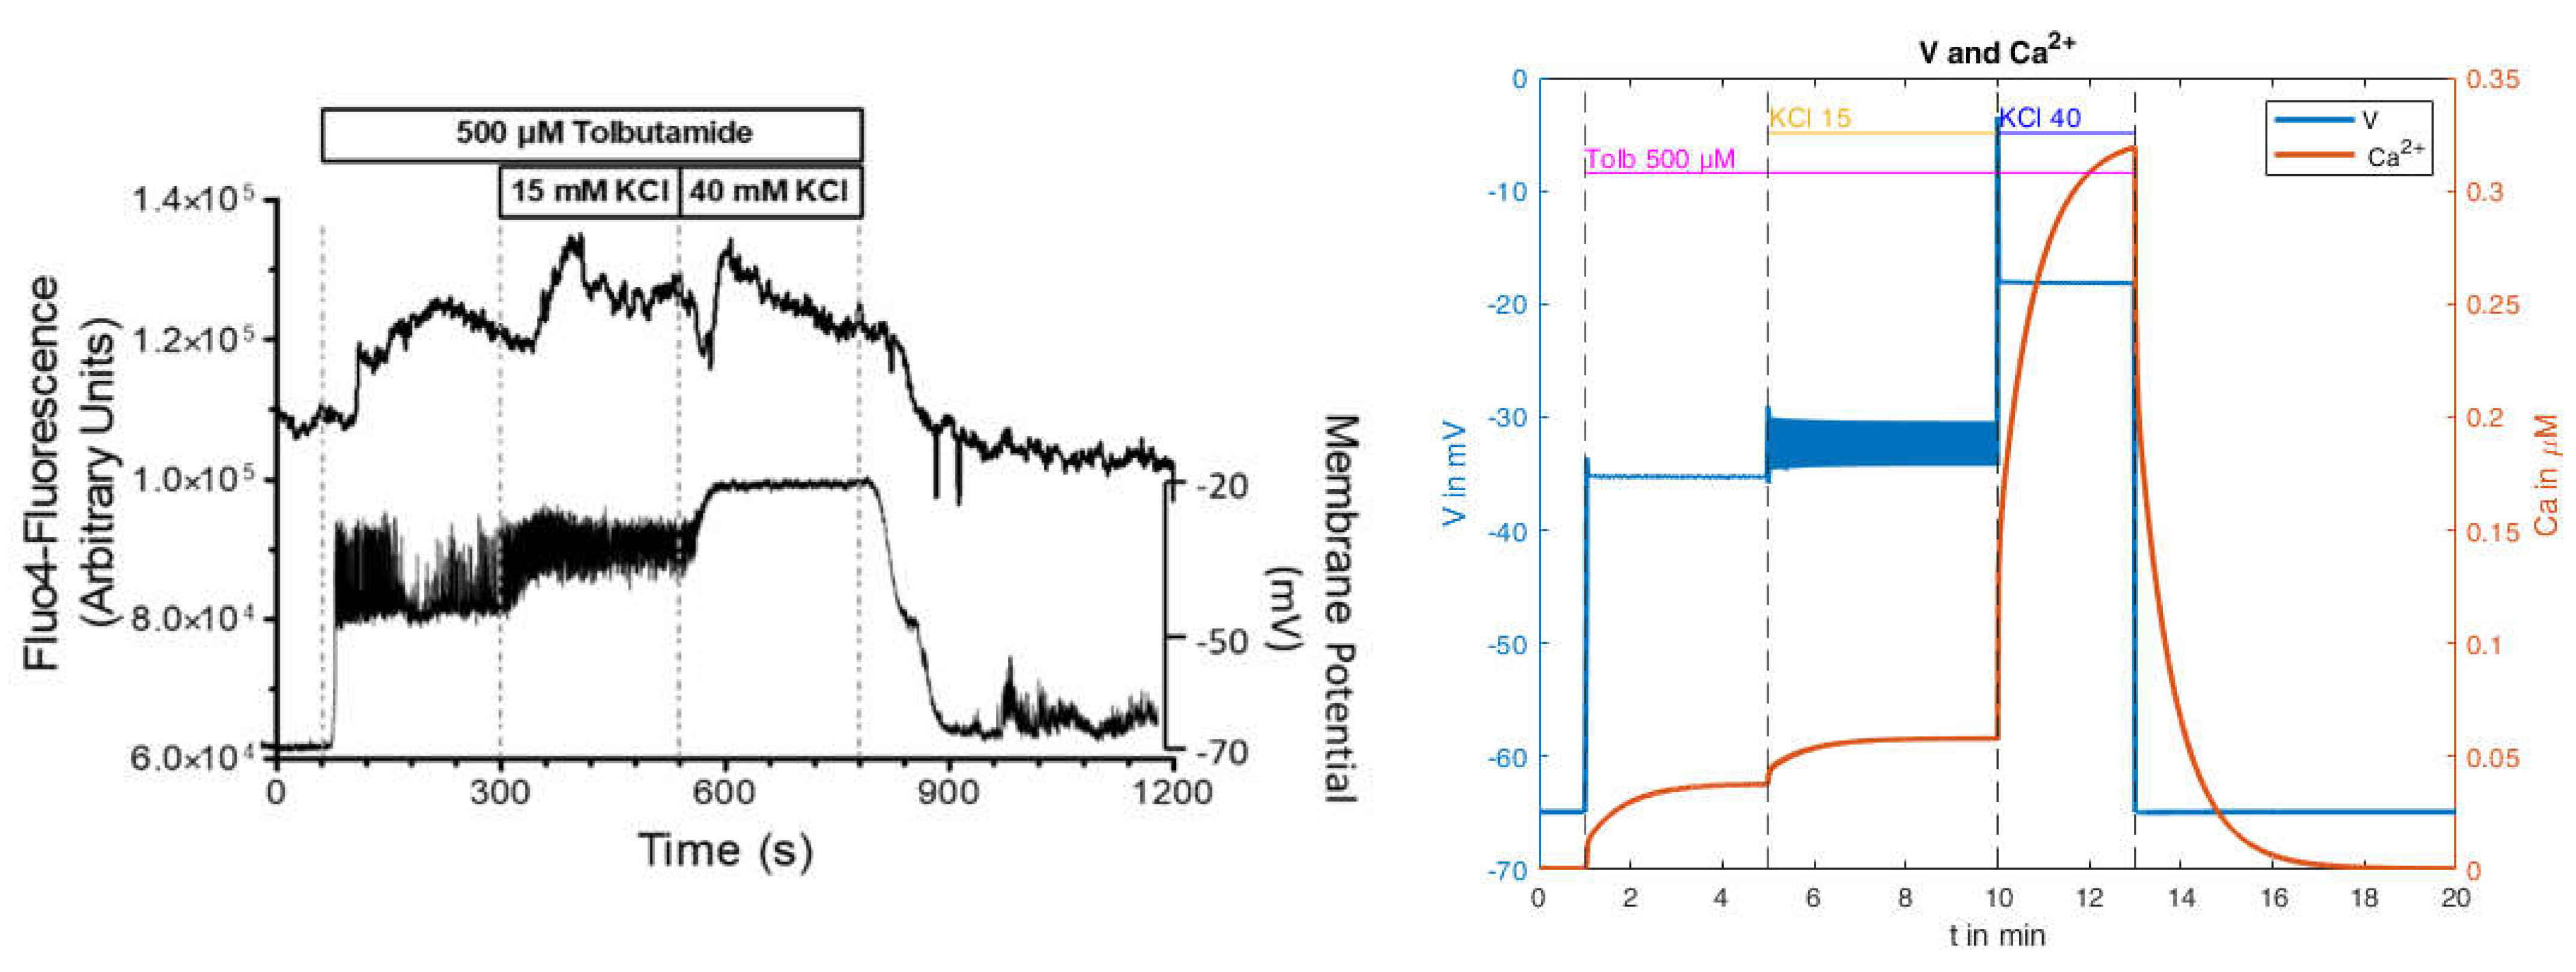
An indication that there may be a feedback effect of the measurement on the system is shown in
Figure 14. In this experiment, the K
+ concentration was increased stepwise in the presence of tolbutamide, first to 15 mM, then to 40 mM. In the left panel, the plasma membrane potential was simultaneously measured by current clamping in the “perforated patch” configuration. In the right panel, the same configuration was generated, but no current clamp was applied.
It is obvious that the Fluo 4-fluorescence and thus the cytosolic Ca2+ concentration is significantly smaller with the simultaneous measurement of the membrane potential than that without. If the measurements are feedback free, there should be no difference between the measurements.
In the following, we attempt to derive an explanation for this effect, based on the model presented. For this purpose, a single measurement from the mean values in the left panel of
Figure 14 will be used first (
Figure 15, left panel).
The calculated curves for this experiment as obtained with the parameters from
Table A3 (in
Appendix B) are shown in
Figure 15 on the right. The depolarization pattern is approximately well matched, and the voltage is in the correct range. However, no action potentials are generated by the addition of tolbutamide, whereas the transition from 15 mM to 40 mM KCl abolishes the preexistent action potentials, conforming with the measurements. For the cytosolic Ca
2+ concentration, a moderate increase comparable to the measurement occurs with both the addition of tolbutamide and the subsequent KCl addition. In contrast to the measurement, however, the brief Ca
2+ decrease after the addition of 40 mM KCl is missing, and the subsequent increase is much stronger in the model than in the measurement. This is still true when taking into consideration that the simulation gives cytosolic Ca
2+ values, whereas the measurement shows that Fluo-4 fluorescence under-reports large increases due to its highly non-linear correlation. To illustrate this point, it is remarkable that the peak value of the Fluo-4 fluorescence in the presence of 15 mM KCl is virtually the same as the one in the presence of 40 mM KCl. Of note, in the control experiments, the peak value at 40 mM KCl was significantly higher than the one at 15 mM KCl (
Figure 15, left panel).
Thus, the simulation can reproduce the features of this experiment in a first approximation. So, it was interesting to test whether it could be used to investigate the possible reasons as to why the current clamp mode affects simultaneously measured cytosolic Ca2+ concentrations.
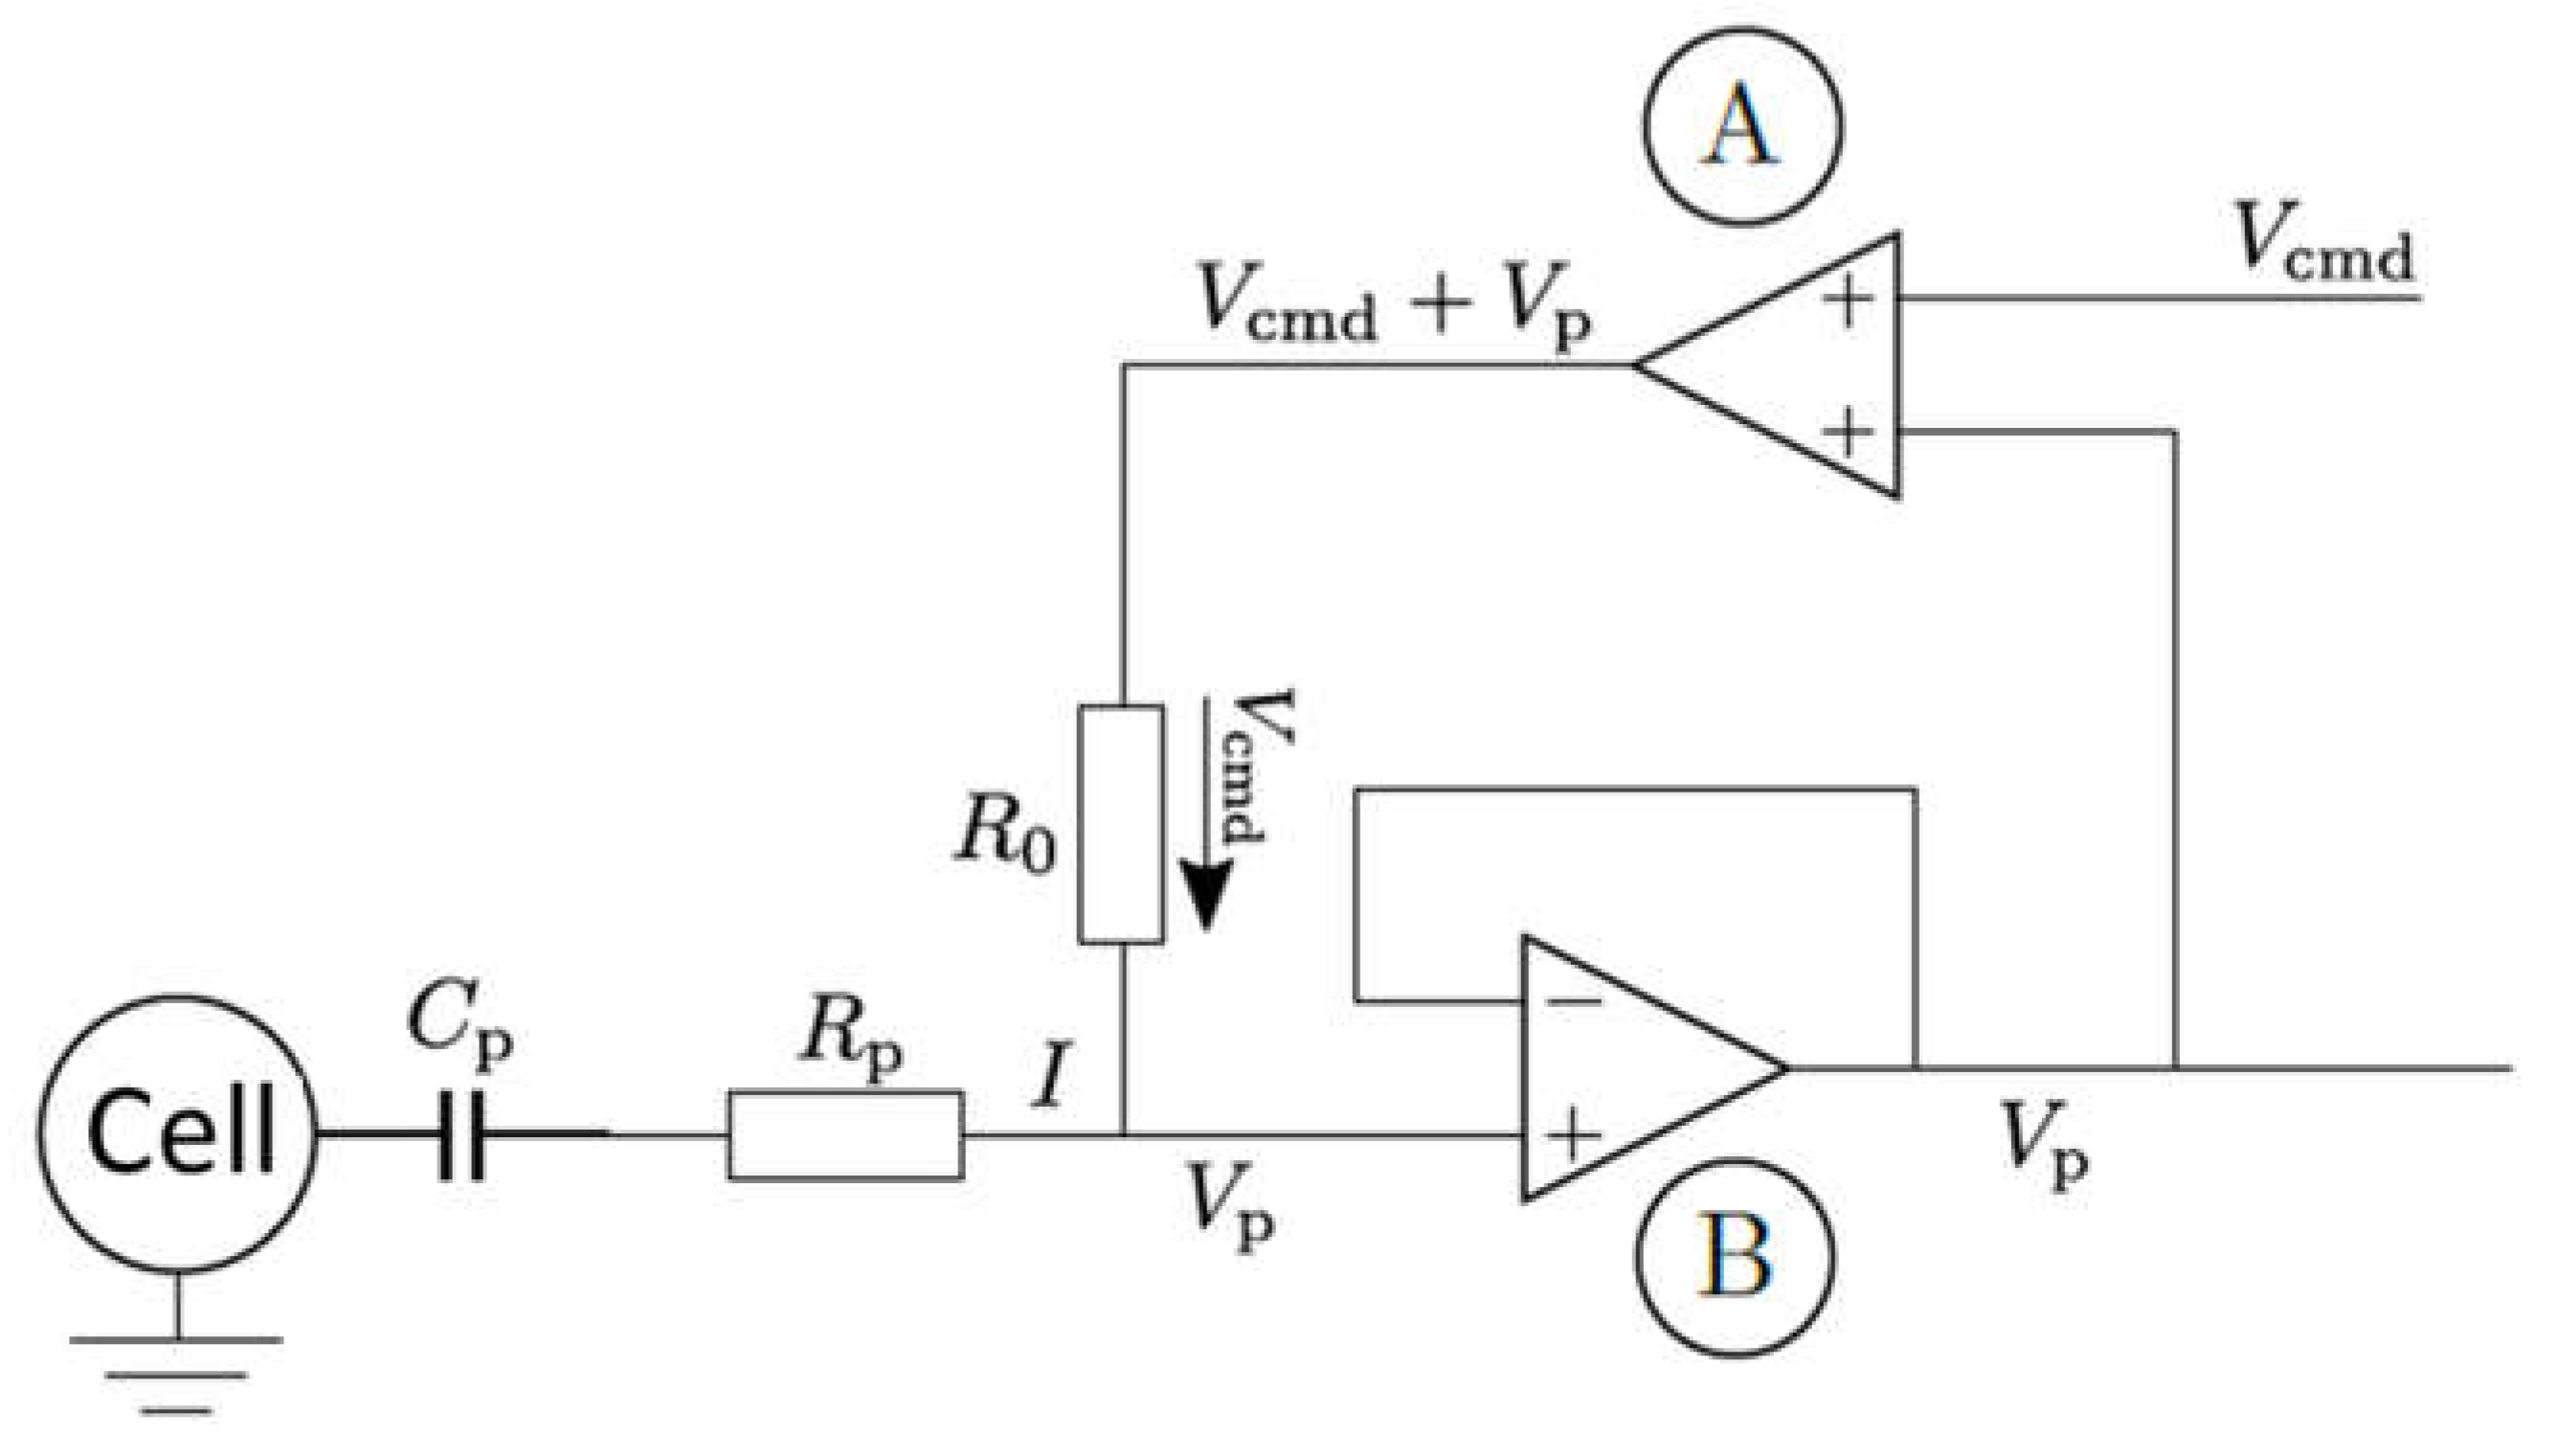
In order to understand the possible mechanisms, detailed information about the electrical circuit of the measuring apparatus is necessary. A principle schematic is shown in
Figure 16 [
49]. In addition to the operational amplifiers and impedance converters, which provide the voltages that cause the specified current, the main electrical components are the resistance of the pipette and its capacitance. For the simulation, both the resistance and the capacitance of the pipette are to be understood as a series connection to the resistance and the capacitance of the cell membrane (compare
Figure A1). Resistances connected in series are added. The resistance of the pipette is much smaller than the resistance of the cell membrane, and can therefore be neglected.
The situation is rather different with the capacitances. The capacitance of the pipette
is in the range of 1–5 pF [
49] and is thus in the order of magnitude of the capacitance of the cell (5.3 pF was assumed in the model, see
Appendix B). A series connection of two capacitances is made by adding the reciprocal values.
The effective capacity is therefore
Depending on whether one now assumes the minimum, maximum, or an average value of 3 pF for the pipette capacitance, this results in , and .
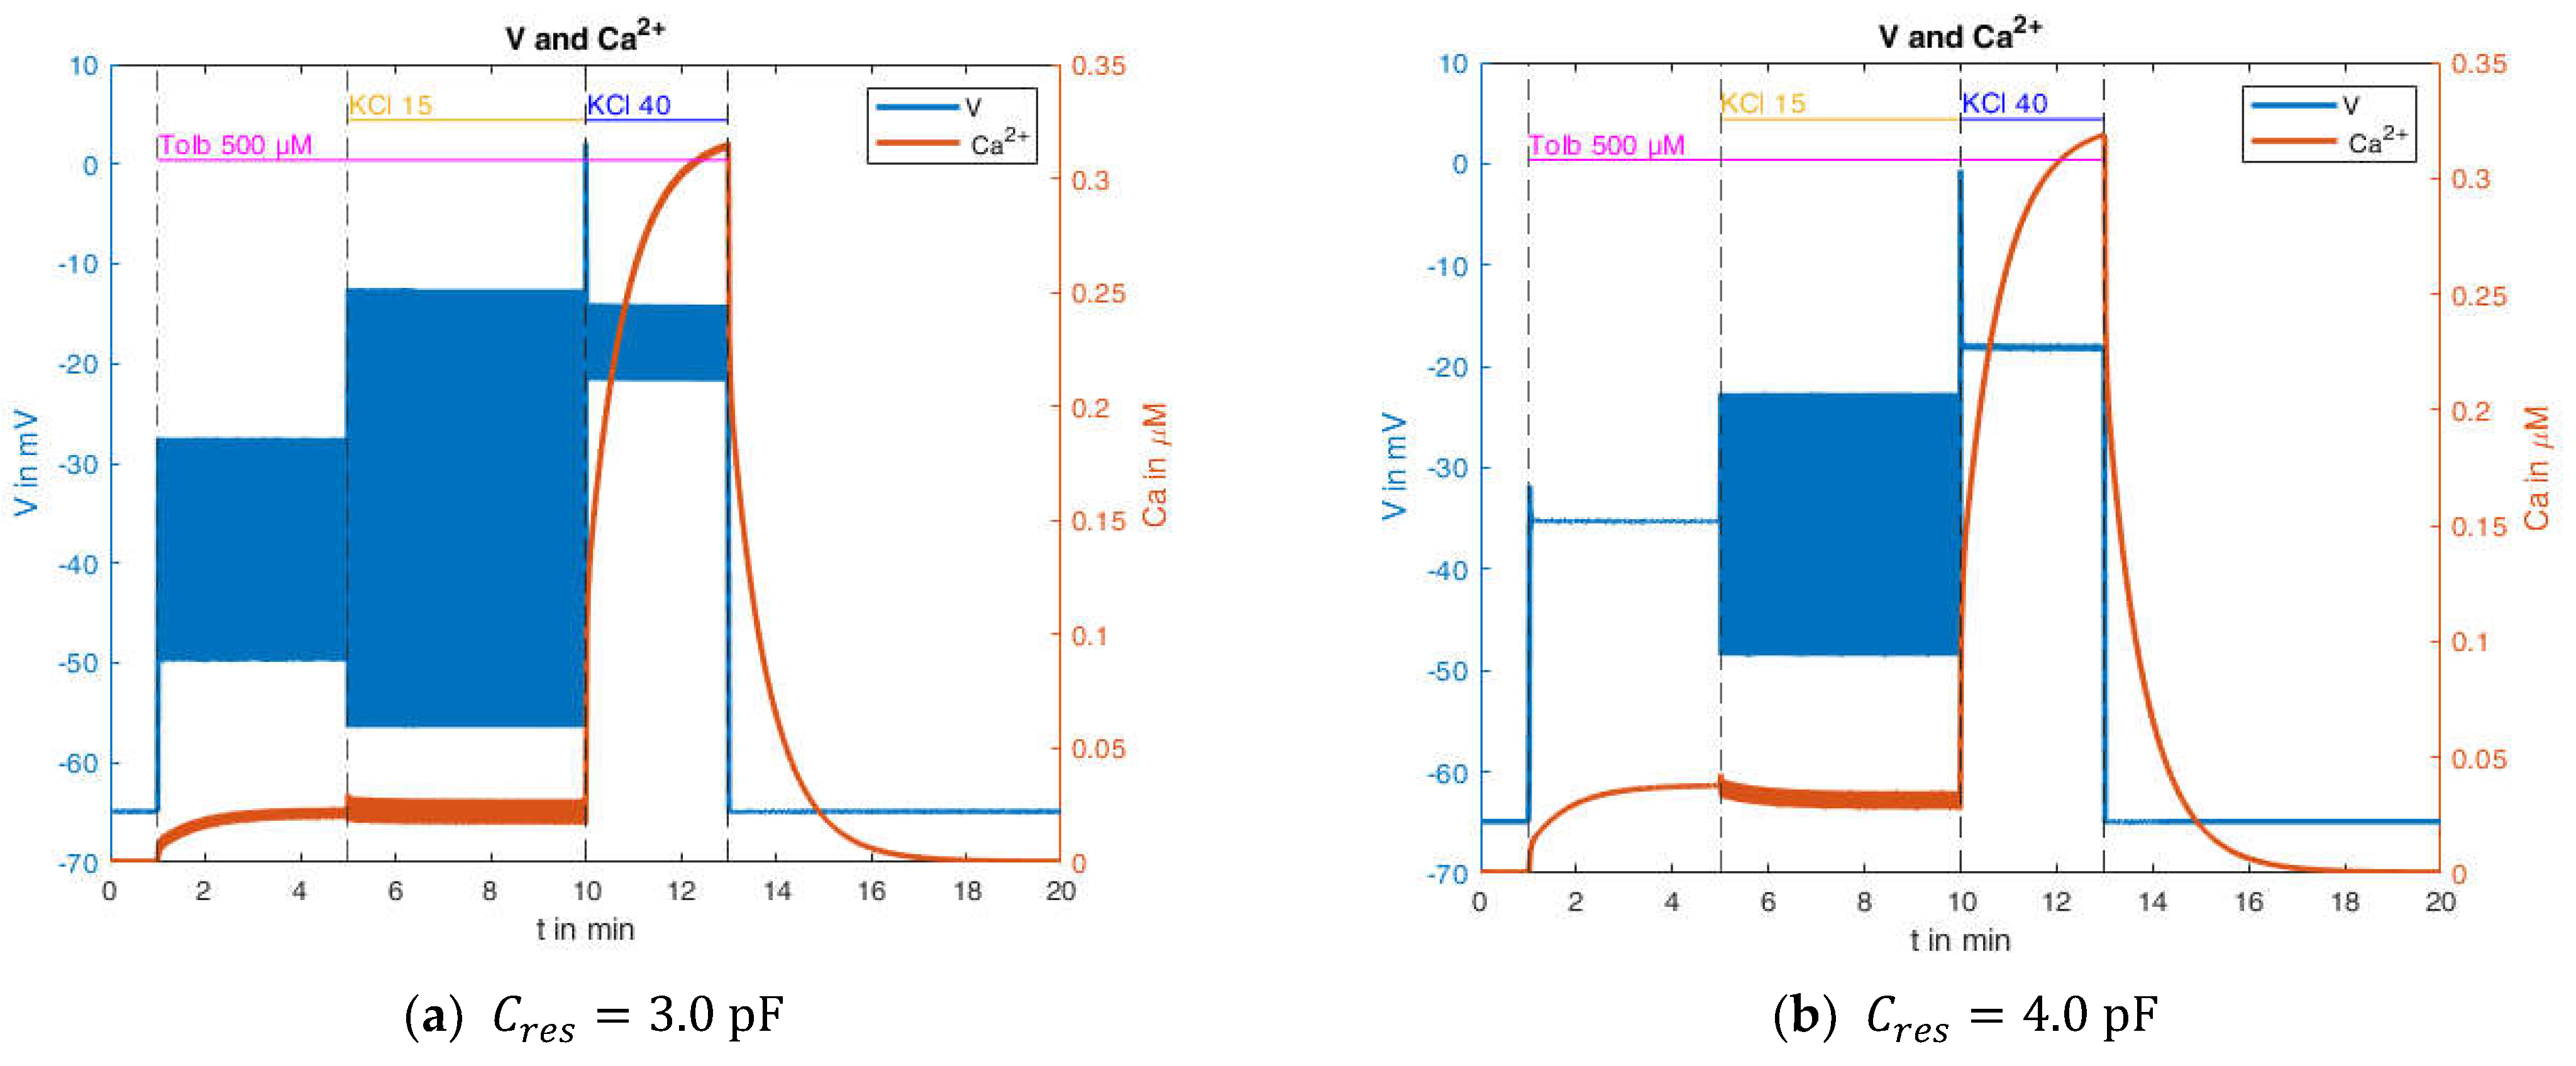
In any case, the resulting capacitance is significantly below the membrane capacitance. In order to investigate this influence, tests were subsequently carried out on the influence of the “true” capacitance (see Equation (4)). The model showed instabilities at very small capacitances, which is why moderate changes in capacitance are considered below. In this context, the original value of 5.3 pF was set to the values 3.0 pF and 4.0 pF, respectively. The corresponding results are shown in
Figure 17.
Comparing these curves with the simulation resulting from the use of the original capacitance value (
Figure 15, right) reveals clear differences. The reduction of the capacitance results in a higher propensity of the system to produce action potentials, and at the same time, in a diminished increase of the cytosolic Ca
2+ concentration. When no action potentials or action potentials with a small amplitude are present, the Ca
2+ concentration approaches the same steady-state value as in the original simulations. This is also the reason that the response of the Ca
2+ concentration to the transition from 15 mM to 40 mM KCl is nearly unchanged.
In conclusion, the measurement of the plasma membrane potential by current clamping appears to affect the simultaneous measurement of the cytosolic Ca
2+ concentration because of the reduced effective capacitance of the system. This effect is the likely explanation for the observations depicted in
Figure 14. Bearing this in mind, a suitable model should be able to subsequently calculate the effect of the measurement and to compensate for the feedback effect of the measurement system.


