
Cholesterol-Lowering Activity of Vitisin A Is Mediated by Inhibiting Cholesterol Biosynthesis and Enhancing LDL Uptake in HepG2 Cells

Abstract
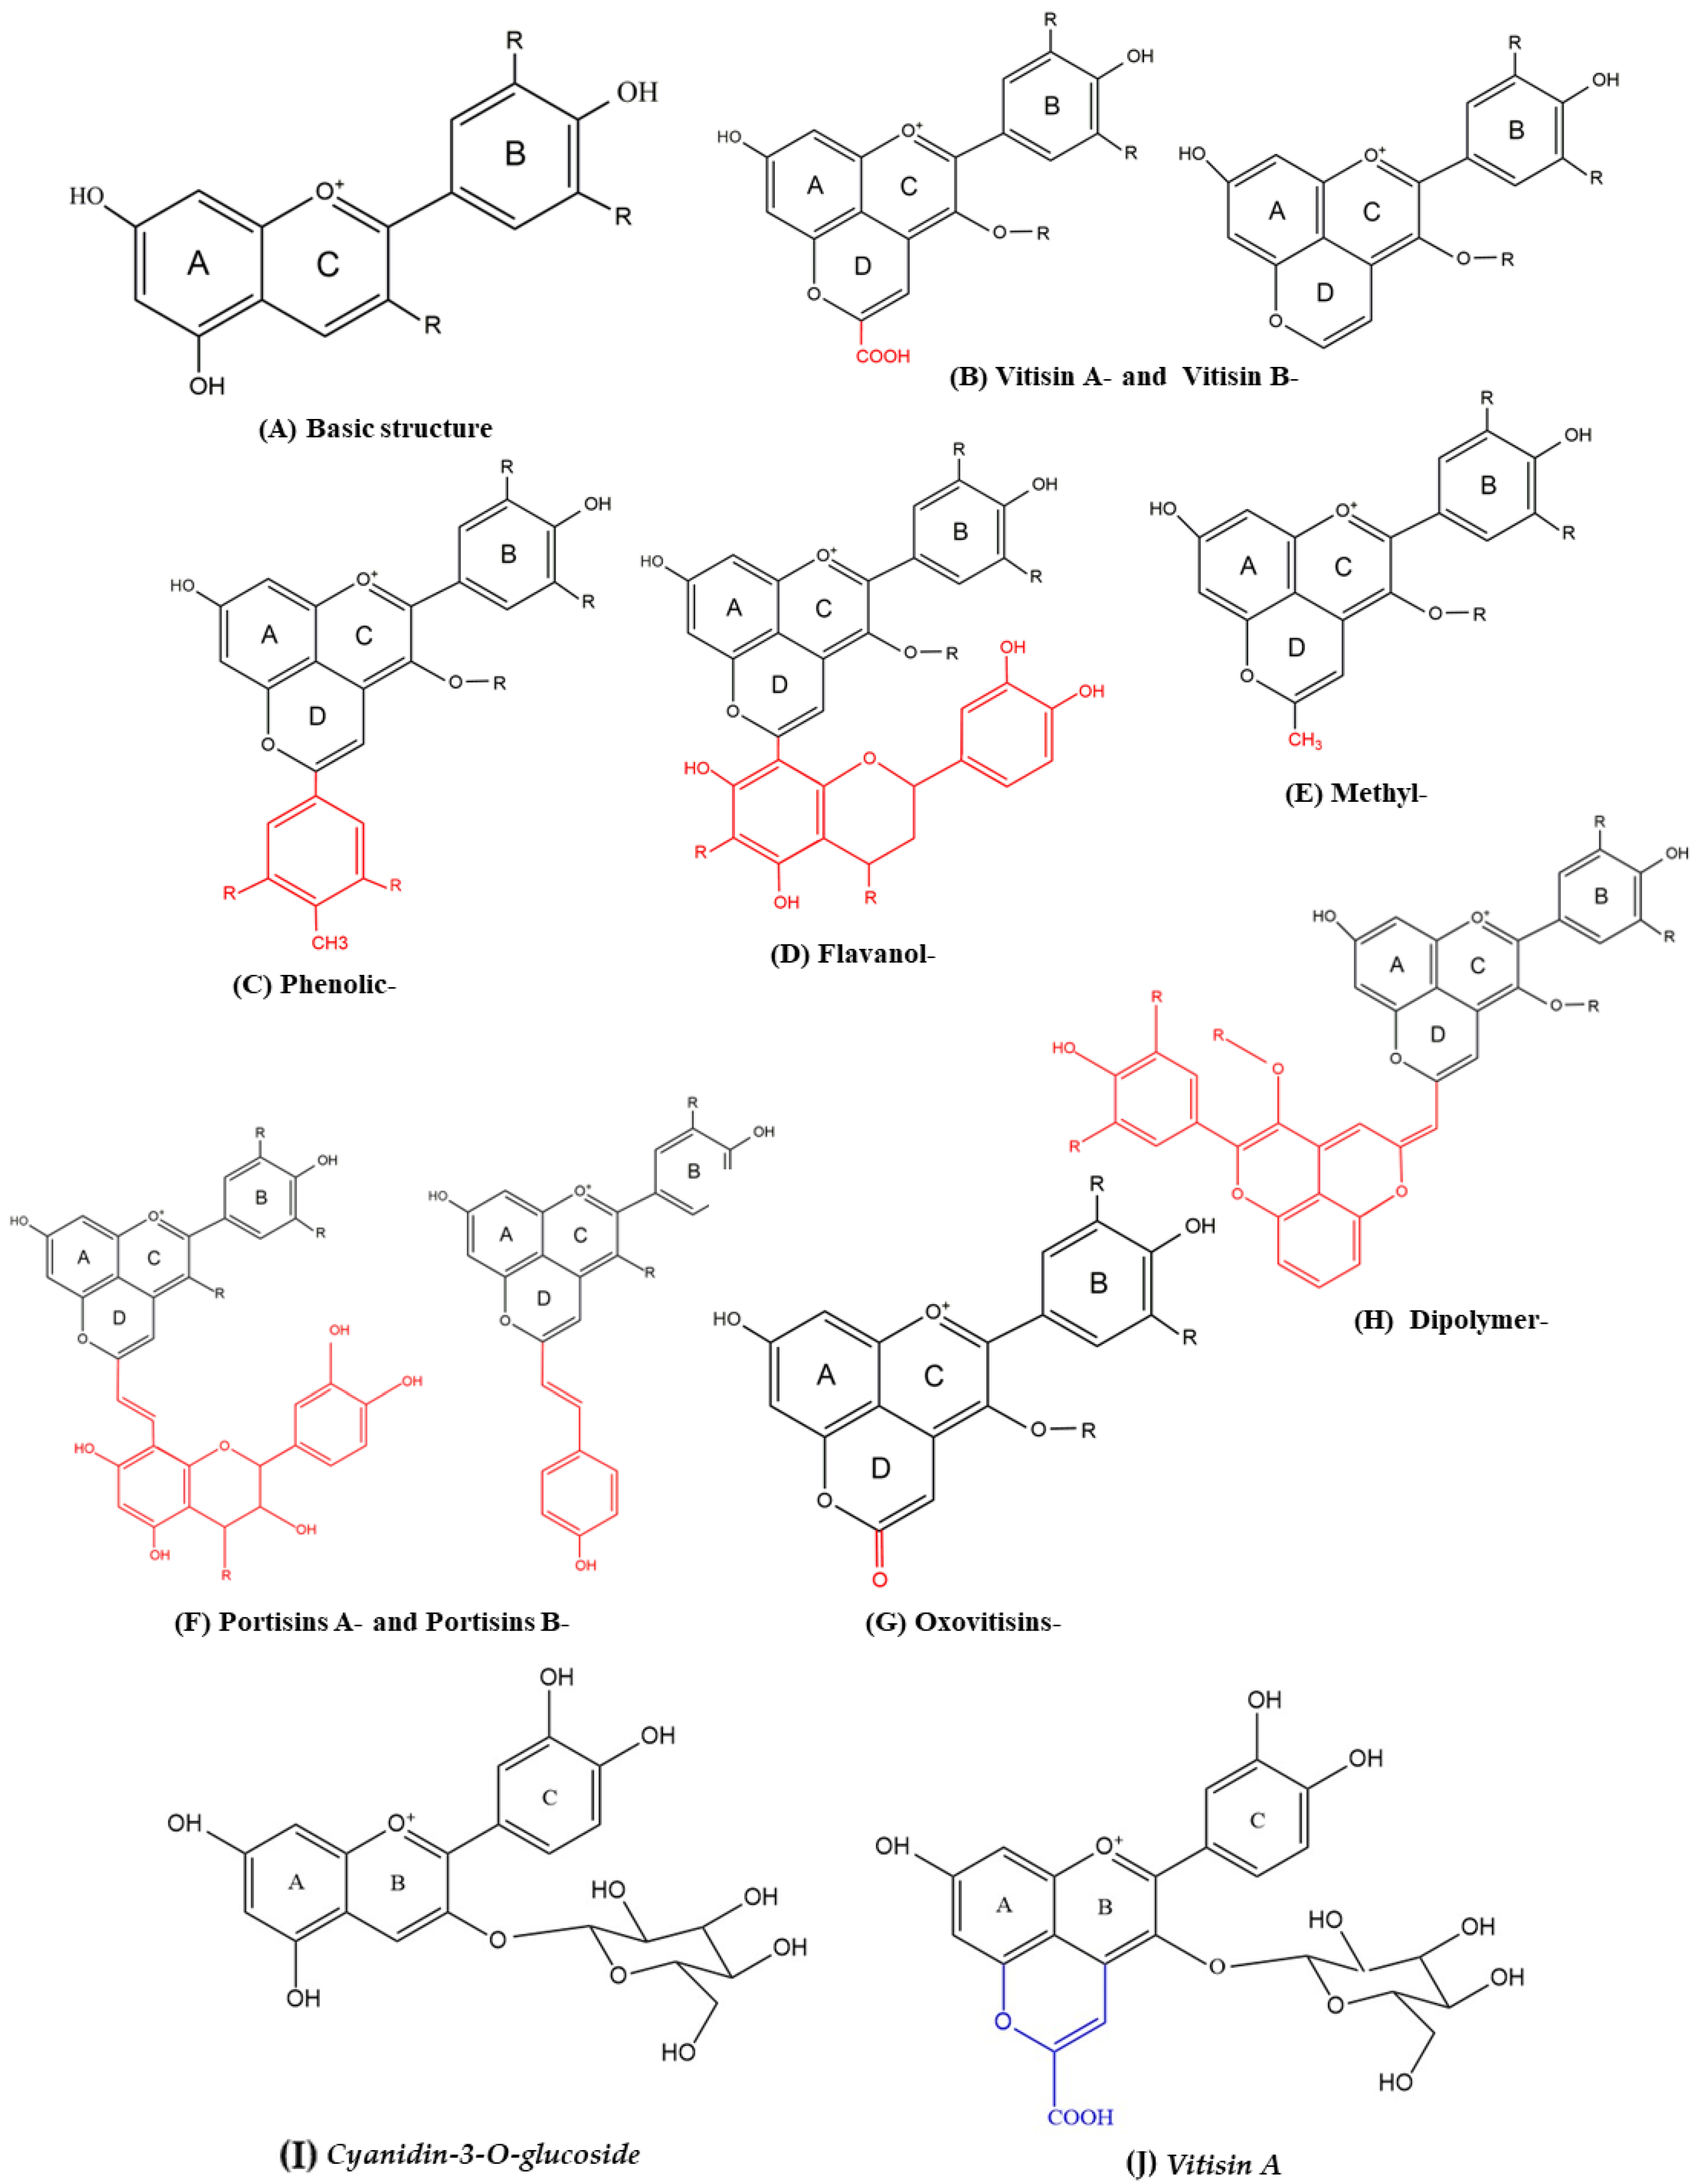
:1. Introduction
2. Results
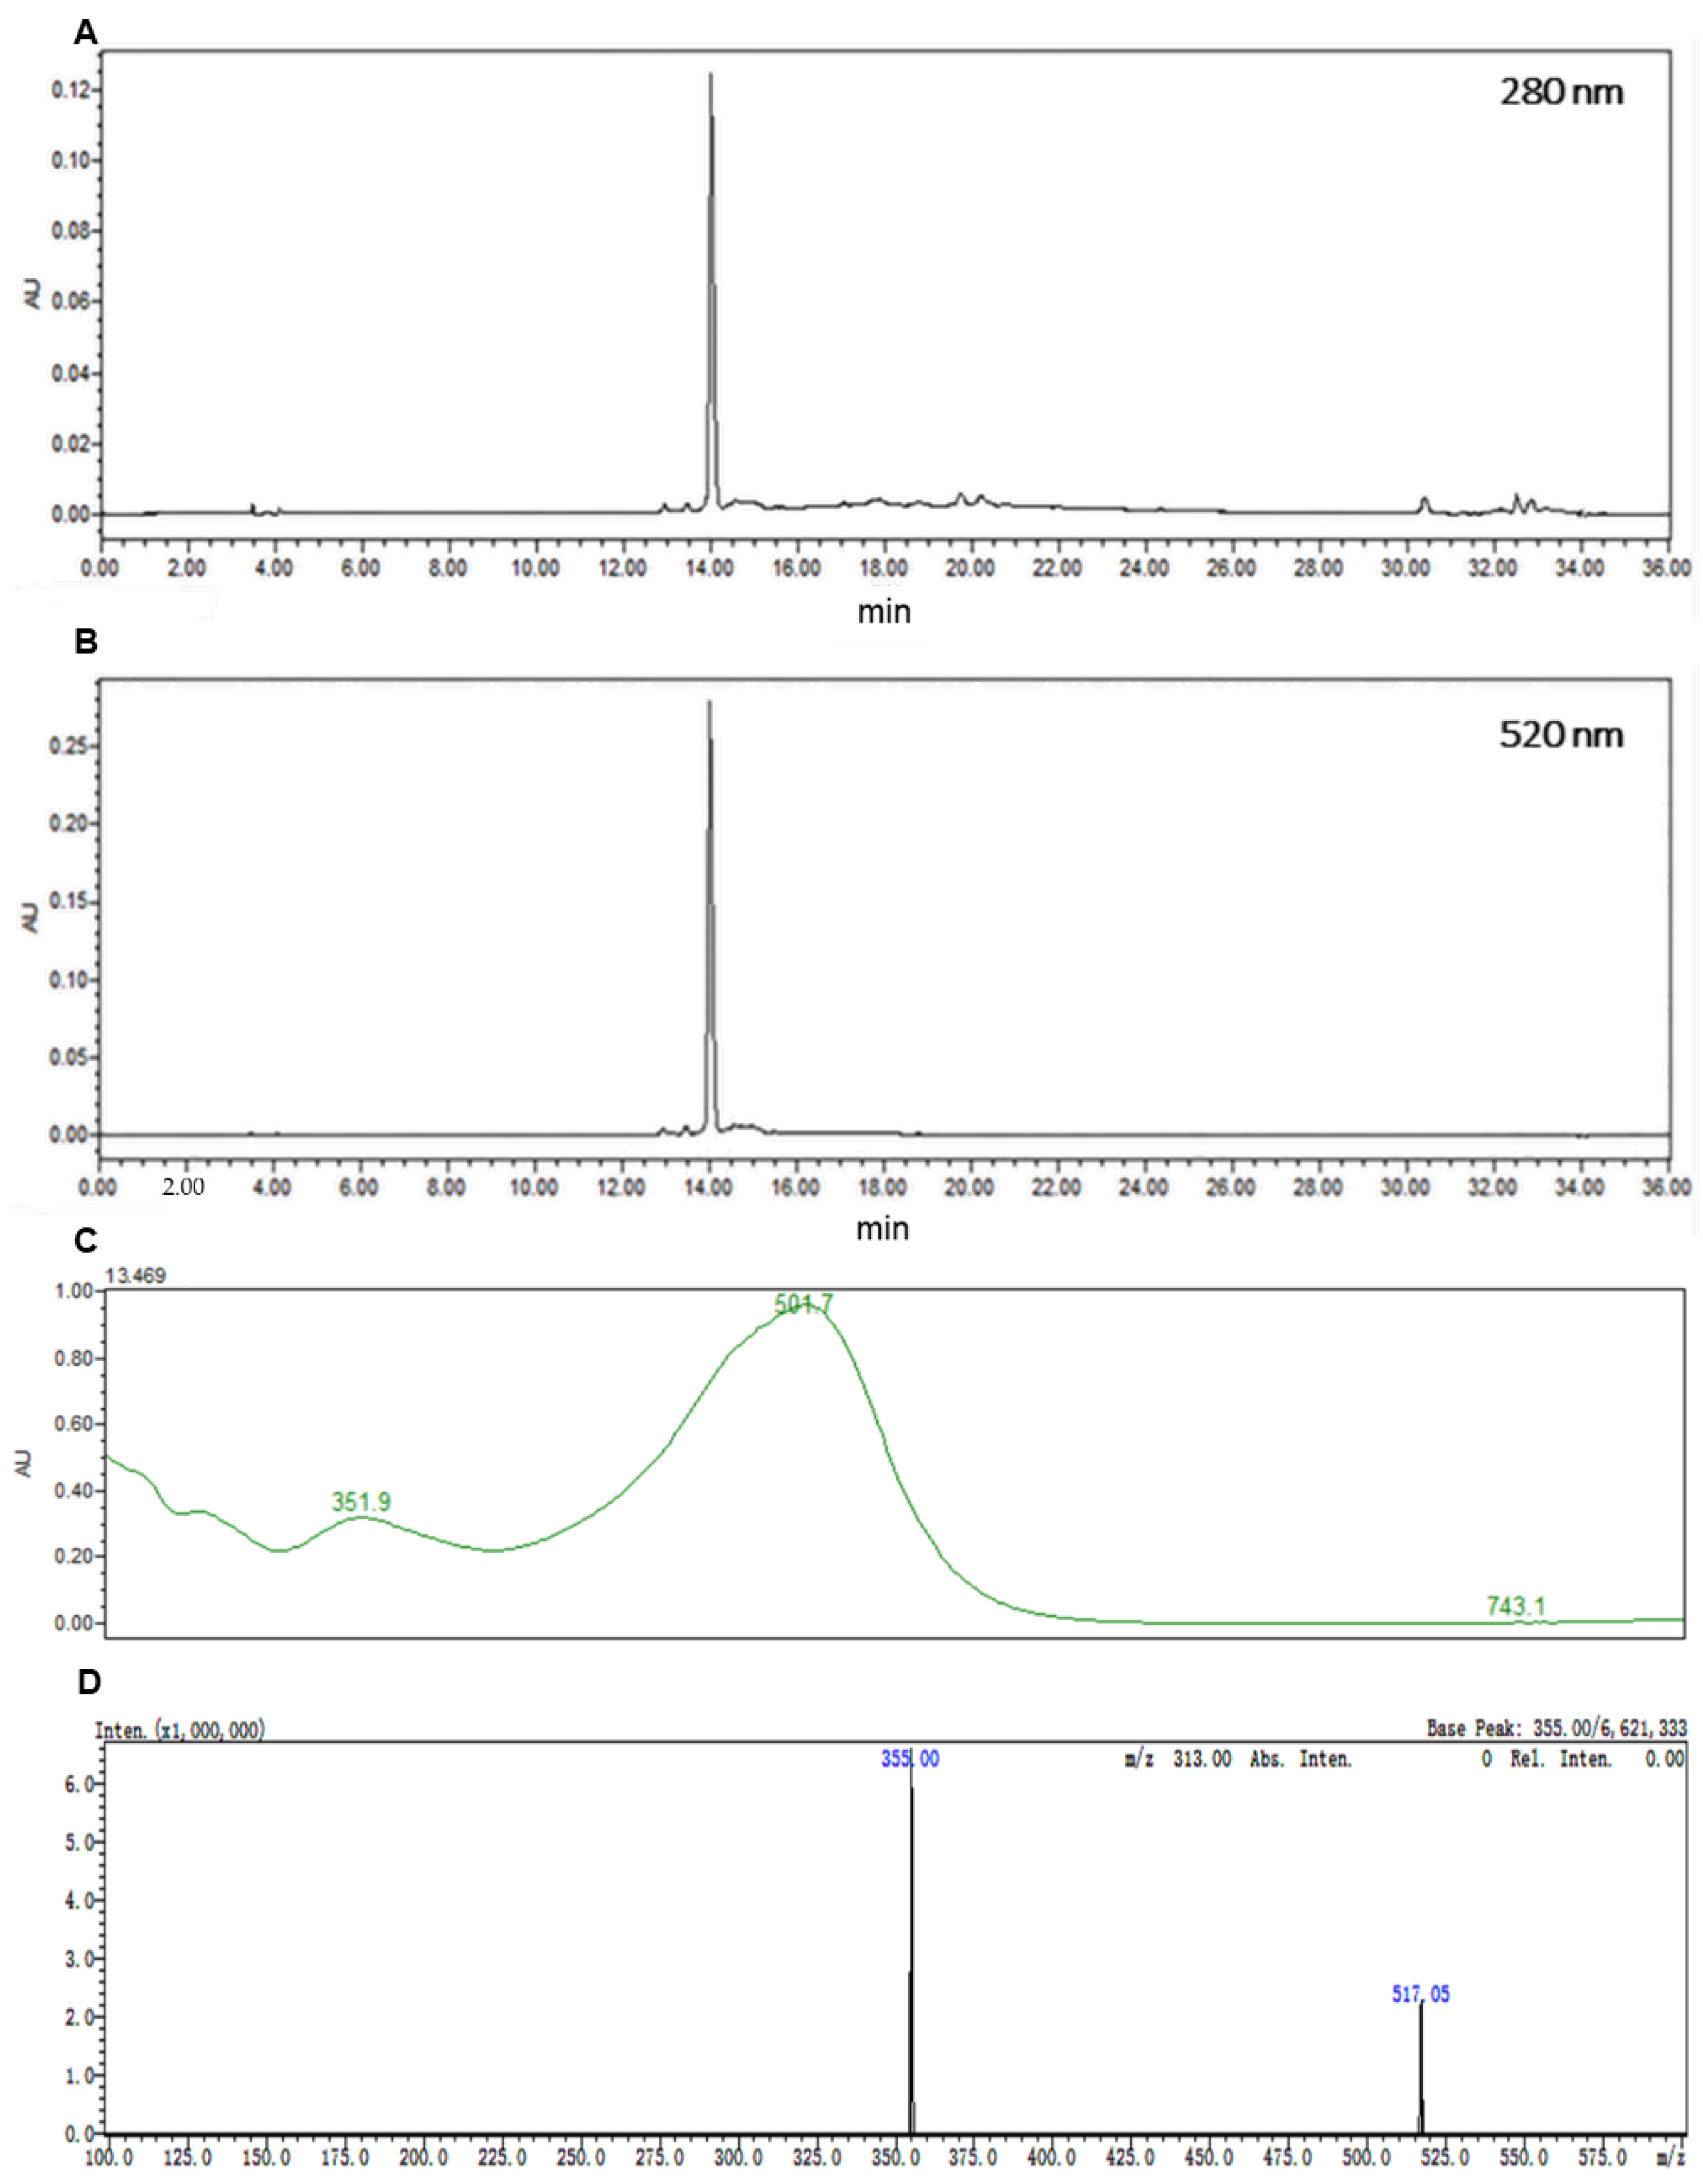
2.1. Preparation of C3G and Vitisin A
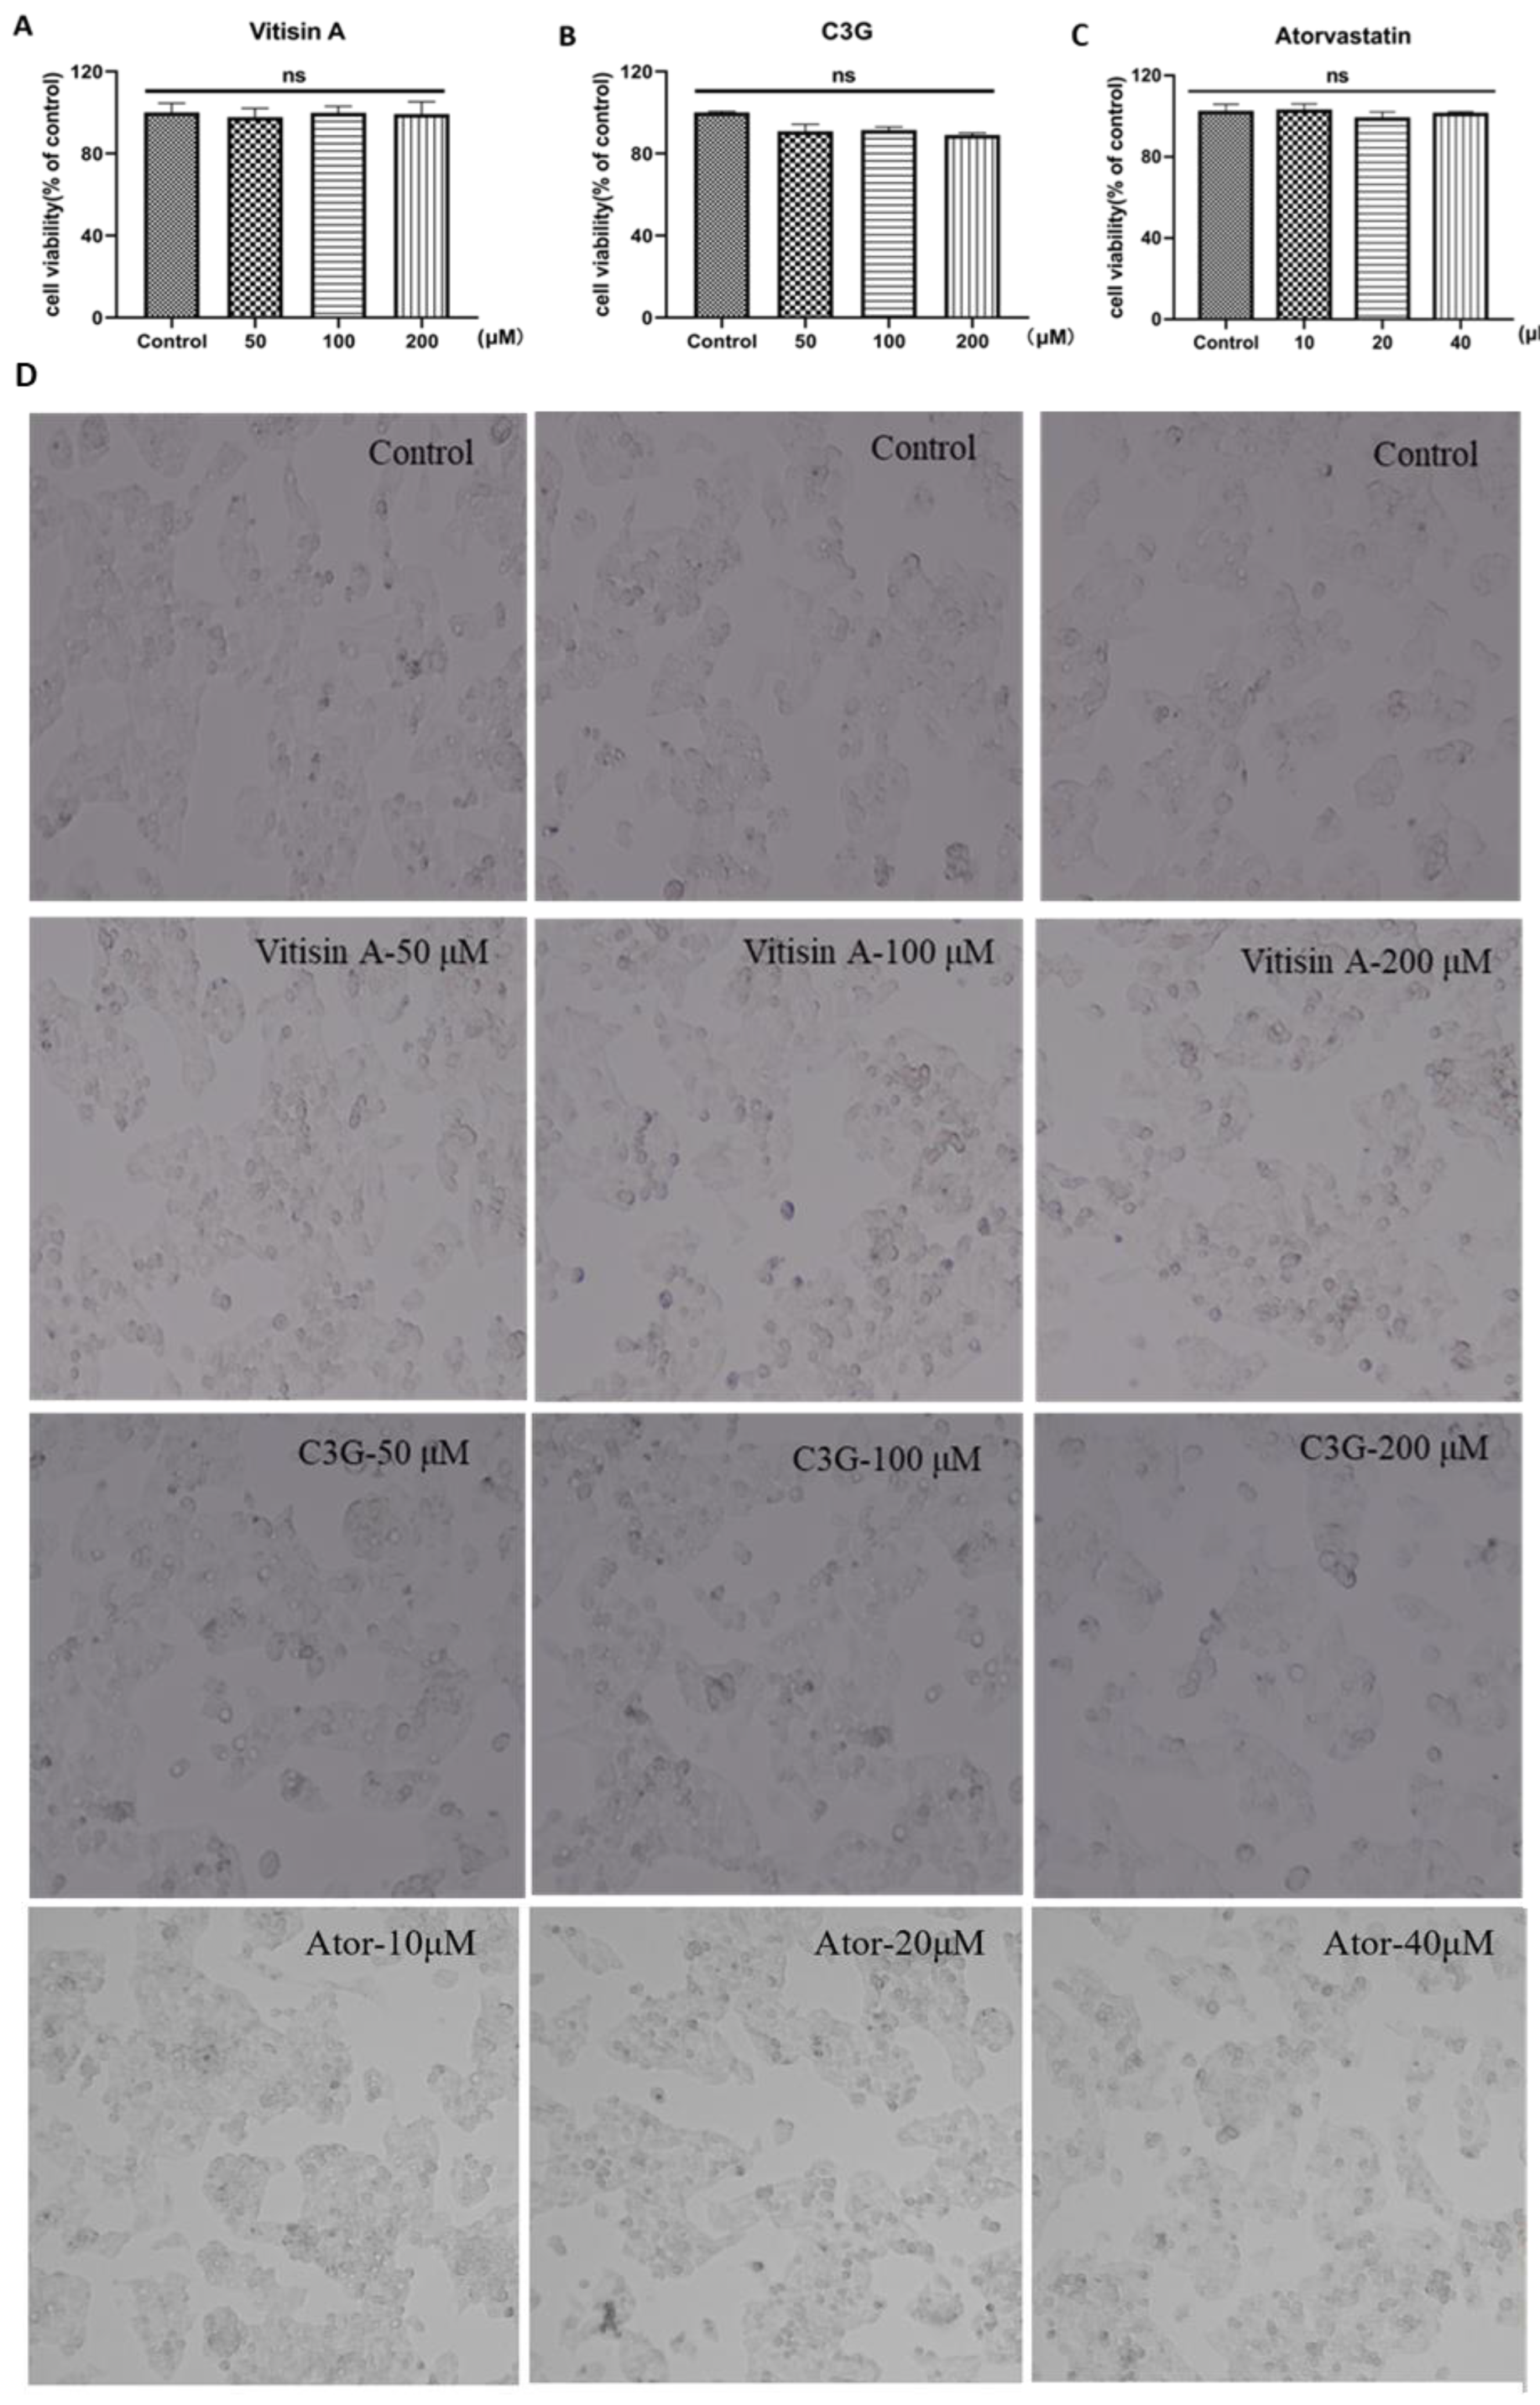
2.2. Cellular Toxicity of Anthocyanins and Atorvastatin in HepG2 Cells
2.3. Vitisin A Decreased Intracellular Cholesterol in HepG2 Cells
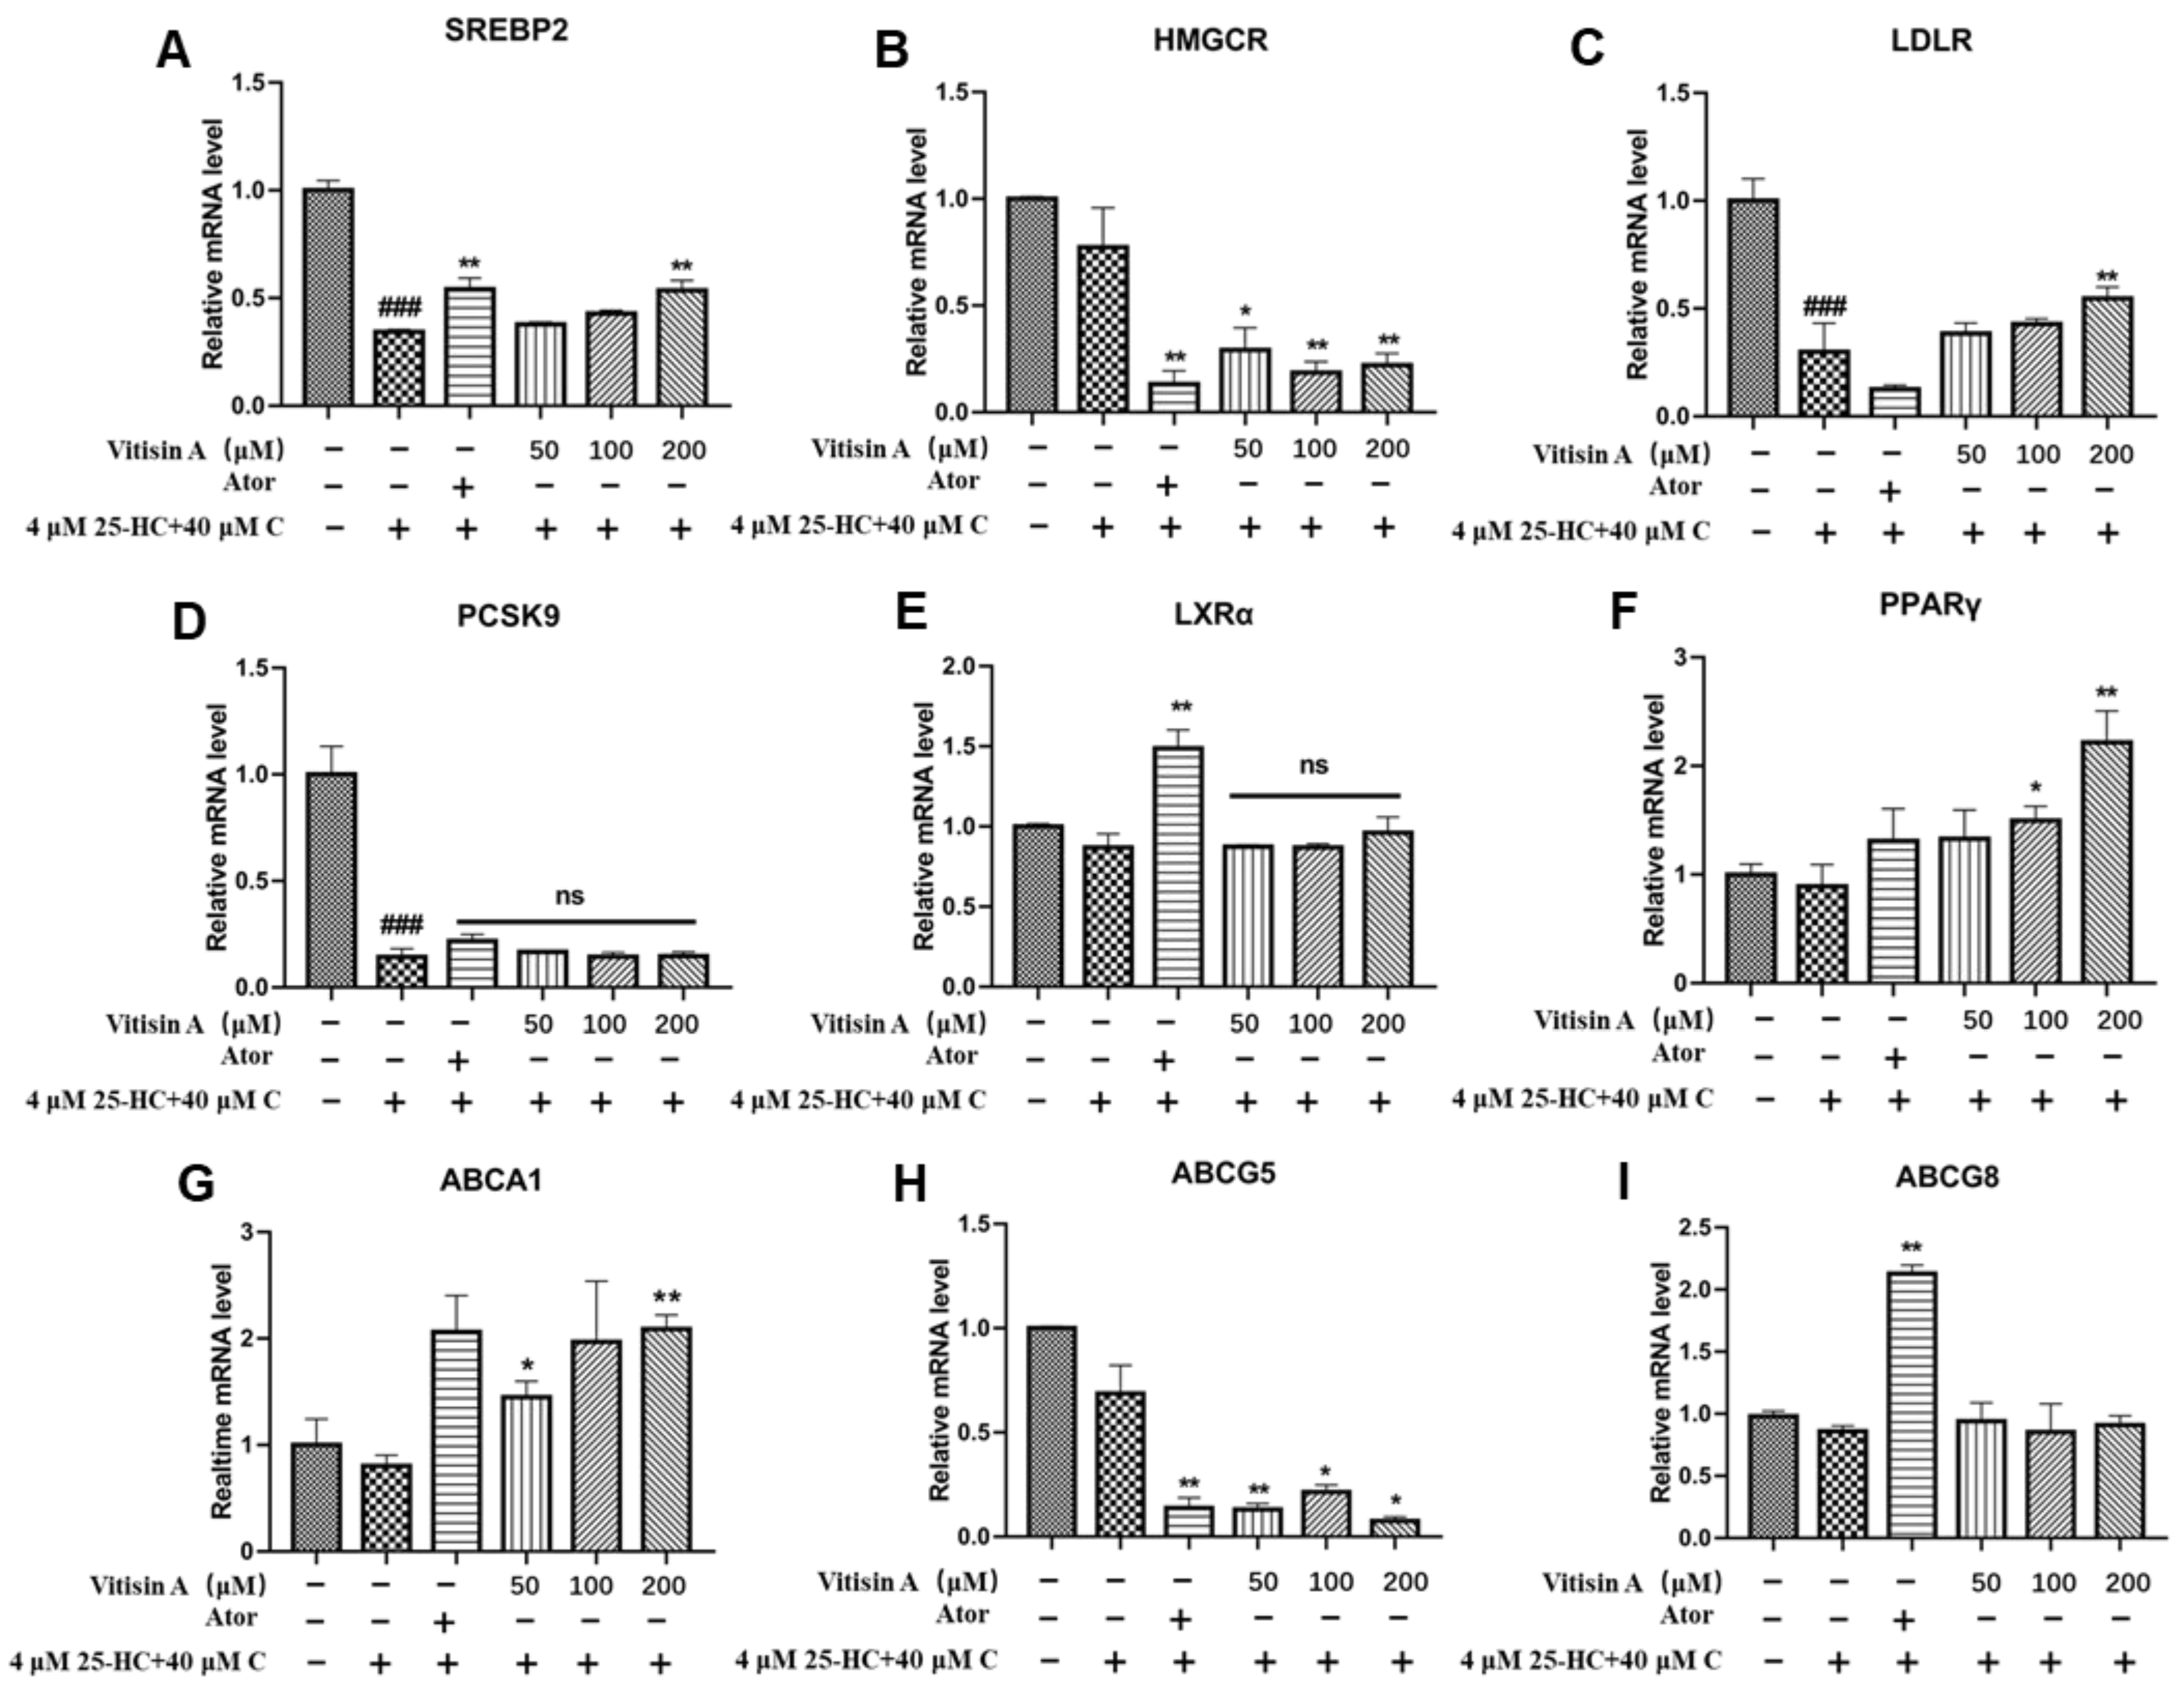
2.4. Vitisin A Regulated the Gene Expressions of Cholesterol Metabolism
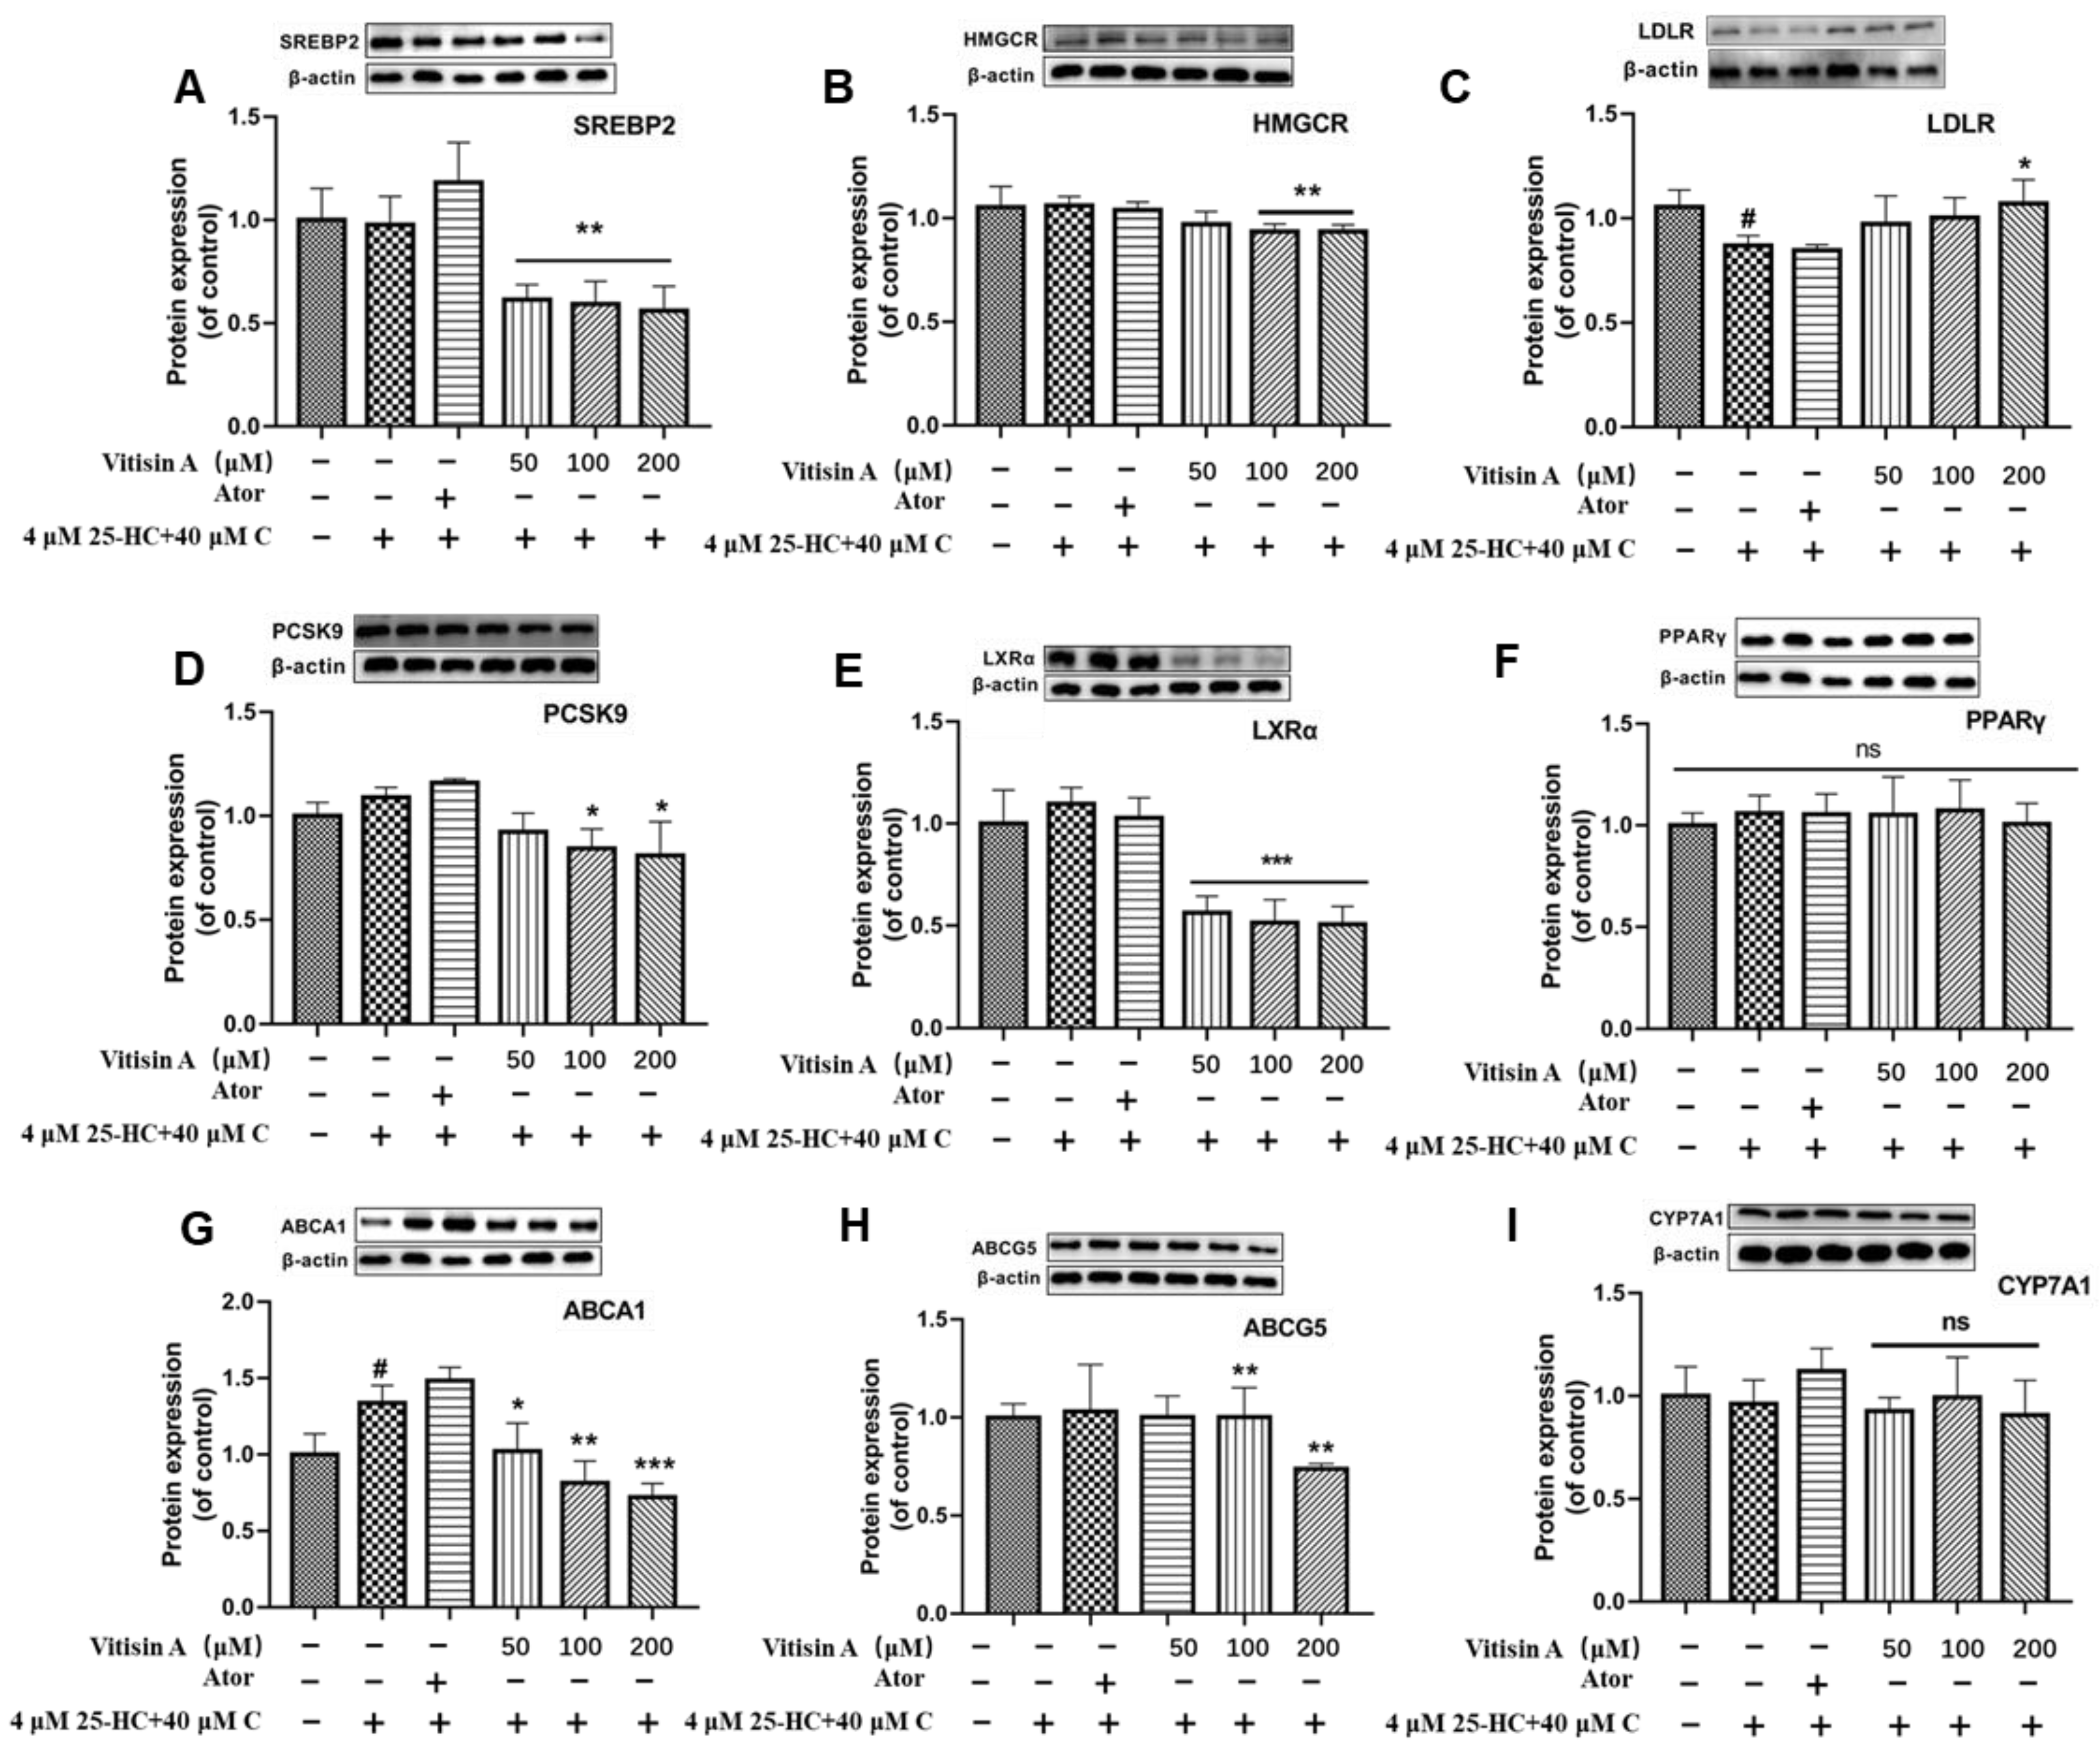
2.5. Vitisin A Regulated the Protein Expressions of Cholesterol Metabolism
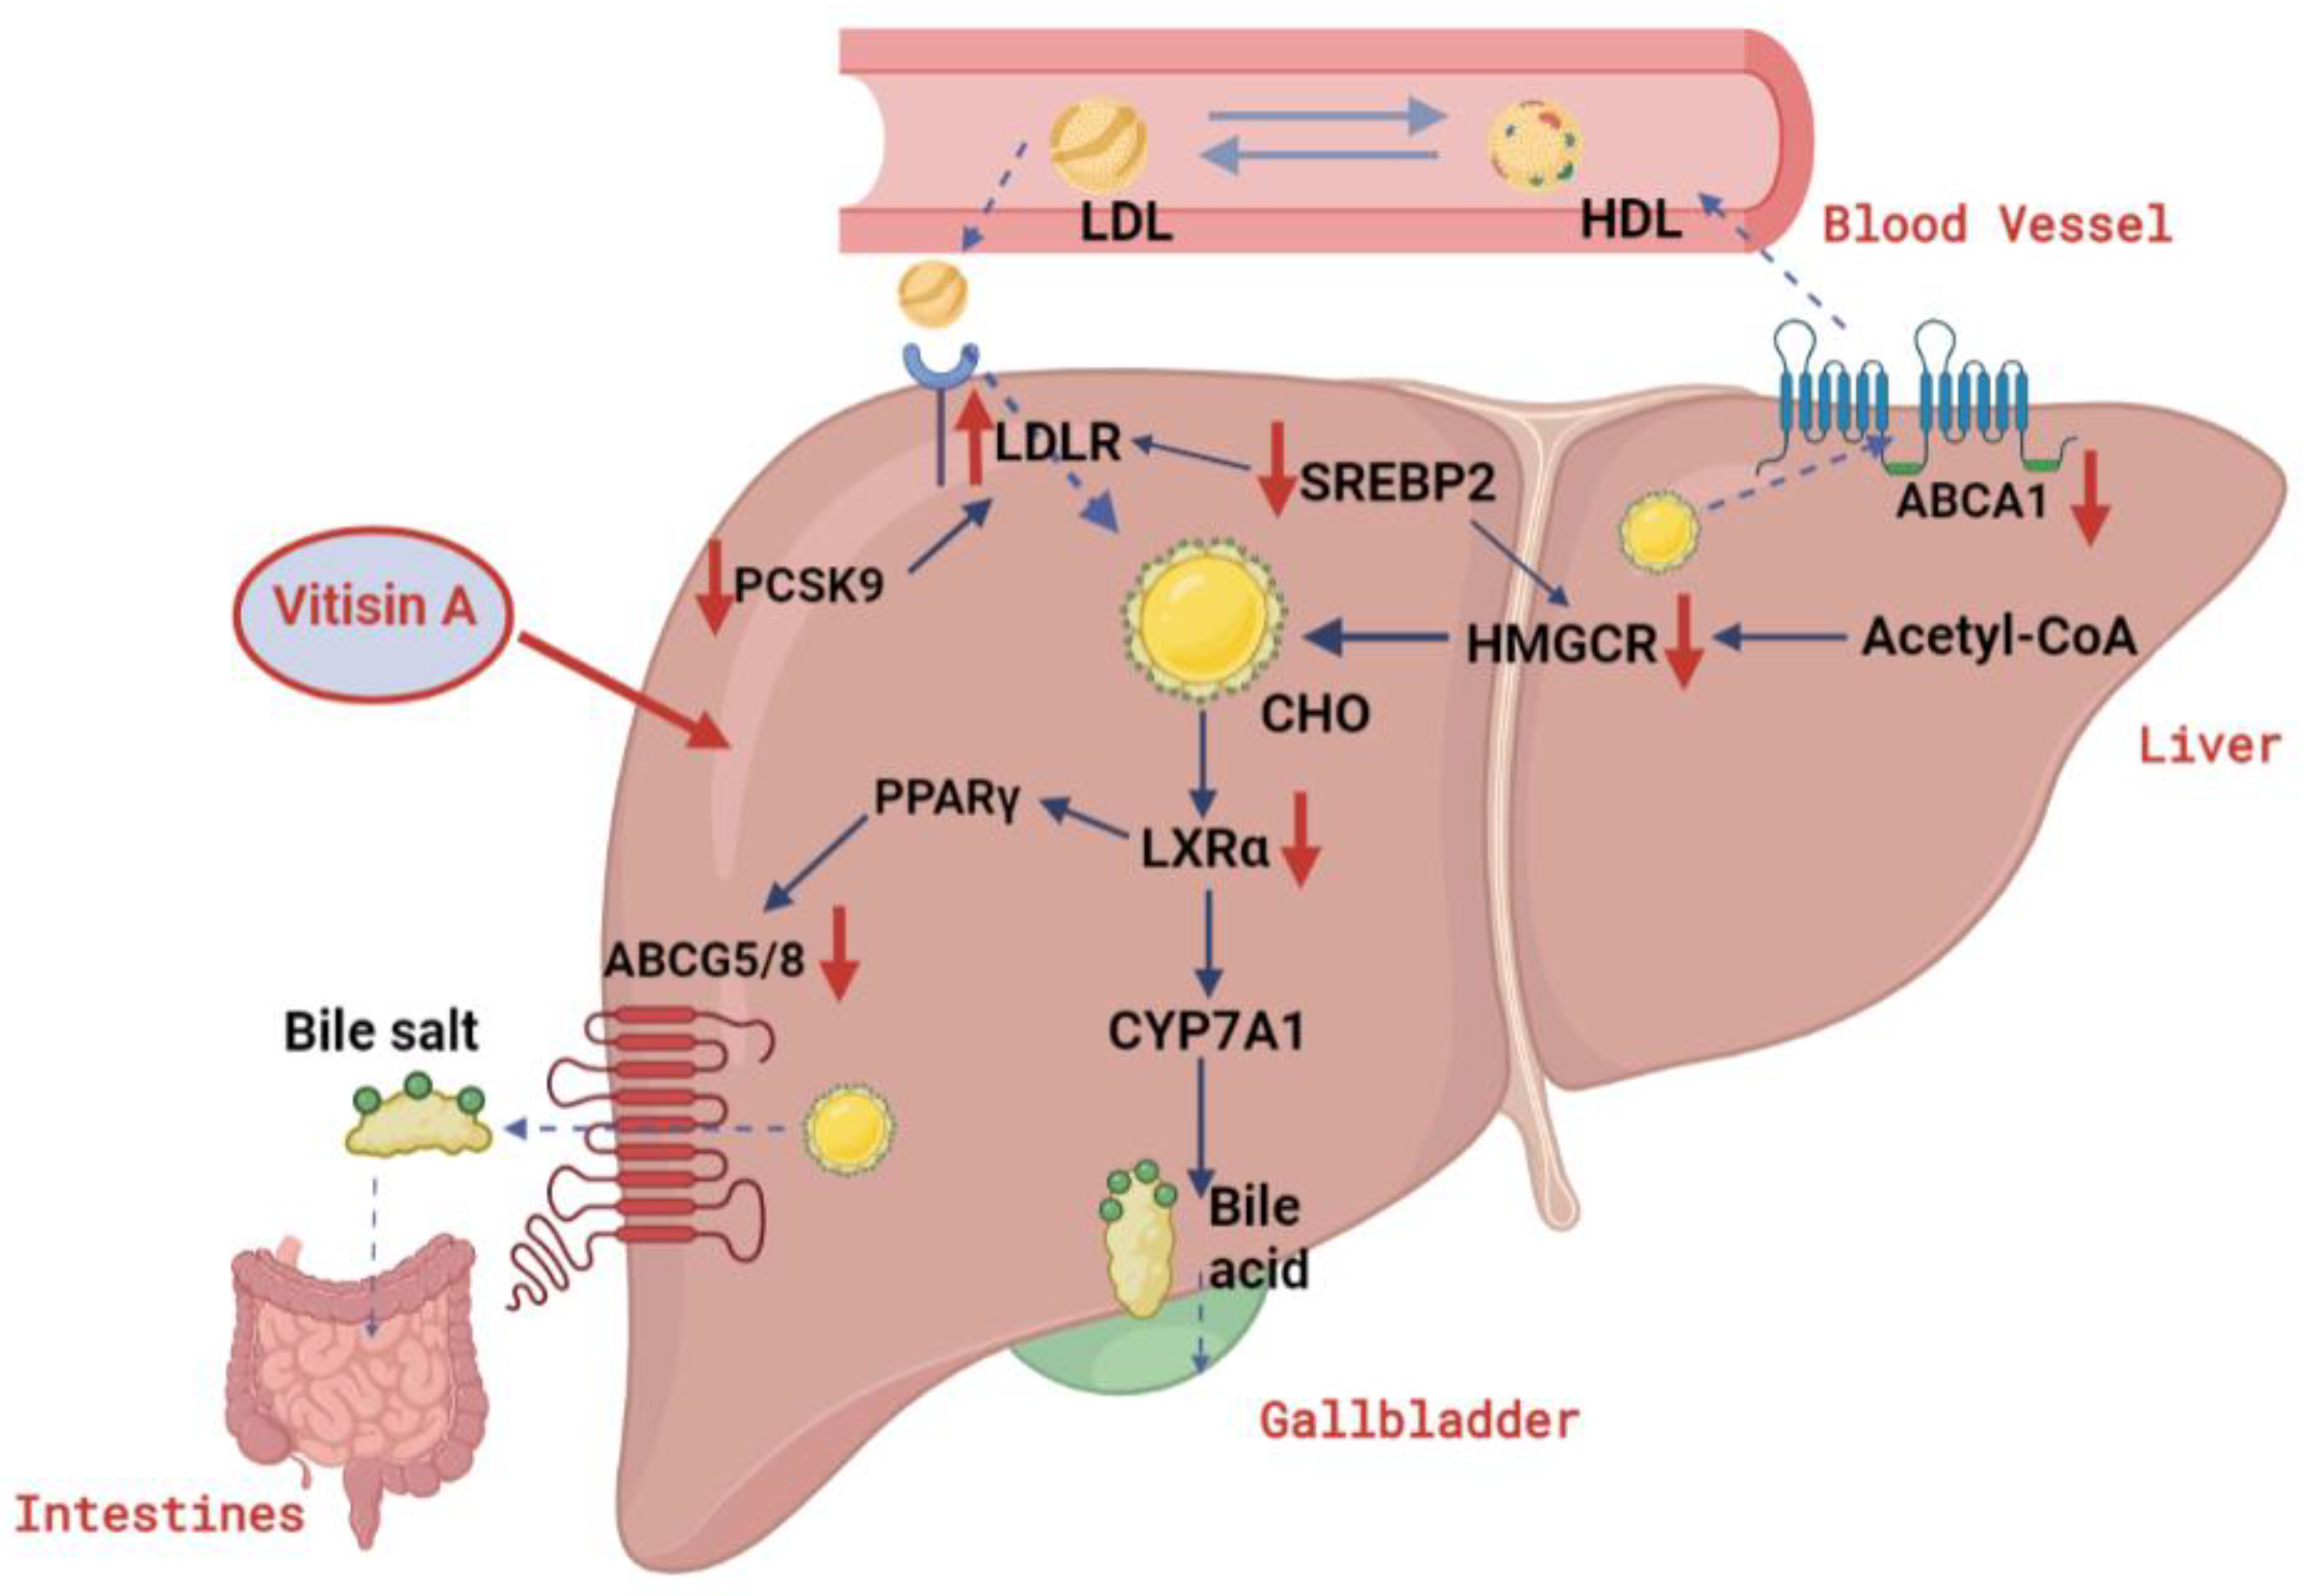
3. Discussion
4. Materials and Methods
4.1. Preparation of C3G and Vitisin A
4.2. Cell Culture and Treatments
4.3. Measurement of Anthocyanins and Atorvastatin Effect on Cellular Toxicity and Morphology
4.4. Measurement of Total Cholesterol
4.5. Real-Time PCR
4.6. Western Blot
4.7. Data Analysis
5. Conclusions
Author Contributions
Funding
Institutional Review Board Statement
Informed Consent Statement
Data Availability Statement
Acknowledgments
Conflicts of Interest
References
- Roth, G.A.; Mensah, G.A.; Fuster, V. The Global Burden of Cardiovascular Diseases and Risks: A Compass for Global Action. J. Am. Coll. Cardiol. 2020, 76, 2980–2981. [Google Scholar] [CrossRef] [PubMed]
- Zhong, V.W.; Van Horn, L.; Cornelis, M.C.; Wilkins, J.T.; Ning, H.; Carnethon, M.R.; Greenland, P.; Mentz, R.J.; Tucker, K.L.; Zhao, L.; et al. Associations of Dietary Cholesterol or Egg Consumption With Incident Cardiovascular Disease and Mortality. JAMA 2019, 321, 1081–1095. [Google Scholar] [CrossRef] [PubMed]
- Li, J.; Guasch-Ferre, M.; Chung, W.; Ruiz-Canela, M.; Toledo, E.; Corella, D.; Bhupathiraju, S.N.; Tobias, D.K.; Tabung, F.K.; Hu, J.; et al. The Mediterranean diet, plasma metabolome, and cardiovascular disease risk. Eur. Heart J. 2020, 41, 2645–2656. [Google Scholar] [CrossRef] [PubMed]
- Rees, K.; Takeda, A.; Martin, N.; Ellis, L.; Wijesekara, D.; Vepa, A.; Das, A.; Hartley, L.; Stranges, S. Mediterranean-style diet for the primary and secondary prevention of cardiovascular disease. Cochrane Database Syst. Rev. 2019, 3, Cd009825. [Google Scholar] [CrossRef] [PubMed]
- Fragopoulou, E.; Antonopoulou, S. The French paradox three decades later: Role of inflammation and thrombosis. Clinica Chimica Acta 2020, 510, 160–169. [Google Scholar] [CrossRef] [PubMed]
- Haseeb, S.; Alexander, B.; Baranchuk, A. Wine and Cardiovascular Health: A Comprehensive Review. Circulation 2017, 136, 1434–1448. [Google Scholar] [CrossRef]
- Toth, A.; Sandor, B.; Papp, J.; Rabai, M.; Botor, D.; Horvath, Z.; Kenyeres, P.; Juricskay, I.; Toth, K.; Czopf, L. Moderate red wine consumption improves hemorheological parameters in healthy volunteers. Clin. Hemorheol. Microcirc. 2014, 56, 13–23. [Google Scholar] [CrossRef] [PubMed]
- Levantesi, G.; Marfisi, R.; Mozaffarian, D.; Franzosi, M.G.; Maggioni, A.; Nicolosi, G.L.; Schweiger, C.; Silletta, M.; Tavazzi, L.; Tognoni, G.; et al. Wine consumption and risk of cardiovascular events after myocardial infarction: Results from the GISSI-Prevenzione trial. Int. J. Cardiol. 2013, 163, 282–287. [Google Scholar] [CrossRef] [PubMed]
- Brien, S.E.; Ronksley, P.E.; Turner, B.J.; Mukamal, K.J.; Ghali, W.A. Effect of alcohol consumption on biological markers associated with risk of coronary heart disease: Systematic review and meta-analysis of interventional studies. BMJ 2011, 342, d636. [Google Scholar] [CrossRef]
- Han, F.; Yang, P.; Wang, H.; Fernandes, I.; Mateus, N.; Liu, Y. Digestion and absorption of red grape and wine anthocyanins through the gastrointestinal tract. Trends Food Sci. Technol. 2019, 83, 211–224. [Google Scholar] [CrossRef]
- Qin, Y.; Xia, M.; Ma, J.; Hao, Y.; Liu, J.; Mou, H.; Cao, L.; Ling, W. Anthocyanin supplementation improves serum LDL- and HDL-cholesterol concentrations associated with the inhibition of cholesteryl ester transfer protein in dyslipidemic subjects. Am. J. Clin. Nutr. 2009, 90, 485–492. [Google Scholar] [CrossRef]
- Kim, B.; Bae, M.; Park, Y.K.; Ma, H.; Yuan, T.; Seeram, N.P.; Lee, J.Y. Blackcurrant anthocyanins stimulated cholesterol transport via post-transcriptional induction of LDL receptor in Caco-2 cells. Eur. J. Nutr. 2018, 57, 405–415. [Google Scholar] [CrossRef] [PubMed]
- Xia, M.; Hou, M.; Zhu, H.; Ma, J.; Tang, Z.; Wang, Q.; Li, Y.; Chi, D.; Yu, X.; Zhao, T.; et al. Anthocyanins induce cholesterol efflux from mouse peritoneal macrophages: The role of the peroxisome proliferator-activated receptor {gamma}-liver X receptor {alpha}-ABCA1 pathway. J. Biol. Chem. 2005, 280, 36792–36801. [Google Scholar] [CrossRef] [PubMed]
- Wang, L.; Zhu, H.; Zhao, Y.; Jiao, R.; Lei, L.; Chen, J.; Wang, X.; Zhang, Z.; Huang, Y.; Wang, T.; et al. Cranberry anthocyanin as an herbal medicine lowers plasma cholesterol by increasing excretion of fecal sterols. Phytomedicine 2018, 38, 98–106. [Google Scholar] [CrossRef] [PubMed]
- Song, H.; Shen, X.; Zhou, Y.; Zheng, X. Black rice anthocyanins alleviate hyperlipidemia, liver steatosis and insulin resistance by regulating lipid metabolism and gut microbiota in obese mice. Food Funct. 2021, 12, 10160–10170. [Google Scholar] [CrossRef] [PubMed]
- Lee, B.; Lee, M.; Lefevre, M.; Kim, H.R. Anthocyanins inhibit lipogenesis during adipocyte differentiation of 3T3-L1 preadipocytes. Plant. Foods Hum. Nutr. 2014, 69, 137–141. [Google Scholar] [CrossRef]
- Mattioli, R.; Francioso, A.; Mosca, L.; Silva, P. Anthocyanins: A Comprehensive Review of Their Chemical Properties and Health Effects on Cardiovascular and Neurodegenerative Diseases. Molecules 2020, 25, 3809. [Google Scholar] [CrossRef]
- Zhang, X.K.; Lan, Y.B.; Huang, Y.; Zhao, X.; Duan, C.Q. Targeted metabolomics of anthocyanin derivatives during prolonged wine aging: Evolution, color contribution and aging prediction. Food Chem. 2021, 339, 127795. [Google Scholar] [CrossRef]
- Rentzsch, M.; Schwarz, M.; Winterhalter, P. Pyranoanthocyanins—An overview on structures, occurrence, and pathways of formation. Trends Food Sci. Technol. 2007, 18, 526–534. [Google Scholar] [CrossRef]
- Sun, J.; Luo, H.; Li, X.; Li, X.; Lu, Y.; Bai, W. Effects of low power ultrasonic treatment on the transformation of cyanidin-3-O-glucoside to methylpyranocyanidin-3-O-glucoside and its stability evaluation. Food Chem. 2019, 276, 240–246. [Google Scholar] [CrossRef]
- Coelho, P.; Oliveira, J.; Fernandes, I.; Araujo, P.; Pereira, A.R.; Gameiro, P.; Bessa, L.J. Pyranoanthocyanins Interfering with the Quorum Sensing of Pseudomonas aeruginosa and Staphylococcus aureus. Int. J. Mol. Sci. 2021, 22, 8559. [Google Scholar] [CrossRef] [PubMed]
- Muselík, J.; García-Alonso, M.; Martín-López, M.P.; Žemlička, M.; Rivas-Gonzalo, J.C. Measurement of Antioxidant Activity of Wine Catechins, Procyanidins, Anthocyanins and Pyranoanthocyanins. Int. J. Mol. Sci. 2007, 8, 797–809. [Google Scholar] [CrossRef]
- Brown, M.S.; Radhakrishnan, A.; Goldstein, J.L. Retrospective on Cholesterol Homeostasis: The Central Role of Scap. Annu. Rev. Biochem. 2018, 87, 783–807. [Google Scholar] [CrossRef] [PubMed]
- Luo, J.; Yang, H.; Song, B.L. Mechanisms and regulation of cholesterol homeostasis. Nat. Rev. Mol. Cell Biol. 2020, 21, 225–245. [Google Scholar] [CrossRef]
- Seidah, N.G.; Abifadel, M.; Prost, S.; Boileau, C.; Prat, A. The Proprotein Convertases in Hypercholesterolemia and Cardiovascular Diseases: Emphasis on Proprotein Convertase Subtilisin/Kexin 9. Pharmacol. Rev. 2017, 69, 33–52. [Google Scholar] [CrossRef]
- Shen, W.J.; Azhar, S.; Kraemer, F.B. SR-B1: A Unique Multifunctional Receptor for Cholesterol Influx and Efflux. Annu. Rev. Physiol. 2018, 80, 95–116. [Google Scholar] [CrossRef]
- Kawanobe, T.; Shiranaga, N.; Kioka, N.; Kimura, Y.; Ueda, K. Apolipoprotein A-I directly interacts with extracellular domain 1 of human ABCA1. Biosci. Biotechnol. Biochem. 2019, 83, 490–497. [Google Scholar] [CrossRef]
- Yu, X.-H.; Qian, K.; Jiang, N.; Zheng, X.-L.; Cayabyab, F.S.; Tang, C.-K. ABCG5/ABCG8 in cholesterol excretion and atherosclerosis. Clinica Chimica Acta 2014, 428, 82–88. [Google Scholar] [CrossRef]
- Boyer, J.L. Bile Formation and Secretion. Compr. Physiol. 2013, 3, 1035–1078. [Google Scholar]
- Li, T.; Matozel, M.; Boehme, S.; Kong, B.; Nilsson, L.-M.; Guo, G.; Ellis, E.; Chiang, J.Y.L. Overexpression of cholesterol 7α-hydroxylase promotes hepatic bile acid synthesis and secretion and maintains cholesterol homeostasis. Hepatology 2011, 53, 996–1006. [Google Scholar] [CrossRef]
- Shahoei, S.H.; Nelson, E.R. Nuclear receptors, cholesterol homeostasis and the immune system. J. Steroid Biochem. Mol. Biol. 2019, 191, 105364. [Google Scholar] [CrossRef] [PubMed]
- Guo, S.; Li, L.; Yin, H. Cholesterol Homeostasis and Liver X Receptor (LXR) in Atherosclerosis. Cardiovasc. Hematol. Disord. Drug Targ. 2018, 18, 27–33. [Google Scholar] [CrossRef]
- Hollands, W.J.; Armah, C.N.; Doleman, J.F.; Perez-Moral, N.; Winterbone, M.S.; Kroon, P.A. 4-Week consumption of anthocyanin-rich blood orange juice does not affect LDL-cholesterol or other biomarkers of CVD risk and glycaemia compared with standard orange juice: A randomised controlled trial. Br. J. Nutr. 2018, 119, 415–421. [Google Scholar] [CrossRef] [PubMed]
- Bakker, J.; Timberlake, C.F. Isolation, Identification, and Characterization of New Color-Stable Anthocyanins Occurring in Some Red Wines. J. Agric. Food Chem. 1997, 45, 35–43. [Google Scholar] [CrossRef]
- Fulcrand, H.; Benabdeljalil, C.; Rigaud, J.; Cheynier, V.; Moutounet, M. A new class of wine pigments generated by reaction between pyruvic acid and grape anthocyanins. Phytochemistry 1998, 47, 1401–1407. [Google Scholar] [CrossRef]
- Roerecke, M.; Rehm, J. Alcohol consumption, drinking patterns, and ischemic heart disease: A narrative review of meta-analyses and a systematic review and meta-analysis of the impact of heavy drinking occasions on risk for moderate drinkers. BMC Med. 2014, 12, 182. [Google Scholar] [CrossRef]
- Xu, L.; Tian, Z.; Chen, H.; Zhao, Y.; Yang, Y. Anthocyanins, Anthocyanin-Rich Berries, and Cardiovascular Risks: Systematic Review and Meta-Analysis of 44 Randomized Controlled Trials and 15 Prospective Cohort Studies. Front. Nutr. 2021, 8, 747884. [Google Scholar] [CrossRef]
- Wallace, T.C.; Slavin, M.; Frankenfeld, C.L. Systematic Review of Anthocyanins and Markers of Cardiovascular Disease. Nutrients 2016, 8, 32. [Google Scholar] [CrossRef]
- Brown, M.S.; Goldstein, J.L. Cholesterol feedback: From Schoenheimer’s bottle to Scap’s MELADL. J. Lipid Res. 2009, 50, S15–S27. [Google Scholar] [CrossRef]
- Gao, Y.; Zhou, Y.; Goldstein, J.L.; Brown, M.S.; Radhakrishnan, A. Cholesterol-induced conformational changes in the sterol-sensing domain of the Scap protein suggest feedback mechanism to control cholesterol synthesis. J. Biol. Chem. 2017, 292, 8729–8737. [Google Scholar] [CrossRef]
- Liang, Y.; Chen, J.; Zuo, Y.; Ma, K.Y.; Jiang, Y.; Huang, Y.; Chen, Z.Y. Blueberry anthocyanins at doses of 0.5 and 1% lowered plasma cholesterol by increasing fecal excretion of acidic and neutral sterols in hamsters fed a cholesterol-enriched diet. Eur. J. Nutr. 2013, 52, 869–875. [Google Scholar] [CrossRef]
- Sun, M.; Li, D.; Hua, M.; Miao, X.; Su, Y.; Chi, Y.; Li, Y.; Sun, R.; Niu, H.; Wang, J. Black bean husk and black rice anthocyanin extracts modulated gut microbiota and serum metabolites for improvement in type 2 diabetic rats. Food Funct. 2022, 13, 7377–7391. [Google Scholar] [CrossRef]
- Liu, H.; Huang, L.; Pei, X. Effects of sorghum rice and black rice on genes associated with cholesterol metabolism in hypercholesterolemic mice liver and intestine. Food Sci. Nutr. 2021, 9, 217–229. [Google Scholar] [CrossRef]
- Sangkitikomol, W.; Tencomnao, T.; Rocejanasaroj, A. Effects of Thai black sticky rice extract on oxidative stress and lipid metabolism gene expression in HepG2 cells. Genet. Mol. Res. 2010, 9, 2086–2095. [Google Scholar] [CrossRef]
- Yanai, H.; Adachi, H.; Hakoshima, M.; Katsuyama, H. Atherogenic Lipoproteins for the Statin Residual Cardiovascular Disease Risk. Int. J. Mol. Sci. 2022, 23, 13499. [Google Scholar] [CrossRef]
- Sun, Y.; Li, X. Cholesterol efflux mechanism revealed by structural analysis of human ABCA1 conformational states. Nat. Cardiovasc. Res. 2022, 1, 238–245. [Google Scholar] [CrossRef]
- Chen, X.; Zhao, Y.; Guo, Z.; Zhou, L.; Okoro, E.U.; Yang, H. Transcriptional regulation of ATP-binding cassette transporter A1 expression by a novel signaling pathway. J. Biol. Chem. 2011, 286, 8917–8923. [Google Scholar]
- Yang, Y.; Jiang, Y.; Wang, Y.; An, W. Suppression of ABCA1 by unsaturated fatty acids leads to lipid accumulation in HepG2 cells. Biochimie 2010, 92, 958–963. [Google Scholar] [CrossRef]
- Mogilenko, D.A.; Shavva, V.S.; Dizhe, E.B.; Orlov, S.V.; Perevozchikov, A.P. PPARgamma activates ABCA1 gene transcription but reduces the level of ABCA1 protein in HepG2 cells. Biochem. Biophys. Res. Commun. 2010, 402, 477–482. [Google Scholar] [CrossRef]
- Li, X.; Lu, J.-L.; Sun, J.-X.; Jiang, X.-W.; Li, X.-S.; Li, Y.; Jiao, R.; Tian, L.-M.; Bai, W.-B. Cyanidin-3-O-glucoside promotes progesterone secretion by improving cells viability and mitochondrial function in cadmium-sulfate-damaged R2C cells. Food Chem. Toxicol. 2019, 128, 97–105. [Google Scholar] [CrossRef]
- Jiang, X.; Zhu, C.; Li, X.; Sun, J.; Tian, L.; Bai, W. Cyanidin-3- O-glucoside at Low Doses Protected against 3-Chloro-1,2-propanediol Induced Testis Injury and Improved Spermatogenesis in Male Rats. J. Agric. Food Chem. 2018, 66, 12675–12684. [Google Scholar] [CrossRef] [PubMed]
- Liao, Z.; Zhang, X.; Chen, X.; Battino, M.; Giampieri, F.; Bai, W.; Tian, L. Recovery of value-added anthocyanins from mulberry by a cation exchange chromatography. Curr. Res. Food Sci. 2022, 5, 1445–1451. [Google Scholar] [CrossRef] [PubMed]
- Guo, J.; Li, Y.; Yuan, Y.; Li, X.; Li, X.; Jiang, X.; Bai, W.; Jiao, R. Cholesterol-lowering activity of 10-gingerol in HepG2 cells is associated with enhancing LDL cholesterol uptake, cholesterol efflux and bile acid excretion. J. Funct. Foods 2022, 95, 105174. [Google Scholar] [CrossRef]
- Li, X.; Guo, J.; Jiang, X.; Sun, J.; Tian, L.; Jiao, R.; Tang, Y.; Bai, W. Cyanidin-3-O-glucoside protects against cadmium-induced dysfunction of sex hormone secretion via the regulation of hypothalamus-pituitary-gonadal axis in male pubertal mice. Food Chem. Toxicol. 2019, 129, 13–21. [Google Scholar] [CrossRef]


| Gene | Accession No. | Primer Sequence (5′→3′) | |
|---|---|---|---|
| Srebp2 | NM_004599 | Forward | AACGGTCATTCACCCAGGTC |
| Reverse | GGCTGAAGAATAGGAGTTGCC | ||
| Hmgcr | NM_001130996 | Forward | CTTGTGTGTCCTTGGTATTAGAGCTT |
| Reverse | GCTGAGCTGCCAAATTGGA | ||
| Ldlr | NM_001195800 | Forward | CAAAGTCTGCAACATGGCTAGAGA |
| Reverse | GTTGTCCAAGCATTCGTTGGTC | ||
| Pcsk9 | NM_174936 | Forward | CCTGGAGCGGATTACCCCT |
| Reverse | CTGTATGCTGGTGTCTAGGAGA | ||
| Pparγ | NM_138711 | Forward | GGGATCAGCTCCGTGGATCT |
| Reverse | TGCACTTTGGTACTCTTGAAGTT | ||
| Lxrα | NM_001251934 | Forward | CCTTCAGAACCCACAGAGATCC |
| Reverse | ACGCTGCATAGCTCGTTCC | ||
| Abca1 | NM_005502 | Forward | ACCCACCCTATGAACAACATGA |
| Reverse | GAGTCGGGTAACGGAAACAGG | ||
| Abcg5 | NM_022436 | Forward | AGCAAGGAACGGGAAATAGA |
| Reverse | CAGGAGAACACCCAGTTTAGAG | ||
| β-actin | NM_001101 | Forward | TGGCACCCAGCACAATGAA |
| Reverse | CTAAGTCATAGTCCGCCTAGAAGCA | ||
Disclaimer/Publisher’s Note: The statements, opinions and data contained in all publications are solely those of the individual author(s) and contributor(s) and not of MDPI and/or the editor(s). MDPI and/or the editor(s) disclaim responsibility for any injury to people or property resulting from any ideas, methods, instructions or products referred to in the content. |
© 2023 by the authors. Licensee MDPI, Basel, Switzerland. This article is an open access article distributed under the terms and conditions of the Creative Commons Attribution (CC BY) license (https://creativecommons.org/licenses/by/4.0/).
Share and Cite
Yuan, Y.; Zhu, Y.; Li, Y.; Li, X.; Jiao, R.; Bai, W. Cholesterol-Lowering Activity of Vitisin A Is Mediated by Inhibiting Cholesterol Biosynthesis and Enhancing LDL Uptake in HepG2 Cells. Int. J. Mol. Sci. 2023, 24, 3301. https://doi.org/10.3390/ijms24043301
Yuan Y, Zhu Y, Li Y, Li X, Jiao R, Bai W. Cholesterol-Lowering Activity of Vitisin A Is Mediated by Inhibiting Cholesterol Biosynthesis and Enhancing LDL Uptake in HepG2 Cells. International Journal of Molecular Sciences. 2023; 24(4):3301. https://doi.org/10.3390/ijms24043301
Chicago/Turabian StyleYuan, Yangbing, Yuanqin Zhu, Yawen Li, Xusheng Li, Rui Jiao, and Weibin Bai. 2023. "Cholesterol-Lowering Activity of Vitisin A Is Mediated by Inhibiting Cholesterol Biosynthesis and Enhancing LDL Uptake in HepG2 Cells" International Journal of Molecular Sciences 24, no. 4: 3301. https://doi.org/10.3390/ijms24043301
APA StyleYuan, Y., Zhu, Y., Li, Y., Li, X., Jiao, R., & Bai, W. (2023). Cholesterol-Lowering Activity of Vitisin A Is Mediated by Inhibiting Cholesterol Biosynthesis and Enhancing LDL Uptake in HepG2 Cells. International Journal of Molecular Sciences, 24(4), 3301. https://doi.org/10.3390/ijms24043301