Article

Gata2a Mutation Causes Progressive Microphthalmia and Blindness in Nile Tilapia

Integrative Science Center of Germplasm Creation in Western China (CHONGQING) Science City, Key Laboratory of Freshwater Fish Reproduction and Development (Ministry of Education), Key Laboratory of Aquatic Science of Chongqing, School of Life Sciences, Southwest University, Chongqing 400715, China
*
Author to whom correspondence should be addressed.
Int. J. Mol. Sci. 2023, 24(4), 3567; https://doi.org/10.3390/ijms24043567
Submission received: 20 December 2022 / Revised: 3 February 2023 / Accepted: 8 February 2023 / Published: 10 February 2023
(This article belongs to the Section Molecular Biology)

Abstract

:
The normal development of lens fiber cells plays a critical role in lens morphogenesis and maintaining transparency. Factors involved in the development of lens fiber cells are largely unknown in vertebrates. In this study, we reported that GATA2 is essential for lens morphogenesis in Nile tilapia (Oreochromis niloticus). In this study, Gata2a was detected in the primary and secondary lens fiber cells, with the highest expression in primary fiber cells. gata2a homozygous mutants of tilapia were obtained using CRISPR/Cas9. Different from fetal lethality caused by Gata2/gata2a mutation in mice and zebrafish, some gata2a homozygous mutants of tilapia are viable, which provides a good model for studying the role of gata2 in non-hematopoietic organs. Our data showed that gata2a mutation caused extensive degeneration and apoptosis of primary lens fiber cells. The mutants exhibited progressive microphthalmia and blindness in adulthood. Transcriptome analysis of the eyes showed that the expression levels of almost all genes encoding crystallin were significantly down-regulated, while the expression levels of genes involved in visual perception and metal ion binding were significantly up-regulated after gata2a mutation. Altogether, our findings indicate that gata2a is required for the survival of lens fiber cells and provide insights into transcriptional regulation underlying lens morphogenesis in teleost fish.

1. Introduction

Lens morphogenesis is a key event during eye organogenesis, and abnormal lens morphogenesis results in a range of lens/eyes structural abnormalities and cataract formation [1,2,3]. Genetic studies have revealed many genes implicated in microphthalmia in mammals [4]. These genes are involved in a variety of molecular pathways and include transcription factors Pax6, Otx2, Sox2, Vsx2, Six3 and Sall2 [5,6], crystallin genes (Cryaa/b, Crybb1/2/3, Cryba1/2/3/4 and Crygc/d/s), membrane protein genes (Gja3/8, Mip and Lim2) [7,8], growth and transcription factor genes (Pitx3, Maf and Hsf4) [9] and beaded filament structural protein genes (Bfsp1 And Bfsp2) [10]. In contrast to the more complexly shaped lens of mammals, the lens of fish presents a simpler structure. Although findings in mammals have made tremendous contributions to our understanding of the genetic etiology of microphthalmia, new causative genes as well as the underlying molecular mechanisms remain to be discovered in teleosts.
The lens is composed of a single cell type that follows a developmental pattern, beginning as a member of the germinative zone in the single layer of anterior epithelial cells overlaying the fiber cell mass [11,12]. The lens contains the anterior lens epithelium and the posterior lens fibers, which consist of the primary and secondary lens fiber cells [5,13,14]. Fiber cells make up the lens nucleus; both the ordered arrangement of the fiber cells and their sutures, as well as their intracellular structure, are important for light transmission and lens transparency [11,15,16,17]. To obtain transparent lens, both primary and secondary lens fiber cells undergo terminal differentiation including cell cycle exit, burst expression of crystallin proteins, removal of subcellular organelles, such as mitochondria, endoplasmic reticulum, Golgi apparatus and nuclei [18,19]. The degradation of lens fiber cell organelles produces the organelle free zone, and the defect of this process leads to cataract formation [12]. Studies in the development of lens fiber cells have been relatively clear in mammals, but little is known regarding teleosts.
GATA2 is a highly conserved transcription factor with a zinc-finger domain, and with a major role in hematopoietic, cardiovascular, neural and urogenital systems from Drosophila to humans [2,20]. GATA2 is expressed in numerous mammalian tissues, including hematopoietic, cardiovascular, neural and urogenital systems, and yet it plays important roles in the regulation of tissue-restricted gene expression [21,22,23]. In humans, mutations in GATA2 result in four clinical syndromes: monocytopenia, mycobacterial infections syndrome, B and NK lymphoid deficiency and acute myeloid leukemia [23,24,25,26]. Mice lacking GATA2 die at embryonic day (E) 10.5 with defects in primitive and definitive hematopoiesis [27]. Genome duplication within the teleost lineage has yielded two Gata2 paralogons that have been maintained in these jawed fish, including zebrafish and tilapia [2]. Recent studies have revealed that the function of mammalian GATA2 is split between Gata2a and Gata2b in zebrafish [2,28]. Gata2a is required for hemogenic endothelium specification upstream of Gata2b. Gata2b is not vital for the embryonic generation of hematopoietic stems and progenitor cells, but supports their expansion in caudal hematopoietic tissue [28,29]. However, during adulthood, Gata2b is required for the quiescent hematopoietic stem and progenitor cell (HSPC) population [29]. A mutation of gata2a disrupts dorsal aorta morphogenesis and leads to embryo death. gata2b-deficient zebrafish have a reduction in embryonic definitive HSPC numbers, but are viable [28,29]. In addition to its critical role in hematopoiesis, due to the embryonic lethality of gata2a mutations, it is unclear whether it is involved in the regulation of the development of other tissues and organs.
Nile tilapia are the only farmed fish in the world capable of large-scale genetic manipulation and gene mutation. They have a high-quality genome sequence, a short spawning cycle (14 days at 26 °C), large spawning capacity and can reproduce all year round. They can provide sufficient material for studying the tissue and organ development of cultured fish. In the present study, homozygous mutants of gata2a and gata2b were constructed in Nile tilapia using the CRISPR/Cas9 system. A single mutation in gata2a or gata2b did not cause embryonic lethality. Interestingly, gata2a mutants displayed progressive microphthalmia and blindness. Expression profiling analysis showed that Nile tilapia Gata2a was highly expressed in primary lens fiber cells and weakly expressed in secondary lens fiber cells during lens morphogenesis. Loss of gata2a resulted in the death of primary lens fiber cells. Transcriptome profiling showed that the expression levels of genes coding crystallin were significantly down-regulated, while the expression levels of genes involved in visual perception and iron ion binding were significantly upregulated in the gata2a homozygous mutants. Altogether, our data revealed that Gata2a is essential for lens morphogenesis in Nile tilapia and provided insights into transcriptional regulation of lens morphogenesis in teleost fish.

2. Results

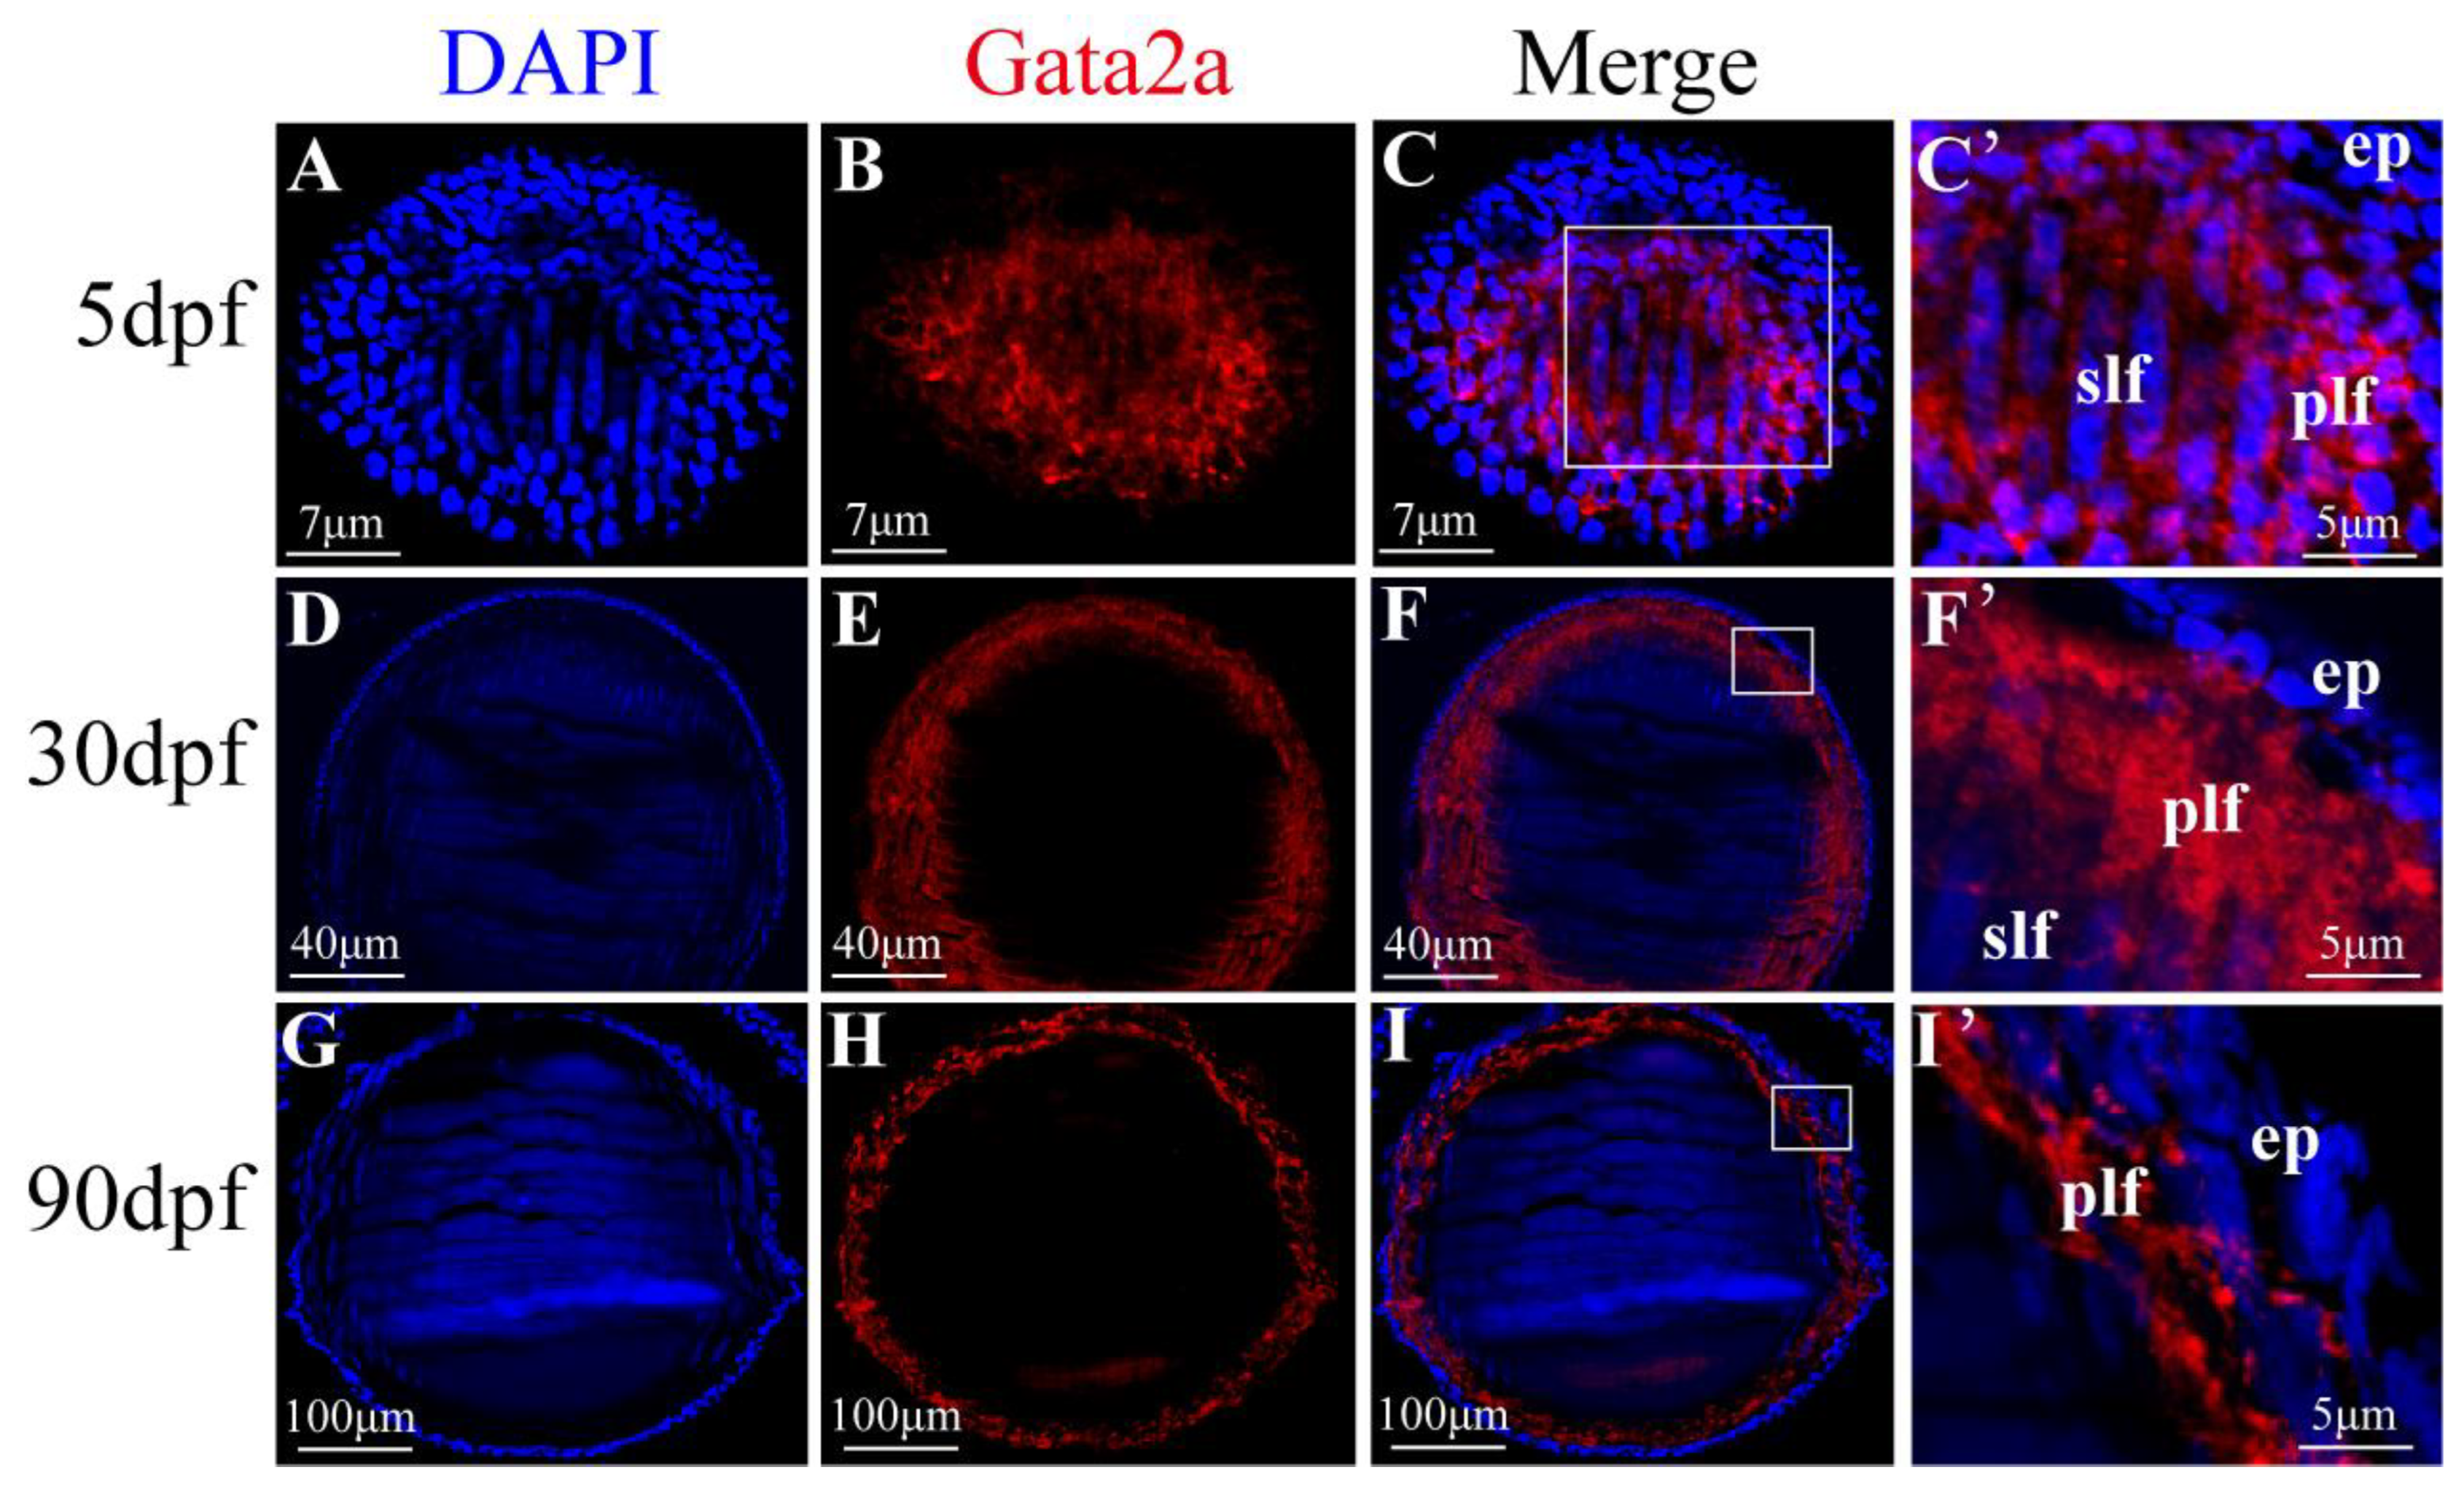
2.1. Expression Pattern of Gata2a in the Lens of Nile Tilapia

According to the transcriptome data of Nile tilapia (Oreochromis niloticus) from NCBI (BioProject: PRJNA78915), gata2a was broadly expressed in the eyes, heart, brain and kidney, with the highest level in the eyes (Figure S1). To better understand the roles of Gata2a in eye development, we conducted immunofluorescence to profile dynamic spatial-temporal expression of Gata2a in Nile tilapia eyes. Expression of Gata2a was detected in the primary and secondary lens fiber cells (anterior-posterior elongation) from larvae at 5 days post fertilization (dpf), most prominently in the primary lens fiber cells (Figure 1A–C’). When secondary lens fiber cells began to elongate to form the concentric layers, Gata2a immunoreactivity was also detected in the nucleus of primary and secondary lens fiber cells from juveniles at 30 dpf, most prominently in the primary lens fiber cells (Figure 1D–F’). Gata2a immunoreactivity was consistently detected in the nuclei of primary and secondary lens fiber cells along the surface layers at 90 dpf (Figure 1G–I’).

2.2. Establishment of Gata2a and Gata2b Homozygous Mutants in Nile Tilapia

The gata2a and gata2b mutants were obtained using the CRISPR/Cas9 system in Nile tilapia. The genomic target sites were located in the region adjacent to the translational start site within the open reading frame of the gata2a and gata2b genes (Figure 2A and Figure S2A). The guide RNA (gRNA) and Cas9 mRNA were co-microinjected into single-cell embryos (fertilized eggs). Subsequent PCR using genomic DNA from eggs at 72 h after injection (time required for gRNA and Cas9 mRNA to be translated into protein and working) as a template, followed by restriction digestion (HinfI), revealed three bands with an obvious uncut band in the PCR products of the gata2a mosaic mutants, but revealed two bands in the controls (Figure 2B and Figure S2B), indicating that the gata2a and gata2b gene had been mutated. Further sequencing analysis revealed that, compared with the WT (gata2a+/+ and gata2b+/+), the positive F0 mutants harbored different types of genomic insertion/deletion around the target sites of gata2a and gata2b ORF (Figure 2C and Figure S2B). The F1 mutants carrying 5-bp insertion and 7-bp deletion were used to establish gata2a homozygous mutants (Figure 2E,F and Figure S3A,B). The F1 mutants carrying 2-bp insertion were used to establish gata2b homozygous mutants (Figure S2). Genotyping analysis of the F2 generation showed that homozygous mutants carrying frameshift mutation in gata2a (5-bp insertion and 7-bp deletion) and gata2b (2-bp insertion) were successfully obtained (Figure 2D,E, Figures S2D,E and S3A–C). The gata2a and gata2b mRNA levels were significantly down-regulated in the mutants (Figures S2F and S3F). Western blot was carried out to show the specificity of the antibody against Gata2a (Figure 2F). Immunofluorescence assay confirmed that a specific signal of gata2a was detected in the lens of WT, while it was absent in the lens of gata2a homozygous mutants (Figure 2G).

2.3. Gata2a Mutation Causes Microphthalmia and Blindness in Nile Tilapia

During the development of the mutants, we found that some homozygous mutants of gata2a (4/10) and gata2b (6/10) showed abnormal hematogenesis (anemia of the heart, congestion of the head, eyes, or tail) and died after hatching (Figure S3D). The remaining mutants survived, and developed to the adult stage. Interestingly, we found some gata2a mutants with microphthalmia and darker body color at the later developmental stages (Figure 3A). Homozygous mutants with 5-bp insertion displayed similar defects as those with 7-bp deletion (Figure S3E). During subsequent analysis, homozygous mutants with 5-bp insertion were used. In the F2 generation, genotyping analysis indicated that all the gata2a homozygous mutants displayed microphthalmia (8/8), while only some of the heterozygous mutants displayed microphthalmia. Among the heterozygous mutants with microphthalmia, about 15/100 exhibited unilateral microphthalmia (8/50), while about 8/100 exhibited bilateral microphthalmia (4/50) (Figure 3B,C). The body weight and body length were significantly decreased in the homozygous mutants (Figure 3D,E). At 180 dpf, the lens of gata2a homozygous mutants were smaller and less transparent than that of WT. Lens degeneration was observed at 360 dpf, which led to blindness in adulthood (Figure 3F). At 5, 10, 25 and 45 dpf, there were no significant differences in axial length and lens diameter between mutants and WT (Figure 3G,H). In gata2a homozygous mutants, the eye axial length and lens diameter significantly decreased at 90, 150, 240 and 360 dpf. Consistently, the eye axial length and lens diameter from the small eyes (gata2a+/−-s) also significantly decreased at those developmental stages compared to that of big eyes (gata2a+/−-b) in the heterozygous mutants with unilateral microphthalmia (Figure 3G,H).

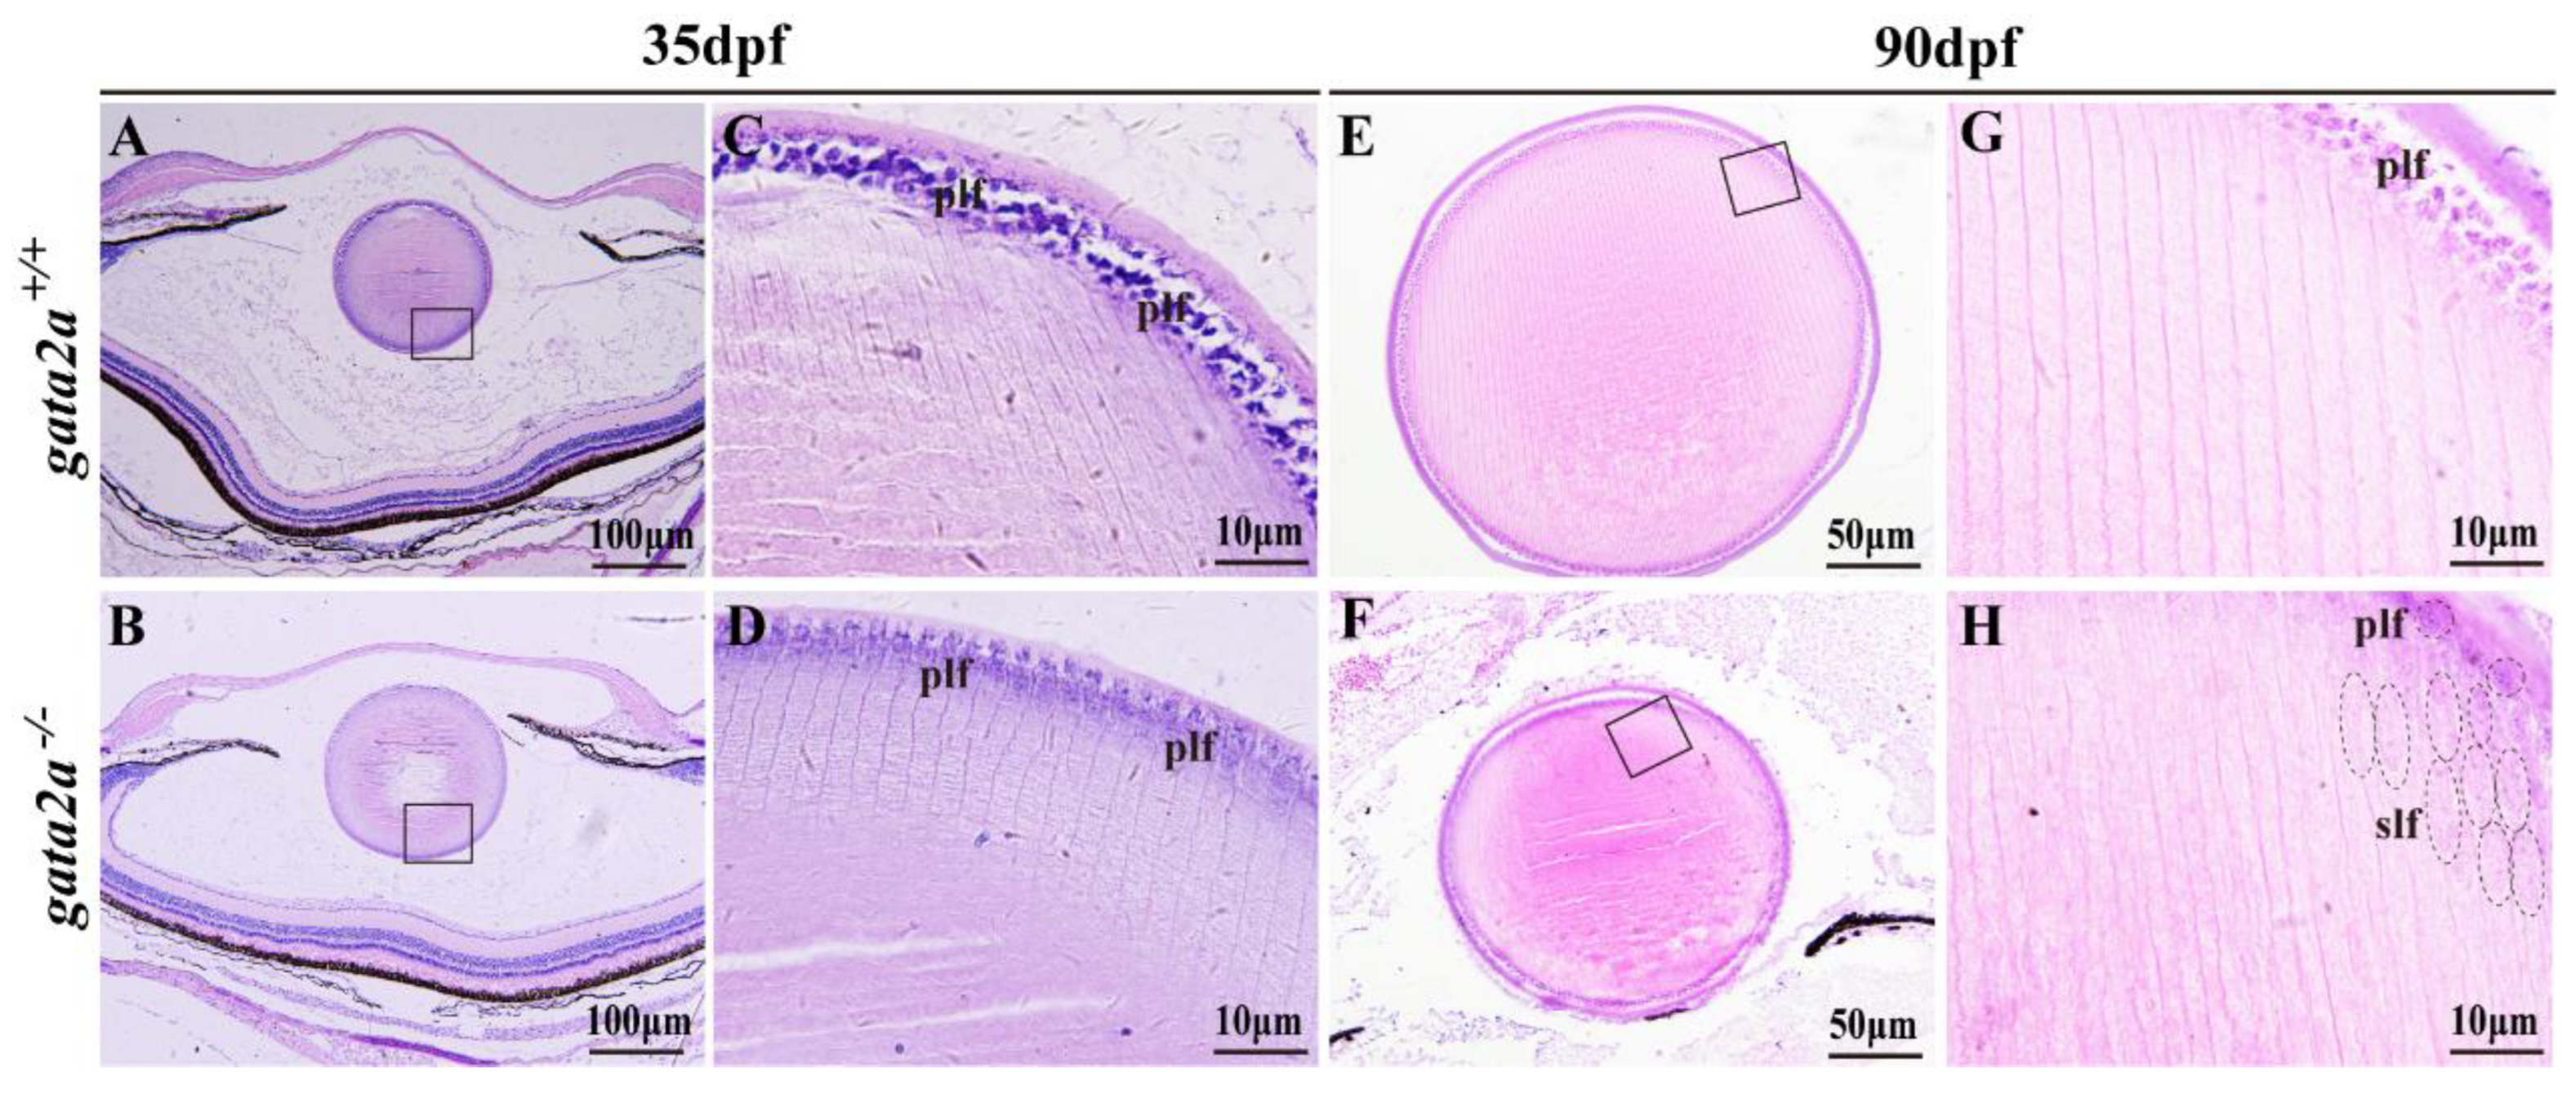
2.4. Gata2a Mutation Disrupts the Development of the Lens Fiber Cells

Histological analysis of the lens at 35 dpf showed that most of the primary lens fiber cells in the gata2a mutants were degenerated compared with those of the WT (Figure 4A–D). At 90 dpf, compared with WT, gata2a mutants had a smaller lens and were opaque vitreous (Figure 4E,F). In the gata2a mutants, the primary lens fiber cells also largely degenerated, and compared with the WT, the fibers were discontinuous and disordered. Moreover, the degradation of fiber cell nuclei, a marker for terminal differentiation of secondary lens fiber cells, did not take place in some of the secondary lens fiber cells of the gata2a mutants. This starkly contrasted with the normal lens development in the WT siblings (Figure 4G,H).

2.5. Gata2a Mutation Down-Regulates Genes Related to Crystallin Synthesis and Up-Regulates Genes Related to Visual Perception and Iron Ion Binding

To determine how Gata2a transcriptionally regulates lens morphogenesis in Nile tilapia, we conducted high-throughput RNA sequencing (RNA-Seq) analysis to assess gata2a mutation-induced changes in the eye transcriptome at 35 dpf. Comparative analysis showed that 1982 and 1633 genes were downregulated and upregulated in the eyes, respectively, after the gata2a mutation (Figure 5A,B). Kyoto Encyclopedia of Genes and Genomes (KEGG) enrichment analysis showed that these differentially expressed genes were mainly enriched in the pathways related to visual and sensory perception and iron ion homeostasis (Figure 5C). Expression of the members of the Gata family was analyzed, and we found that the expression level of gata2a was significantly down-regulated, while gata1 and gata2b were up-regulated (Figure 5D). Notably, we found that the expression of the member of crystallin family genes, including the α- crystallin coding genes cryaa and cryab, the β-crystallin coding genes cryba1/2, crybb1a/b, cryba2, crybb2 and crybb3a, and some of the γ-crystallin coding genes crygm1, crygm2a/2b and crygm3a/b, were significantly down-regulated in the eyes of gata2a−/− fish (Figure 5E). In contrast, the opsin-related genes, including ropn, gopn2, gopn3, bopn and opn3, and members of the iron ion binding genes hepc, hepcl1/2/3/4/5/6/7, were significantly up-regulated in the eyes of gata2a−/− fish (Figure 5F).

3. Discussion

In the present study, we demonstrated that Gata2a expression began in the fiber cell mass of the developing lens, and continued to be expressed in primary and secondary fiber cells throughout lens development. Consistent with its spatiotemporal expression in the developing lens, the absence of gata2a led to the death of primary fiber cells, resulting in progressive microphthalmia and blindness.
The GATA family of zinc finger domain transcription factors in vertebrates includes six members, GATA1-6, which all bind to a consensus ‘‘A/T-GATA-A/G’’ DNA motif [30]. GATA factors are important for the development of several organs controlling proliferation, differentiation and movement, as well as cell-fate specification [20]. Among the six GATA members, GATA2 is the most widely studied because of its important role in the hematopoietic system. Teleost fish have undergone a third whole genome duplication (3R) specific to their lineage, resulting in the retention of multiple gene paralogs. However, only Gata2 of the six members retains two paralogons in teleosts [2]. In tongue sole (Cynoglossus semilaevis) and Japanese flounder (Paralichthys olivaceus), selection pressure analysis predicted that these gene duplicates experienced purification selection and possible neo-functionalization [2]. In this study, we found that gata2a plays an important role in lens morphogenesis, which has not been previously reported. A study in mice showed that another member of the GATA family, GATA3, is also essential for the development of the lens [31]. Phylogenetic analysis showed that Gata3 and Gata2a/b of teleosts were clustered into two independent branches with GATA3 and GATA2 of other vertebrates, respectively, indicating that GATA2 and GATA3 independently evolved (Figure S4) [2]. In the present study, gata1 and gata2b were up-regulated in the gata2a homozygous mutants, while gata3 was not. These results suggest that lens defects caused by gata2a mutation in Nile tilapia are not related to gata3. The up-regulation of gata2b expression in gata2a homozygous mutants suggests that gata2b may compensate for the absence of gata2a, but further investigations are needed to provide more evidence in future studies. Whether Gata3 also participates in the development of teleost lens remains to be studied.
Regulation of cell cycle by GATA factors has been reported in many different tissues. Studies have shown that neural epithelial cells of GATA2-deficient mouse embryos exhibit abnormal proliferation, and overexpression of GATA2 induces neural differentiation by inhibiting the proliferation of neural progenitor cells [32]. In erythroid cell differentiation, GATA1 has been reported to induce erythro-megakaryotic differentiation by suppressing the active cell cycle of hematopoietic progenitor cells [33]. GATA-3 has been reported to suppress the abnormal proliferation of mesonephric cells, as well as mammary epithelial cells [34]. Conditional deletion of GATA-3 in mice resulted in an abnormal cell cycle and the failure of lens fiber cell differentiation [31]. These reports and current observations suggest that the death of lens fiber cells caused by the gata2a mutation may be related to the abnormal cell cycle.
Crystallin proteins, which make up about 90% of the water-soluble protein, are highly concentrated and densely packed structural proteins of lens fiber cells [35,36,37]. The differentiation of lens fiber cells is also characterized by the expression and accumulation of crystallins. If these proteins aggregate, the light-scattering aggregate formed is called a cataract, the most common cause of blindness [35]. Of the crystallin subtypes, α-crystallins are normally expressed in both lens epithelial and fiber cells, and are also powerful inhibitors of lens fiber cell apoptosis [11,38,39]. In the gata2a homozygous mutants, most of the α-crystallins were down-regulated, which may lead to the apoptosis of lens fiber cells. During differentiation, mature lens fiber cells produce abundant β- and γ-crystallins [36]. β-crystallin expression, which begins at E11 in the mouse embryo, serves as an early marker of fiber cell differentiation [40,41,42]. We showed here that expressions of all the α- and β-crystallin coding genes were significantly down-regulated in the lens of gata2a homozygous mutants. These data indicated that disrupted lens fiber cell differentiation in the gata2a homozygous mutants may be attributed to the down-regulation of α- and β-crystallin gene expression. Changes in metal ions could also affect the extracellular matrix, and an accumulation of iron ion contributed to cataractogenesis [37,43]. In gata2a homozygous mutants, the expression of visual perception and iron ion binding-related genes was up-regulated, which may lead to the accumulation of metal ions in the lens, thus leading to the occurrence of cataracts and blindness.
In conclusion, we demonstrated here that Gata2a was specifically expressed in primary and secondary fiber cells of the lens, and played an essential role in normal lens morphogenesis. Loss of gata2a resulted in the death of primary lens fiber cells, and progressive microphthalmia and blindness. Further studies will be necessary to determine how Gata2a functionally coordinates cell cycle with normal development of the lens fiber cells. Given that gata2a mutation altered the expression of genes associated with crystallin synthesis and visual perception and iron ion binding, it will also be of interest to establish a link from these genes to lens morphogenesis in Nile tilapia. In addition, how gata2a regulates the transcription of its downstream targets remains to be further investigated.

4. Materials and Methods

4.1. Animals

The founder strain of Nile tilapia (Oreochromis niloticus) was obtained from Japan (introduced from Egypt in Africa, 1970s), and kept in recirculating freshwater tanks at 26 °C under natural photoperiod. Experimental fish were reared in glass tanks in recirculating aerated freshwater with approximately pH 7.5 at 26 °C under natural photoperiod conditions and appropriate rearing density, namely 100 fish (10 dpf), 30 fish (60 dpf), 20 fish (90 dpf) and 7 fish (180 dpf) in 60 L fish tanks. Three adult normal females (XX) and three normal males (XY) (mean body weight 0.5 kg, mean total length 28 cm) were mated to obtain the fertilized eggs for injection. The use of animals was in accordance with the regulations of the ethics committee of Southwest University (No. IACUC-20181015-12, 15 October 2018).

4.2. Construction of Gata2a and Gata2b Homozygous Mutants by CRISPR/Cas9

The sequences of the Nile tilapia gata2a (Gene ID: 100705840) and gata2b gene (Gene ID: 100697130) were obtained from NCBI. The Nile tilapia gata2a mutants were generated with the CRISPR/Cas9 approach as previously described [44]. The gRNA (250 ng/μL) and Cas9 mRNA (500 ng/μL) were co-injected into one-cell stage embryos with a microinjection system (WPI PV830, Sarasota, FL, USA). The injected embryos were incubated in an incubator at 26 °C, and were transferred to a glass tank after hatching (10 dpf). F0 mutants were screened by restriction enzyme digestion and Sanger sequencing. Heterozygous mutants of gata2a and gata2b were generated by crossing the F0 gata2a or gata2b mutant males with normal females. Then, male and female fish with the same heterozygous gata2a or gata2b mutation were crossed to generate homozygous gata2a and gata2b mutants. Polyacrylamide gel electrophoresis (PAGE)-based heteroduplex mobility assays, restriction enzyme digestion and Sanger sequencing were performed to screen homozygous mutants. Three pairs (males and females) of heterozygous mutant fish of F1 generation were mated to produce F2 generation homozygous mutant fish. Each pair of the F1 generation can obtain about 150 F2 mutant fish at one mating, among which about 20 surviving homozygous mutant fish can be obtained. Each F1 pair should be mated at least three times. As for the gata2a F2 homozygous mutants, restriction endonuclease (HinfI) were used for the genotyping instead of PAGE. As for the gata2b F2 homozygous mutants, there was no valid restriction endonuclease. In addition, PAGE electrophoresis is difficult to distinguish homozygous mutants from wild types due to small differences in base numbers (two base pairs). Therefore, PAGE can only identify heterozygous mutants, while homozygous mutants and wild types are identified by PCR product sequencing. The primers used in this study are listed in Supplementary Table S1.

4.3. Immunofluorescence

Nile tilapia larvae were collected at 5 (10 fish, 5 males and 5 females) and 30 dpf (6 fish, 3 males and 3 females), and eyes were isolated from Nile tilapia at 90 dpf (6 fish, 3 males and 3 females). The larvae and the eyes were subsequently fixed in 4% paraformaldehyde at 4 °C. Each sample was dehydrated, embedded in paraffin wax and sectioned at 5 μm. The sections were deparaffinized, hydrated and then stained with rabbit anti-Gata2a antibody (1:500; peptide antigen: KPGLHPAGSGYPCSSS) and then incubated with goat anti-rabbit Alexa Fluor Plus 594 (1:1000; Invitrogen, Carlsbad, CA, USA). Gata2a antibody was produced by a company (Abiotech, Jinan, China). Then, 4′,6′-Diamidine-2-phenylindole-dihydrochloride (DAPI) (Invitrogen, Carlsbad, CA, USA) was used for nuclear staining. Images were captured under a laser confocal microscope (Olympus FV3000, Tokyo, Japan).

4.4. Western Blot

Total protein was extracted from mutants and WT eyes at 60 dpf. The protein lysates were resolved by SDS/PAGE on 12% Tris·glycine gels followed by transfer to nitrocellulose membrane. Unspecific binding was blocked with 5% BSA in Tris-buffered saline with Tween-20 (TBST) for 1 h at room temperature. Incubation with Gata2a antibody at a dilution of 1:500 was performed overnight at 4 °C. After washing with TBST three times, the membrane was incubated with HRP-conjugated secondary antibody (Invitrogen, Carlsbad, CA, USA, 1:1000) in blocking solution for 1 h. The abundance of α-Tubulin was examined as a loading control using rabbit anti-α-Tubulin (Cell Signaling Technology, Beverly, MA, USA) at a dilution of 1:1000. Signal was detected with Pierce™ ECL Western Blotting Substrate (Invitrogen, Carlsbad, CA, USA) and was visualized on a Fusion FX7 (Vilber Lourmat, East Sussex, France).

4.5. Transcriptome Sequencing and Analysis

Eyes from at least three fish were separately harvested from WT and gata2a homozygous mutants at 35 dpf, and three biological replicates were performed. Total RNA was extracted from each sample using TRIzol reagent (Thermo Fisher Scientific, Waltham, MA, USA). Six libraries were constructed, including three WT fish libraries and three mutant libraries, and sequenced with Illumina NGS system (Personal Biotech, Nanjing, China). All clean reads were mapped to the tilapia genome sequence (https://www.ncbi.nlm.nih.gov/genome/?term=Niletilapia, 2 May 2017). The fragments per kilobase of exon per million fragments mapped (FPKM) method was used to calculate gene expression levels. The differentially expressed genes (DEGs) were classified according to the following criteria: genes meeting both “p value < 0.05” and “log2 (gata2a−/−_FPKM/WT_FPKM) > 1” statistical criteria were classified as up-regulated genes; in contrast, genes meeting both “p value < 0.05” and “log2 (gata2a−/−_FPKM/WT_FPKM) < −1” were classified as down-regulated genes. All the raw data were deposited in the NCBI Short Read Archive (accession number: PRJNA905808).

4.6. Histological Analysis

Larvae and eyes from WT (three fish for each age stage, one male and two females) and gata2a mutants (three fish for each age stage, one male and two females) were fixed in Bouin’s solution for 24 h at room temperature, and were then dehydrated and embedded in paraffin. The prepared samples were cross-sectioned at 5 μm, and each section was stained with hematoxylin and eosin. Images were captured with an Olympus BX51 light microscope (Olympus, Tokyo, Japan).

4.7. Real-Time PCR

Total RNAs were extracted from all samples using a column-based RNA extraction kit (Qiagen) specialized for small quantities of RNA. DNase I (RNase free) treatment and cDNA preparation were carried out according to the manufacturer’s instructions. Total RNA was directly used as a template for PCR as negative control to exclude the genomic DNA contamination. Real-time PCR was performed with Fast SYBR Green Master Mix (Takara) on a 7500Fast Real-Time PCR system (Applied Biosystems, Waltham, MA, USA). Primers were designed to target regions of the genome with gata2a and gata2b mutations. β-actin was used as the internal control. The relative abundance of target gene mRNA transcripts was evaluated using the formula: R = 2−ΔΔCt. At least three samples for each genotype were analyzed. Primer sequences used for real-time PCR are listed in Table of the Supplementary Data.

4.8. Data Analyses

All data were presented as the mean ± SD from at least three independent experiments. Statistical comparisons were made using Student’s t-test when comparing two groups. One-way ANOVA was performed for comparisons with more than two groups followed by Tukey’s test. Statistical analyses were performed using GraphPad Prism 8 (GraphPad Software, La Jolla, CA, USA). In all analyses, a value of p < 0.05 was considered to be statistically significant.

Supplementary Materials

The supporting information can be downloaded at: https://www.mdpi.com/article/10.3390/ijms24043567/s1.

Author Contributions

Conceptualization, D.W. and X.L.; investigation, L.Z., W.L. and J.W.; writing—original draft preparation, X.L.; writing—review and editing, D.W. and X.L. All authors have read and agreed to the published version of the manuscript.

Funding

This work was supported by the National Natural Science Foundation of China (grant numbers: 31872556; 31861123001 and 32102780); the Chongqing Science and Technology Commission (grant number: cstc2021jcyj-msxmX0615; cstc2021ycjh-bgzxm0024 and CQYC201903173).

Institutional Review Board Statement

Animal experiments were conducted in accordance with the regulations of the Guide for Care and Use of Laboratory Animals and were approved by the Committee of Laboratory Animal Experimentation at Southwest University, China. (No. IACUC-20181015-12, 15 October 2018).

Informed Consent Statement

Not applicable.

Data Availability Statement

The RNA-seq data used in this study have been deposited in the NCBI Short Read Archive under the accession number PRJNA905808.

Acknowledgments

We thank Minghui Li (Southwest University, People’s Republic of China) for his guidance in this study.

Conflicts of Interest

The authors declare no conflict of interest.

Abbreviations

DpfDay post fertilization
PlfPrimary lens fiber cells
SlfSecondary lens fiber cells
Epepithelial cell
PAMprotospacer adjacent motif
KEGGKyoto Encyclopedia of Genes and Genomes
DEGsdifferentially expressed genes
FDRfalse discovery rate
DAPI4′,6′-diamidine-2-phenylindole-dihydrochloride
WTwild type

References

  1. Cvekl, A.; Ashery-Padan, R. The cellular and molecular mechanisms of vertebrate lens development. Development 2014, 141, 4432–4447. [Google Scholar] [CrossRef] [PubMed]
  2. Liu, J.; Jiang, J.; Wang, Z.; He, Y.; Zhang, Q. Origin and evolution of GATA2a and GATA2b in teleosts: Insights from tongue sole, Cynoglossus semilaevis. PeerJ 2016, 4, e1790. [Google Scholar] [CrossRef] [PubMed]
  3. Miesfeld, J.B.; Brown, N.L. Eye organogenesis: A hierarchical view of ocular development. Curr. Top Dev. Biol. 2019, 132, 351–393. [Google Scholar] [PubMed]
  4. Graw, J. Mouse models for microphthalmia, anophthalmia and cataracts. Hum. Genet. 2019, 138, 1007–1018. [Google Scholar] [CrossRef]
  5. Hejtmancik, J.F.; Shiels, A. Overview of the Lens. Prog. Mol. Biol. Transl. Sci. 2015, 134, 119–127. [Google Scholar]
  6. Berry, V.; Ionides, A.; Pontikos, N.; Georgiou, M.; Yu, J.; Ocaka, L.A.; Moore, A.T.; Quinlan, R.A.; Michaelides, M. The genetic landscape of crystallins in congenital cataract. Orphanet J. Rare Dis. 2020, 15, 333. [Google Scholar] [CrossRef]
  7. Beyer, E.C.; Ebihara, L.; Berthoud, V.M. Connexin mutants and cataracts. Front. Pharmacol. 2013, 4, 43. [Google Scholar] [CrossRef]
  8. Pei, R.; Liang, P.-F.; Ye, W.; Li, J.; Ma, J.-Y.; Zhou, J. A novel mutation of LIM2 causes autosomal dominant membranous cataract in a Chinese family. Int. J. Ophthalmol. 2020, 13, 1512–1520. [Google Scholar] [CrossRef]
  9. Anand, D.; Agrawal, S.A.; Slavotinek, A.; Lachke, S.A. Mutation update of transcription factor genes FOXE3, HSF4, MAF, and PITX3 causing cataracts and other developmental ocular defects. Human Mutat. 2018, 39, 471–494. [Google Scholar] [CrossRef]
  10. Song, S.; Landsbury, A.; Dahm, R.; Liu, Y.; Zhang, Q.; Quinlan, R.A. Functions of the intermediate filament cytoskeleton in the eye lens. J. Clin. Investig. 2009, 119, 1837–1848. [Google Scholar] [CrossRef]
  11. Greiling, T.M.S.; Aose, M.; Clark, J.I. Cell fate and differentiation of the developing ocular lens. Invest. Ophthalmol. Vis. Sci. 2010, 51, 1540–1546. [Google Scholar] [CrossRef] [Green Version]
  12. Bassnett, S. On the mechanism of organelle degradation in the vertebrate lens. Exp. Eye Res. 2009, 88, 133–139. [Google Scholar] [CrossRef]
  13. Wormstone, I.M.; Wride, M.A. The ocular lens: A classic model for development, physiology and disease. Philos. Trans. R Soc. Lond. B Biol. Sci. 2011, 366, 1190–1192. [Google Scholar] [CrossRef]
  14. Hejtmancik, J.F.; Riazuddin, S.A.; McGreal, R.; Liu, W.; Cvekl, A.; Shiels, A. Lens Biology and Biochemistry. Prog. Mol. Biol. Transl. Sci. 2015, 134, 169–201. [Google Scholar]
  15. Dahm, R.; Schonthaler, H.B.; Soehn, A.S.; van Marle, J.; Vrensen, G.F. Development and adult morphology of the eye lens in the zebrafish. Exp. Eye Res. 2007, 85, 74–89. [Google Scholar] [CrossRef]
  16. Audette, D.S.; Scheiblin, D.A.; Duncan, M.K. The molecular mechanisms underlying lens fiber elongation. Exp. Eye Res. 2017, 156, 41–49. [Google Scholar] [CrossRef]
  17. Vorontsova, I.; Gehring, I.; Hall, J.E.; Schilling, T.F. Aqp0a Regulates Suture Stability in the Zebrafish Lens. Invest. Ophthalmol. Vis. Sci. 2018, 59, 2869–2879. [Google Scholar] [CrossRef]
  18. Wride, M.A. Lens fibre cell differentiation and organelle loss: Many paths lead to clarity. Philos. Trans. R Soc. Lond. B Biol. Sci. 2011, 366, 1219–1233. [Google Scholar] [CrossRef]
  19. Costello, M.J.; Brennan, L.A.; Basu, S.; Chauss, D.; Mohamed, A.; Gilliland, K.O.; Johnsen, S.; Menko, A.S.; Kantorow, M. Autophagy and mitophagy participate in ocular lens organelle degradation. Exp. Eye Res. 2013, 116, 141–150. [Google Scholar] [CrossRef]
  20. He, C.; Cheng, H.; Zhou, R. GATA family of transcription factors of vertebrates: Phylogenetics and chromosomal synteny. J. Biosci. 2007, 32, 1273–1280. [Google Scholar] [CrossRef]
  21. Charles, M.A.; Saunders, T.L.; Wood, W.M.; Owens, K.; Parlow, A.F.; Camper, S.A.; Ridgway, E.C.; Gordon, D.F. Pituitary-specific Gata2 knockout: Effects on gonadotrope and thyrotrope function. Mol. Endocrinol. 2006, 20, 1366–1377. [Google Scholar] [CrossRef] [PubMed]
  22. Nozawa, D.; Suzuki, N.; Kobayashi-Osaki, M.; Pan, X.; Engel, J.D.; Yamamoto, M. GATA2-dependent and region-specific regulation of Gata2 transcription in the mouse midbrain. Genes Cells 2009, 14, 569–582. [Google Scholar] [CrossRef] [PubMed]
  23. Hsu, A.P.; McReynolds, L.J.; Holland, S.M. GATA2 deficiency. Curr. Opin. Allergy Clin. Immunol. 2015, 15, 104–109. [Google Scholar] [CrossRef] [PubMed]
  24. Vinh, D.C.; Patel, S.Y.; Uzel, G.; Anderson, V.L.; Freeman, A.F.; Olivier, K.N.; Spalding, C.; Hughes, S.; Pittaluga, S.; Raffeld, M.; et al. Autosomal dominant and sporadic monocytopenia with susceptibility to mycobacteria, fungi, papillomaviruses, and myelodysplasia. Blood 2009, 115, 1519–1529. [Google Scholar] [CrossRef] [PubMed]
  25. Bigley, V.; Collin, M. Dendritic cell, monocyte, B and NK lymphoid deficiency defines the lost lineages of a new GATA-2 dependent myelodysplastic syndrome. Haematologica 2011, 96, 1081–1083. [Google Scholar] [CrossRef]
  26. Hahn, C.N.; Chong, C.E.; Carmichael, C.L.; Wilkins, E.J.; Brautigan, P.J.; Li, X.C.; Babic, M.; Lin, M.; Carmagnac, A.; Lee, Y.K.; et al. Heritable GATA2 mutations associated with familial myelodysplastic syndrome and acute myeloid leukemia. Nat. Genet. 2011, 43, 1012–1017. [Google Scholar] [CrossRef]
  27. Tsai, F.-Y.; Keller, G.; Kuo, F.C.; Weiss, M.; Chen, J.; Rosenblatt, M.; Alt, F.W.; Orkin, S.H. An early haematopoietic defect in mice lacking the transcription factor GATA-2. Nature 1994, 371, 221–226. [Google Scholar] [CrossRef]
  28. Peña, O.A.; Lubin, A.; Rowell, J.; Hoade, Y.; Khokhar, N.; Lemmik, H.; Mahony, C.; Dace, P.; Umamahesan, C.; Payne, E.M. Differential Requirement of Gata2a and Gata2b for Primitive and Definitive Myeloid Development in Zebrafish. Front. Cell. Dev. Biol. 2021, 9, 708113. [Google Scholar] [CrossRef]
  29. Gioacchino, E.; Koyunlar, C.; Zink, J.; de Looper, H.; de Jong, M.; Dobrzycki, T.; Mahony, C.B.; Hoogenboezem, R.; Bosch, D.; van Strien, P.M.H.; et al. Essential role for Gata2 in modulating lineage output from hematopoietic stem cells in zebrafish. Blood Adv. 2021, 5, 2687–2700. [Google Scholar] [CrossRef]
  30. Leonard, M.; Lim, K.; Engel, J. Expression of the chicken GATA factor family during early erythroid development and differentiation. Development 1993, 119, 519–531. [Google Scholar] [CrossRef]
  31. Maeda, A.; Moriguchi, T.; Hamada, M.; Kusakabe, M.; Fujioka, Y.; Nakano, T.; Yoh, K.; Lim, K.C.; Engel, J.D.; Takahashi, S. Transcription factor GATA-3 is essential for lens development. Dev. Dyn. 2009, 238, 2280–2291. [Google Scholar] [CrossRef]
  32. El Wakil, A.; Francius, C.; Wolff, A.; Pleau-Varet, J.; Nardelli, J. The GATA2 transcription factor negatively regulates the proliferation of neuronal progenitors. Development 2006, 133, 2155–2165. [Google Scholar] [CrossRef] [Green Version]
  33. Crispino, J.D. GATA1 in normal and malignant hematopoiesis. Semin. Cell Dev. Biol. 2005, 16, 137–147. [Google Scholar] [CrossRef]
  34. Grote, D.; Souabni, A.; Busslinger, M.; Bouchard, M. Pax 2/8-regulated Gata3 expression is necessary for morphogenesis and guidance of the nephric duct in the developing kidney. Development 2006, 133, 53–61. [Google Scholar] [CrossRef]
  35. Ghosh, K.S.; Chauhan, P. Crystallins and Their Complexes. Subcell Biochem. 2019, 93, 439–460. [Google Scholar]
  36. Slingsby, C.; Wistow, G.J. Functions of crystallins in and out of lens: Roles in elongated and post-mitotic cells. Prog. Biophys Mol. Biol. 2014, 115, 52–67. [Google Scholar] [CrossRef]
  37. Domínguez-Calva, J.A.; Pérez-Vázquez, M.L.; Serebryany, E.; King, J.A.; Quintanar, L. Mercury-induced aggregation of human lens γ-crystallins reveals a potential role in cataract disease. J. Biol. Inorg. Chem. 2018, 23, 1105–1118. [Google Scholar] [CrossRef]
  38. Rao, P.V.; Maddala, R. The role of the lens actin cytoskeleton in fiber cell elongation and differentiation. Semin. Cell Dev. Biol. 2006, 17, 698–711. [Google Scholar] [CrossRef]
  39. Rocha, M.A.; Kwok, A.O.; Martin, R.W. α-Crystallins in the Vertebrate Eye Lens: Complex Oligomers and Molecular Chaperones. Annu. Rev. Phys. Chem. 2021, 72, 143–163. [Google Scholar]
  40. Nishiguchi, S.; Wood, H.; Kondoh, H.; Lovell-Badge, R.; Episkopou, V. Sox1 directly regulates the gamma-crystallin genes and is essential for lens development in mice. Genes Dev. 1998, 12, 776–781. [Google Scholar] [CrossRef]
  41. Goring, D.; Breitman, M.L.; Tsui, L.-C. Temporal regulation of six crystallin transcripts during mouse lens development. Exp. Eye Res. 1992, 54, 785–795. [Google Scholar] [CrossRef] [PubMed]
  42. Ring, B.; Cordes, S.; Overbeek, P.; Barsh, G. Regulation of mouse lens fiber cell development and differentiation by the Maf gene. Development 2000, 127, 307–317. [Google Scholar] [CrossRef] [PubMed]
  43. Avunduk, A.; Yardimci, S.; Avunduk, M.; Kurnaz, L.; Koçkar, M. Determinations of some trace and heavy metals in rat lenses after tobacco smoke exposure and their relationships to lens injury. Exp. Eye Res. 1997, 65, 417–423. [Google Scholar] [CrossRef] [PubMed]
  44. Li, M.; Yang, H.; Zhao, J.; Fang, L.; Shi, H.; Li, M.; Sun, Y.; Zhang, X.; Jiang, D.; Zhou, L.; et al. Efficient and heritable gene targeting in tilapia by CRISPR/Cas9. Genetics 2014, 197, 591–599. [Google Scholar] [CrossRef] [Green Version]
Figure 1. Expression pattern of Gata2a in the lens of Nile tilapia at different developmental stages. (AC’) Expression of Gata2a was detected in the fiber cell mass of the lens from larvae at 5 dpf. (DF’) Gata2a expression was detected in the nucleus of primary and secondary (anterior and posterior elongating) lens fiber cells, most prominently in the primary lens fiber cell near the equatorial zone where differentiation first initiates, from juvenile at 30 dpf. (GI’) Gata2a was consistently detected in the nuclei of primary fiber cells along the equatorial zone of the lens at 90 dpf. (C’,F’) was the higher magnification fluorescent micrograph of the boxed region shown in (C,F), respectively. dpf: day post fertilization. ep: epithelial cell; plf: primary lens fiber cell; slf: secondary lens fiber cell.
Ijms 24 03567 g001
Figure 2. Generation of tilapia gata2a mutant line by CRISPR/Cas9. (A) Schematic diagram showing gata2a gene structure and sgRNA target site near the translation start site on the antisense strand. (B,C) Generation of the gata2a mutant line. Mutations at the gata2a locus were analyzed by restriction enzyme digestion (B) and DNA sequencing (C). Deletions are indicated by dashes (C). The numbers in brackets represent the bases deleted/inserted from each allele. (D) Identification of F2 genotypes by restriction enzyme digestion assay. Homozygous mutants with different mutation types (+5 bp and −7 bp) were obtained. (E) Sequencing results of the gata2a gene from WT and homozygous mutant fish. (F) Western blot was carried out to show the specificity of the antibody against Gata2a. (G) Immunofluorescence was used to test the specificity of the Gata2a antibody. Scale bar: 50 μm. M, marker; PAM, protospacer adjacent motif.
Ijms 24 03567 g002
Figure 3. Morphological analysis of tilapia gata2a mutants at 90 dpf. (A) Morphology of gata2a mutants. (B) Proportions of the fish with microphthalmia in the F2 generation. (C) Eyes morphology of the gata2a mutants at 90 dpf. The presence of small eyes on the left or right side is random in gata2a+/− fish. (D,E) Body weight and body length (sample size: homozygous mutants, n = 8, heterozygous mutants, n = 50, wt, n = 23). (F) Eye morphology of gata2a homozygous mutants at 180 and 360 dpf. (G,H) Eyes axial length and lens diameter. Data are expressed as the mean ± SD. One-way ANOVA was performed followed by Tukey’s test. Different letters above the error bar indicate significant differences at p < 0.05. dpf: day post fertilization. “gata2a+/−-s” and “gata2a+/−-b” represents eyes from gata2a heterozygous mutants with unilateral micropgthalmia (s, small eye; b, big eye).
Ijms 24 03567 g003
Figure 4. Histological analysis of the eyes from WT and gata2a mutants at 35 and 90 dpf. (AD) Histology of the eyes at 35 dpf, the size of the lens from gata2a mutants were similar to that of WT (A,B), while most of the primary lens fiber cells were degenerated (C,D). (EH) Lens from gata2a mutants were smaller and opaque compared to those from WT siblings (E,F). Most of the primary lens fiber cells in the gata2a mutants were degenerated, and the nuclei were not degraded in some of the secondary lens fiber cells (G,H). (C,D,G,H) are magnifications of the boxed areas in (A,B,G,H), respectively. dpf: day post fertilization. plf: primary lens fiber cell; slf: secondary lens fiber cell. The dotted circles and ellipses in the (H) diagram represent primary and secondary lens fiber cells, respectively.
Ijms 24 03567 g004
Figure 5. Comparative transcriptomic analysis of genes and molecular pathways dysregulated in gata2a−/− eyes. (A) Heatmap displaying difference in gene expression between eyes from WT (gata2a+/+) and gata2a mutants (gata2a−/−) at 35 dpf. (B) Volcanic map of differentially expressed genes (DEGs) between the eyes from WT and gata2a mutants. A total of 1982 and 1633 genes were downregulated and upregulated, respectively, in the eyes from gata2a mutants compared with the eyes from WT fish. (C) Scatter plot of the enriched KEGG pathways for the DEGs. The sizes and colors of the dots represent the number of genes and the significance of the difference, respectively. (D) Effects of gata2a mutation on gene expression of the gata family. (E,F) Gata2a mutation down-regulated crystallin family genes (E), and up-regulated visual perception and iron ion binding-related genes (F) in the eyes. Data were presented as the mean ± SD of triplicates. Differences between groups were statistically examined with two-tailed unpaired Student’s t-test. Significant difference is denoted by * (p < 0.01), ** (p < 0.001) and *** (p < 0.0001).
Ijms 24 03567 g005
Disclaimer/Publisher’s Note: The statements, opinions and data contained in all publications are solely those of the individual author(s) and contributor(s) and not of MDPI and/or the editor(s). MDPI and/or the editor(s) disclaim responsibility for any injury to people or property resulting from any ideas, methods, instructions or products referred to in the content.

