Article

Cyanidin-3-O-glucoside Contributes to Leaf Color Change by Regulating Two bHLH Transcription Factors in Phoebe bournei

State Key Laboratory of Subtropical Silviculture, School of Forestry & Biotechnology, Zhejiang A&F University, Lin’an, Hangzhou 311300, China
*
Authors to whom correspondence should be addressed.
These authors contributed equally to this work.
Int. J. Mol. Sci. 2023, 24(4), 3829; https://doi.org/10.3390/ijms24043829
Submission received: 13 January 2023 / Revised: 9 February 2023 / Accepted: 12 February 2023 / Published: 14 February 2023
(This article belongs to the Section Molecular Genetics and Genomics)

Abstract

:
Anthocyanins produce different-colored pigments in plant organs, which provide ornamental value. Thus, this study was conducted to understand the mechanism of anthocyanin synthesis in ornamental plants. Phoebe bournei, a Chinese specialty tree, has high ornamental and economic value due to its rich leaf color and diverse metabolic products. Here, the metabolic data and gene expression of red P. bournei leaves at the three developmental stages were evaluated to elucidate the color-production mechanism in the red-leaved P. bournei species. First, metabolomic analysis identified 34 anthocyanin metabolites showing high levels of cyanidin-3-O-glucoside (cya-3-O-glu) in the S1 stage, which may suggest that it is a characteristic metabolite associated with the red coloration of the leaves. Second, transcriptome analysis showed that 94 structural genes were involved in anthocyanin biosynthesis, especially flavanone 3′-hydroxy-lase (PbF3′H), and were significantly correlated with the cya-3-O-glu level. Third, K-means clustering analysis and phylogenetic analyses identified PbbHLH1 and PbbHLH2, which shared the same expression pattern as most structural genes, indicating that these two PbbHLH genes may be regulators of anthocyanin biosynthesis in P. bournei. Finally, overexpression of PbbHLH1 and PbbHLH2 in Nicotiana tabacum leaves triggered anthocyanin accumulation. These findings provide a basis for cultivating P. bournei varieties that have high ornamental value.

1. Introduction

Leaf color is essential for the ornamental value of horticultural plants. Previous studies have shown that plant pigmentation is mainly attributed to the accumulation of anthocyanins, carotenoids, and chlorophyll, of which anthocyanins are the primary pigment responsible for the red color in leaves [1,2]. Cyanidin (Cya), pelargonidin (Pel), and delphinidin (Del) are the three most common anthocyanins found in nature and are responsible for the red, orange, and blue colors in plant tissues, respectively [3]. Plant anthocyanins are processed by glycosidic modification, and the most common glycoside modifications are glucose, galactose, rhamnose, xylose, arabinose, and fructose [4]. Glycosylation of anthocyanins improves their water solubility and stability and also serves as a signal for anthocyanins to undergo targeted transport to vesicles [5,6]. Glycosylation also has a significant effect on the color intensity produced by anthocyanins; for example, anthocyanins with a sugar molecule at the C3 site were observed to produce more intensely colored products than those with glycosylations at other positions [7]. Recently, an increasing number of anthocyanin modifiers have been discovered, and the main anthocyanin glycoside modifiers responsible for plant coloration are distinct in different plants. For example, the main anthocyanin modifiers responsible for fruit color were cya--3-O-rutinoside, cya-3-O-glucoside, and del-3-O-glucoside in Kadsura coccinea [8], while the main anthocyanins responsible for leaf color were malvidin-3-O-glucoside and petunidin-3-O-glucoside in Solanum tuberosum [9]. Therefore, elucidating the type and level of anthocyanin glycoside modifiers is a prerequisite for studying the coloring mechanism in plants.
Anthocyanins are synthesized through the flavonoid pathway under the regulation of several structural genes, which have been extensively studied in higher-order plants [10,11]. Anthocyanin biosynthesis begins with phenylalanine catabolism, which is catalyzed by phenylalanine ammonia-lyase (PAL) to cinnamic acid, followed by cinnamate 4 hydroxylase (C4H) and chalconeisomerase (CHI) to create 4-coumaroyl-CoA. Then, 4-coumaroyl-CoA is catalyzed by chalcone synthase (CHS) and chalcone isomerase (CHI) to naringenin, which is synthesized to Cya, Pel, and Del through flavanone 3-hydroxy-lase (F3H), flavanone 3’-hydroxy-lase (F3’H), flavanone 3’, 5’-hydroxy-lase (F3’5’H), dihydroflavonol 4-reductase (DFR), and anthocyanidin synthase (ANS) [12]. Finally, anthocyanins are glycosylated by UDP-glycose flavonoid glycosyltransferase (UFGT) and transferred to plant vesicles by glutathione S-transferase (GST) [13].
Previous studies have shown that these structural genes are synergistically regulated by the MYB-bHLH-WD40 (MBW) complex [14]. For example, the significantly downregulated expression levels of MYB from the S1 to the S2 stage may limit the flavonoid-anthocyanin biosynthetic pathway, resulting in reduced anthocyanin accumulation in Lagerstroemia indica leaves [2]. Moreover, MrWD40-1 interacts with MYB and bHLH to enhance anthocyanin accumulation in Myrica rubra [15]. In addition, other transcription factors (TFs) such as NAC [16], bZIP [17], WRKY, and ERF [18] are involved in anthocyanin regulation. These results suggested that TFs and structural genes have essential functions in anthocyanin biosynthesis.
Recently, the combined analysis of the high-throughput transcriptome and metabolome has provided insight into anthocyanin transcriptional regulation and metabolic changes. For example, in Cerasus humilis, a combined metabolomic and transcriptomic analysis revealed that cyanidin-O-syringic acid and pelargonidin-3-O-beta-d-glucoside contribute to fruit peel color change by ANS and UFGT [19]. Cyanidin 3-O-rutinoside and Pelargonidin 3-O-rutinoside are the major anthocyanins that control fruit color, and PtANS, PtUFGT, and PtGST11 are important structural genes for anthocyanin biosynthesis in Prunus tomentosa [20]. A similar study by Gao et al. showed that cyanidin 3,5-O-diglucoside is the main anthocyanin that contributes to red leaves and that PAL, ANS, DFR, and F3H are structural genes involved in leaf color production of Acer pseudosieboldianum [21]. There are also studies that show that the molecular mechanisms involved in leaf color changes vary in different species [22]. For example, two varieties of Camellia sinensis var. assamica, “Zijuan” and “Ziyan”, differ in the structural genes that regulate anthocyanin biosynthesis [23]. Therefore, it is necessary to study the molecular mechanisms behind leaf color change.
P. bournei is an evergreen tree of the Camphor family, an indigenous tree in China, which has high ornamental value due to its diversified variation in leaf color and upright trunk [24]. The evergreen tree canopy, rich leaf color, and excellent ornamental properties make it a famous ornamental tree species that has been increasingly applied to landscaping [25]. Among the germplasm resources of P. bournei, a large portion of the new leaves are red, but characteristics including the degree and duration of red color vary, and the mechanism underlying the production of red color is poorly understood. Recently, metabolomics has dramatically facilitated the identification of metabolic pathways of secondary metabolites in plants [26]. To understand the mechanism of color presentation of red-leaved P. bournei, metabolic changes were qualitatively and quantitatively analyzed during the color change of red-leaved P. bournei leaves using UPLC-MS/MS. The key anthocyanins that make its leaves appear red were explored, and the mechanism of leaf color change was elucidated. In the present study, we identified 57 anthocyanin components in P. bournei leaves at three developmental stages, of which cyanide-3-O-glucoside (cya-3-O-glu) might contribute to the red color in the new leaves. It also showed that PbbHLH1 and PbbHLH2 might participate in anthocyanin accumulation by upregulating anthocyanin biosynthesis-related genes. These findings provide a potential biotechnological strategy for selecting and breeding red-leaved P. bournei with high ornamental value.

2. Results

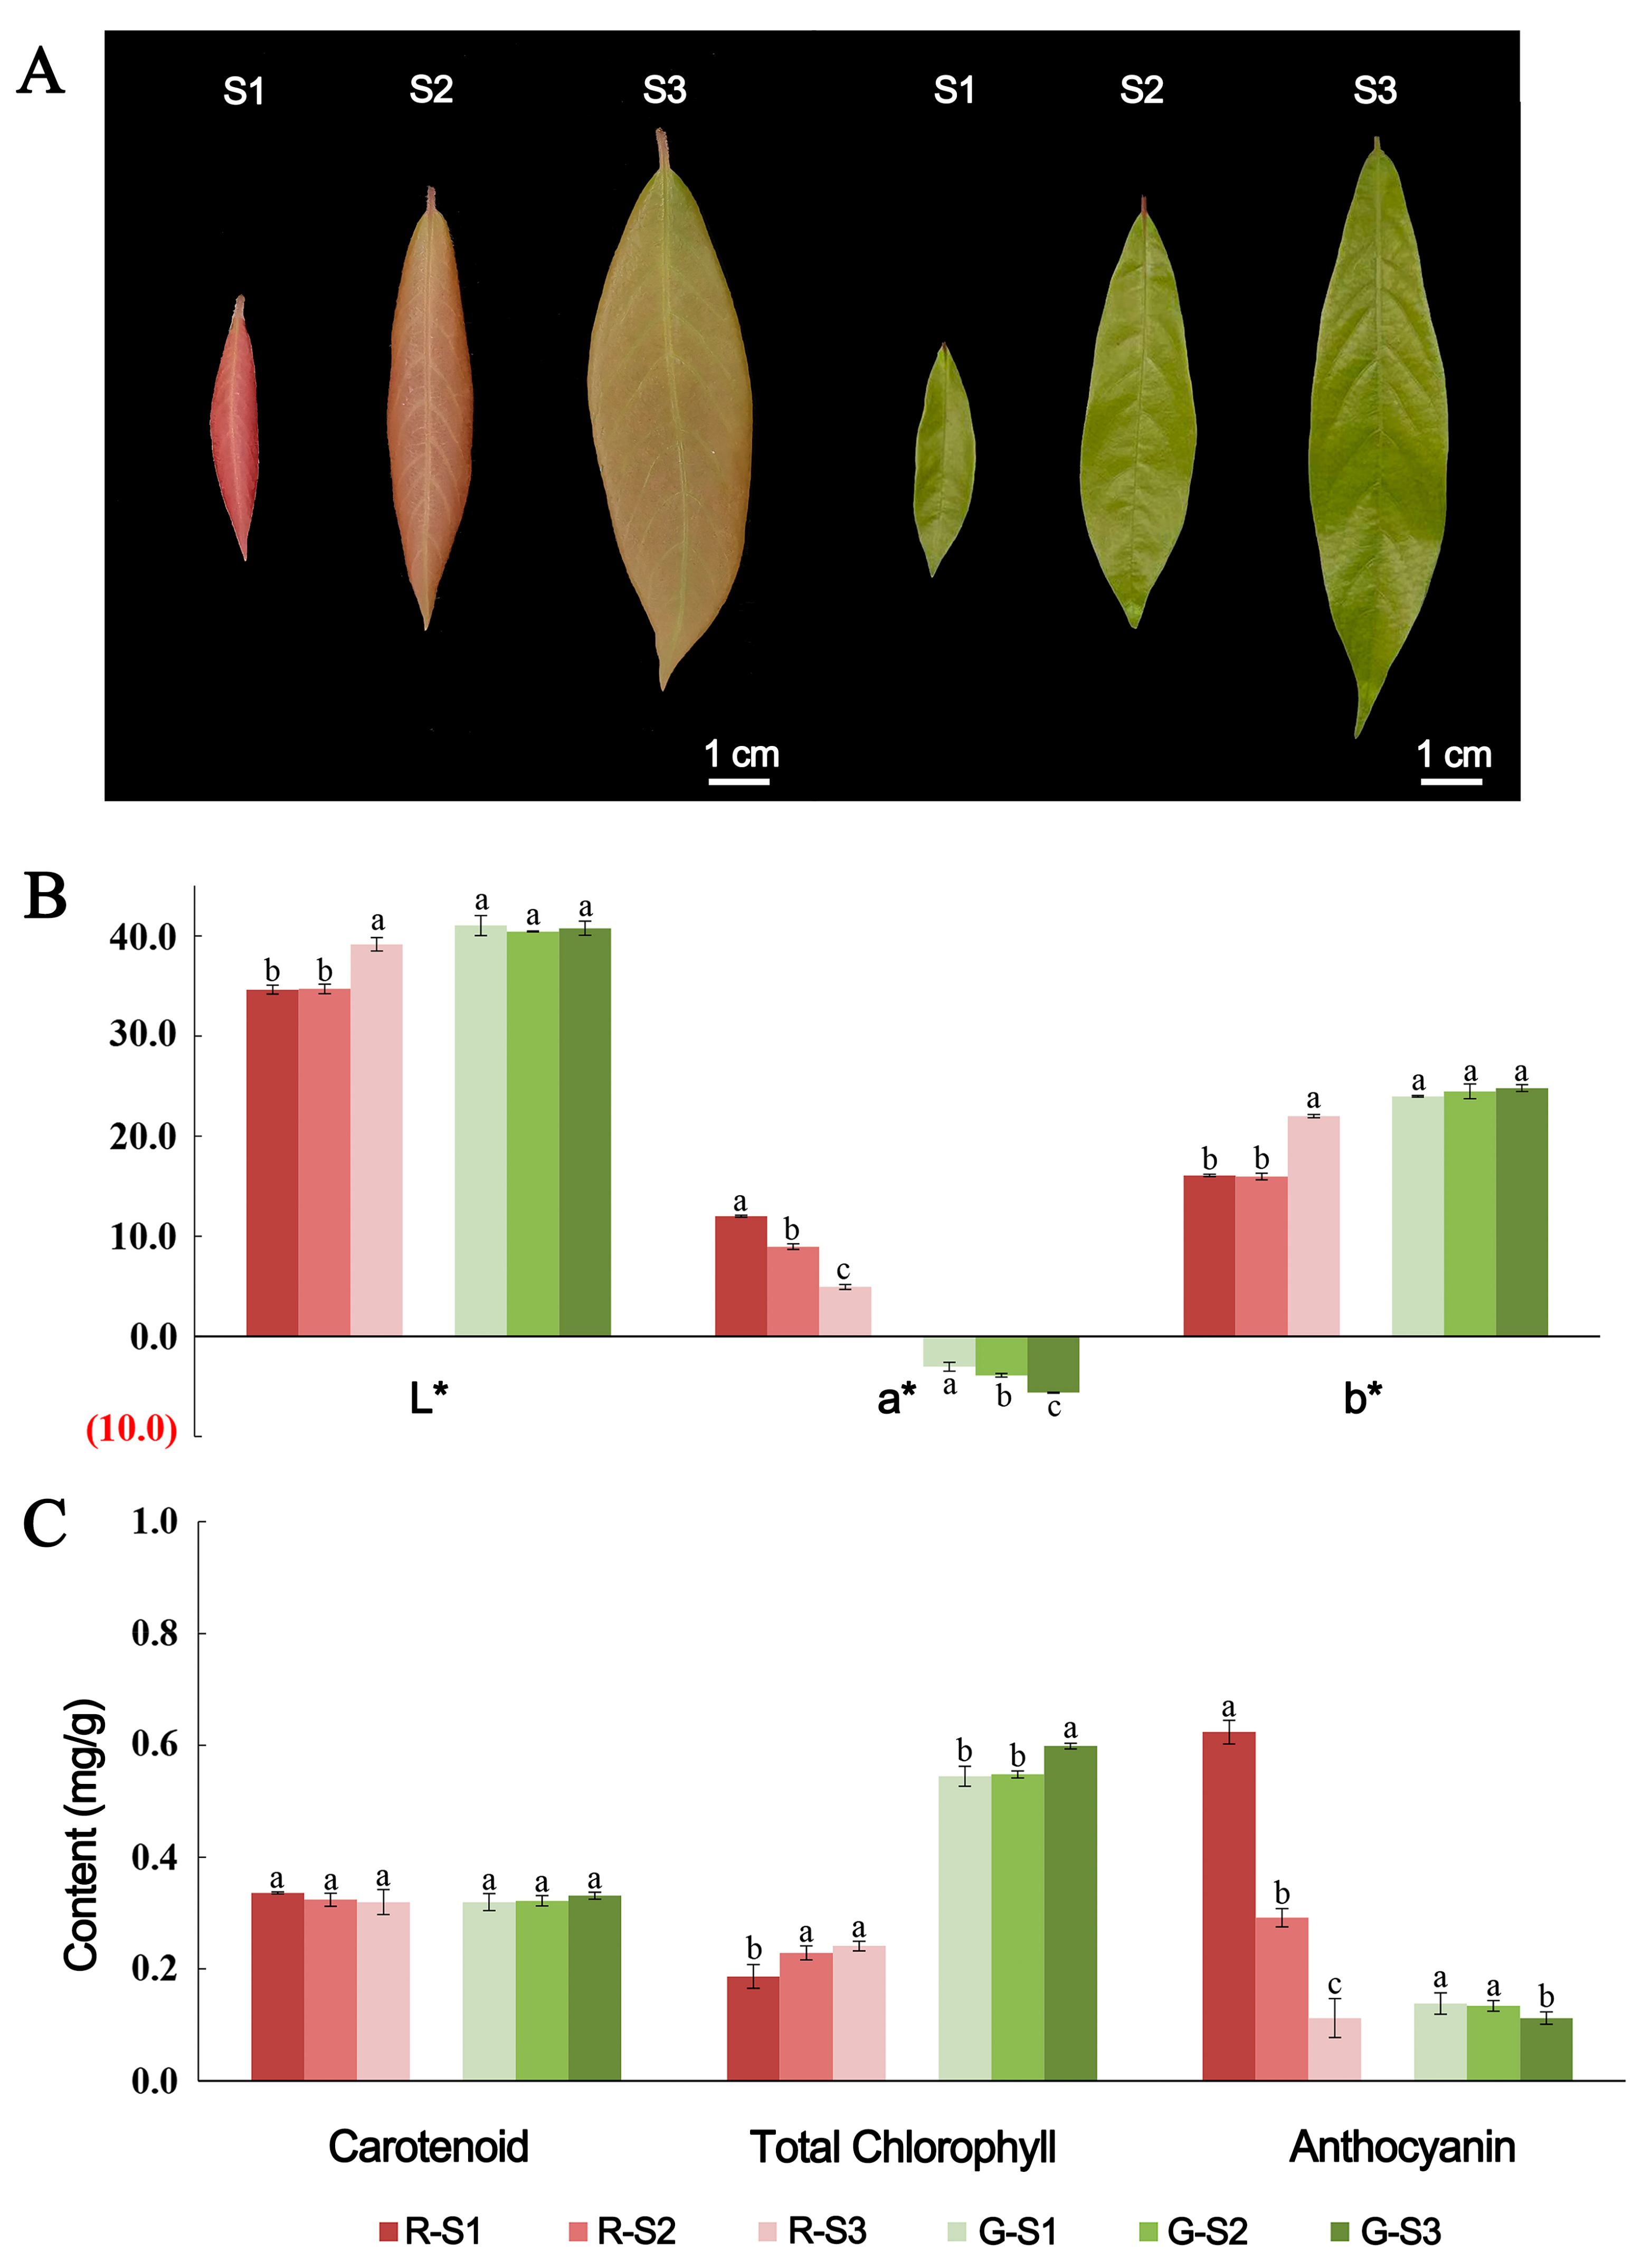
2.1. Phenotypic Characteristics of P. bournei Leaves

The new leaves of P. bournei trees are red, yellowish green, or light green and then gradually turn darker green as they develop (Figure 1A). Of them, red leaves are the most popular in China because of their bright color and their symbolic meaning of happiness. First, we analyzed the leaf color parameters (L*, a*, b*). The L* value represents the brightness of the leaf color. The a* value represents the red/green concentration of the color; a positive value of a* means red, and a negative a* value means green. The b* value indicates the concentration of yellow/blue elements. The analysis results show that there were significant differences between red and green leaves. Specifically, the L* value of red leaves was smaller than that of green leaves, showing that green leaves were brighter in color than red leaves. The a* value of red leaves was significantly higher than that of green leaves. The b* value increased significantly in the S3 stage of red leaves, while there was no change in green leaves (Figure 1B). Then, the levels of carotenoids, chlorophyll, and anthocyanins at three developmental stages were measured (Figure 1C). There were no significant differences in carotenoids among the three developmental stages. The total chlorophyll level of red-leaved samples was significantly lower than that of green-leaved samples, and the level increased from the S1 to S3 stages. The anthocyanin levels were significantly higher in red leaves than that in green leaves, and there was a significant decrease in anthocyanin levels as red leaves matured, suggesting that anthocyanin might be the main cause of the change in leaf color.

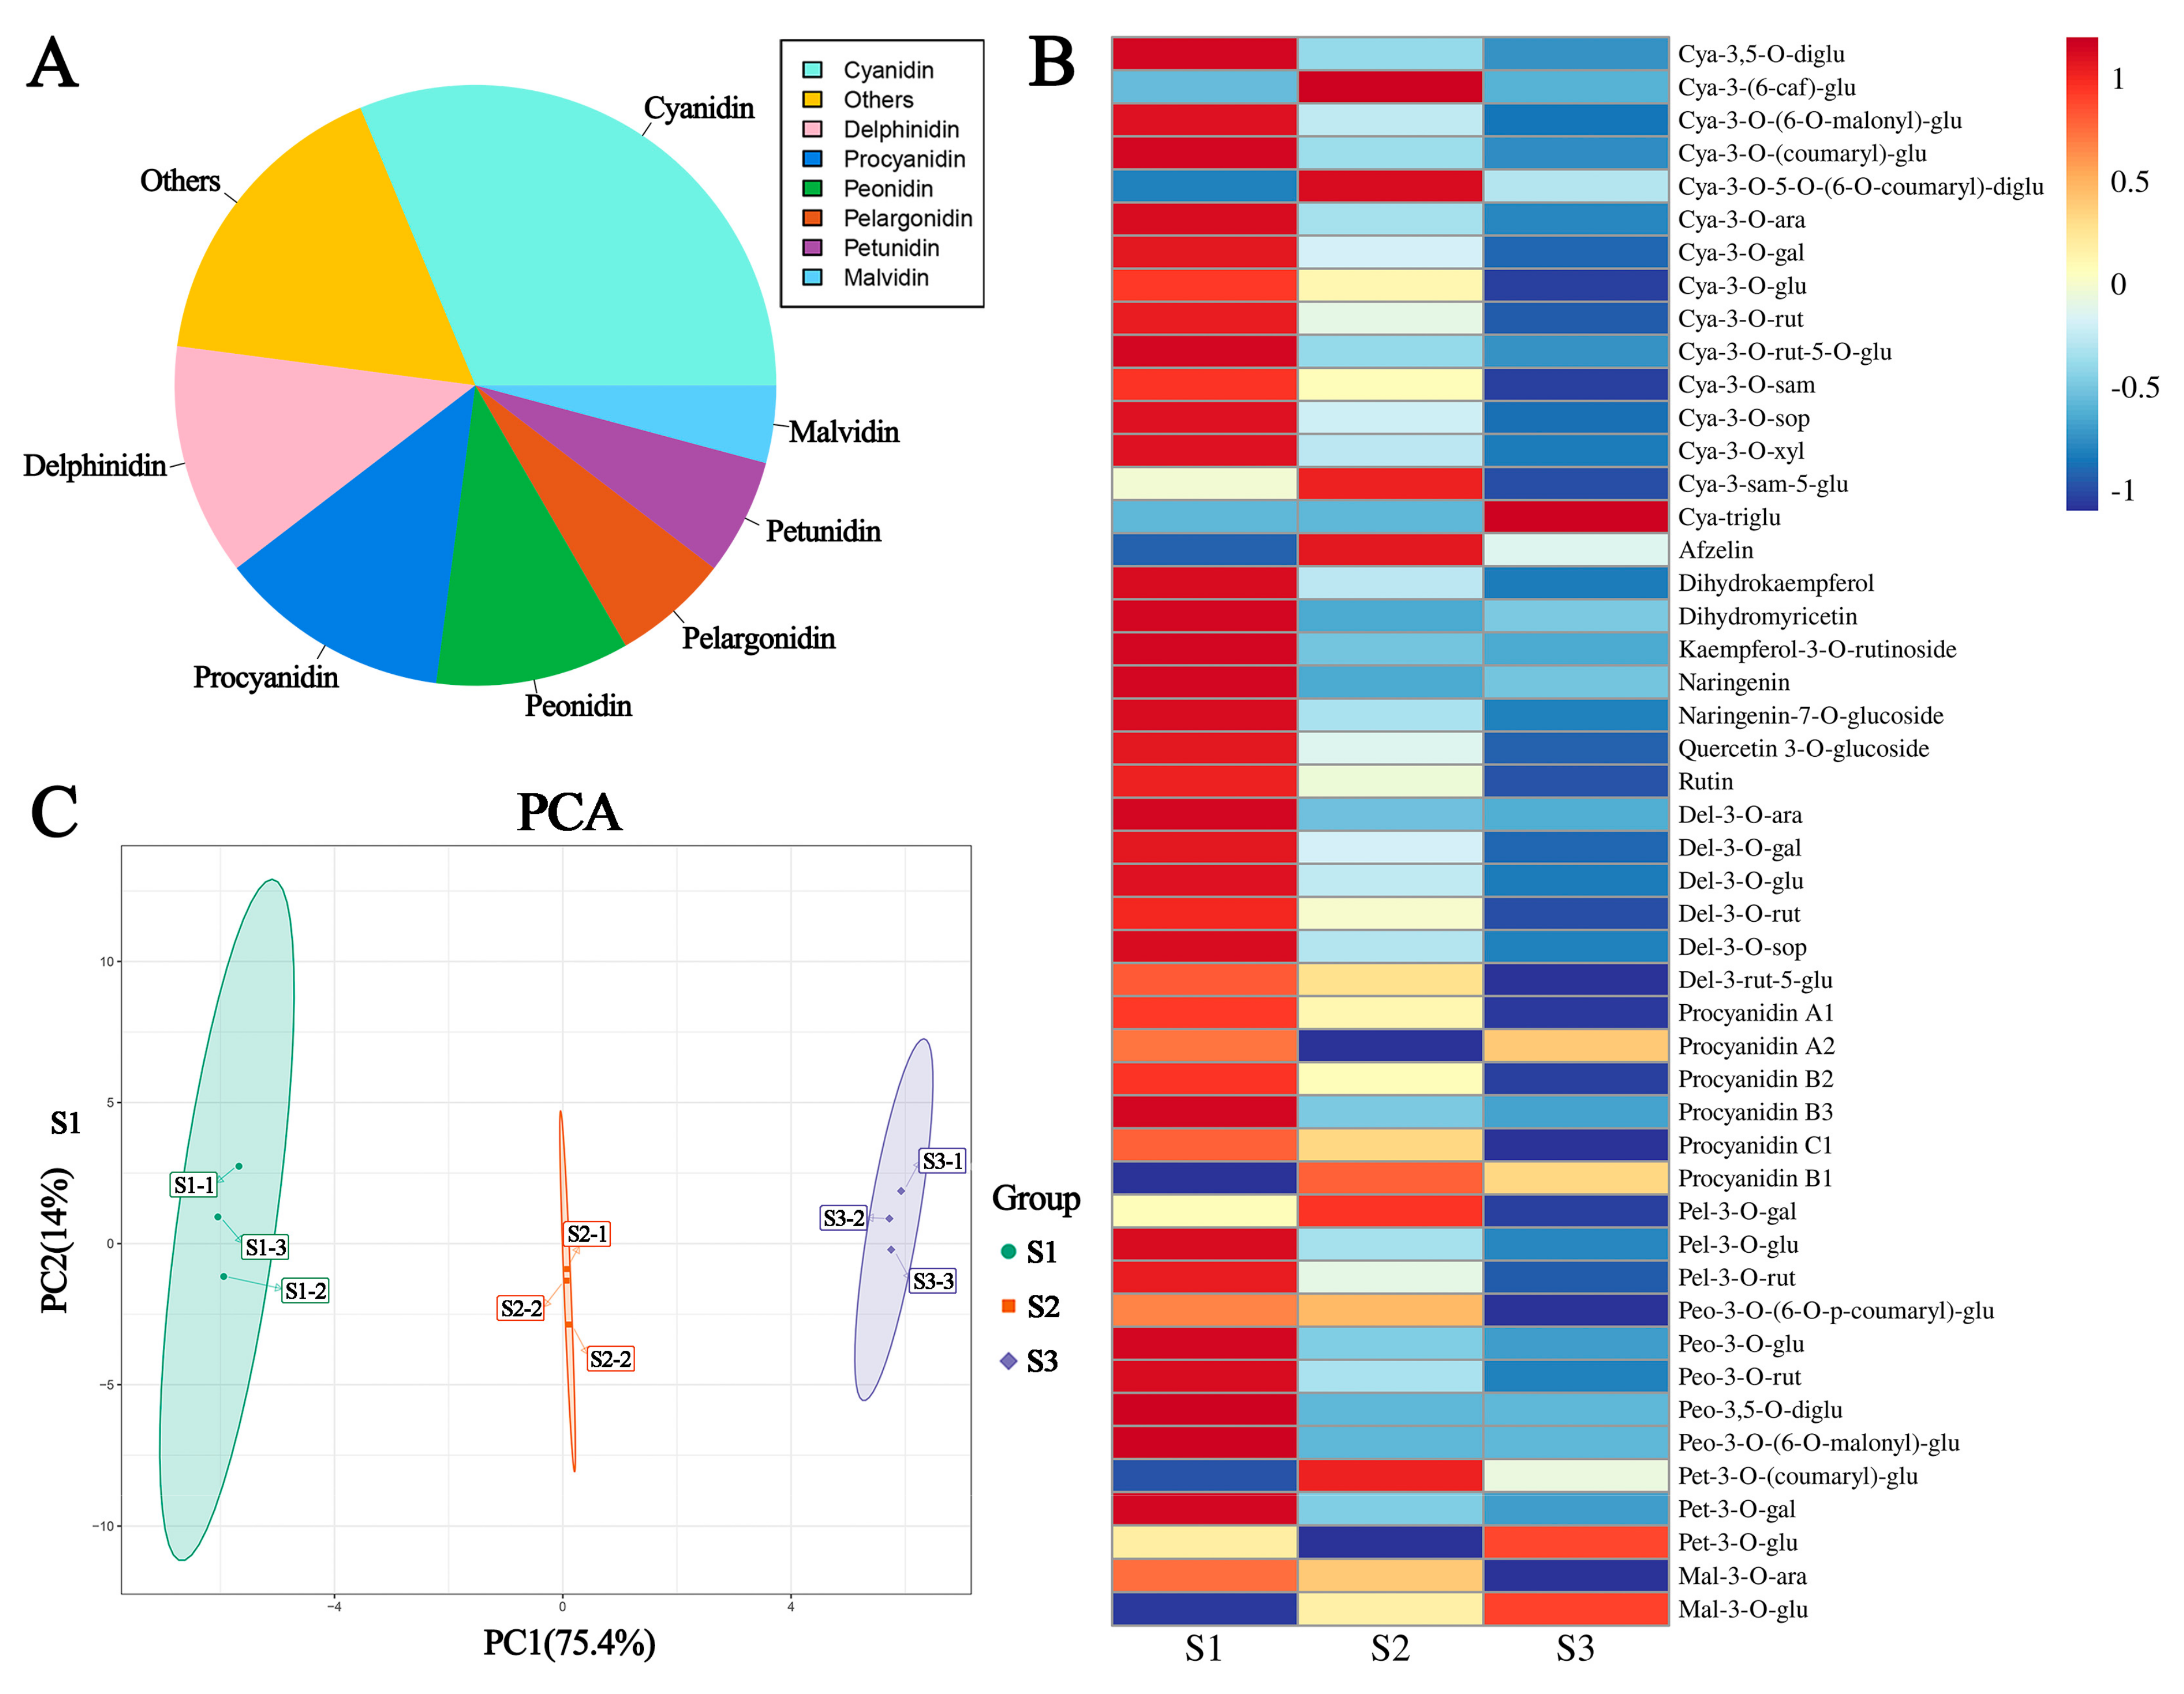
2.2. Anthocyanin Metabolites in the Red Leaves of P. bournei at Different Developmental Stages

To further elucidate the anthocyanin types and corresponding levels in the red leaves of P. bournei at three developmental stages, anthocyanin metabolites were analyzed by LC–MS/MS. The results identified 48 metabolites, including 15 cyanidin derivatives, 6 delphinidin derivatives, 2 malvidin derivatives, 3 petunidin derivatives, 3 pelnidin derivatives, 5 peonidin derivatives, 6 procyanidin derivatives, and 8 other flavonoids (Figure 2A, Table S3). A hierarchical clustering analysis showed that the vast majority of metabolite levels were highest in the S1 stage and continually decreased in the S2 and S3 stages (Figure 2B). The metabolite profiles red P. bournei leaves were then subjected to principal component analysis (PCA). The PCA score plots exhibited an obvious separation among development stages. The first principal component (PC1) was 75.4%, and the anthocyanins present in the S1 stage were separated from those in the S2 and S3 stages (Figure 2C), indicating that the anthocyanin types and levels varied among the three developmental stages of the red P. bournei leaves.

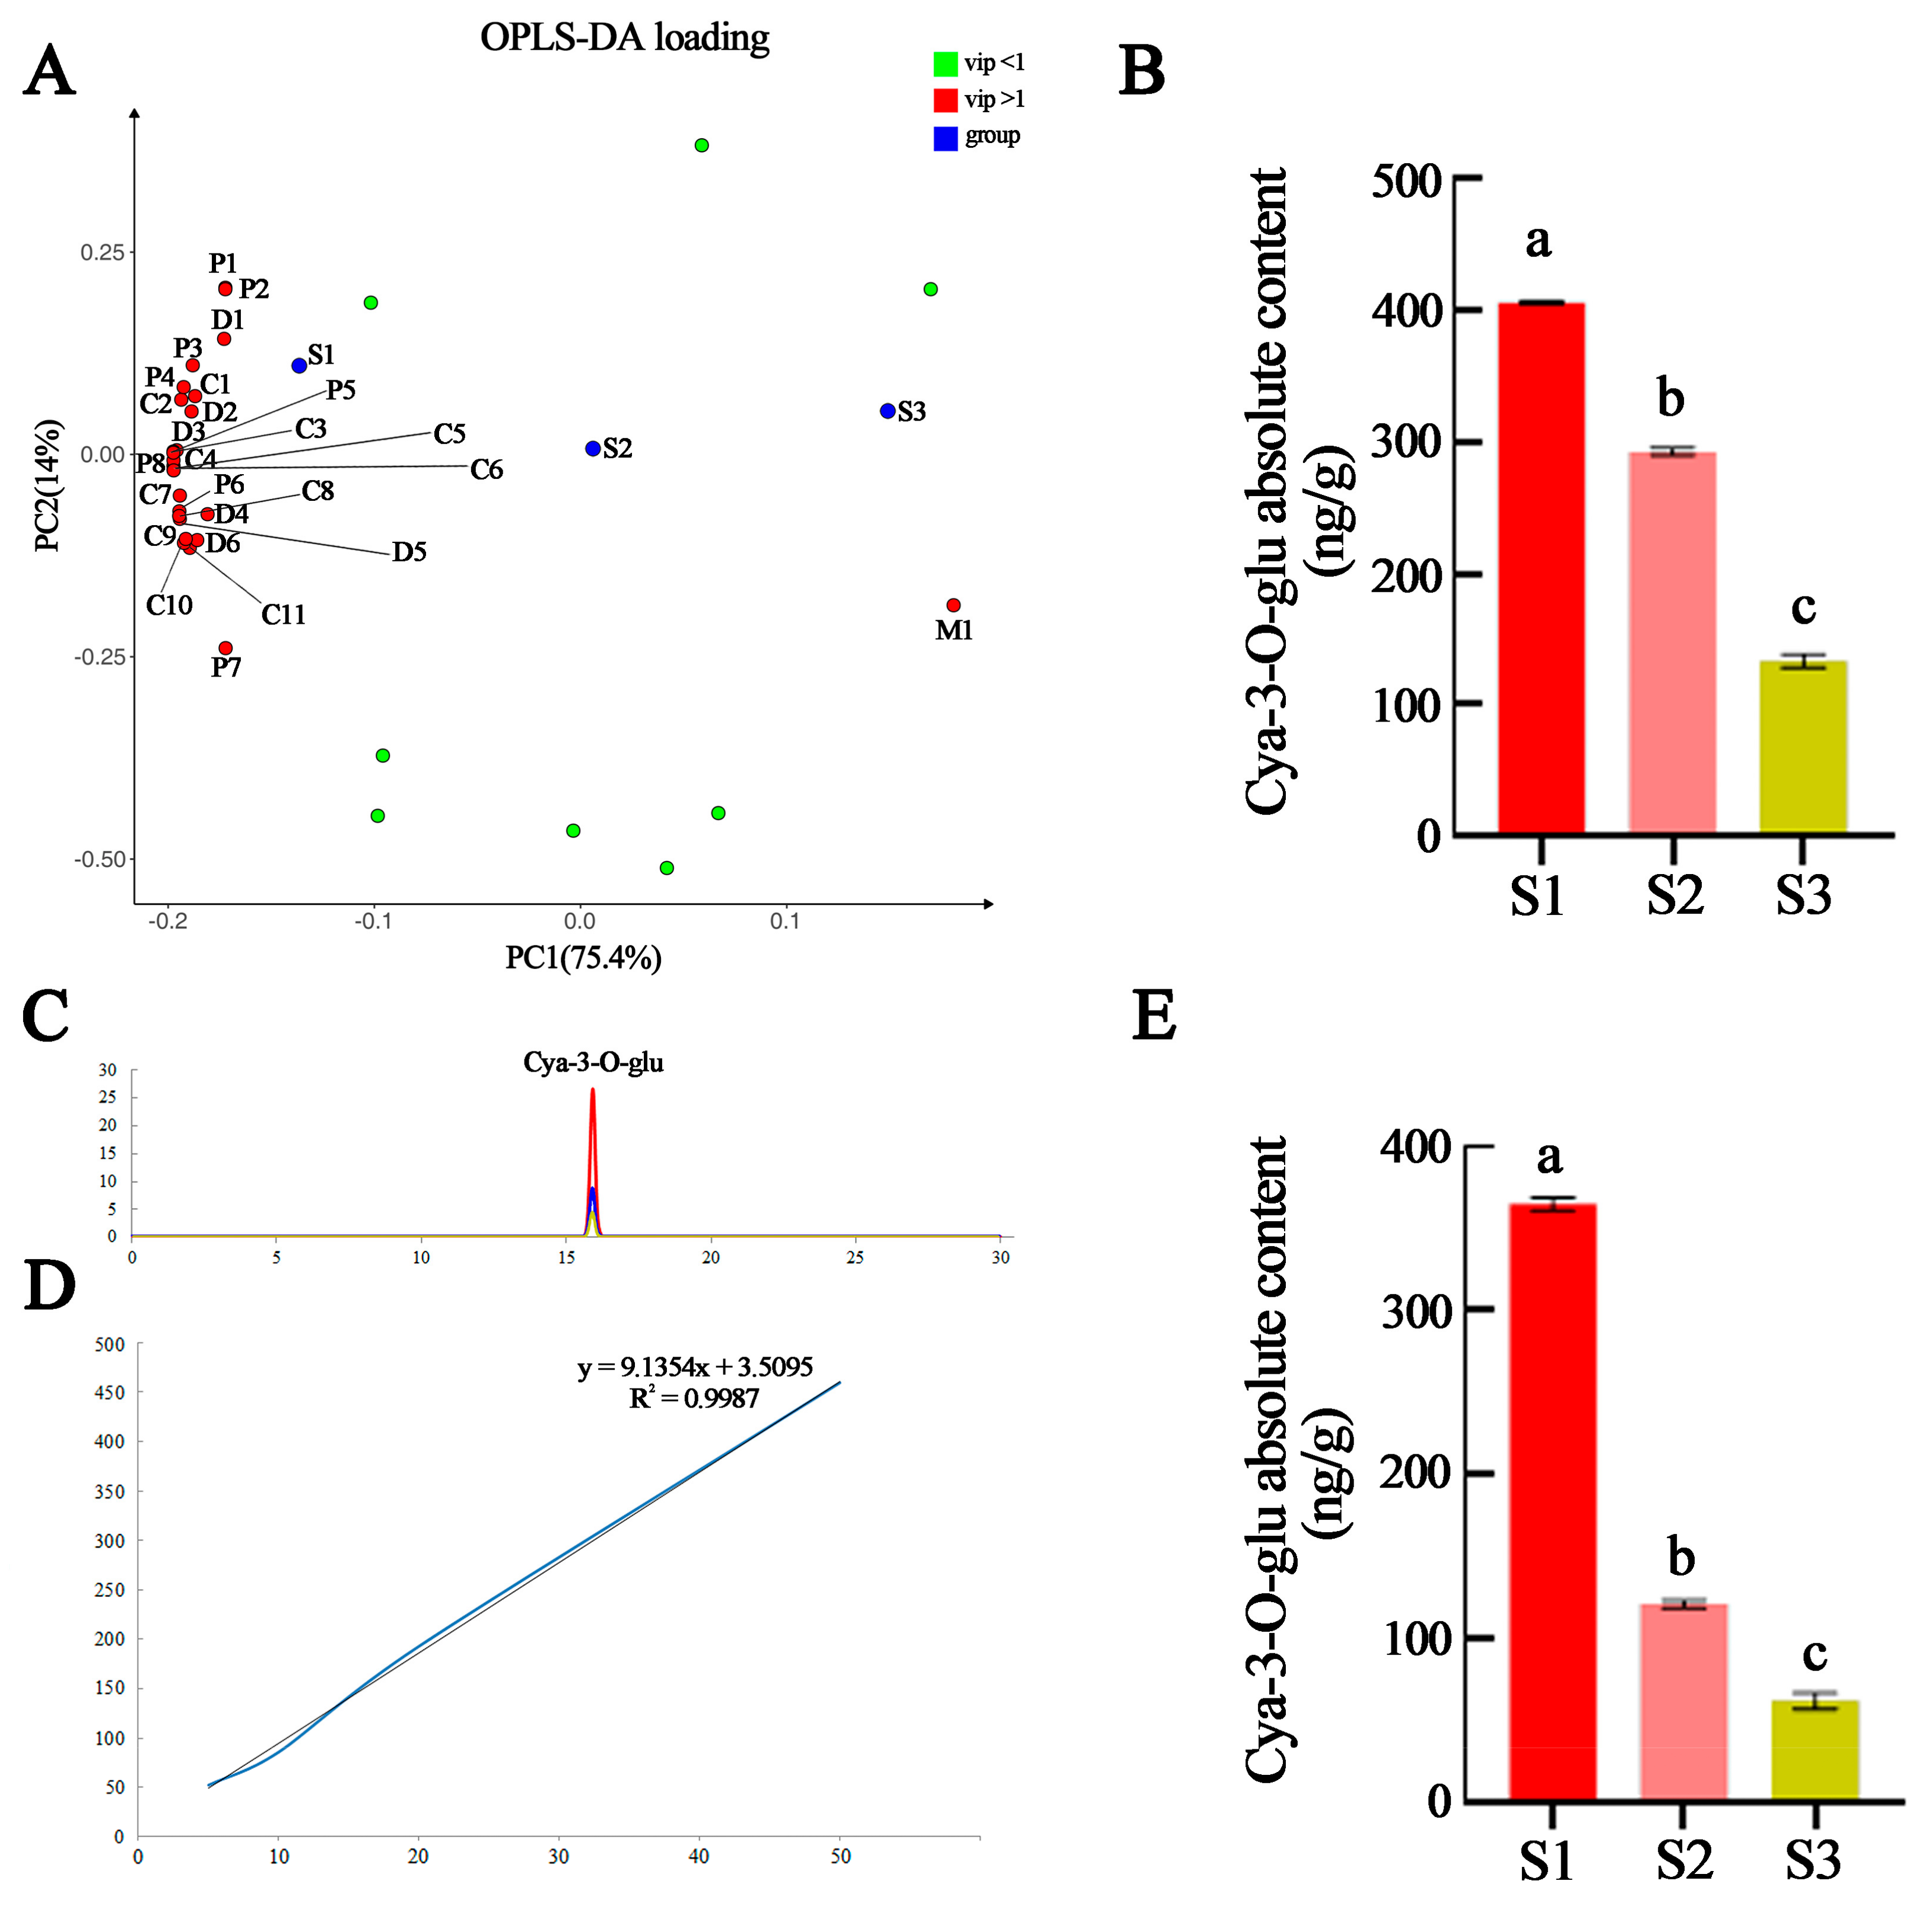
2.3. Identification of Key Metabolites for Leaf Coloration

The orthonormal partial least squares regression–discriminant analysis (OPLS-DA) showed that the major metabolites varied significantly among developmental stages, with most metabolites highly accumulated in the S1 sample. It also revealed 26 anthocyanin glycosides were modified with variable importance in projection (VIP) values > 1 (Table S4), all of which are characteristic substances of the S1 stage except for malvidin-3-O-glucoside (Figure 3A).
Among these eight anthocyanins, the level of cyanidin-3-O-glucoside (cya-3-O-glu) was much higher than that of the other anthocyanins (Figure 3B). High-performance liquid chromatography (HPLC) analysis showed that the peak levels of cya-3-O-glu in the leaves of the three developmental stages were consistent with the cya-3-O-glu standards and that the peak levels decreased with leaf development (Figure 3C). A standard curve was established using different standard concentrations of cya-3-O-glu to calculate the absolute amount of cya-3-O-glu in the samples (Figure 3D). The results showed that the levels of cya-3-O-glu decreased with leaf development, which was consistent with the metabolomic results (Figure 3E).

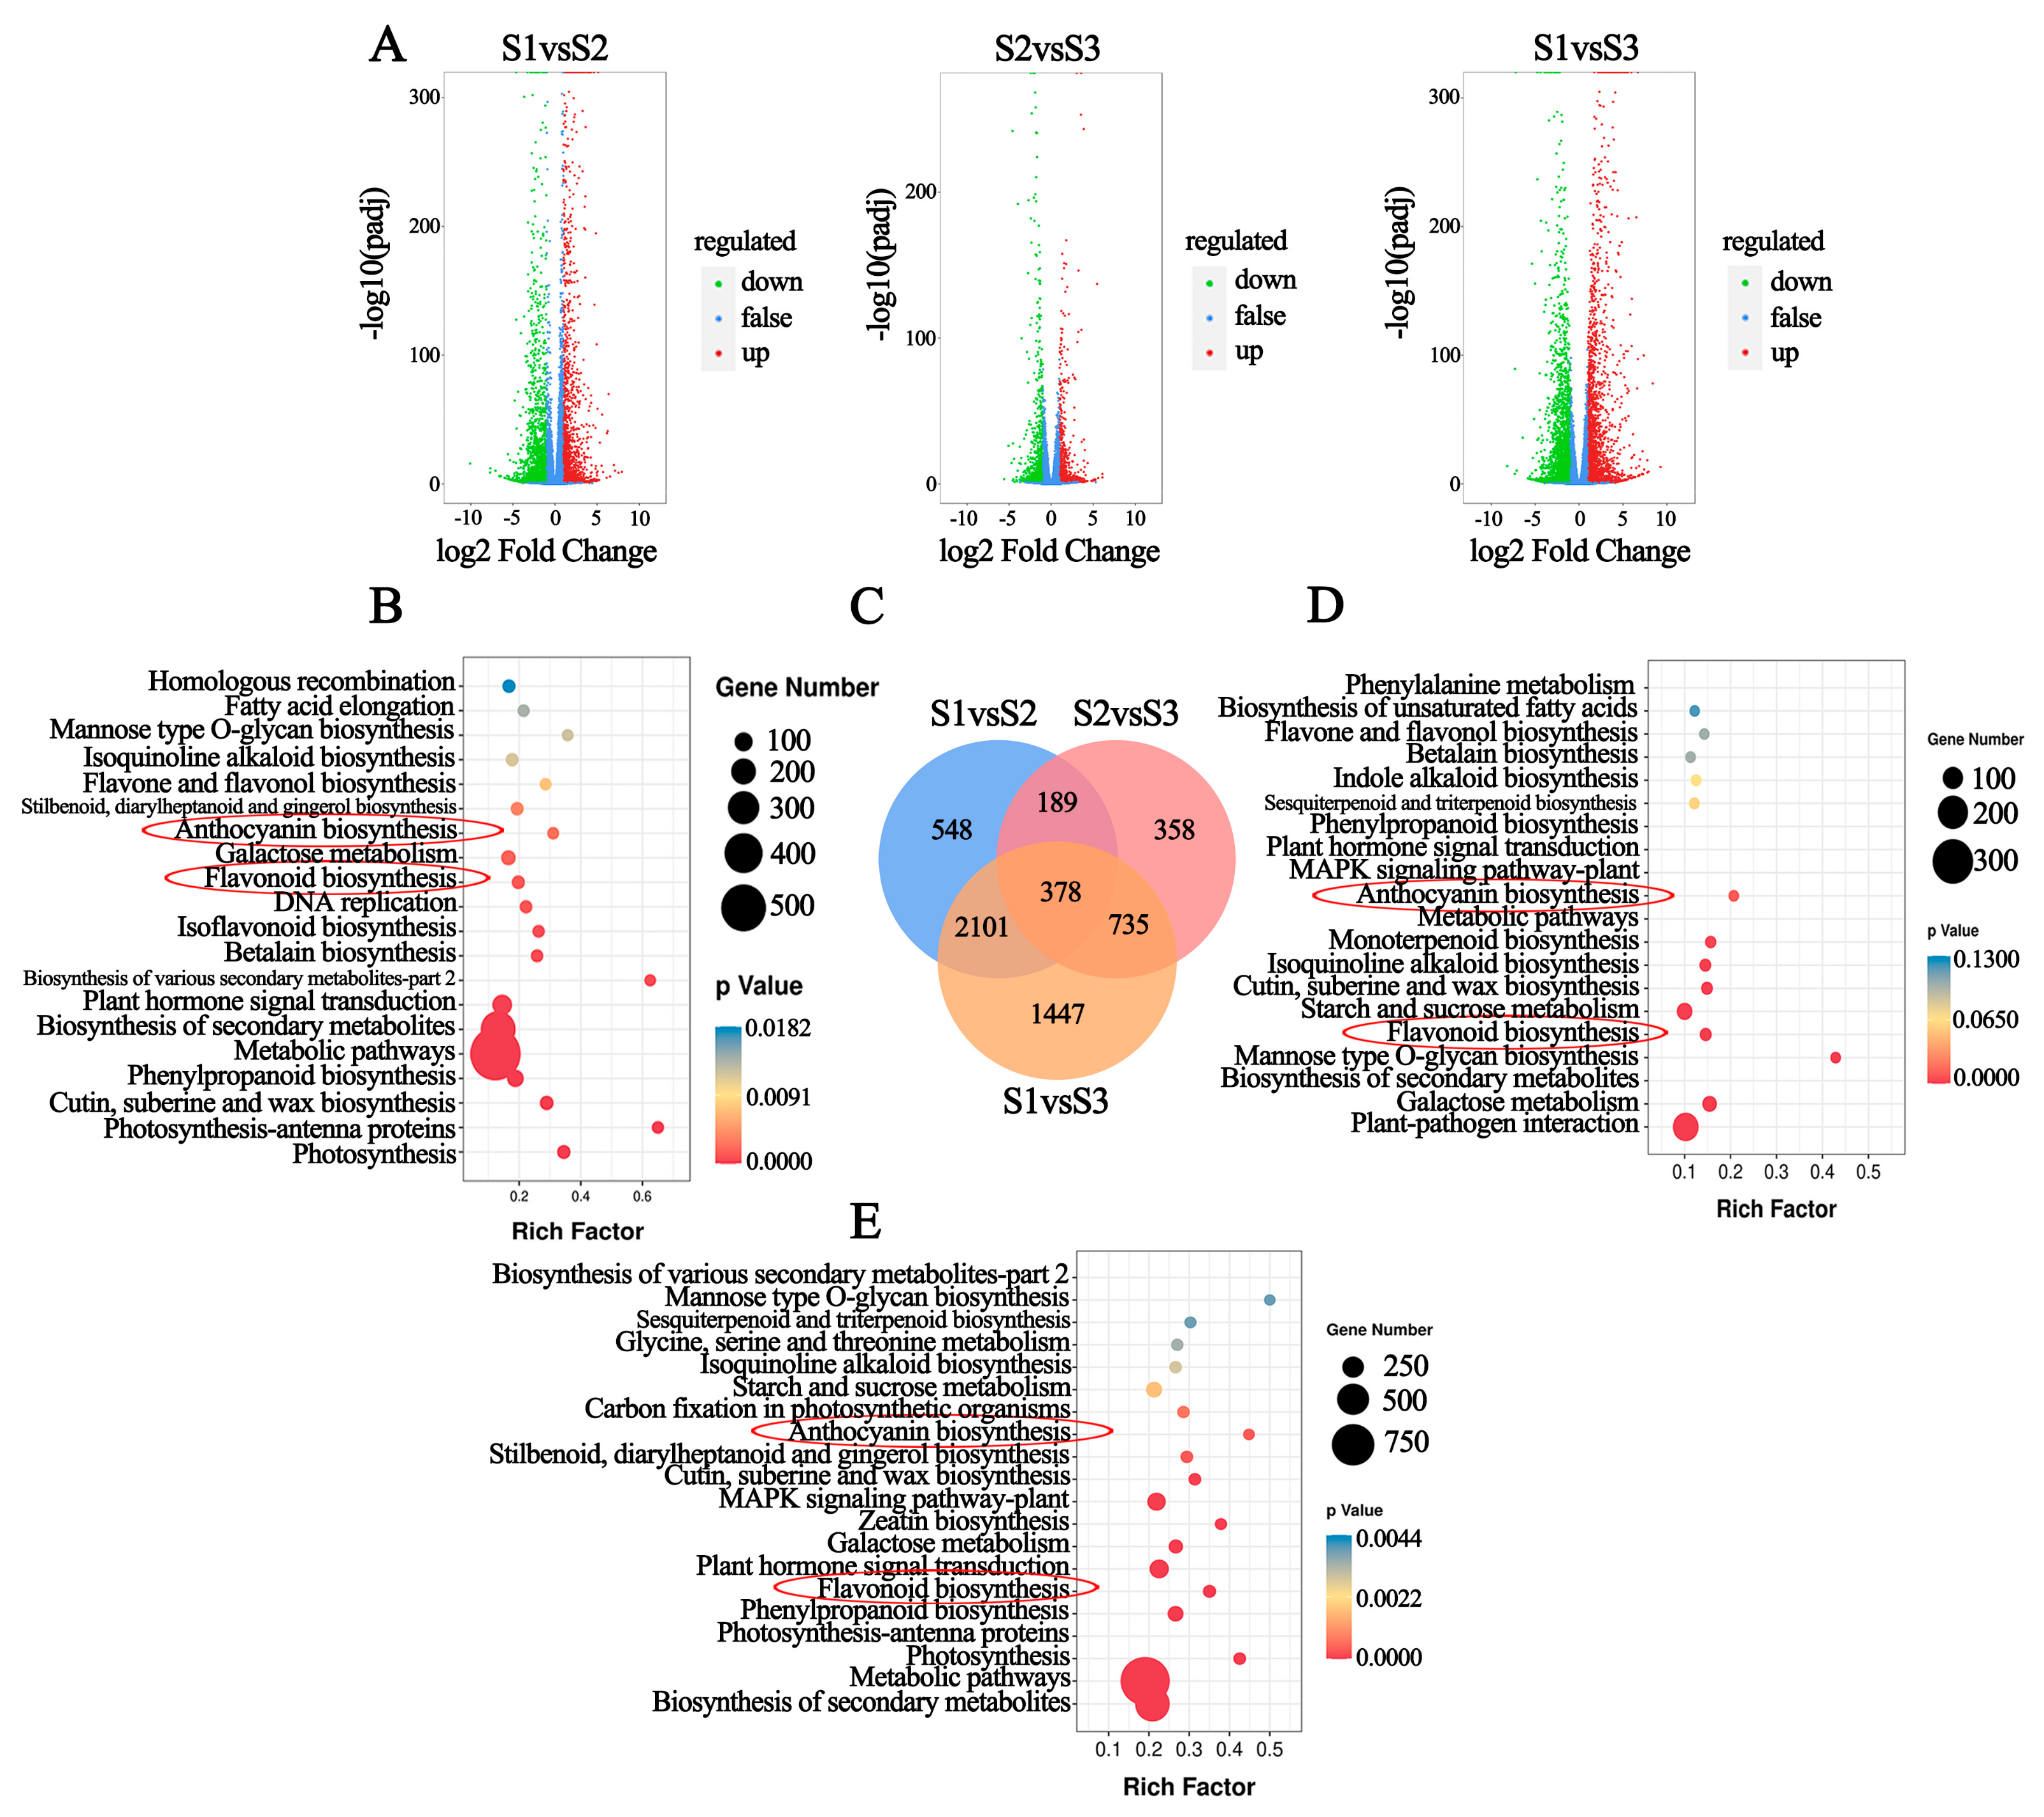
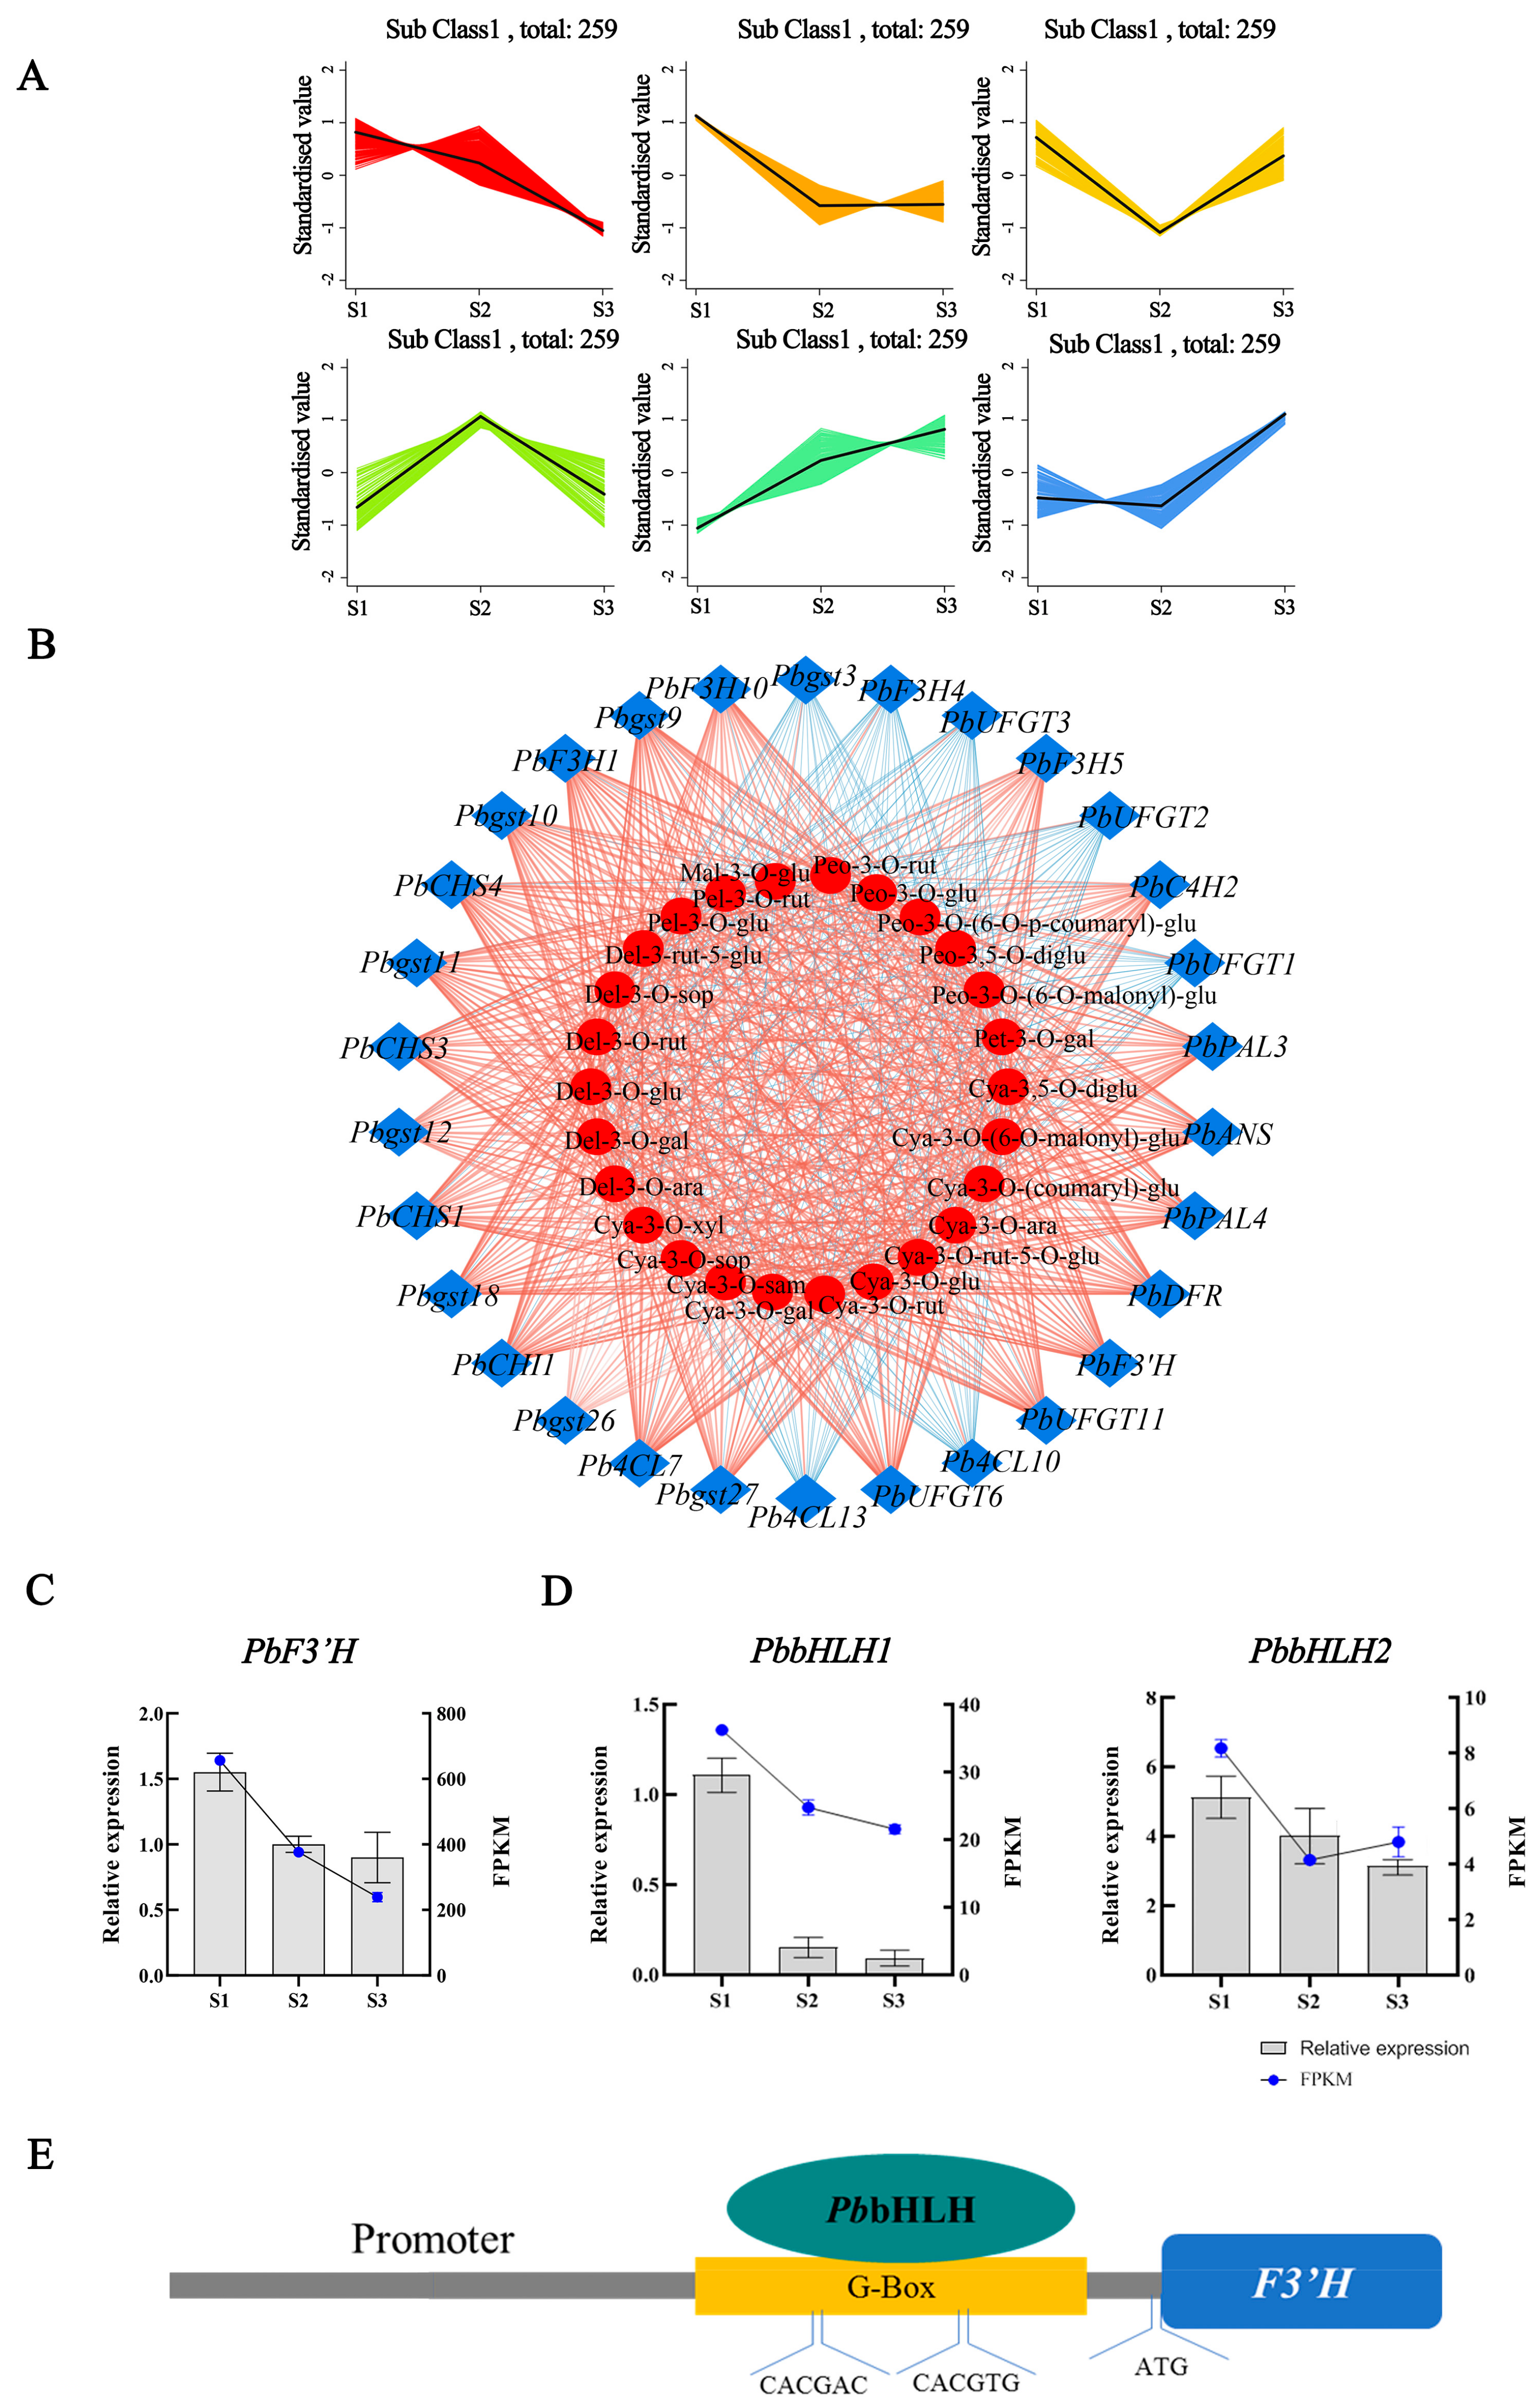
2.4. Transcriptomic Analysis of Leaves during Development

To further elucidate the molecular mechanism of anthocyanin biosynthesis in the red P. bournei leaves, leaves in three developmental stages (three biological replicates per stage) were sequenced, and nine cDNA libraries were constructed. After removing the adaptors and low-quality reads, more than 87% of the clean reads matched the P. bournei reference genome (NCBI under BioProject with accession number PRJNA627308) [27]. Overall, the RNA-seq data were of high quality and could be used for further analysis (Table S5). A total of 28,218 unigenes were detected, resulting in 1528 upregulated and 1688 downregulated differentially expressed genes (DEGs) between the S1/S2 stages, 800 downregulated and 860 upregulated DEGs between the S2/S3 stages, and 2312 upregulated and 2349 downregulated DEGs between the S1/S3 stages (Figure 4A). A Venn diagram showed 548, 358, and 1447 unique DEGs between the S1/S2, S2/S3, and S1/S3 stages, respectively. There were 378 DEGs shared among the three groups, of which 191 DEGs showed a decreasing expression pattern from the S1 to S3 stage (Figure 4C).
Kyoto Encyclopedia of Genes and Genomes (KEGG) enrichment analysis showed that “Metabolic pathways (KO01100)” was the most enriched, followed by “Biosynthesis of secondary metabolites” (KO01110). Furthermore, anthocyanin biosynthesis (ko00942) and flavonoid metabolism (ko00941) were also significantly enriched (Figure 4B,D,E) (Table S6).

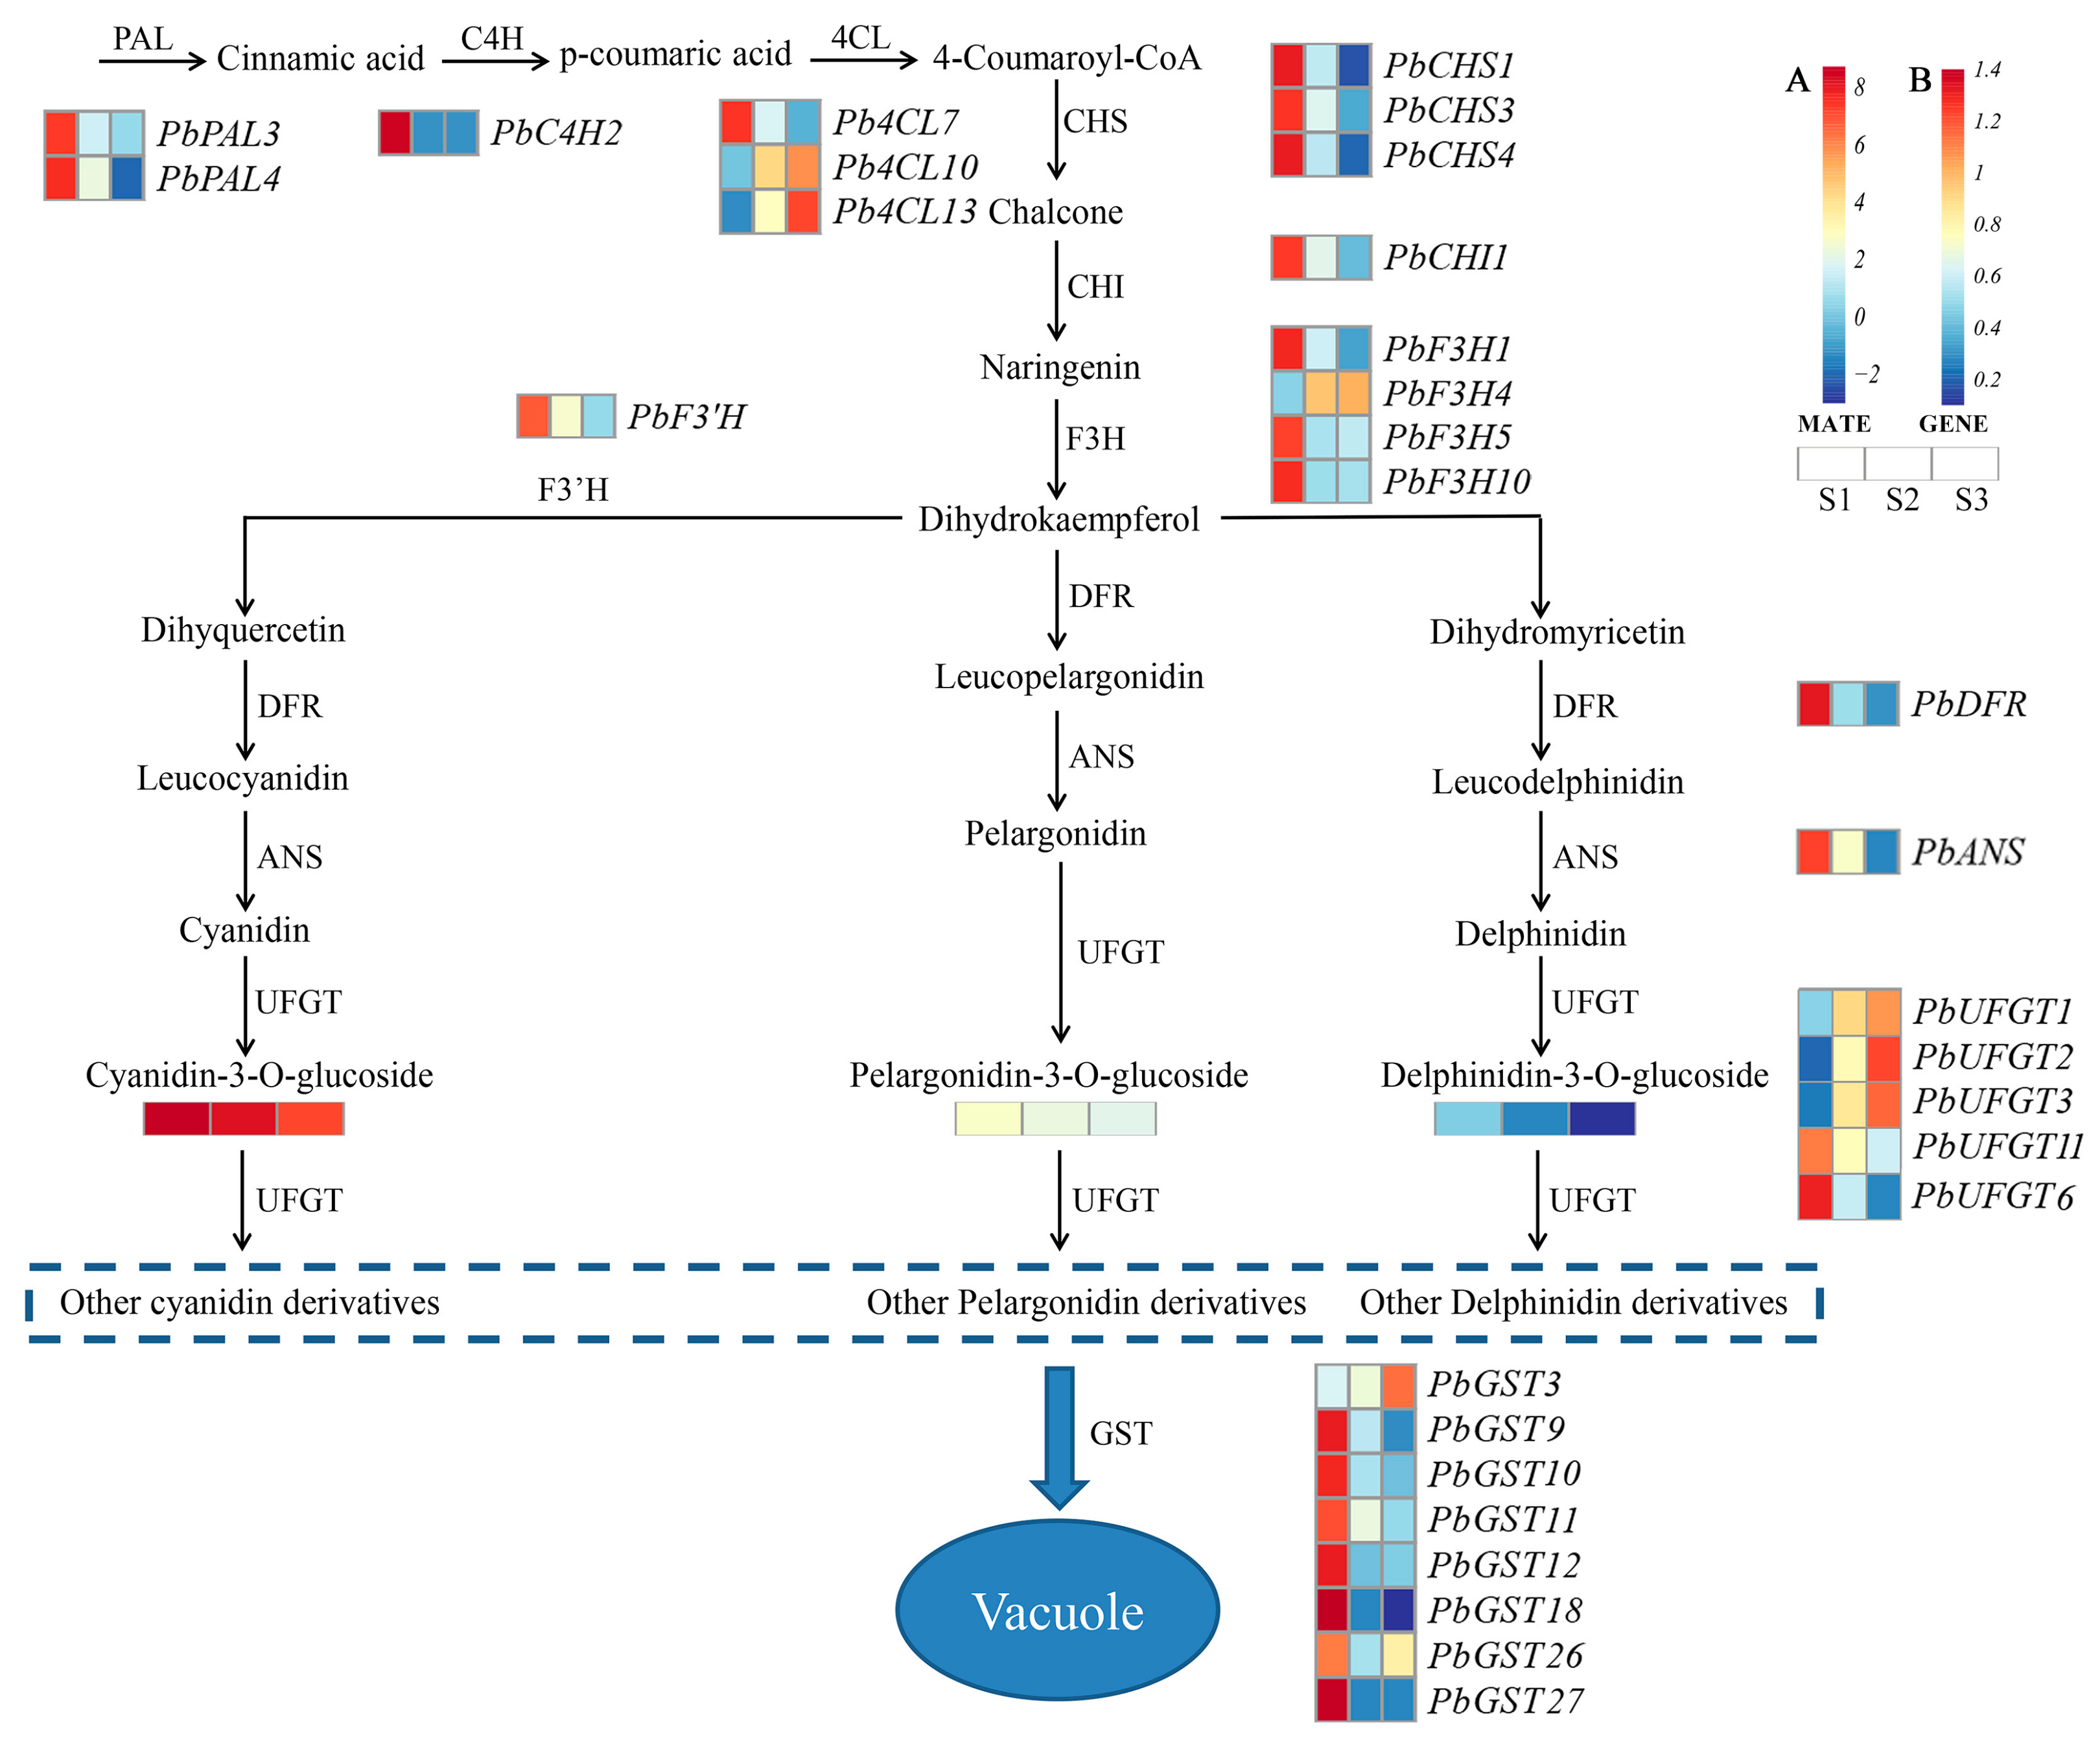
2.5. DEGs Related to Anthocyanin Biosynthesis

Referencing the anthocyanin biosynthesis pathway in plants, we identified 11 structural genes (93 transcripts) involved in anthocyanin biosynthesis in P. bournei (Table S7). In the early stages of anthocyanin biosynthesis, two PAL genes, one C4H gene, three 4CL genes, three CHS genes, and one CHI gene were differentially expressed between the two stages. Specifically, the expression of two PAL genes (PbPAL3 and PbPAL4), one C4H gene (PbC4H2), one 4CL gene (Pb4CL7), three CHS genes (PbCHS1, PbCHS3, and PbCHS4), and PbCHI1 significantly decreased from the S1 to S3 stage (Figure 5).
The process of converting naringin to dihydrokaempferol is a key point in anthocyanin biosynthesis catalyzed by F3H genes. PbF3H1 was highly expressed at the S1 stage, and the level gradually decreased with leaf development, while PbF3H5 and PbF3H10 were highly expressed at the S1 stage, with insignificant changes in the S2 and S3 stages, whereas the expression level of PbF3H4 increased with leaf development.
F3′H and F3′5′H determine the anthocyanin precursor components. The expression of F3′H (PbF3′H) in S1 period was close to two times that in the S2 period and three times that in S3 period. The later stages of anthocyanin biosynthesis are also important for the accumulation of anthocyanins. PbDFR and PbANS1 were highly expressed in the S1 stage and gradually decreased, showing significant differences in expression between the S2 and S3 stages. Two UFGT (PbUFGT11 and PbUFGT6) genes were downregulated, and three UFGT (PbUFGT1, PbUFGT2, and PbUFGT3) genes were upregulated with leaf development. The expression levels of six GTS (PbGST9, PbGST10, PbGST11, PbGST12, PbGST18, and PbGST27) genes decreased significantly with leaf development. The level of PbGST26 decreased significantly from the S1 stage to the S2 stage but increased significantly from the S2 stage to the S3 stage, while the level of PbGST3 increased with leaf development.

2.6. Integrated Analysis of the Transcriptome and Metabolome

K-means analysis of all differentially expressed TFs and DEGs involved in the anthocyanin biosynthetic pathway was conducted, resulting in six K-means classes (Figure 6A). Among these classes, class 1 and class 2 contained 887 transcription factors with decreasing expression levels from the S1 stage to the S3 stage, which is consistent with the accumulation pattern of cya-3-O-glu and the S1-stage-signature differentially expressed metabolites (DAMs). These class 1 and class 2 transcription factors were mainly of the MYB, bHLH, and ERF gene families, and their expression patterns were consistent with those of structural genes (Figure S1). Of them, the bHLH family was the most predominant gene family, and a phylogenetic tree of the bHLH TF family was constructed using the PbbHLH members identified from the K-means classes 1/2 and known bHLHs involved in anthocyanin biogenesis in other plants (Figure S2). Combining the phylogenetic analyses and expression levels, two bHLH genes (PbbHLH1 and PbbHLH2) were selected as candidate TFs that may be responsible for the regulation of anthocyanin biogenesis in P. bournei leaves.
Correlations between the transcriptional profiles of DEGs and S1-stage-characterized DAMs were analyzed using Pearson’s correlation coefficients (Table S8). The result revealed that 30 DEGs involved in anthocyanin biosynthesis showed a significant correlation with at least two DAMs. Among the 30 DEGs, the expression levels of 10 DEGs (PbF3H1, PbCHS3, PbCHS4, PbCHI1, Pb4CL7, PbF3′H, PbDFR, PbGST9, PbGST11, and PbUFGT6) showed significant positive correlations with all of the DAMs, while five genes (PbF3H4, Pb4CL13, PbUFGT1, PbUFGT2, and PbUFGT3) showed negative correlations with only some of the DAMs (Figure 6B). Among these DEGs, PbF3’H specifically synthesizes dihydroquercetin, a precursor substance of cya-3-o-glu.
To further confirm the reliability of the RNA-Seq results, we performed Quantitative Real-time PCR (qRT–PCR) analysis of structural genes and predicted transcription factors involved in the anthocyanin biosynthetic pathway (Figure 6C,D). Both transcriptome and qRT–PCR analyses showed that the expression levels of PbF3’H, PbbHLH1, and PbbHLH2 decreased with leaf development. The expression trend is the same between RNA-seq and qRT–PCR, indicating that the transcriptomic data were highly reliable and consistent with our prediction of transcription factors and structural genes.
Furthermore, the binding site of bHLH on the promoter region of PbF3’H was found (Figure 6E). Therefore, we suggest that in red-leaved P. bournei leaves, it is likely that the expression of PbF3’H is upregulated by PbbHLH1 and PbbHLH2, resulting in the accumulation of cya-3-O-glu and leading to the reddening of leaves.

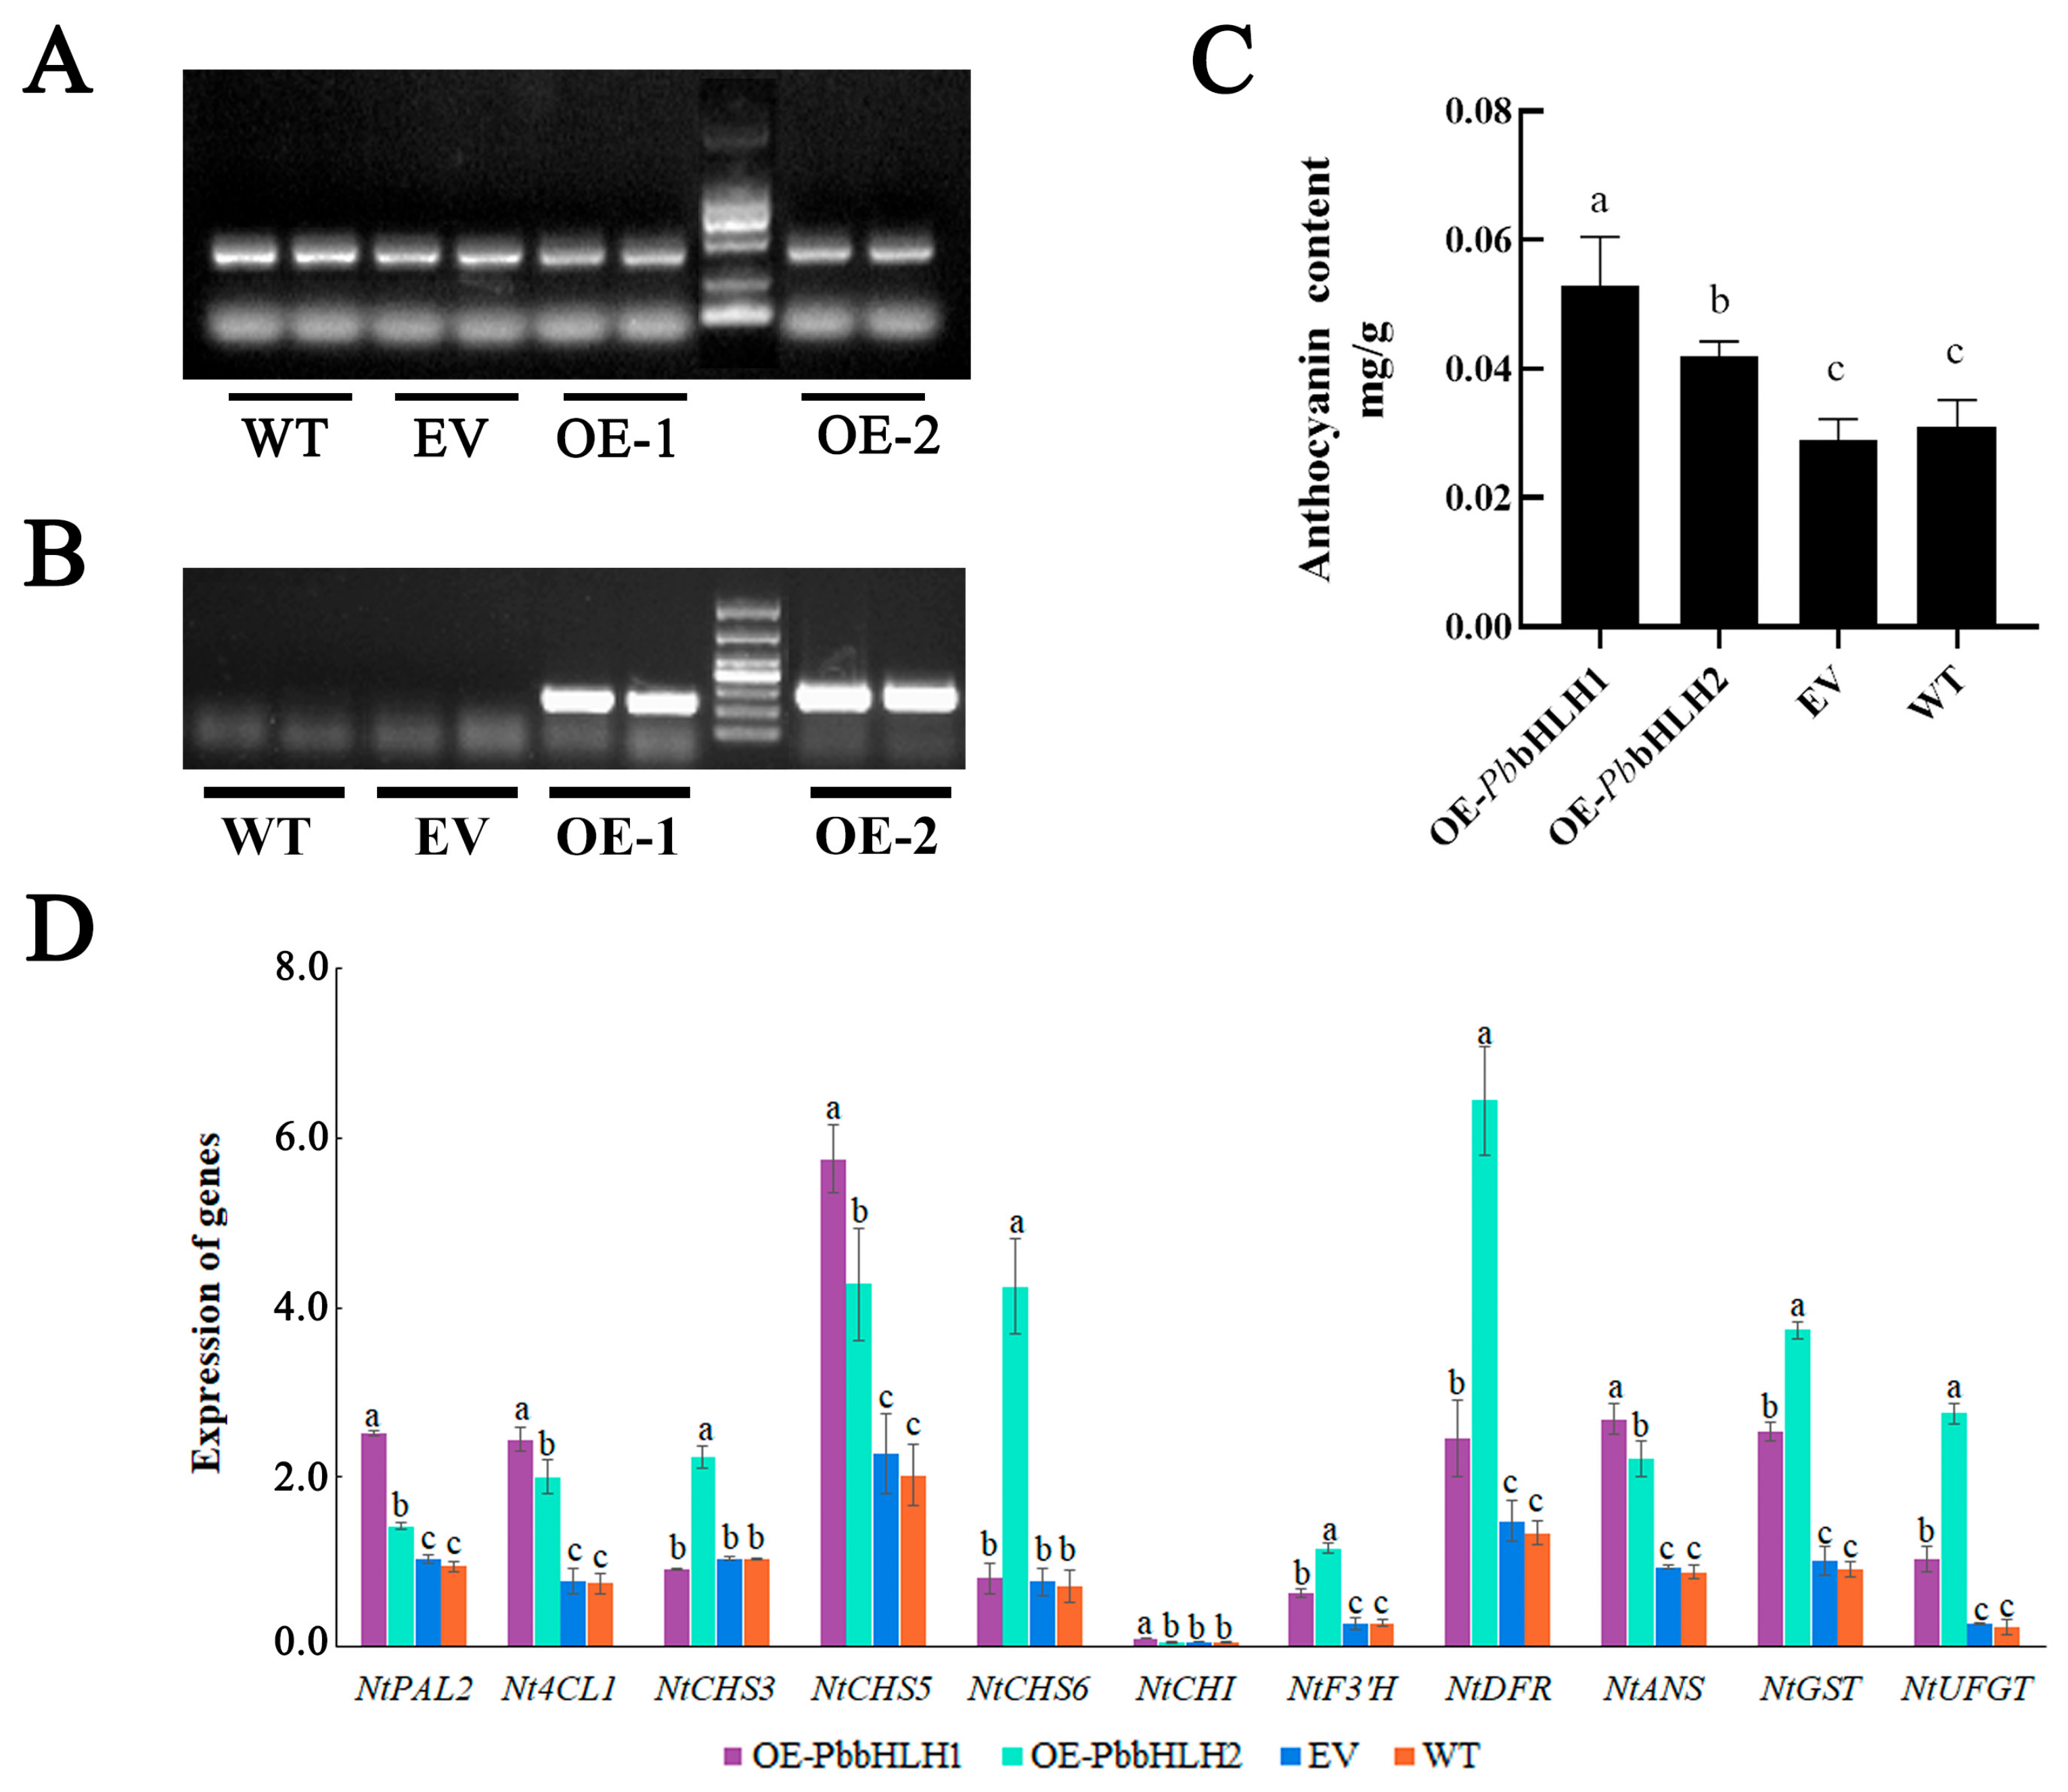
2.7. The Potential Regulatory Roles of PbbHLH1 and PbbHLH2

Using a well-established plant genetic transformation system, the Agrobacterium tumefaciens strain GV3101 containing 35S::PbbHLH1 and 35S::PbbHLH2 recombinant plasmids or an empty vector (EV) was injected into N. tabacum leaves, and multiple overexpression (OE) leaves were obtained. Actin was selected as the internal reference gene, and its relative expression was essentially the same in OE-PbbHLH1 and OE-PbbHLH2, EV, and WT leaves (Figure 7A). The relative expression levels of the target genes PbbHLH1 and PbbHLH2 in the OE leaves were confirmed by semiqPCR (Figure 7B). To verify the regulatory roles of PbbHLH1 and PbbHLH2 in anthocyanin biosynthesis, the anthocyanin levels of N. tabacum leaves from OE, WT, and EV plants were measured. The OE leaves had significantly higher anthocyanin levels than the WT and EV leaves (Figure 7C).
The expression levels of nine structural genes (NtF3′H, NtCHI, NtANS1, NtDFR1, Nt4CL1, NtPAL2, NtCHS5, NTGST, and NtUFGT) were increased in the PbbHLH1 OE leaves compared to the WT and EV leaves, and the expression levels of 10 structural genes (NtF3′H, NtANS1, NtDFR1, Nt4CL1, NtPAL2, NtCHS3, NtCHS5, NtCHS6, NTGST, and NtUFGT) were increased in the PbbHLH2 OE leaves (Figure 7D). In summary, individually expressed PbbHLH1 and PbbHLH2 TFs are involved in anthocyanin accumulation by upregulating the expression levels of anthocyanin biosynthetic genes.

3. Discussion

3.1. Anthocyanin Characteristics Varied with Leaf Development in P. bournei

Anthocyanins, as critical secondary metabolites of plants, are synthesized through the flavonoid pathway and produce flowers, fruits, and leaves of plants with distinct colors such as pink, red, purple, and blue [10]. Recent studies have shown that anthocyanins are beneficial for the human body. For example, anthocyanin supplementation has a positive impact on human intestinal health [28], which also helps prevent cardiovascular disease and fight cancer [29]. In Camellia japonica, the rich anthocyanins not only make its petals greatly ornamental but also have high edible and medicinal value [30].
Previous studies have shown that color parameters give a suitable representation of the color differences among leaves [31]. For example, in the early stages of leaf development in C. japonica, the leaves appear red with a color parameter a* value of approximately 10, and the a* value decreases significantly when the leaves gradually turn green [32]. In this study, we found that the a* value was significantly higher in red leaves than that in green leaves. Consistently, the anthocyanin levels were significantly higher in red leaves than in green leaves, which decreased significantly with leaf development, indicating that anthocyanins might mainly contribute to the red color of the new leaves in P. bournei. A similar phenomenon was observed in Boehmeria nivea, in which the anthocyanin level in red-leaved variety was significantly higher than that of the green-leaved variety, indicating that anthocyanins are the main factor responsible for the variation in leaf color [31]. Several studies have shown that cyanidin, as one of six types of anthocyanins [33], contributes to red color in plants, but its composition and concentration vary significantly among plant species and/or tissues [34]. For example, in Acer triflorum, cya-3-O-arabinoside is closely associated with the red color in its leaves [22]. In Saccharum officinarum, cya-3-O-(6-O-malonyl)-glu plays a major role in the red coloration of its pericarp [35]. In the present study, 48 anthocyanins were identified in P. bournei leaves by metabolomics analyses, among which cya-based anthocyanins were predominant. However, unlike other plants, the anthocyanin with the highest level was cya-3-O-glu, especially in the S1 stage, as shown by the metabolomics and HPLC analysis. Although the S3 stage also contains common pelargonidin-, cyanidin-, and peonidin-based anthocyanin pigments, their levels may be too low to produce red pigmentation. Therefore, cya-3-O-glu might mainly contribute to red leaves in P. bournei.

3.2. The Genes Involved in Anthocyanin Biosynthesis in Red Leaves of P. bournei

In general, changes in secondary metabolite levels are consistent with changes in the abundance of structural gene transcripts in the corresponding biosynthetic pathways [36], and transcriptome sequencing provides the opportunity to analyze the expression of thousands of genes simultaneously [37]. In the present study, the combined transcriptome and metabolome analysis showed that the cascade pathway from phenylpropanoids to flavonoid compounds and, finally, anthocyanin biosynthesis was activated in the S1 stage and gradually decreased with leaf development, which may be a reasonable explanation for the higher anthocyanin level in the S1 stage. A total of 30 structural genes were identified as candidates for anthocyanin biosynthesis, of which 23 DEGs showed significantly higher expression levels in the S1 stage than in that in the S2 or S3 stage, showing a high correlation with the anthocyanin levels (Figure 7D). This result is consistent with several other studies that show that genes belonging to the early and late stages of anthocyanin synthesis regulate anthocyanin levels [38,39,40].
The phenylpropane pathway, which is the first stage of anthocyanin biosynthesis, is a common pathway for many of these metabolic processes. Previous studies have shown that anthocyanin accumulation is positively correlated with the structural genes PAL, 4CL, and C4H in the phenylpropane pathway [41]. For example, low expression of PAL in white Prunus persica limits anthocyanin production [38]. In the present study, the expression of PbPAL3, PbPAL4, PbC4H2, and Pb4CL7 was significantly higher in the S1 stage than in the S2 and S3 stages (p < 0.05), suggesting that the proteins they encode are likely to be the rate-limiting upstream enzymes of the anthocyanin metabolic pathway in P. bournei. Moreover, it was found that PbPAL10 and PbPAL13 may play different roles in the metabolic process. It has been reported that several 4CL sequences may be specifically expressed and regulate metabolism only in certain tissues. For example, Os4CL2 was specifically expressed in anthers and was strongly activated by UV irradiation in Oryza sativa, whereas other 4CL members are not expressed in anthers [42]. Therefore, future experimental characterization will be performed to elucidate the differences among these 4CL genes.
The second stage is the critical reaction stage of flavonoid metabolism. P-coumalic acid and 4-coumaroyl-CoA are catalyzed by CHS to synthesize chalcone, which is subsequently converted to naringenin by CHI, and then, naringenin is catalyzed by F3H to dihydrokaempferol [12]. A study found that the low expression levels of CHS and F3H in white petals reduced the dihydromyricetin (DHK) levels compared to those of red peach petals, thus inhibiting anthocyanin accumulation [43]. In this study, the expression levels of PbCHS1, PbCHS3, PbCHS4, PbCHI1, PbF3H1, PbF3H5, and PbF3H10 in the S1 stage were significantly higher than those in the S2 and S3 stages (p < 0.01), which allowed more anthocyanin precursor dihydrokaempferol to proceed to the next synthesis step. The genes F3’H, F3’5’H, and F3H are key enzymes located at branching points that direct the pathway to produce red–purple, blue, and orange–red color, respectively [11]. It has been reported that the expression of F3’H in Vitis vinifera is involved in the regulation of anthocyanin biosynthesis [44]. In the present study, we suggested that the high expression of F3’H stimulates higher consumption of the precursor substance dihydrokaempferol for increased dihyquercetin synthesis and reduced synthesis of leucopelargonidin. This phenomenon may be the reason why more cyanidin-based anthocyanins are synthesized.
The third stage is the formation of various anthocyanins catalyzed by DFR and ANS [45]. Here, these anthocyanins encounter a series of glycosylation and methylation modifications, resulting in more stable anthocyanins being transferred to vesicles for storage via GST [46]. For example, strong anthocyanin accumulation in purple turnips was attributed to the upregulation of DFR genes [47]. Although DFR can substantially increase anthocyanin accumulation in plants, its substrate specificity causes the accumulation of different anthocyanins [48]. In our study, one differentially expressed DRF gene was identified in the leaves of red-leaved P. bournei. We speculate that the substrate preference of PbDRF may also be one of the reasons for the high cyanidin-based anthocyanin level, but this speculation remains to be verified by follow-up experiments.
In Malus domestica, the expression level of ANS determines the petal anthocyanin level [49]. A similar result was observed in the present study, in which high expression of PbANS was observed. In the Japanese apricot (Prunus mume), UFGT enzyme activity was found to increase when the petals appeared red, which is the same pattern as the accumulation of anthocyanins [50]. In the present study, we also found similar results to the above, where the high expression of PbUFGT6 and PbUFGT11 in the S1 stage promoted the synthesis of anthocyanins and increased their stability in plants. The reduction in anthocyanins in YW5AF7, a white-fruited variety of wild strawberry (Fragaria vesca), was attributed to a premature stop codon in the glutathione S-transferase (GST) gene [51]. In the present study, the high expression of PbGST10, PbGST11, PbGST12, PbGST26, and PbGST27 in the S1 stage allowed more anthocyanins to be transferred to the vesicles, which led to the accumulation of more anthocyanins in red-leaved P. bournei in the S1 stage.

3.3. Transcription Factors Related to Anthocyanin Biosynthesis

Many studies have demonstrated that TFs play a key role in the anthocyanin biosynthetic pathway [19]. Of these TFs, R2R3-MYB, bHLH, and WD40 individually or collectively contribute to the transcriptional regulation of the structural genes for anthocyanin biosynthesis [52]. For example, MYB and bHLH transcription factors control anthocyanins in N. benthamiana leaves [53]. In this study, we identified two bHLH genes, which were highly homologous to bHLH genes that regulate anthocyanin synthesis in other species that had significantly higher expression in the S1 stage than in the S2 and S3 stages of leaf development. By transiently overexpressing PbbHLH1 and PbbHLH2 in N. tabacum leaves, we found that PbbHLH1 and PbbHLH2 could upregulate the PbF3′H gene and other structural genes of the anthocyanin biosynthesis pathway, thus enhancing anthocyanin accumulation. A similar phenomenon was observed in the apple species Malus domestica, where overexpression of MdbHLH51 in Arabidopsis thaliana increased anthocyanin content and upregulated the expression levels of structural genes related to anthocyanin biosynthesis [54]. The bHLH gene NnTT8 was involved in the positive regulation of anthocyanin biosynthesis in Nelumbo nucifera, contributing to pigment production and providing a research basis for breeding of new plant varieties and nutraceutical development [55].
Gene transcriptional levels are influenced by cis-acting elements of their promoters, and different types and numbers of these elements lead to distinct gene expression patterns [56]. For many horticultural plants, ultraviolet radiation is necessary for anthocyanin biosynthesis in organs such as plant leaves [57]. In P. bournei, we found light-, temperature-, and hormone-related elements in the promoter regions of PbbHLH1 and PbbHLH2. Therefore, it is speculated that these elements might lead to the elevated expression of the two PbbHLHs in the S1 stage, resulting in more anthocyanin accumulation. A similar result was observed in a pear species, in which the expression level of PpbHLH64 was mediated by light at the transcriptional and posttranslational levels and positively regulated anthocyanin biosynthesis [58]. Temperature is also another major factor affecting anthocyanin biosynthesis, with low temperatures inducing anthocyanin synthesis and high temperatures inhibiting it for most plants [59]. For instance, the expression level of the bHLH gene BrTT8 was significantly increased after low-temperature induction in the purple variety of Brassica rapa, resulting in increased anthocyanin biosynthesis [60].
Plant hormones are the main internal factors affecting anthocyanin accumulation [61]. Jasmonic acid (JA) is an important plant hormone, and in an apple species, the JAZ protein was found to interact with MYB and bHLH proteins to inhibit MBW protein complex formation, but this inhibition was reduced by JA treatment [62]. ABA is a key hormone for plants in response to various stresses and development and initiates the biosynthesis of plant anthocyanins in Prunus fruits [63]. In addition, auxins and cytokinins have also been found to influence anthocyanin biosynthesis. Moreover, the auxin signal elements AUX/IAAs and ARFs play key roles in regulating anthocyanin synthesis by directly interacting with the MBW complex and inhibiting its activity [64]. Therefore, we analyzed the cis-acting element of the PbbHLH1 and PbbHLH2 (Figure S3). We speculated that the two PbbHLH genes might play important roles in the anthocyanin biosynthesis of red-leaved P. bournei, and their expression levels might be regulated by light, temperature, and hormones. However, the regulatory mechanisms need further experimental verification.

4. Materials and Methods

4.1. Plant Materials

P. bournei plants were cultivated in the Qingyuan Experimental Forest Farm (118°24′ E, 29°08′ N), Lishui, China. Three 7-year-old “red” individuals of P. bournei were used to characterize the leaf color (Figure 1A). In April 2019, leaves from three developmental stages were used for transcriptome and metabolome analyses. Three biological replicates of each stage were performed, and samples were immediately frozen in liquid nitrogen and stored at ′80 °C.

4.2. Determination of Plant Pigments

4.2.1. Determination of Total Anthocyanin Content (TAC)

TAC were extracted following the method described in [65] with some modifications. Specifically, 0.5 g of freeze-dried leaf powder was placed in 10 mL of methanol (containing 1% HCL) extract, shaken well, covered to protect it from light, and sonicated for 1 h. After centrifugation (5000 rpm, 10 min), the supernatant was used for anthocyanin content determination. Then, 2 mL of supernatant was aspirated and mixed with 8 mL of potassium chloride-hydrochloric acid buffer (pH 1.0) and sodium acetate-iceacetic acid buffer (pH 4.5), respectively, and the mixture was incubated in a dark room at 40 degrees for 30 min. The absorbance of mixture supernatant solutions was measured at 520 nm for anthocyanin content and 700 nm for haze correction using a UV–vis spectrophotometer (Thermo Scientific Co., Ltd., Wilmington, NC, USA) with 1 cm path length cuvettes. All absorbance measurements were performed at room temperature with distilled water as a blank control.

4.2.2. Determination of Photosynthetic Pigments

The photosynthetic pigment content of the plants was extracted following the method described in [66] with some modifications. Specifically, 0.3 g of leaves was added to centrifuge test tubes, and 10 mL of ethanol-acetone (1:1, v:v) extraction solution was added so that the leaves were completely immersed in the liquid. The centrifuge tubes were capped and incubated in a dark oven at 30 °C until the leaves were completely decolored. The mixture was centrifuged (3000 rpm, 10 min), and the supernatant was used for the assay. The absorbance of the mixture supernatant was measured at 663, 645, and 470 nm using an UV–vis spectrophotometer (Thermo Scientific Co., Ltd., Wilmington, NC, USA) to determine the photosynthetic pigment content. All absorbance measurements were performed at room temperature using distilled water as a blank control.

4.3. Metabolomic Analysis of Anthocyanins

Metabolomic profiling was performed using the targeted metabolome method at Metware Biotechnology Co., Ltd. (Wuhan, Hubei, China). Briefly, leaves from three developmental stages were freeze-dried with a lyophilizer (100F, Scientz) and crushed with a mixer mill (MM400, Retsch) at 30 Hz for 1.5 min. Fifty milligrams of lyophilized leaf powder was dissolved in 500 μL of extraction solution (50% methanolic water containing 1% hydrochloric acid), vortexed for 10 min, sonicated for 10 min, and centrifuged (12,000 r/min) for 3 min [67]. The supernatant was aspirated and saved, and the process was repeated again. The two supernatants were combined and filtered through a 0.22 μm filter membrane, and then, the extracts were analyzed using Ultra Performance Liquid Chromatography-Tandem Mass Spectrometry (UPLC–MS/MS). A C18 column (1.7 µm, 2.1 mm*100 mm) was used for separation, and the sample injection volume was 2 μL. The conditions for metabolites were as follows: column temperature, 40 °C; flow rate, 0.2 mL/min. The gradient was composed of (A) ultrapure water containing 0.1% formic acid and (B) methanol containing 0.1% formic acid, and the linear gradient was as follows (mobile phase A:mobile B): 95:5 v/v for 0 min, 50:50 v/v for 6 min, 5:95 v/v for 12 min held for two minutes, and adjusted to 95:5 v/v equilibrium for two minutes at 14 min [68].

4.4. RNA Extraction, Library Construction, and Sequencing

Total RNA was extracted using Invitrogen’s PureLinkTM Plant RNA reagent (Thermo Scientific Co., Ltd., Wilmington, NC, USA), and RNA integrity was evaluated using RIN/RQN on an Agilent 2100. Then, the mRNA was enriched from total RNA by oligo (dT) magnetic beads, followed by the addition of fragmentation buffer to break the RNA into fragments, and first-strand cDNA was synthesized in the M-MuLv reverse transcriptase system. Subsequently, buffer, dNTP, and DNA polymerase I were added to synthesize the double-stranded cDNA. Then, 250–300 bp of adapter-linked cDNA fragments were purified using the AMPure XP system, and PCR was performed [69]. Finally, the PCR products were purified, and library quality was assessed using the Agilent Bioanalyzer 2100 system. The cDNA library was sequenced using the Illumina XtenPE150 system by Biomarker Technologies Co., Ltd. (Beijing, China).

4.5. RNA-Seq Analysis and Differentially Expressed Gene (DEG) Identification

Transcriptome sequencing was performed as described above. The reads from the Hiseq X Ten platform were mapped to the reference genomic sequences of P. bournei using HISAT2. The raw sequencing data of P. bournei were deposited in NCBI under BioProject accession number PRJNA627308 [27]. Then, gene annotation was performed using National Center for Biotechnology Information (NCBI) nonredundant protein sequences (NR), EuKaryotic Orthologous Groups (KOG), Kyoto Encyclopedia of Genes and Genomes (KEGG), and Gene Ontology (GO).
FPKM (Fragments Per Kilobase of transcript per Million fragments mapped) was used as a measure of transcript or gene expression level, and FPKM was calculated as follows: FPKM = mapped fragments of transcript/Total Count of mapped fragments* Length of transcript (kb). The identification of DEGs between two developmental stages was performed using the DESeq2 software package with a DFR (false-discovery rate) threshold of <0.05 and log2 (fold change) ≥ 1 [70,71]. The structural genes related to anthocyanin biosynthesis in Arabidopsis thaliana were used as the search sequences, and the candidate structural genes were obtained by a local blast search in the protein database of P. bournei (p < 1 × 10⁻⁵). The Arabidopsis reference genome was derived from https://www.arabidopsis.org/ (5 January 2021). The conserved structural domains were verified by referring to the NR, KOG, KEGG, and GO annotations and then using CD-search (https://www.ncbi.nlm.nih.gov/Structure/bwrpsb/bwrpsb.cgi (1 February 2021) in NCBI to finally obtain the structural genes of anthocyanin biosynthesis in P. bournei.
K-means clustering of structural genes and TFs for anthocyanin biosynthesis was performed using SPSS software and visualized using tools in the Metware cloud platform (cloud.metware.cn). Multiple sequence alignments of bHLH regulating anthocyanin biosynthesis in Arabidopsis thaliana, Actinidia chinensis, Chrysanthemum × morifolium and all bHLH in Class1 and 2 were performed using Clusta W.
A phylogenetic tree was constructed using maximum likelihood in MEGA X. Bootstraps were set to 1000, and the cqREV model was selected, thereby screening for differentially expressed TFs that might regulate anthocyanin biosynthesis in P. bournei [72].

4.6. Molecular Cloning of PbbHLH1 and PbbHLH2

RNA was extracted as described above, and cDNA was synthesized using HiScript® III All-in-one RT SuperMix (Vazyme Co., Ltd., Nanjing, Jiangsu, China) and then used as a template for subsequent PCR amplification. Based on the P. bournei transcriptome data, two pairs of specific primers for PbbHLH1 and PbbHLH2 were designed. The gene-specific primers are listed in Table S1. T-clone vectors with PbbHLH1 and PbbHLH2 sequences were used as templates for high-fidelity PCR amplification using 2x TransStart FastPfu PCR SuperMix (Tiangen Biochemical Technology Co., Ltd., Beijing, China). After the PCR products were detected by 1% agarose gel electrophoresis, the fragments were recovered and purified using a Midi Purification kit (Tiangen Biochemical Technology Co., Beijing, China). Using the ClonExpress® II One Step Cloning Kit (Vazyme Co., Ltd., Nanjing, Jiangsu, China), PbbHLH1 and PbbHLH2 were cloned into the pK2GW7-eYGFPuv-3xFLAG overexpression vector with the Camv35S enhanced promoter and transformed into Agrobacterium tumefaciens strain GV3101.

4.7. Transient Expression Assay Using Nicotiana tabacum

Plates were cultured, and single colonies of Agrobacterium tumefaciens were selected for testing and incubated in YEP medium containing Rif and SPEC until they displayed an OD600 value of 0.6. One hundred milliliters of the resuspension solution containing acetosyringone, MgSO4, and MES was incubated until it displayed a OD600 of 0.6 and then was placed at room temperature for 1 h. Then, the Agrobacterium tumefaciens resuspension solution was inoculated on the surface of N. tabacum leaves with a syringe.

4.8. qPCR Analysis

Total RNA was extracted as above, and the purity and concentration were measured by a NanoDrop 2000 spectrophotometer (Thermo Scientific Co., Ltd., Wilmington, NC, USA). The first-strand cDNA was synthesized using the Prime-Script® RT reagent kit (Takara, Dalian, Liaoning, China) according to the manufacturer’s guidelines. qPCR was performed using SYBR® Premix Ex Taq II (Takara Co., Ltd., Dalian, Liaoning, China) on a CFX-96-well real-time PCR system (BioRad Co., Ltd., Hercules, CA, USA). The relative expression levels of target genes were calculated using the 2-−ΔΔCT method and normalized using EF1α and actin reference genes in P. bournei and N. tabacum, respectively. The primers of target genes and reference genes are listed in Supplementary Table S2. Three replicates were performed for each sample.

4.9. Statistical Analysis

Log2 transformations were performed for the raw metabolomic data prior to further analysis. The data were analyzed by principal component analysis (PCA) and orthonormal partial least squares regression–discriminant analysis (OPLS-DA) using the SIMACA-P 13.0 software package [73]. Heatmap performed using the Metware Cloud, a free online platform for data analysis (https://cloud.metware.cn (accessed on 10 August 2022)). All data were analyzed using SPSS and displayed as the mean ± standard deviation (SD) (n = 3). The data were analyzed using one-way ANOVA and Duncan’s test, with significance set at p < 0.05. Pearson correlation analysis was performed, and these relationships were visualized using Cytoscape software (version 3.8.2) [74].

5. Conclusions

Collectively, the mechanisms underlying anthocyanin accumulation in P. bournei leaves were analyzed by combined metabolomic and transcriptomic analyses. At least 26 anthocyanins exhibited significant differences among leaves in different developmental stages, and cya-3-O-glu was identified as the major anthocyanin present in red leaves. Moreover, anthocyanin biosynthetic genes were identified, and co-expression analysis suggested that PbF3’H is the key gene involved in cya-3-O-glu accumulation. Moreover, two bHLH genes (PbbHLH1 and PbbHLH2) are involved in the anthocyanin synthesis pathway and may regulate the expression of structural genes for anthocyanin biosynthesis in P. bournei. Furthermore, the overexpression of PbbHLH1 and PbbHLH2 in N. tabacum leaves increased the anthocyanin levels and upregulated the expression levels of structural genes. This study improves our understanding of anthocyanin accumulation and the molecular mechanism underlying anthocyanin biosynthesis in P. bournei leaves. However, whether the transcription factors PbbHLH1 and PbbHLH2 work together with other transcription factors to regulate other structural groups of anthocyanin biosynthesis, thereby promoting anthocyanin accumulation, needs further investigation.

Supplementary Materials

The supporting information can be downloaded at: https://www.mdpi.com/article/10.3390/ijms24043829/s1.

Author Contributions

Conceptualization, Z.T. and J.Z.; methodology, L.W., M.S. and Q.W.; data curation, Q.Y. and N.F.; writing—original draft preparation, L.W. and Q.W.; writing—review and editing, J.Z., X.H. and Y.Z.; project administration, Z.T. and J.Z.; funding acquisition, J.Z. and Z.T. All authors have read and agreed to the published version of the manuscript.

Funding

This study was supported by the Zhejiang Science and Technology Major Program on Agricultural New Variety Breeding (Grant No. 2021C02070-10) and the National Natural Science Foundation of China (Grant No. 32171828).

Institutional Review Board Statement

Not applicable.

Informed Consent Statement

Not applicable.

Data Availability Statement

Not applicable.

Conflicts of Interest

The authors declare no conflict of interest.

References

  1. Zhang, H.N.; Li, W.C.; Wang, H.C.; Shi, S.Y.; Shu, B.; Liu, L.Q.; Wei, Y.Z.; Xie, J.H. Transcriptome Profiling of Light-Regulated Anthocyanin Biosynthesis in the Pericarp of Litchi. Front. Plant Sci. 2016, 7, 963. [Google Scholar] [CrossRef] [PubMed]
  2. Qiao, Z.; Liu, S.; Zeng, H.; Li, Y.; Wang, X.; Chen, Y.; Wang, X.; Cai, N. Exploring the Molecular Mechanism underlying the Stable Purple-Red Leaf Phenotype in Lagerstroemia indica cv. Ebony Embers. Int. J. Mol. Sci. 2019, 20, 5636. [Google Scholar] [CrossRef] [PubMed]
  3. Jin, X.; Huang, H.; Wang, L.; Sun, Y.; Dai, S. Transcriptomics and Metabolite Analysis Reveals the Molecular Mechanism of Anthocyanin Biosynthesis Branch Pathway in Different Senecio cruentus Cultivars. Front. Plant Sci. 2016, 7, 1307. [Google Scholar] [CrossRef] [PubMed]
  4. Andersen, Ø.M.; Jordheim, M. Anthocyanins. In Encyclopedia of Life Sciences (ELS); eLS: New York, NY, USA, 2010. [Google Scholar]
  5. Ono, E.; Fukuchi-Mizutani, M.; Nakamura, N.; Fukui, Y.; Yonekura-Sakakibara, K.; Yamaguchi, M.; Nakayama, T.; Tanaka, T.; Kusumi, T.; Tanaka, Y. Yellow flowers generated by expression of the aurone biosynthetic pathway. Proc. Natl. Acad. Sci. USA 2006, 103, 11075–11080. [Google Scholar] [CrossRef]
  6. Han, L.; Zou, H.; Zhou, L.; Wang, Y. Transcriptome-Based Identification and Expression Analysis of the Glutathione S-Transferase (GST) Family in Tree Peony Reveals a Likely Role in Anthocyanin Transport. Hortic. Plant J. 2022, 8, 787–802. [Google Scholar] [CrossRef]
  7. Alappat, B.; Alappat, J. Anthocyanin Pigments: Beyond Aesthetics. Molecules 2020, 25, 5500. [Google Scholar] [CrossRef]
  8. Huang, D.; Ming, R.; Yao, S.; Li, L.; Huang, R.; Tan, Y. Identification of anthocyanins in the fruits of Kadsura coccinea using UPLC-MS/MS-based metabolomics. Biochem. Syst. Ecol. 2021, 98, 104324. [Google Scholar] [CrossRef]
  9. Bao, Y.; Nie, T.; Wang, D.; Chen, Q. Anthocyanin regulatory networks in Solanum tuberosum L. leaves elucidated via integrated metabolomics, transcriptomics, and StAN1 overexpression. BMC Plant Biol. 2022, 22, 228. [Google Scholar] [CrossRef]
  10. Petroni, K.; Tonelli, C. Recent advances on the regulation of anthocyanin synthesis in reproductive organs. Plant Sci. 2011, 181, 219–229. [Google Scholar] [CrossRef]
  11. Jaakola, L. New insights into the regulation of anthocyanin biosynthesis in fruits. Trends Plant Sci. 2013, 18, 477–483. [Google Scholar] [CrossRef] [Green Version]
  12. Springob, K.; Nakajima, J.; Yamazaki, M.; Saito, K. Recent advances in the biosynthesis and accumulation of anthocyanins. Nat. Prod. Rep. 2003, 20, 288–303. [Google Scholar] [CrossRef] [PubMed]
  13. Mouradov, A.; Spangenberg, G. Modification of Flavonoid Biosynthesis in Plants. US20090113573, 30 April 2009. [Google Scholar]
  14. Liu, Y.; Ma, K.; Qi, Y.; Lv, G.; Ren, X.; Liu, Z.; Ma, F. Transcriptional Regulation of Anthocyanin Synthesis by MYB-bHLH-WDR Complexes in Kiwifruit (Actinidia chinensis). J. Agric. Food Chem. 2021, 69, 3677–3691. [Google Scholar] [CrossRef] [PubMed]
  15. Liu, X.; Feng, C.; Zhang, M.; Yin, X.; Xu, C.; Chen, K. The MrWD40-1 Gene of Chinese Bayberry (Myrica rubra) Interacts with MYB and bHLH to Enhance Anthocyanin Accumulation. Plant Mol. Biol. Rep. 2013, 31, 1474–1484. [Google Scholar] [CrossRef]
  16. Sun, Q.; Jiang, S.; Zhang, T.; Xu, H.; Fang, H.; Zhang, J.; Su, M.; Wang, Y.; Zhang, Z.; Wang, N. Apple NAC transcription factor MdNAC52 regulates biosynthesis of anthocyanin and proanthocyanidin through MdMYB9 and MdMYB11. Plant Sci. 2019, 289, 110286. [Google Scholar] [CrossRef] [PubMed]
  17. An, J.P.; Yao, J.F.; Xu, R.R.; You, C.X.; Wang, X.F.; Hao, Y.J. Apple bZIP transcription factor MdbZIP44 regulates abscisic acid-promoted anthocyanin accumulation. Plant Cell Environ. 2018, 41, 2678–2692. [Google Scholar] [CrossRef]
  18. Ma, H.; Yang, T.; Li, Y.; Zhang, J.; Wu, T.; Song, T.; Yao, Y.; Tian, J. The long noncoding RNA MdLNC499 bridges MdWRKY1 and MdERF109 function to regulate early-stage light-induced anthocyanin accumulation in apple fruit. Plant Cell 2021, 33, 3309–3330. [Google Scholar] [CrossRef]
  19. Ji, X.; Ren, J.; Zhang, Y.; Lang, S.; Wang, D.; Song, X. Integrated Analysis of the Metabolome and Transcriptome on Anthocyanin Biosynthesis in Four Developmental Stages of Cerasus humilis Peel Coloration. Int. J. Mol. Sci. 2021, 22, 11880. [Google Scholar] [CrossRef]
  20. Zhang, A.; Yang, H.; Ji, S.; Tian, C.; Chen, N.; Gong, H.; Li, J. Metabolome and Transcriptome Analyses of Anthocyanin Accumulation Mechanisms Reveal Metabolite Variations and Key Candidate Genes Involved in the Pigmentation of Prunus tomentosa Thunb. Cherry Fruit. Front. Plant Sci. 2022, 13, 938908. [Google Scholar] [CrossRef]
  21. Gao, Y.F.; Zhao, D.H.; Zhang, J.Q.; Chen, J.S.; Li, J.L.; Weng, Z.; Rong, L.P. De novo transcriptome sequencing and anthocyanin metabolite analysis reveals leaf color of Acer pseudosieboldianum in autumn. BMC Genom. 2021, 22, 383. [Google Scholar] [CrossRef]
  22. Anran, S.; Xiaona, P.; Shikai, Z.; Zhiming, H.; Ying, X.; Guanzheng, Q.; Xiaoqing, H.; Mulualem, T.; Xiyang, Z. Metabolome and Transcriptome Analyses Unravels Molecular Mechanisms of Leaf Color Variation by Anthocyanidin Biosynthesis in Acer triflorum. Horticulturae 2022, 8, 635. [Google Scholar] [CrossRef]
  23. Mei, Y.; Xie, H.; Liu, S.; Zhu, J.; Zhao, S.; Wei, C. Metabolites and Transcriptional Profiling Analysis Reveal the Molecular Mechanisms of the Anthocyanin Metabolism in the “Zijuan” Tea Plant (Camellia sinensis var. assamica). J. Agric. Food Chem. 2021, 69, 414–427. [Google Scholar] [CrossRef]
  24. Ge, Y.J.; Liu, Y.J.; Shen, A.H.; Lin, X.C. Fengshui forests conserve genetic diversity: A case study of Phoebe bournei (Hemsl.) Yang in southern China. Genet. Mol. Res. 2015, 14, 1986–1993. [Google Scholar] [CrossRef]
  25. Ye, Z.; Huang, S.; Zhu, J.; Zuo, H.; Tan, G. Propagation, maintenance and garden applications of four ornamental plants of the genus Camphoraceae. Guangdong Gard. 2016, 38, 48–51. [Google Scholar] [CrossRef]
  26. Yuan, L.; Niu, H.; Yun, Y.; Tian, J.; Lao, F.; Liao, X.; Gao, Z.; Ren, D.; Zhou, L. Analysis of coloration characteristics of Tunisian soft-seed pomegranate arils based on transcriptome and metabolome. Food Chem. 2022, 370, 131270. [Google Scholar] [CrossRef]
  27. Han, X.; Zhang, J.; Han, S.; Chong, S.L.; Meng, G.; Song, M.; Wang, Y.; Zhou, S.; Liu, C.; Lou, L. The chromosome-scale genome of Phoebe bournei reveals contrasting fates of terpene synthase (TPS)-a and TPS-b subfamilies. Plant Commun. 2022, 3, 100410. [Google Scholar] [CrossRef]
  28. Verediano, T.A.; Stampini Duarte Martino, H.; Dias Paes, M.C.; Tako, E. Effects of Anthocyanin on Intestinal Health: A Systematic Review. Nutrients 2021, 13, 1331. [Google Scholar] [CrossRef]
  29. Bi, X.; Zhang, J.; Chen, C.; Zhang, D.; Li, P.; Ma, F. Anthocyanin contributes more to hydrogen peroxide scavenging than other phenolics in apple peel. Food Chem. 2014, 152, 205–209. [Google Scholar] [CrossRef]
  30. Fu, M.; Yang, X.; Zheng, J.; Wang, L.; Yang, X.; Tu, Y.; Ye, J.; Zhang, W.; Liao, Y.; Cheng, S.; et al. Unraveling the Regulatory Mechanism of Color Diversity in Camellia japonica Petals by Integrative Transcriptome and Metabolome Analysis. Front. Plant Sci. 2021, 12, 685136. [Google Scholar] [CrossRef]
  31. Feng, X.; Gao, G.; Yu, C.; Zhu, A.; Chen, J.; Chen, K.; Wang, X.; Abubakar, A.S.; Chen, P. Transcriptome and metabolome analysis reveals anthocyanin biosynthesis pathway associated with ramie (Boehmeria nivea (L.) Gaud.) leaf color formation. BMC Genom. 2021, 22, 684. [Google Scholar] [CrossRef]
  32. Pan, L.; Li, J.; Yin, H.; Fan, Z.; Li, X. Integrated Physiological and Transcriptomic Analyses Reveal a Regulatory Network of Anthocyanin Metabolism Contributing to the Ornamental Value in a Novel Hybrid Cultivar of Camellia Japonica. Plants 2020, 9, 1724. [Google Scholar] [CrossRef]
  33. Zhong, Y.; Chen, C.; Gong, X.; Luan, X.; Wu, Z.; Li, H.; Liu, Q.; Xu, M.; Yu, F. Transcriptome and metabolome analyses reveal a key role of the anthocyanin biosynthetic pathway cascade in the pigmentation of a Cinnamomum camphora red bark mutant (‘Gantong 1′). Ind. Crops Prod. 2022, 175, 114236. [Google Scholar] [CrossRef]
  34. Veberic, R.; Slatnar, A.; Bizjak, J.; Stampar, F.; Mikulic-Petkovsek, M. Anthocyanin composition of different wild and cultivated berry species. LWT Food Sci. Technol. 2015, 60, 509–517. [Google Scholar] [CrossRef]
  35. Rao, M.J.; Duan, M.; Yang, M.; Fan, H.; Shen, S.; Hu, L.; Wang, L. Novel Insights into Anthocyanin Metabolism and Molecular Characterization of Associated Genes in Sugarcane Rinds Using the Metabolome and Transcriptome. Int. J. Mol. Sci. 2021, 23, 338. [Google Scholar] [CrossRef] [PubMed]
  36. Lu, J.; Zhang, Q.; Lang, L.; Jiang, C.; Wang, X.; Sun, H. Integrated metabolome and transcriptome analysis of the anthocyanin biosynthetic pathway in relation to color mutation in miniature roses. BMC Plant Biol. 2021, 21, 257. [Google Scholar] [CrossRef]
  37. Parchman, T.L.; Geist, K.S.; Grahnen, J.A.; Benkman, C.W.; Buerkle, C.A. Transcriptome sequencing in an ecologically important tree species: Assembly, annotation, and marker discovery. BMC Genom. 2010, 11, 180. [Google Scholar] [CrossRef]
  38. Jiao, Y.; Ma, R.J.; Shen, Z.J.; Yan, J.; Yu, M.L. Gene regulation of anthocyanin biosynthesis in two blood-flesh peach (Prunus persica (L.) Batsch) cultivars during fruit development. J. Zhejiang Univ. Sci. B 2014, 15, 809–819. [Google Scholar] [CrossRef]
  39. Chen, Z.; Lu, X.; Xuan, Y.; Tang, F.; Ren, J. Transcriptome analysis based on a combination of sequencing platforms provides insights into leaf pigmentation in Acer rubrum. BMC Plant Biol. 2019, 19, 240. [Google Scholar] [CrossRef]
  40. Teng, K.; Liu, L.; Fan, X.; Zhang, H.; Han, C.; Wu, J.; Chang, Z. Combination analysis of single-molecule long-read and Illumina sequencing provides insights into the anthocyanin accumulation mechanism in an ornamental grass, Pennisetum setaceum cv. Rubrum. Plant Mol. Biol. 2022, 109, 159–175. [Google Scholar] [CrossRef]
  41. Yu, M.; Man, Y.; Lei, R.; Lu, X.; Wang, Y. Metabolomics Study of Flavonoids and Anthocyanin-Related Gene Analysis in Kiwifruit (Actinidia chinensis) and Kiwiberry (Actinidia arguta). Plant Mol. Biol. Report. 2020, 38, 353–369. [Google Scholar] [CrossRef]
  42. Sun, H.; Li, Y.; Feng, S.; Zou, W.; Guo, K.; Fan, C.; Si, S.; Peng, L. Analysis of five rice 4-coumarate:coenzyme A ligase enzyme activity and stress response for potential roles in lignin and flavonoid biosynthesis in rice. Biochem. Biophys. Res. Commun. 2013, 430, 1151–1156. [Google Scholar] [CrossRef]
  43. Chen, Y.; Mao, Y.; Liu, H.; Yu, F.; Li, S.; Yin, T. Transcriptome analysis of differentially expressed genes relevant to variegation in peach flowers. PLoS ONE 2014, 9, e90842. [Google Scholar] [CrossRef]
  44. Jeong, S.T.; Goto-Yamamoto, N.; Hashizume, K.; Esaka, M. Expression of the flavonoid 3′-hydroxylase and flavonoid 3′,5′-hydroxylase genes and flavonoid composition in grape (Vitis vinifera). Plant Sci. 2005, 170, 61–69. [Google Scholar] [CrossRef]
  45. Russo, M.P.; Cotroneo, P.S.; Lo, P.A.R.; Consoli, A.; Reforgiato, R.G. Expression levels of CHS, DFR and ANS and anthocyanin content in 19 genotypes of Citrus. In Proceedings of the XLVII Italian Society of Agricultural Genetics-SIGA Annual Congress, Verona, Italy, 24–27 September 2003. [Google Scholar]
  46. Chapple, C.; Shirley, B.W.; Zook, M.; Hammerschmidt, R.; Somerville, S.C. 36 Secondary Metabolism in Arabidopsis. Cold Spring Harb. Monogr. Arch. 1994, 27. [Google Scholar] [CrossRef]
  47. Zhuang, H.; Lou, Q.; Liu, H.; Han, H.; Wang, Q.; Tang, Z.; Ma, Y.; Wang, H. Differential Regulation of Anthocyanins in Green and Purple Turnips Revealed by Combined De Novo Transcriptome and Metabolome Analysis. Int. J. Mol. Sci. 2019, 20, 4387. [Google Scholar] [CrossRef]
  48. Silan, D.; Yan, H. Molecular Breeding for Flower Colors Modification on Ornamental Plants Based on the Mechanism of Anthocyanins Biosynthesis and Coloration. Sci. Agric. Sin. 2016, 49, 529–542. [Google Scholar] [CrossRef]
  49. Jie, Z.; Han, Z.Y.; Ji, T. The expression level of anthocyanidin synthase determines the anthocyanin content of crabapple (Malus sp.) petals. Acta Physiol. Plant. 2015, 37, 109. [Google Scholar] [CrossRef]
  50. Wu, X.; Gong, Q.; Ni, X.; Zhou, Y.; Gao, Z. UFGT: The Key Enzyme Associated with the Petals Variegation in Japanese Apricot. Front. Plant Sci. 2017, 8, 108. [Google Scholar] [CrossRef]
  51. Luo, H.; Dai, C.; Li, Y.; Feng, J.; Liu, Z.; Kang, C. Reduced Anthocyanins in Petioles codes for a GST anthocyanin transporter that is essential for the foliage and fruit coloration in strawberry. J. Exp. Bot. 2018, 69, 2595–2608. [Google Scholar] [CrossRef]
  52. Moglia, A.; Florio, F.E.; Iacopino, S.; Guerrieri, A.; Milani, A.M.; Comino, C.; Barchi, L.; Marengo, A.; Cagliero, C.; Rubiolo, P.; et al. Identification of a new R3 MYB type repressor and functional characterization of the members of the MBW transcriptional complex involved in anthocyanin biosynthesis in eggplant (S. melongena L.). PLoS ONE 2020, 15, e0232986. [Google Scholar] [CrossRef]
  53. Outchkourov, N.S.; Carollo, C.A.; Gomez-Roldan, V.; De Vos, R.C.; Bosch, D.; Hall, R.D.; Beekwilder, J. Control of anthocyanin and non-flavonoid compounds by anthocyanin-regulating MYB and bHLH transcription factors in Nicotiana benthamiana leaves. Front. Plant Sci. 2014, 5, 519. [Google Scholar] [CrossRef] [Green Version]
  54. Ning, G.X.; Li, W.F.; Chu, M.Y.; Ma, Z.H.; Wang, P.; Mao, J.; Chen, B.H. MdbHLH51 plays a positive role in anthocyanin accumulation in ‘Red Delicious’ apples. Trees 2022, 36, 1687–1695. [Google Scholar] [CrossRef]
  55. Deng, J.; Li, J.; Su, M.; Lin, Z.; Chen, L.; Yang, P. A bHLH gene NnTT8 of Nelumbo nucifera regulates anthocyanin biosynthesis. Plant Physiol. Biochem. 2021, 158, 518–523. [Google Scholar] [CrossRef] [PubMed]
  56. Jin, H.; Xing, M.; Cai, C.; Li, S. B-box Proteins in Arachis duranensis: Genome-Wide Characterization and Expression Profiles Analysis. Agronomy 2019, 10, 23. [Google Scholar] [CrossRef]
  57. Neugart, S.; Schreiner, M. UVB and UVA as eustressors in horticultural and agricultural crops. Sci. Hortic. 2018, 234, 370–381. [Google Scholar] [CrossRef]
  58. Ruiyan, T.; Wenjie, Y.; Yuhao, G.; Junbei, N.; Lei, Y.; Xiao, Z.; Hongxu, L.; Dongsheng, W.; Songling, B.; Yuanwen, T. Light-induced basic/helix-loop-helix 64 enhances anthocyanin biosynthesis and undergoes CONSTITUTIVELY PHOTOMORPHOGENIC 1-mediated degradation in pear. Plant Physiol. 2020, 184, 1684–1701. [Google Scholar] [CrossRef]
  59. Gaiotti, F.; Pastore, C.; Filippetti, I.; Lovat, L.; Belfiore, N.; Tomasi, D. Low night temperature at veraison enhances the accumulation of anthocyanins in Corvina grapes (Vitis Vinifera L.). Sci. Rep. 2018, 8, 8719. [Google Scholar] [CrossRef]
  60. He, Q.; Ren, Y.; Zhao, W.; Li, R.; Zhang, L. Low Temperature Promotes Anthocyanin Biosynthesis and Related Gene Expression in the Seedlings of Purple Head Chinese Cabbage (Brassica rapa L.). Genes 2020, 11, 81. [Google Scholar] [CrossRef]
  61. Gu, K.-D.; Wang, C.-K.; Hu, D.-G.; Hao, Y.-J. How do anthocyanins paint our horticultural products? Sci. Hortic. 2019, 249, 257–262. [Google Scholar] [CrossRef]
  62. An, J.P.; Li, H.H.; Song, L.Q.; Su, L.; Liu, X.; You, C.X.; Wang, X.F.; Hao, Y.J. The molecular cloning and functional characterization of MdMYC2, a bHLH transcription factor in apple. Plant Physiol. Biochem. 2016, 108, 24–31. [Google Scholar] [CrossRef]
  63. Shen, X.; Zhao, K.; Liu, L.; Zhang, K.; Yuan, H.; Liao, X.; Wang, Q.; Guo, X.; Li, F.; Li, T. A role for PacMYBA in ABA-regulated anthocyanin biosynthesis in red-colored sweet cherry cv. Hong Deng (Prunus avium L.). Plant Cell Physiol. 2014, 55, 862–880. [Google Scholar] [CrossRef]
  64. Ji, X.-H.; Zhang, R.; Wang, N.; Yang, L.; Chen, X.-S. Transcriptome profiling reveals auxin suppressed anthocyanin biosynthesis in red-fleshed apple callus (Malus sieversii f. niedzwetzkyana). Plant Cell Tissue Organ Cult. PCTOC 2015, 123, 389–404. [Google Scholar] [CrossRef]
  65. Jiang, T.; Mao, Y.; Sui, L.; Yang, N.; Li, S.; Zhu, Z.; Wang, C.; Yin, S.; He, J.; He, Y. Degradation of anthocyanins and polymeric color formation during heat treatment of purple sweet potato extract at different pH. Food Chem. 2018, 274, 460–470. [Google Scholar] [CrossRef]
  66. Adriana, C.M.; Gheorghe, C.; Gabriela, N. Studies concerning the extraction of chlorophyll and total carotenoids from vegetables. Rom. Biotechnol. Lett. 2012, 17, 7702–7708. [Google Scholar]
  67. De Ferrars, R.M.; Czank, C.; Saha, S.; Needs, P.W.; Zhang, Q.; Raheem, K.S.; Botting, N.P.; Kroon, P.A.; Kay, C.D. Methods for isolating, identifying, and quantifying anthocyanin metabolites in clinical samples. Anal. Chem. 2014, 86, 10052–10058. [Google Scholar] [CrossRef]
  68. Cruz, A.A.D.l.; Hilbert, G.; Rivière, C.; Mengin, V.; Ollat, N.; Bordenave, L.; Decroocq, S.; Delaunay, J.-C.; Delrot, S.; Mérillon, J.-M.; et al. Anthocyanin identification and composition of wild Vitis spp. accessions by using LC–MS and LC–NMR. Anal. Chim. Acta 2012, 732, 145–152. [Google Scholar] [CrossRef]
  69. Parkhomchuk, D.; Borodina, T.; Amstislavskiy, V.; Banaru, M.; Hallen, L.; Krobitsch, S.; Lehrach, H.; Soldatov, A. Transcriptome analysis by strand-specific sequencing of complementary DNA. Nucleic Acids Res. 2009, 37, e123. [Google Scholar] [CrossRef]
  70. Love, M.I.; Huber, W.; Anders, S. Moderated estimation of fold change and dispersion for RNA-seq data with DESeq2. Genome Biol. 2014, 15, 550. [Google Scholar] [CrossRef]
  71. Varet, H.; Brillet-Gueguen, L.; Coppee, J.Y.; Dillies, M.A. SARTools: A DESeq2- and EdgeR-Based R Pipeline for Comprehensive Differential Analysis of RNA-Seq Data. PLoS ONE 2016, 11, e0157022. [Google Scholar] [CrossRef]
  72. Yi, D.; Zhang, H.; Lai, B.; Liu, L.; Pan, X.; Ma, Z.; Wang, Y.; Xie, J.; Shi, S.; Wei, Y. Integrative Analysis of the Coloring Mechanism of Red Longan Pericarp through Metabolome and Transcriptome Analyses. J. Agric. Food Chem. 2021, 69, 1806–1815. [Google Scholar] [CrossRef]
  73. Liu, F.; Chen, G.; Zhang, Y.; Zhao, P.; Dong, D.; Wang, Y.; Wang, S.; Yang, Y. A Comparative Analysis of Metabolome Reveals the Regulation of the Anthocyanin Biosynthesis Branch in Potatoes. Potato Res. 2022, 1–20. [Google Scholar] [CrossRef]
  74. Otasek, D.; Morris, J.H.; Boucas, J.; Pico, A.R.; Demchak, B. Cytoscape Automation: Empowering workflow-based network analysis. Genome Biol. 2019, 20, 185. [Google Scholar] [CrossRef] [PubMed] [Green Version]
Figure 1. Leaf color parameters and pigment level of red-leaved P. bournei and green-leaved P. bournei. (A) Leaves of three developmental stages of different color P. bournei; (B) Analysis of Variance (ANOVA) on leaf color parameters. Means of different treatment groups (different lowercase letters indicate significant differences) had a significant difference at p ≤ 0.05. (C) Chromophore (carotenoids, chlorophylls, anthocyanins) levels and contrast analysis. Means of different treatment groups (different lowercase letters indicate significant differences) had a significant difference at p ≤ 0.05.
Ijms 24 03829 g001
Figure 2. Analysis of anthocyanin levels in three developmental stages of red P. bournei leaves. (A) Metabolites detected in leaves at three developmental stages; (B) heatmap analysis of all detected metabolites; (C) the principal component analysis (PCA) plot illustrates clear discrimination among metabolites in the three developmental stages.
Ijms 24 03829 g002
Figure 3. Identification of key metabolites between red P. bournei leaves in three developmental stages. (A) The The orthonormal partial least squares regression–discriminant analysis (OPLS-DA) loading plot of anthocyanin levels of the leaves in three developmental stages. P1, peonidin 3,5-O-diglucoside (peo-3,5-diglu); P2, peonidin-3-O-(6-O-p-coumaryl)-glucoside (peo-3-O-(6-O-malonyl)-glu); P3, petunidin 3-O-arabinoside (pet-3-O-ara); P4, peonidin 3-O-glucoside (peo-3-O-glu); P5, peonidin 3-O-rutinoside (peo-3-O-rut); P6, pelargonidin 3-O-rutinoside (pel-3-O-rut); P7, peonidin-3-O-(6-O-p-coumaryl)-glucoside (peo-3-O-(6-O-coumaryl)-glu); P8, pelargonidin 3-O-glucoside (pel-3-O-gly); D1, delphinidin 3-O-arabinoside (del-3-O-ara); D2, delphinidin 3-O-sophoroside(del-3-O-sop); D3, delphinidin 3-O-galactoside (del-3-O-gla); D4, delphinidin 3-O-glucoside (del-3-O-glu); D5, delphinidin 3-O-rutinoside (del-3-O-rut); D6, delphinidin-3-rutinoside 5-glucoside (del-3-rut-5-glu); C1, cyanidin-3-O-(coumaryl)-glucoside (cya-3-O-(coumaryl)-glu); C2, cyanidin-3-rutinoside 5-glucoside (cya-3-O-rut-5-O-glu); C3, cyanidin 3-O-arabinoside (cya-3-O-ara); C4, cyanidin 3,5-O-diglucoside (cya-3,5-O-diglu); C5, cyanidin-3-O-xyloside (cya-3-O-xyl); C6, cyanidin 3-O-(6-O-malonyl-beta-D-glucoside) (cya-3-O-(6-O-malonyl)-glu); C7, cyanidin 3-O-galactoside (cya-3-O-gal); C8, cyanidin 3-O-rutinoside (cya-3-O-rut); C9, cyanidin 3-O-glucoside (cya-3-O-glu); C10, cyanidin 3-O-sophoroside (cya-3-O-sop); C11, cyanidin 3-O-sambubioside (cya-3-O-sam); M1, malvidin 3-O-glucoside (mal-3-O-glu). (B) Absolute levels of cya-3-O-glu were measured by anthocyanin-targeted metabolism analysis. Means of different treatment groups (different lowercase letters indicate significant differences) had a significant difference at p ≤ 0.05; (C) chromatograms of cya-3-O-glu in P. bournei leaves at different developmental stages as determined by High-performance liquid chromatography (HPLC); (D) standard curve created using cya-3-O-glu standard concentrations; (E) absolute levels of cya-3-O-glu measured by HPLC. Means of different treatment groups (different lowercase letters indicate significant differences) had a significant difference at p ≤ 0.05.
Ijms 24 03829 g003
Figure 4. Identification and Kyoto Encyclopedia of Genes and Genomes (KEGG) enrichment of differentially expressed genes (DEGs) in three developmental stages of red P. bournei leaves. (A) Volcano plots of DEGs; green, red, and blue dots represent the downregulated, upregulated, and non-differentially expressed genes, respectively; (C) Venn diagram of DEGs in each comparison group. KEGG enrichment analysis of the DEGs between; (B) S1 vs. S2; (D) S2 vs. S3 and (E) S1 vs. S3. The red circle highlights the flavonoid biosynthetic process and anthocyanin biosynthetic process.
Ijms 24 03829 g004
Figure 5. Reconstruction of anthocyanin biosynthetic pathways during leaf development using differentially expressed structural genes. (A) Anthocyanin levels at three developmental stages; (B) expression of differentially expressed structural genes at three developmental stages. PAL, phenylalanine ammonia-lyase; C4H, Cinnamate 4-hydroxylase; 4CL, 4-coumarate-CoA ligase; CHS, chalcone synthase; CHI, chalcone isomerase; F3H, flavanone 3-hydroxylase; F3′H, Flavonoid 3′-hydroxylase; DFR, dihydro flavonol reductase; ANS, anthocyanidin synthase; UFGT, UDP-glycose flavonoid glycosyltransferase; GST, glutathione s-transferase.
Ijms 24 03829 g005
Figure 6. Comprehensive analysis of the transcriptome and metabolome and identification of key structural genes and transcription factors. (A) Six subclasses of co-expressed genes and their kinetic patterns during leaf development. (B) Correlation analysis of DEGs and differentially expressed metabolites (DAMs). The red line indicates a positive correlation, and the blue line indicates a negative correlation. The line thickness represents the correlation index, and correlations with R > 0.8 and p < 0.05 were deemed significant. (C,D) The expression patterns of PbF3′H, PbbHLH1, and PbbHLH2 between leaves in three developmental stages were evaluated. Quantitative Real-time PCR (expression levels were calculated for PbF3′H, PbbHLH1, and PbbHLH2 and EF1α expression was used for normalization in P. bournei. Each value is the mean of three replicates, and the error line indicates the standard deviation. (E) Analysis of cis-acting elements of the promoter of PbF3′H in P. bournei.
Ijms 24 03829 g006
Figure 7. Overexpression of PbbHLH1 and PbbHLH2 increased anthocyanin accumulation in N. tabacum leaves. (A) Consistent expression of the internal reference gene actin in the WT, EV, and OE leaves as determined by semiqPCR. (B) Relative expression levels of PbbHLH1 and PbbHLH2 in the WT, EV, and OE leaves by semiqPCR. (C) The anthocyanin levels in the PbbHLH1 and PbbHLH2-overexpressing leaves of N. tabacum. At least three independent experiments were performed for each sample, and data are shown as the mean ± SD. Means of different treatment groups (different lowercase letters indicate significant differences) had a significant difference at p ≤ 0.05; (D) The expression levels of anthocyanin biosynthesis-related genes in the WT, EV, OE1, and OE2 leaves of N. tabacum leaves. The significant difference threshold was set at p < 0.05. Means of different treatment groups (different lowercase letters indicate significant differences) had a significant difference at p ≤ 0.05.
Ijms 24 03829 g007
Disclaimer/Publisher’s Note: The statements, opinions and data contained in all publications are solely those of the individual author(s) and contributor(s) and not of MDPI and/or the editor(s). MDPI and/or the editor(s) disclaim responsibility for any injury to people or property resulting from any ideas, methods, instructions or products referred to in the content.

