Proteotranscriptomic Discrimination of Tumor and Normal Tissues in Renal Cell Carcinoma
Abstract
:1. Introduction
2. Results
2.1. Database Setup
2.2. Genes Over-Expressed in ccRCC
2.3. Proteomic Analysis
2.4. Survival Analysis Using Proteome-Level Data
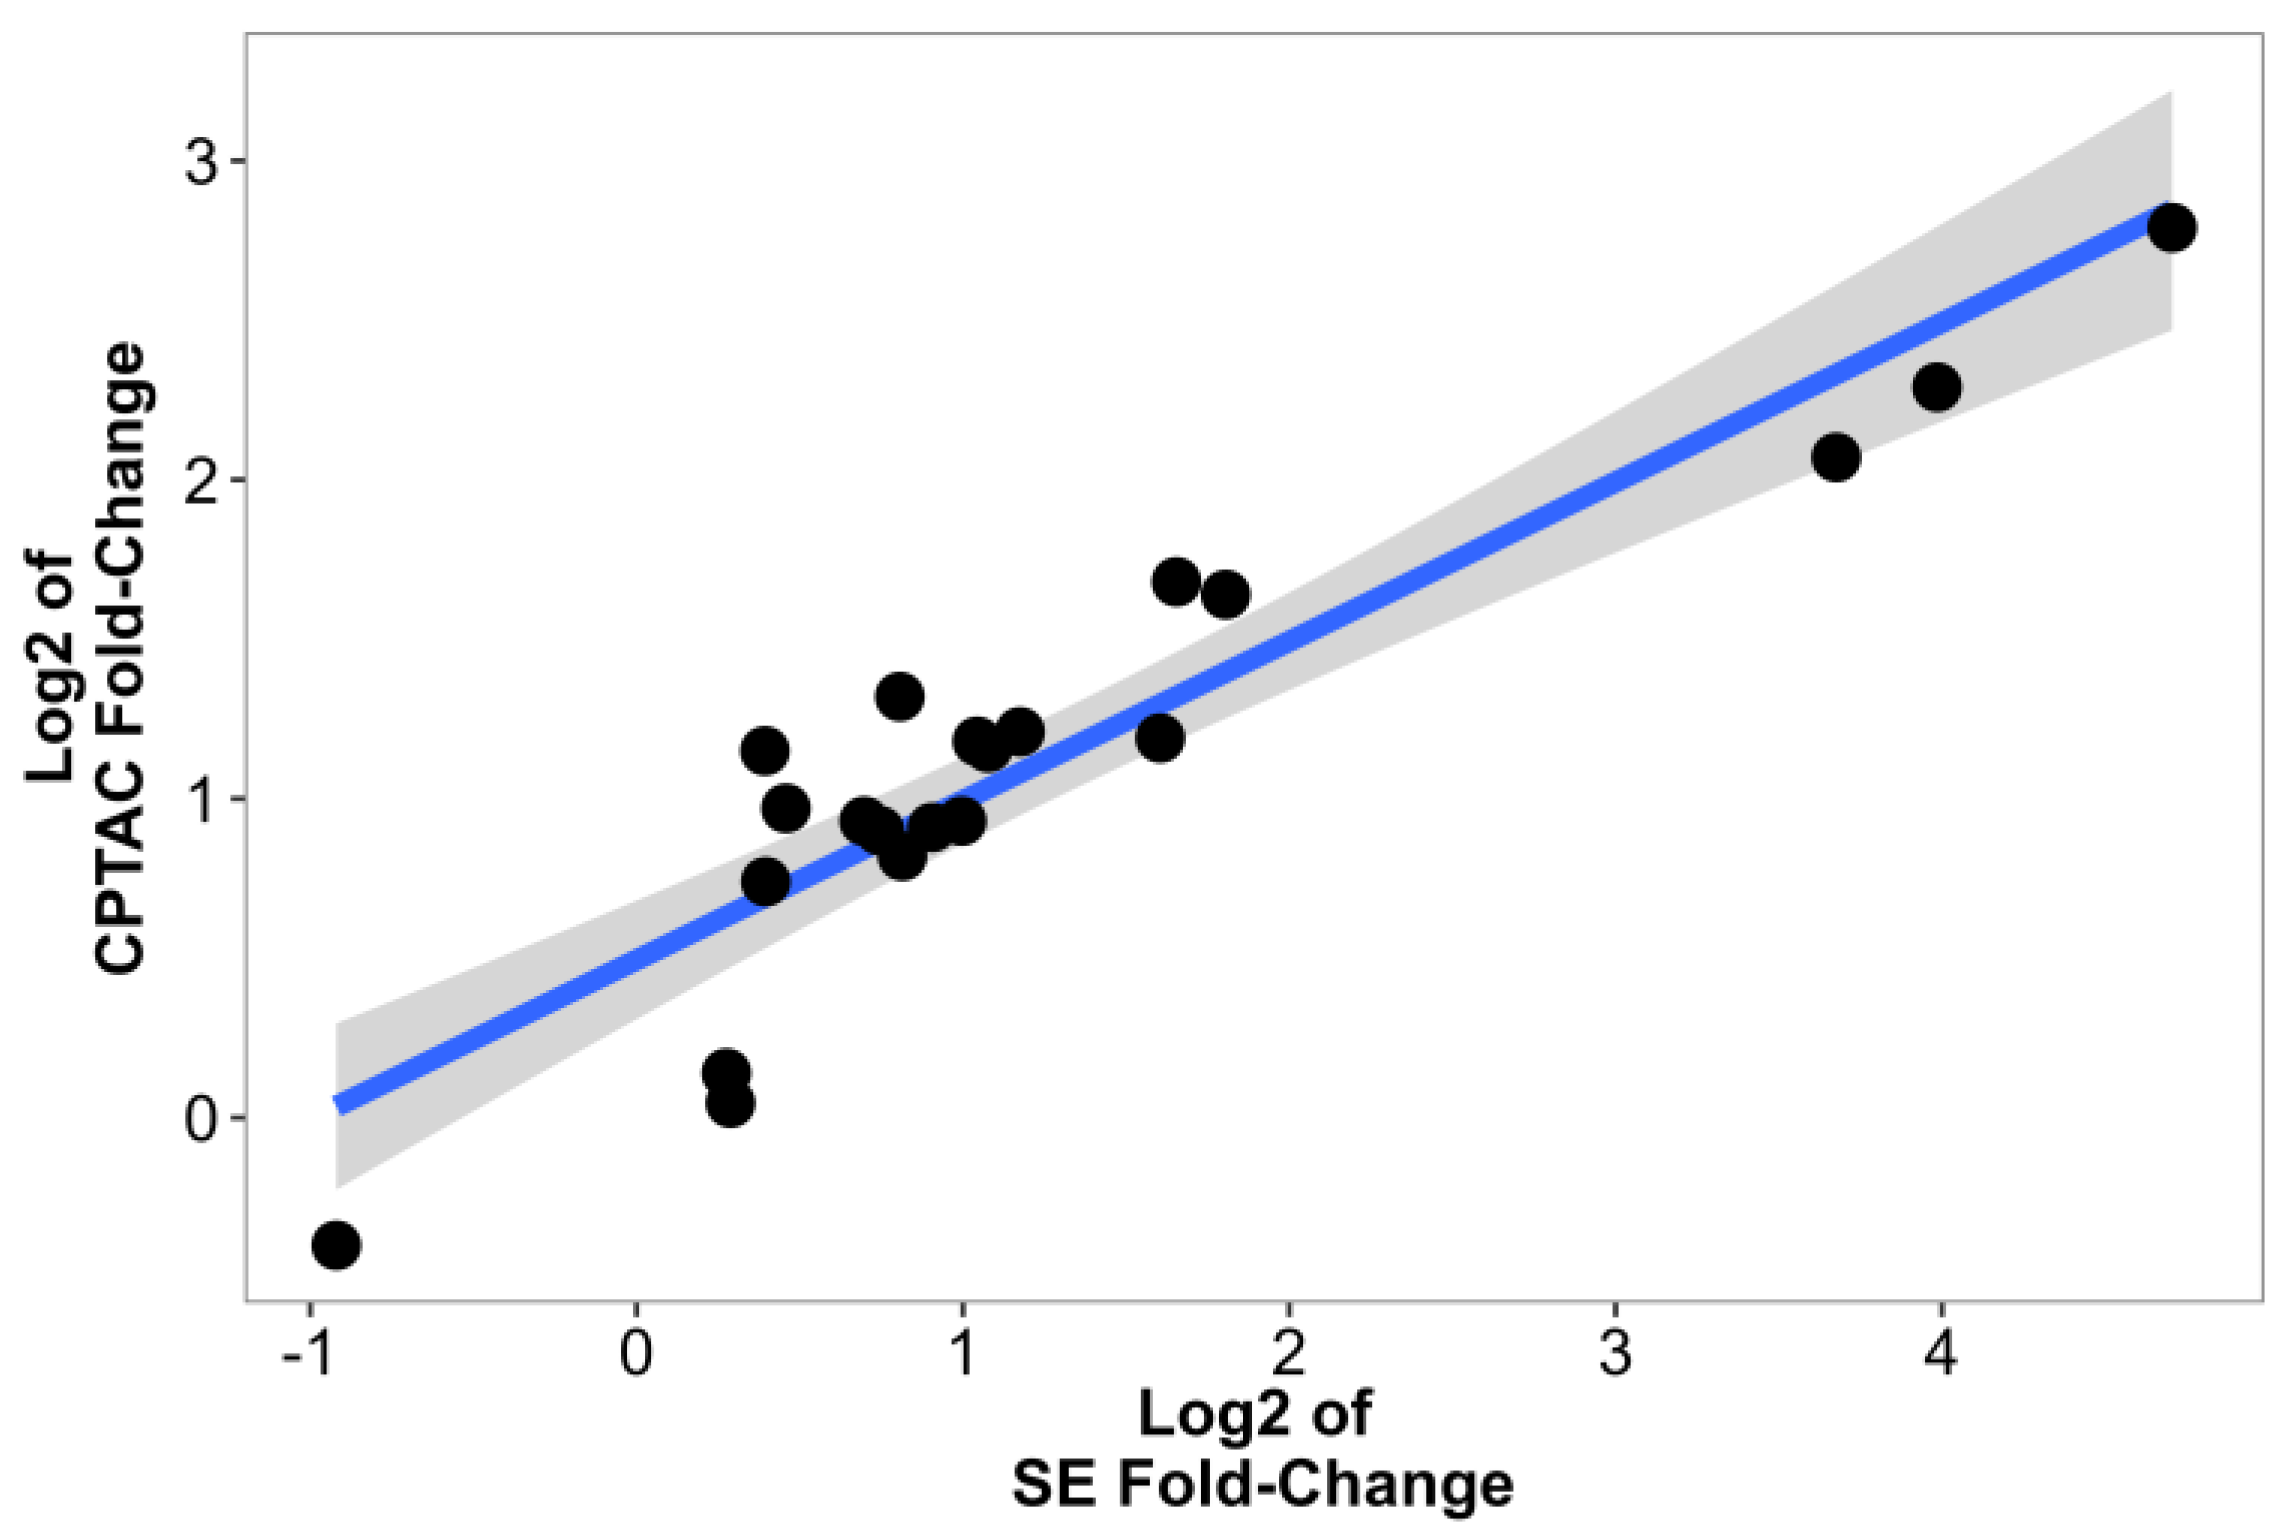
2.5. Validation Using Data from CPTAC
2.6. ccRCC-Specific Model Creation
3. Discussion
4. Materials and Methods
4.1. Gene Chip Database Comprising Normal and Tumor Tissues
4.2. Determining Differentially Expressed Genes
4.3. Ethics Statement
4.4. Sample Collection
4.5. Targeted Liquid Chromatography Coupled Tandem Mass Spectrometry (LC-MS/MS) Analysis
4.6. Statistical and Functional Analysis, Data Visualization
4.7. Building a Model for ccRCC Detection
Supplementary Materials
Author Contributions
Funding
Institutional Review Board Statement
Informed Consent Statement
Data Availability Statement
Conflicts of Interest
References
- Chow, W.-H.; Dong, L.M.; Devesa, S.S. Epidemiology and risk factors for kidney cancer. Nat. Rev. Urol. 2010, 7, 245–257. [Google Scholar] [CrossRef] [Green Version]
- Sung, H.; Ferlay, J.; Siegel, R.L.; Laversanne, M.; Soerjomataram, I.; Jemal, A.; Bray, F. Global Cancer Statistics 2020: Globocan estimates of incidence and mortality worldwide for 36 cancers in 185 countries. CA Cancer J. Clin. 2021, 71, 209–249. [Google Scholar] [CrossRef] [PubMed]
- Motzer, R.J.; Jonasch, E.; Boyle, S.; Carlo, M.I.; Manley, B.; Agarwal, N.; Alva, A.; Beckermann, K.; Choueiri, T.K.; Costello, B.A.; et al. NCCN Guidelines Insights: Kidney Cancer, Version 1.2021. J. Natl. Compr. Cancer Netw. 2020, 18, 1160–1170. [Google Scholar] [CrossRef] [PubMed]
- Hsieh, J.J.; Purdue, M.P.; Signoretti, S.; Swanton, C.; Albiges, L.; Schmidinger, M.; Heng, D.Y.; Larkin, J.; Ficarra, V. Renal cell carcinoma. Nat. Rev. Dis. Prim. 2017, 3, 17009. [Google Scholar] [CrossRef] [PubMed]
- Campbell, S.; Uzzo, R.G.; Allaf, M.E.; Bass, E.B.; Cadeddu, J.A.; Chang, A.; Clark, P.E.; Davis, B.J.; Derweesh, I.H.; Giambarresi, L.; et al. Renal Mass and Localized Renal Cancer: AUA Guideline. J. Urol. 2017, 198, 520–529. [Google Scholar] [CrossRef] [Green Version]
- Choueiri, T.K.; Kaelin, W.G., Jr. Targeting the HIF2-VEGF axis in renal cell carcinoma. Nat Med. 2020, 26, 1519–1530. [Google Scholar] [CrossRef]
- Battelli, C.; Cho, D.C. mTOR inhibitors in renal cell carcinoma. Therapy 2011, 8, 359–367. [Google Scholar] [CrossRef] [Green Version]
- Choueiri, T.K.; Motzer, R.J. Systemic Therapy for Metastatic Renal-Cell Carcinoma. N. Engl. J. Med. 2017, 376, 354–366. [Google Scholar] [CrossRef]
- Buchbinder, E.I.; Dutcher, J.P.; Daniels, G.A.; Curti, B.D.; Patel, S.P.; Holtan, S.G.; Miletello, G.P.; Fishman, M.N.; Gonzalez, R.; Clark, J.I.; et al. Therapy with high-dose Interleukin-2 (HD IL-2) in metastatic melanoma and renal cell carcinoma following PD1 or PDL1 inhibition. J. Immunother. Cancer 2019, 7, 49. [Google Scholar] [CrossRef] [Green Version]
- Shackleton, C. Clinical steroid mass spectrometry: A 45-year history culminating in HPLC–MS/MS becoming an essential tool for patient diagnosis. J. Steroid Biochem. Mol. Biol. 2010, 121, 481–490. [Google Scholar] [CrossRef]
- Recent Advances in the Clinical Application of Mass Spectrometry. Ejifcc 2016, 27, 264–271.
- Jannetto, P.J.; Fitzgerald, R.L. Effective Use of Mass Spectrometry in the Clinical Laboratory. Clin. Chem. 2016, 62, 92–98. [Google Scholar] [CrossRef] [PubMed] [Green Version]
- Zhang, B.; Whiteaker, J.R.; Hoofnagle, A.N.; Baird, G.S.; Rodland, K.D.; Paulovich, A.G. Clinical potential of mass spectrometry-based proteogenomics. Nat. Rev. Clin. Oncol. 2019, 16, 256–268. [Google Scholar] [CrossRef] [PubMed]
- Clark, D.J.; Dhanasekaran, S.M.; Petralia, F.; Pan, J.; Song, X.; Hu, Y.; da Veiga Leprevost, F.; Reva, B.; Lih, T.-S.M.; Chang, H.-Y.; et al. Integrated Proteogenomic Characterization of Clear Cell Renal Cell Carcinoma. Cell 2019, 179, 964–983.e31. [Google Scholar] [CrossRef] [PubMed] [Green Version]
- Yanovich, G.; Agmon, H.; Harel, M.; Sonnenblick, A.; Peretz, T.; Geiger, T. Clinical Proteomics of Breast Cancer Reveals a Novel Layer of Breast Cancer Classification. Cancer Res. 2018, 78, 6001–6010. [Google Scholar] [CrossRef] [PubMed] [Green Version]
- Iglesias-Gato, D.; Wikström, P.; Tyanova, S.; Lavallee, C.; Thysell, E.; Carlsson, J.; Hägglöf, C.; Cox, J.; Andrén, O.; Stattin, P.; et al. The Proteome of Primary Prostate Cancer. Eur. Urol. 2016, 69, 942–952. [Google Scholar] [CrossRef]
- O’Leary, B.; Finn, R.S.; Turner, N.C. Treating cancer with selective CDK4/6 inhibitors. Nat. Rev. Clin. Oncol. 2016, 13, 417–430. [Google Scholar] [CrossRef] [PubMed]
- Guo, T.; Gu, C.; Li, B.; Xu, C. PLODs are overexpressed in ovarian cancer and are associated with gap junctions via connexin 43. Lab. Investig. 2021, 101, 564–569. [Google Scholar] [CrossRef]
- Kiyozumi, Y.; Iwatsuki, M.; Kurashige, J.; Ogata, Y.; Yamashita, K.; Koga, Y.; Toihata, T.; Hiyoshi, Y.; Ishimoto, T.; Baba, Y.; et al. PLOD2 as a potential regulator of peritoneal dissemination in gastric cancer. Int. J. Cancer 2018, 143, 1202–1211. [Google Scholar] [CrossRef] [PubMed] [Green Version]
- Webb, B.A.; Forouhar, F.; Szu, F.-E.; Seetharaman, J.; Tong, L.; Barber, D.L. Structures of human phosphofructokinase-1 and atomic basis of cancer-associated mutations. Nature 2015, 523, 111–114. [Google Scholar] [CrossRef] [Green Version]
- Moon, J.-S.; Kim, H.E.; Koh, E.; Park, S.; Jin, W.-J.; Park, B.-W.; Park, S.W.; Kim, K.-S. Krüppel-like Factor 4 (KLF4) Activates the Transcription of the Gene for the Platelet Isoform of Phosphofructokinase (PFKP) in Breast Cancer. J. Biol. Chem. 2011, 286, 23808–23816. [Google Scholar] [CrossRef] [Green Version]
- Wang, F.; Li, L.; Zhang, Z. Platelet isoform of phosphofructokinase promotes aerobic glycolysis and the progression of non-small cell lung cancer. Mol. Med. Rep. 2020, 23, 74. [Google Scholar] [CrossRef]
- Jin, L.; Shen, F.; Weinfeld, M.; Sergi, C. Insulin Growth Factor Binding Protein 7 (IGFBP7)-Related Cancer and IGFBP3 and IGFBP7 Crosstalk. Front. Oncol. 2020, 10, 727. [Google Scholar] [CrossRef]
- Chan, Y.X.; Alfonso, H.; Chubb, S.A.P.; Ho, K.K.Y.; Fegan, P.G.; Hankey, G.; Golledge, J.; Flicker, L.; Yeap, B.B. Higher IGFBP3 is associated with increased incidence of colorectal cancer in older men independently of IGF1. Clin. Endocrinol. 2017, 88, 333–340. [Google Scholar] [CrossRef] [PubMed]
- Conte, M.; Santoro, A.; Collura, S.; Martucci, M.; Battista, G.; Bazzocchi, A.; Morsiani, C.; Sevini, F.; Capri, M.; Monti, D.; et al. Circulating perilipin 2 levels are associated with fat mass, inflammatory and metabolic markers and are higher in women than men. Aging 2021, 13, 7931–7942. [Google Scholar] [CrossRef] [PubMed]
- Pisano, E.; Pacifico, L.; Perla, F.M.; Liuzzo, G.; Chiesa, C.; Lavorato, M.; Mingrone, G.; Fabrizi, M.; Fintini, D.; Severino, A.; et al. Upregulated monocyte expression of PLIN2 is associated with early arterial injury in children with overweight/obesity. Atherosclerosis 2021, 327, 68–75. [Google Scholar] [CrossRef] [PubMed]
- Morrissey, J.J.; Mobley, J.; Figenshau, R.S.; Vetter, J.; Bhayani, S.; Kharasch, E.D. Urine Aquaporin 1 and Perilipin 2 Differentiate Renal Carcinomas From Other Imaged Renal Masses and Bladder and Prostate Cancer. Mayo Clin. Proc. 2015, 90, 35–42. [Google Scholar] [CrossRef] [Green Version]
- Xu, W.-H.; Xu, Y.; Wang, J.; Tian, X.; Wu, J.; Wan, F.-N.; Wang, H.-K.; Qu, Y.-Y.; Zhang, H.-L.; Ye, D.-W. Procollagen-lysine, 2-oxoglutarate 5-dioxygenases 1, 2, and 3 are potential prognostic indicators in patients with clear cell renal cell carcinoma. Aging 2019, 11, 6503–6521. [Google Scholar] [CrossRef]
- Zhu, X.; Liu, S.; Yang, X.; Wang, W.; Shao, W.; Ji, T. P4HA1 as an unfavorable prognostic marker promotes cell migration and invasion of glioblastoma via inducing EMT process under hypoxia microenvironment. Am. J. Cancer Res. 2021, 11, 590–617. [Google Scholar]
- Wang, D.; Eraslan, B.; Wieland, T.; Hallström, B.; Hopf, T.; Zolg, D.P.; Zecha, J.; Asplund, A.; Li, L.; Meng, C.; et al. A deep proteome and transcriptome abundance atlas of 29 healthy human tissues. Mol. Syst. Biol. 2019, 15, e8503. [Google Scholar] [CrossRef]
- Gautier, L.; Cope, L.; Bolstad, B.M.; Irizarry, R.A. affy—Analysis of Affymetrix GeneChip data at the probe level. Bioinformatics 2004, 20, 307–315. [Google Scholar] [CrossRef] [PubMed] [Green Version]
- Li, Q.; Birkbak, N.J.; Gyorffy, B.; Szallasi, Z.; Eklund, A.C. Jetset: Selecting the optimal microarray probe set to represent a gene. BMC Bioinform. 2011, 12, 474. [Google Scholar] [CrossRef] [PubMed] [Green Version]
- Gallien, S.; Kim, S.Y.; Domon, B. Large-Scale Targeted Proteomics Using Internal Standard Triggered-Parallel Reaction Monitoring (IS-PRM)*. Mol. Cell. Proteom. 2015, 14, 1630–1644. [Google Scholar] [CrossRef] [Green Version]
- Yu, G.; Wang, L.-G.; Han, Y.; He, Q.-Y. clusterProfiler: An R Package for Comparing Biological Themes Among Gene Clusters. OMICS J. Integr. Biol. 2012, 16, 284–287. [Google Scholar] [CrossRef] [PubMed]
- Wickham, H. ggplot2: Elegant Graphics for Data Analysis; Springer-Verlag: New York, NY, USA, 2016. [Google Scholar]
- Gu, Z.; Eils, R.; Schlesner, M. Complex heatmaps reveal patterns and correlations in multidimensional genomic data. Bioinformatics 2016, 32, 2847–2849. [Google Scholar] [CrossRef] [PubMed] [Green Version]
- Kuhn, M. The caret Package. J. Stat. Softw. 2012, 28. [Google Scholar] [CrossRef] [Green Version]
- Kuhn, M. Building Predictive Models in R Using the caret Package. J. Stat. Softw. 2008, 28, 1–26. [Google Scholar] [CrossRef] [Green Version]

| Semmelweis Cohort | Gene Chip Cohort | ||||
|---|---|---|---|---|---|
| Min age | 37 | Min age | 35 | ||
| Median age | 62 | Median age | 64 | ||
| Max age | 89 | Max age | 85 | ||
| Mean age | 61.5 ± 10.8 | Mean age | 63.96 ± 13.12 | ||
| Stage | N | % | Stage | N | % |
| Stage I | 30 | 37% | Stage I | 46 | 22.2% |
| Stage II | 8 | 9.9% | Stage II | 27 | 13% |
| Stage III | 38 | 46.9% | Stage III | 29 | 14% |
| Stage IV | 2 | 2.5% | Stage IV | 18 | 8.7% |
| NA | 3 | 3.7% | NA | 87 | 57.9% |
| Gender | N | % | Gender | N | % |
| Male | 50 | 61.7% | Male | 40 | 19.2% |
| Female | 31 | 38.3% | Female | 22 | 10.6% |
| NA | 145 | 70.2 | |||
| Race | N | Smoker | N | % | |
| Caucasian | 81 | yes | 23 | 11.1% | |
| no | 40 | 19.3% | |||
| NA | 144 | 79.6% | |||
| Obese | N | % | |||
| yes | 19 | 9.2% | |||
| no | 44 | 21.3% | |||
| NA | 144 | 69.5% | |||
| Gene Chip Cohort | SE-MS Cohort | |||
|---|---|---|---|---|
| Fold-Change | Adjusted p | Fold-Change | Adjusted p | |
| ANXA1 | 2.89 | 1.02 ∗ 10−31 | 2.26 | 1.46 ∗ 10−13 |
| ARHGDIB | 3.07 | 6.39 ∗ 10−32 | 1.68 | 4.83 ∗ 10−7 |
| C1S | 3.64 | 1.40 ∗ 10−24 | 1.22 | 0.1042807 |
| CCND1 | 4.12 | 4.09 ∗ 10−31 | 7.89 | 1.04 ∗ 10−24 |
| FN1 | 5.21 | 5.24 ∗ 10-32 | 1.99 | 2.31 ∗ 10−8 |
| GPNMB | 3.48 | 2.07 ∗ 10−28 | 2.11 | 1.02 ∗ 10−7 |
| HLA-DPB1 | 3.45 | 3.13 ∗ 10−31 | 1.37 | 0.012 |
| HLA-DRA | 3.17 | 1.44 ∗ 10−31 | 1.31 | 0.056 |
| HMOX1 | 2.95 | 4.14 ∗ 10−28 | 1.32 | 0.081 |
| HPCAL1 | 2.86 | 4.26 ∗ 10−31 | 1.75 | 5.33 ∗ 10−6 |
| IGFBP3 | 8.15 | 5.88 ∗ 10−32 | 3.04 | 7.53 ∗ 10−18 |
| LGALS1 | 4.57 | 5.24 ∗ 10−32 | 1.76 | 6.03 ∗ 10−8 |
| LIPA | 3.07 | 5.24 ∗ 10−32 | 1.62 | 7.13 ∗ 10−7 |
| MYOF | 2.86 | 5.24 ∗ 10−32 | 1.87 | 5.39 ∗ 10−8 |
| P4HA1 | 2.96 | 5.24 ∗ 10−32 | 3.15 | 2.30 ∗ 10−22 |
| PFKP | 5.69 | 5.24 ∗ 10−32 | 12.78 | 1.01 ∗ 10−47 |
| PLIN2 | 3.85 | 3.09 ∗ 10−31 | 26.09 | 3.90 ∗ 10−39 |
| PLOD2 | 4.21 | 5.24 ∗ 10−32 | 15.84 | 6.51 ∗ 10−36 |
| RARRES2 | 3.35 | 2.11 ∗ 10−30 | 0.53 | 2.11 ∗ 10−7 |
| TIMP1 | 3.61 | 5.24 ∗ 10−32 | 1.21 | 0.213 |
| VEGFA | 3.02 | 5.11 ∗ 10−31 | 3.49 | 1.40 ∗ 10−22 |
| VIM | 2.88 | 7.36 ∗ 10−32 | 2.06 | 4.09 ∗ 10−8 |
| SE Data MS | CPTAC Protein Data | |||
|---|---|---|---|---|
| Fold-Change | Adjusted p-Value | Fold-Change | Adjusted p-Value | |
| ANXA1 | 2.26 | 1.46 ∗ 10−13 | 2.31 | 6.60 ∗ 10−41 |
| ARHGDIB | 1.68 | 4.83 ∗ 10−7 | 1.87 | 7.10 ∗ 10−42 |
| C1S | 1.22 | 0.10 | 1.03 | 0.49 |
| FN1 | 1.99 | 2.31 ∗ 10−8 | 1.91 | 1.90 ∗ 10−25 |
| GPNMB | 2.11 | 1.02 ∗ 10−7 | 2.23 | 2.60 ∗ 10−17 |
| HLA-DPB1 | 1.37 | 0.01 | 1.96 | 3.10 ∗ 10−32 |
| HLA-DRA | 1.31 | 0.06 | 2.22 | 7.80 ∗ 10−36 |
| HMOX1 | 1.32 | 0.08 | 1.67 | 1.20 ∗ 10−29 |
| HPCAL1 | 1.75 | 5.33 ∗ 10−6 | 2.50 | 5.00 ∗ 10−45 |
| IGFBP3 | 3.04 | 7.53 ∗ 10−18 | 2.28 | 2.10 ∗ 10−31 |
| LGALS1 | 1.76 | 6.03 ∗ 10−8 | 1.77 | 1.60 ∗ 10−33 |
| LIPA | 1.62 | 7.13 ∗ 10−7 | 1.91 | 9.40 ∗ 10−31 |
| MYOF | 1.87 | 5.39 ∗ 10−8 | 1.88 | 2.00 ∗ 10−39 |
| P4HA1 | 3.15 | 2.30 ∗ 10−22 | 3.20 | 9.90 ∗ 10−57 |
| PFKP | 12.78 | 1.01 ∗ 10−47 | 4.20 | 4.30 ∗ 10−56 |
| PLIN2 | 26.09 | 3.90 ∗ 10−39 | 6.92 | 1.70 ∗ 10−33 |
| PLOD2 | 15.84 | 6.51 ∗ 10−36 | 4.89 | 7.40 ∗ 10−33 |
| RARRES2 | 0.53 | 2.11 ∗ 10−7 | 0.76 | 1.20 ∗ 10−13 |
| TIMP1 | 1.21 | 0.21 | 1.10 | 0.17 |
| VEGFA | 3.49 | 1.40 ∗ 10−22 | 3.12 | 3.00 ∗ 10−32 |
| VIM | 2.06 | 4.09 ∗ 10−8 | 2.27 | 1.70 ∗ 10−63 |
| CCND1 | 7.89 | 1.04 ∗ 10−24 | - | - |
| RF | SVM | KNN | LOGIT | |
|---|---|---|---|---|
| Accuracy | 0.958 | 0.979 | 0.9375 | 0.958 |
| Kappa | 0.916 | 0.958 | 0.8750 | 0.916 |
| Sensitivity | 0.916 | 0.958 | 0.8750 | 0.916 |
| Specificity | 1.0 | 1.0 | 1.0 | 1.0 |
| RF | PFKP | PLOD2 | PLIN2 | ||||||
| SVM | PFKP | PLIN2 | PLOD2 | IGFBP3 | VEGFA | P4HA1 | CCND1 | VIM | ANXA1 |
| KNN | PFKP | PLIN2 | PLOD2 | IGFBP3 | VEGFA | P4HA1 | CCND1 | ||
| LOGIT | PFKP | PLIN2 | PLOD2 |
Disclaimer/Publisher’s Note: The statements, opinions and data contained in all publications are solely those of the individual author(s) and contributor(s) and not of MDPI and/or the editor(s). MDPI and/or the editor(s) disclaim responsibility for any injury to people or property resulting from any ideas, methods, instructions or products referred to in the content. |
© 2023 by the authors. Licensee MDPI, Basel, Switzerland. This article is an open access article distributed under the terms and conditions of the Creative Commons Attribution (CC BY) license (https://creativecommons.org/licenses/by/4.0/).
Share and Cite
Bartha, Á.; Darula, Z.; Munkácsy, G.; Klement, É.; Nyirády, P.; Győrffy, B. Proteotranscriptomic Discrimination of Tumor and Normal Tissues in Renal Cell Carcinoma. Int. J. Mol. Sci. 2023, 24, 4488. https://doi.org/10.3390/ijms24054488
Bartha Á, Darula Z, Munkácsy G, Klement É, Nyirády P, Győrffy B. Proteotranscriptomic Discrimination of Tumor and Normal Tissues in Renal Cell Carcinoma. International Journal of Molecular Sciences. 2023; 24(5):4488. https://doi.org/10.3390/ijms24054488
Chicago/Turabian StyleBartha, Áron, Zsuzsanna Darula, Gyöngyi Munkácsy, Éva Klement, Péter Nyirády, and Balázs Győrffy. 2023. "Proteotranscriptomic Discrimination of Tumor and Normal Tissues in Renal Cell Carcinoma" International Journal of Molecular Sciences 24, no. 5: 4488. https://doi.org/10.3390/ijms24054488
APA StyleBartha, Á., Darula, Z., Munkácsy, G., Klement, É., Nyirády, P., & Győrffy, B. (2023). Proteotranscriptomic Discrimination of Tumor and Normal Tissues in Renal Cell Carcinoma. International Journal of Molecular Sciences, 24(5), 4488. https://doi.org/10.3390/ijms24054488


