Data-Driven Radiogenomic Approach for Deciphering Molecular Mechanisms Underlying Imaging Phenotypes in Lung Adenocarcinoma: A Pilot Study
Abstract
:1. Introduction
2. Results
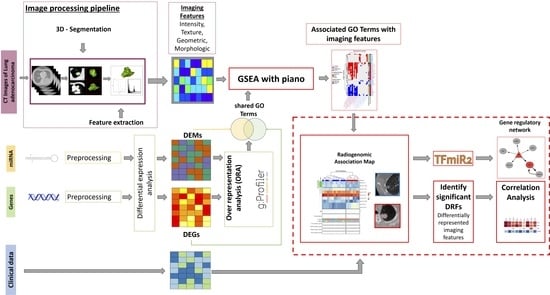
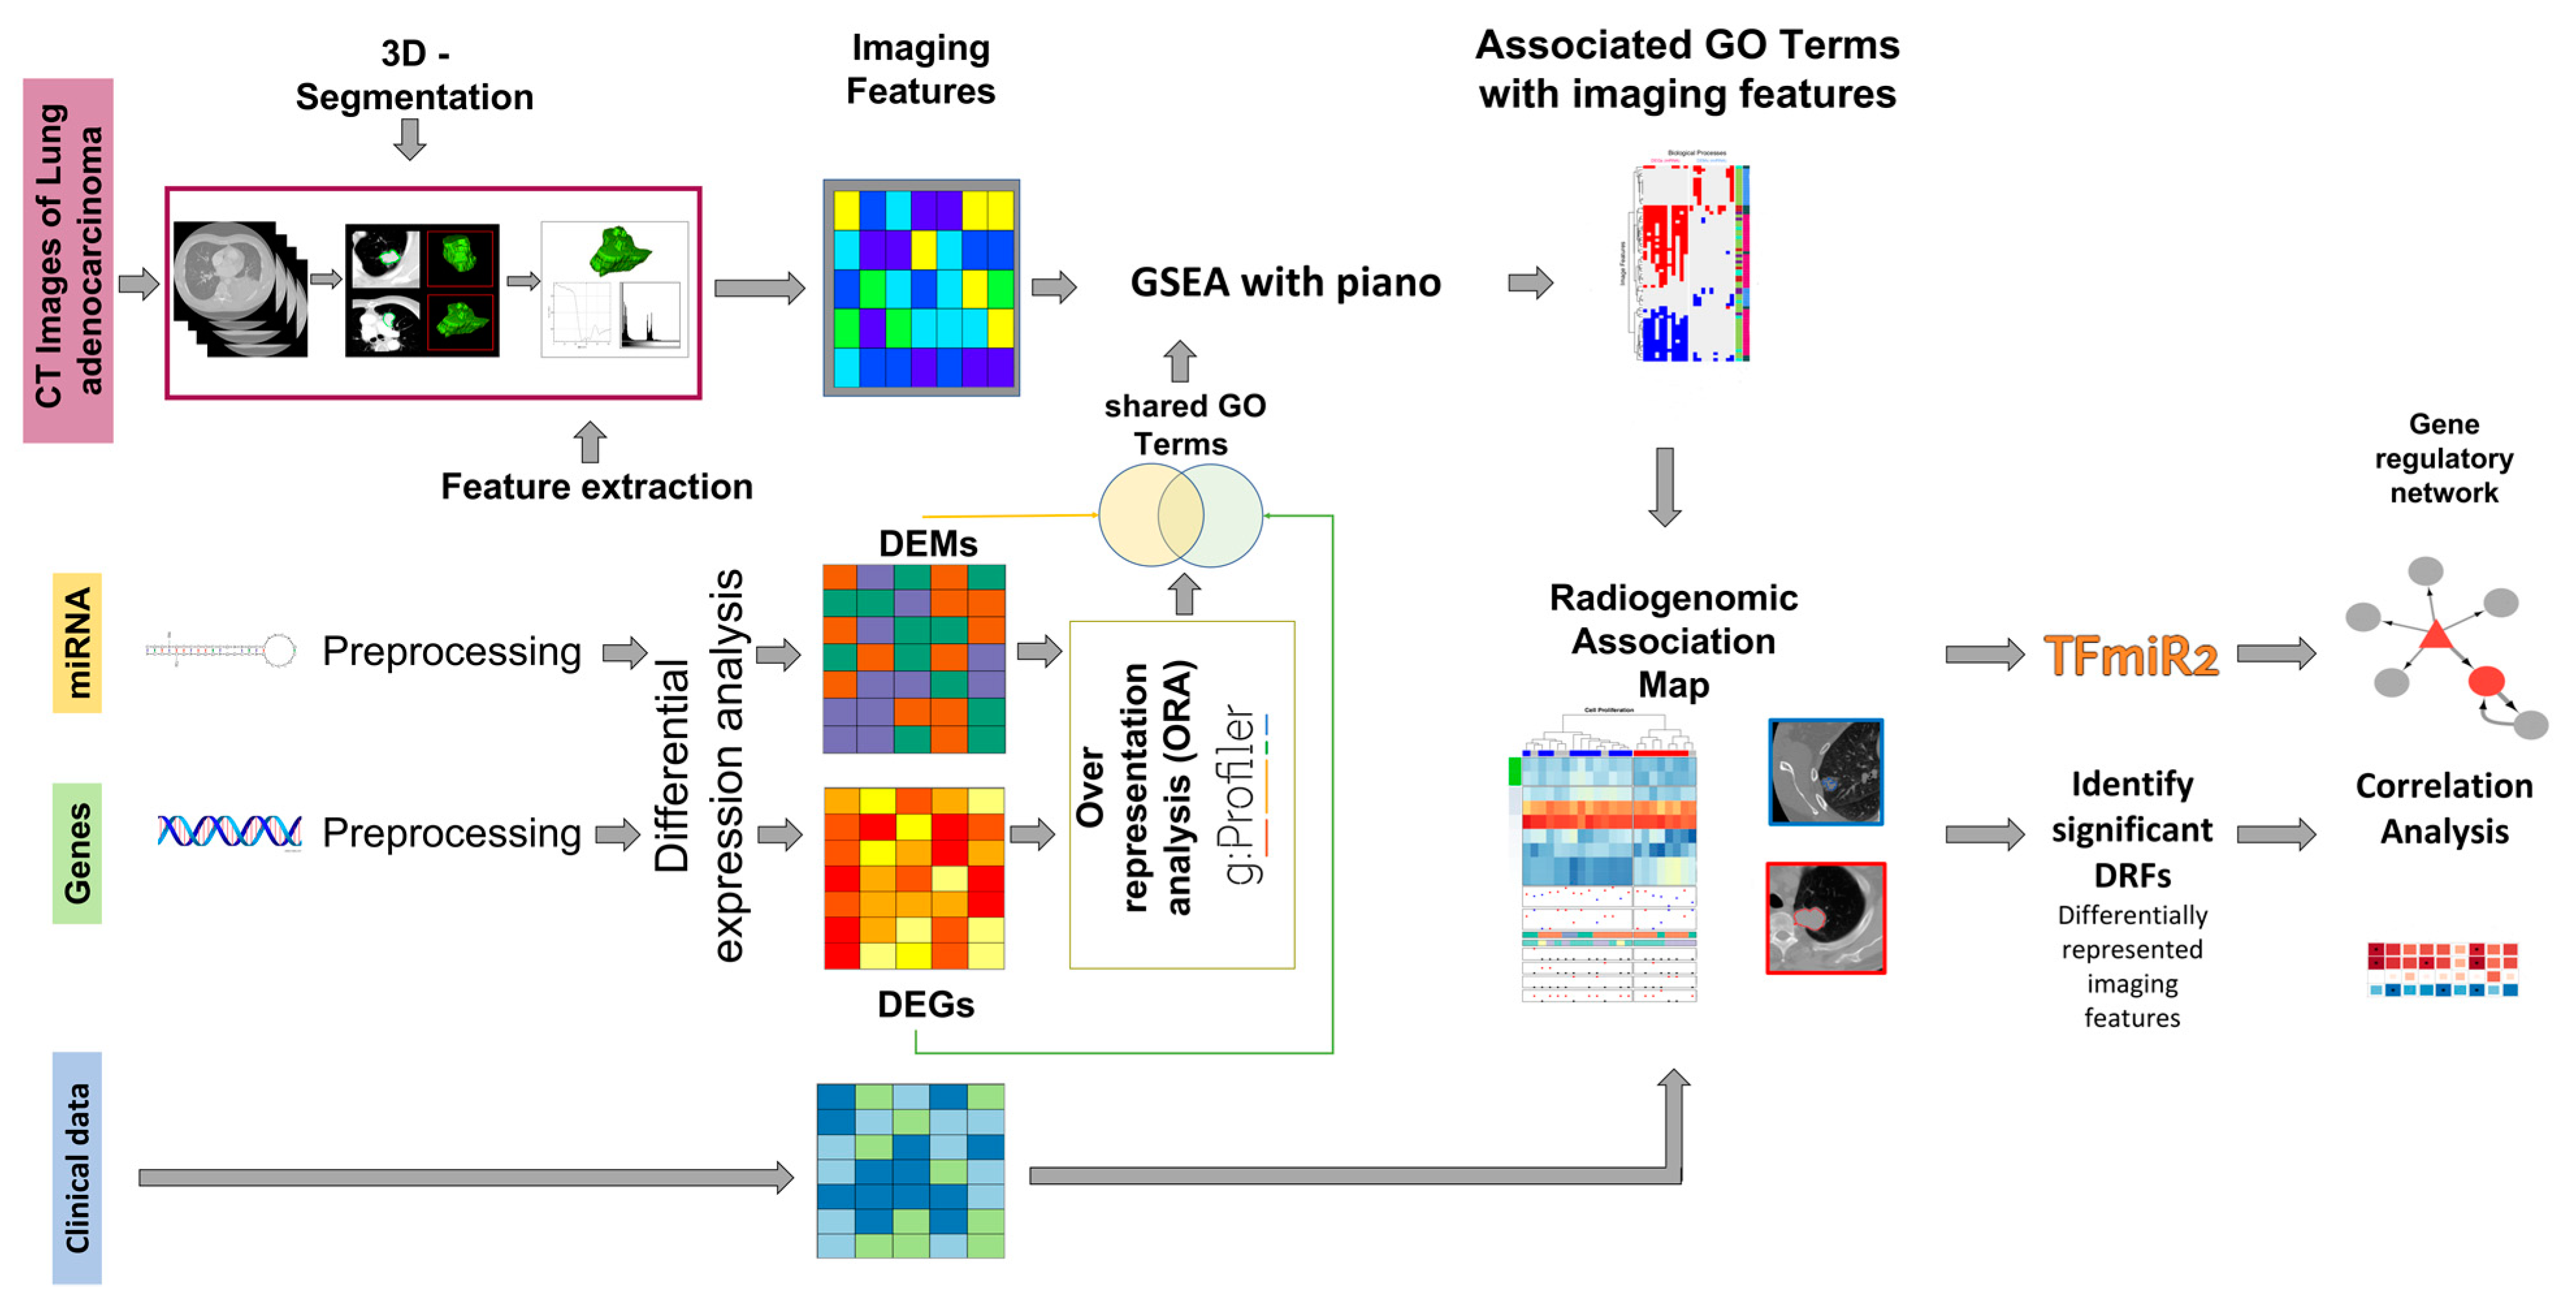
2.1. Overview of the Radiogenomic Approach
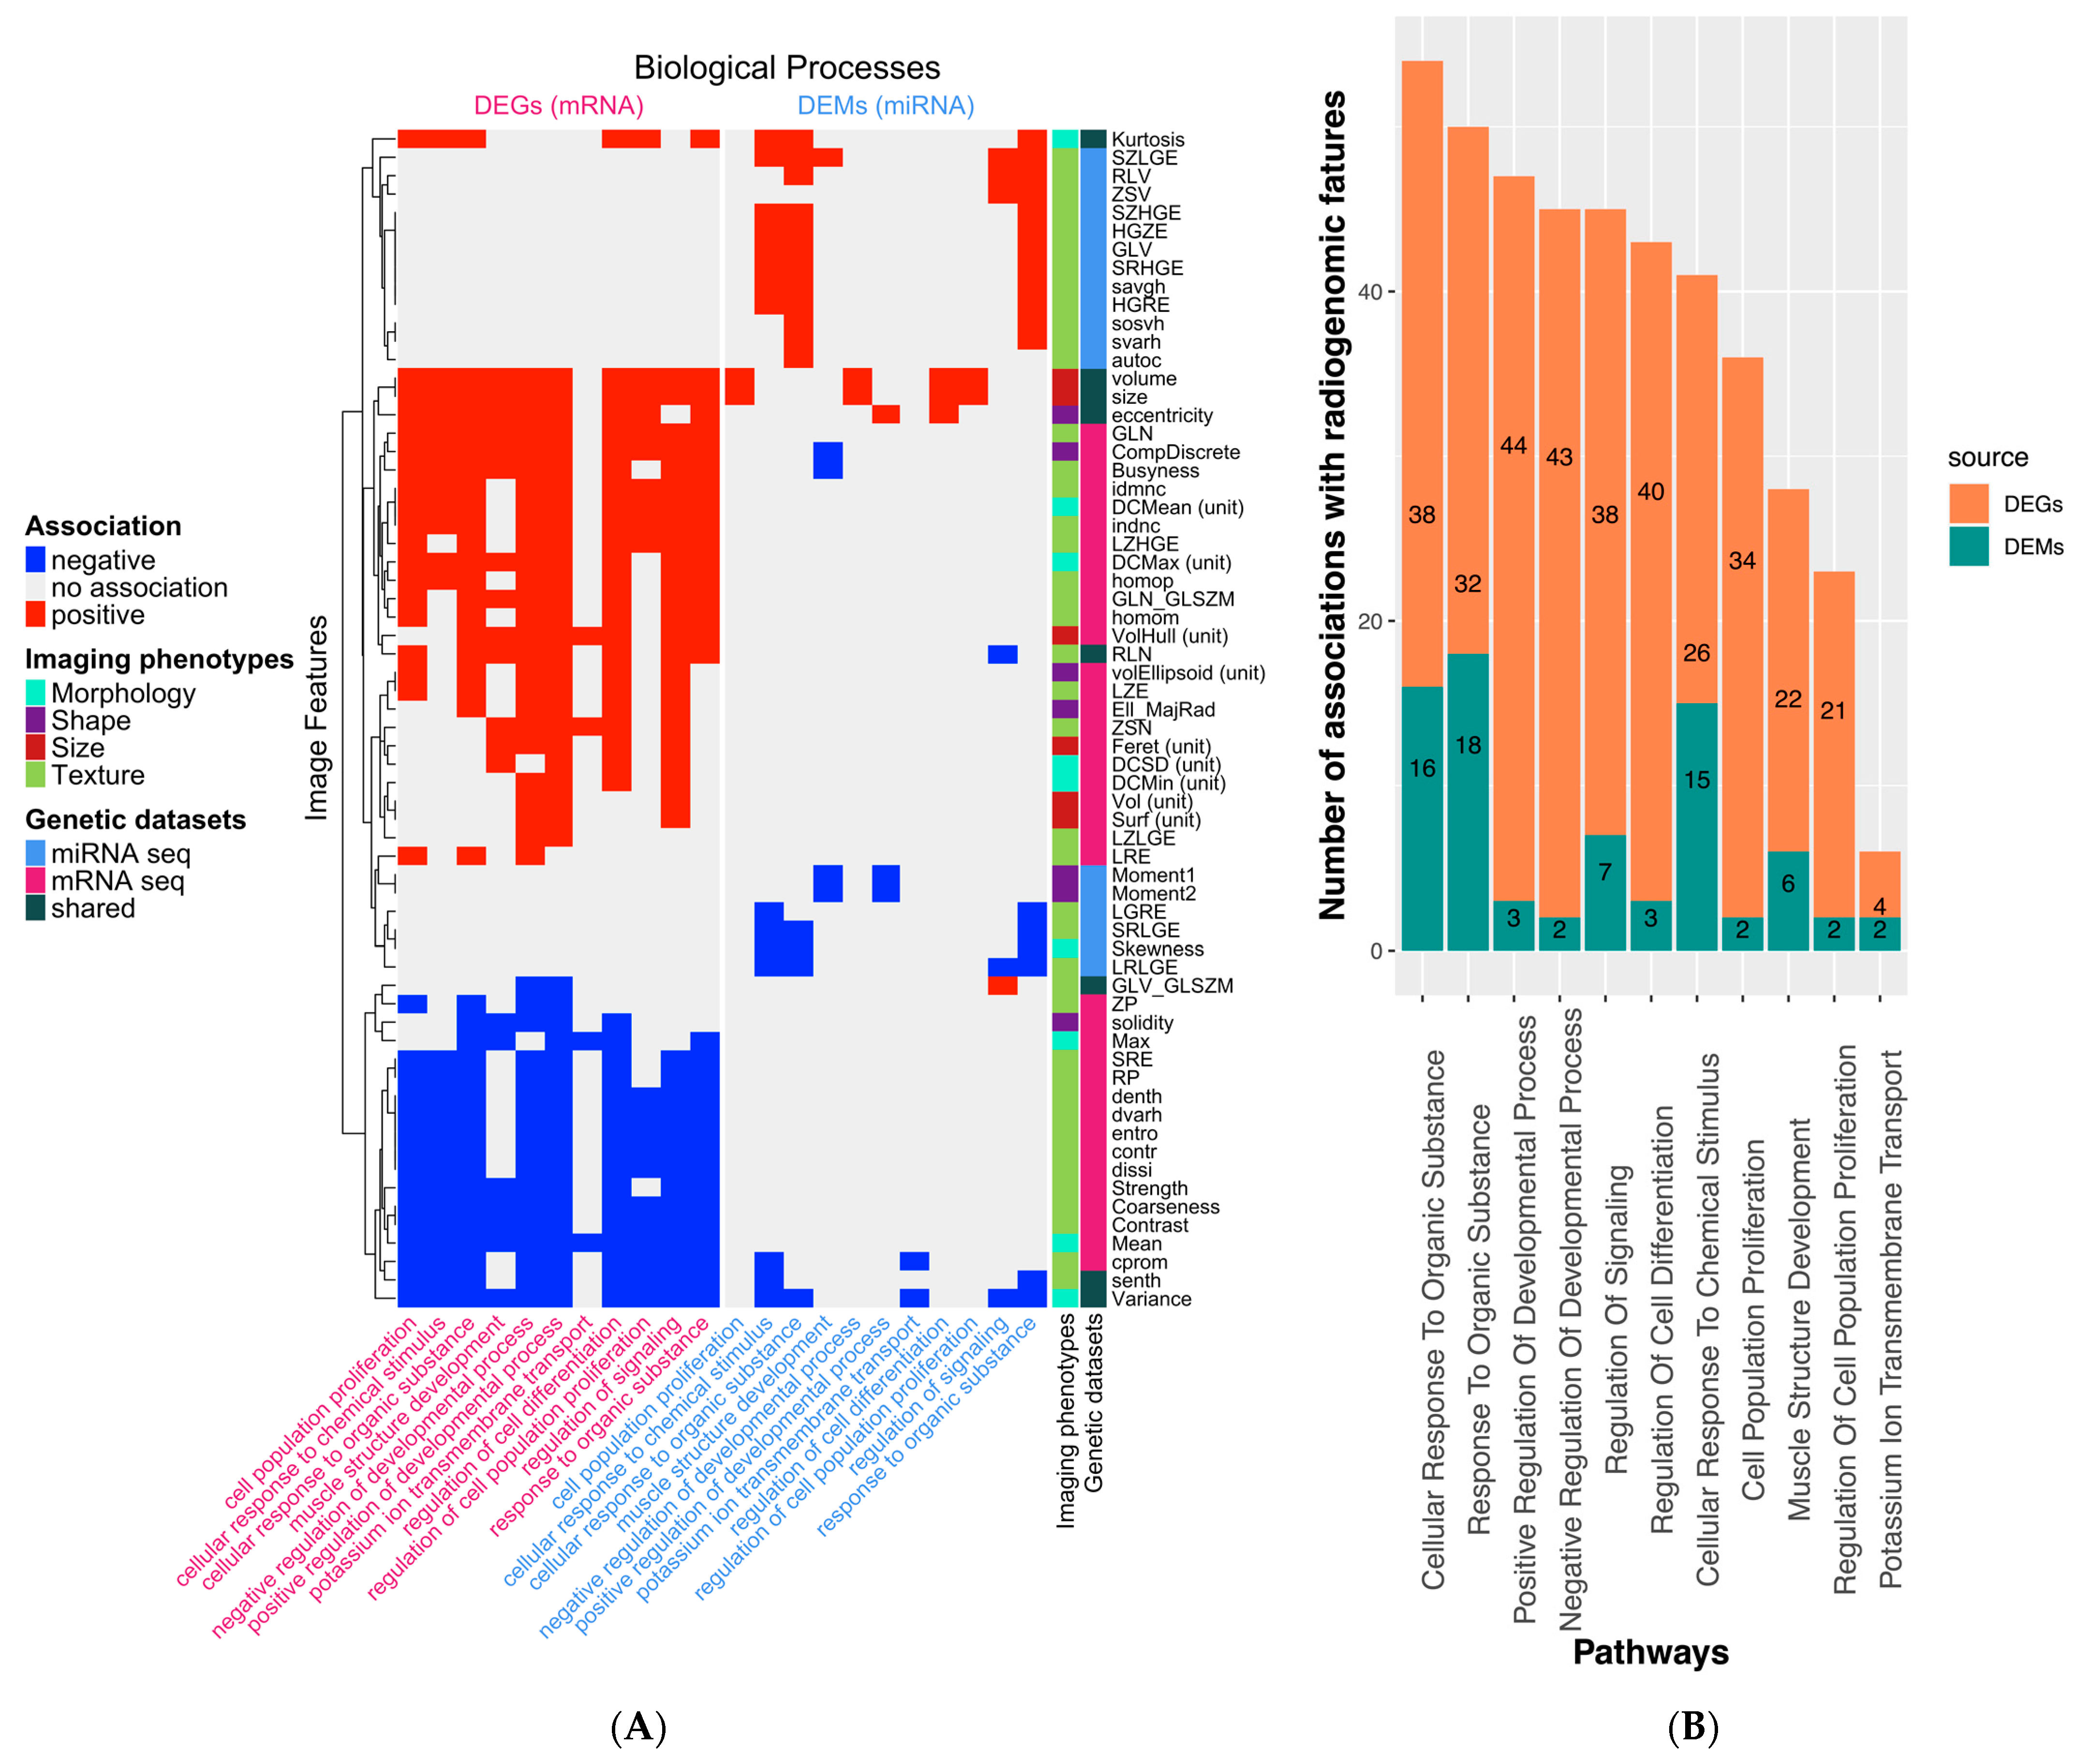
2.2. Differential Expression and Gene Set Enrichment Analysis
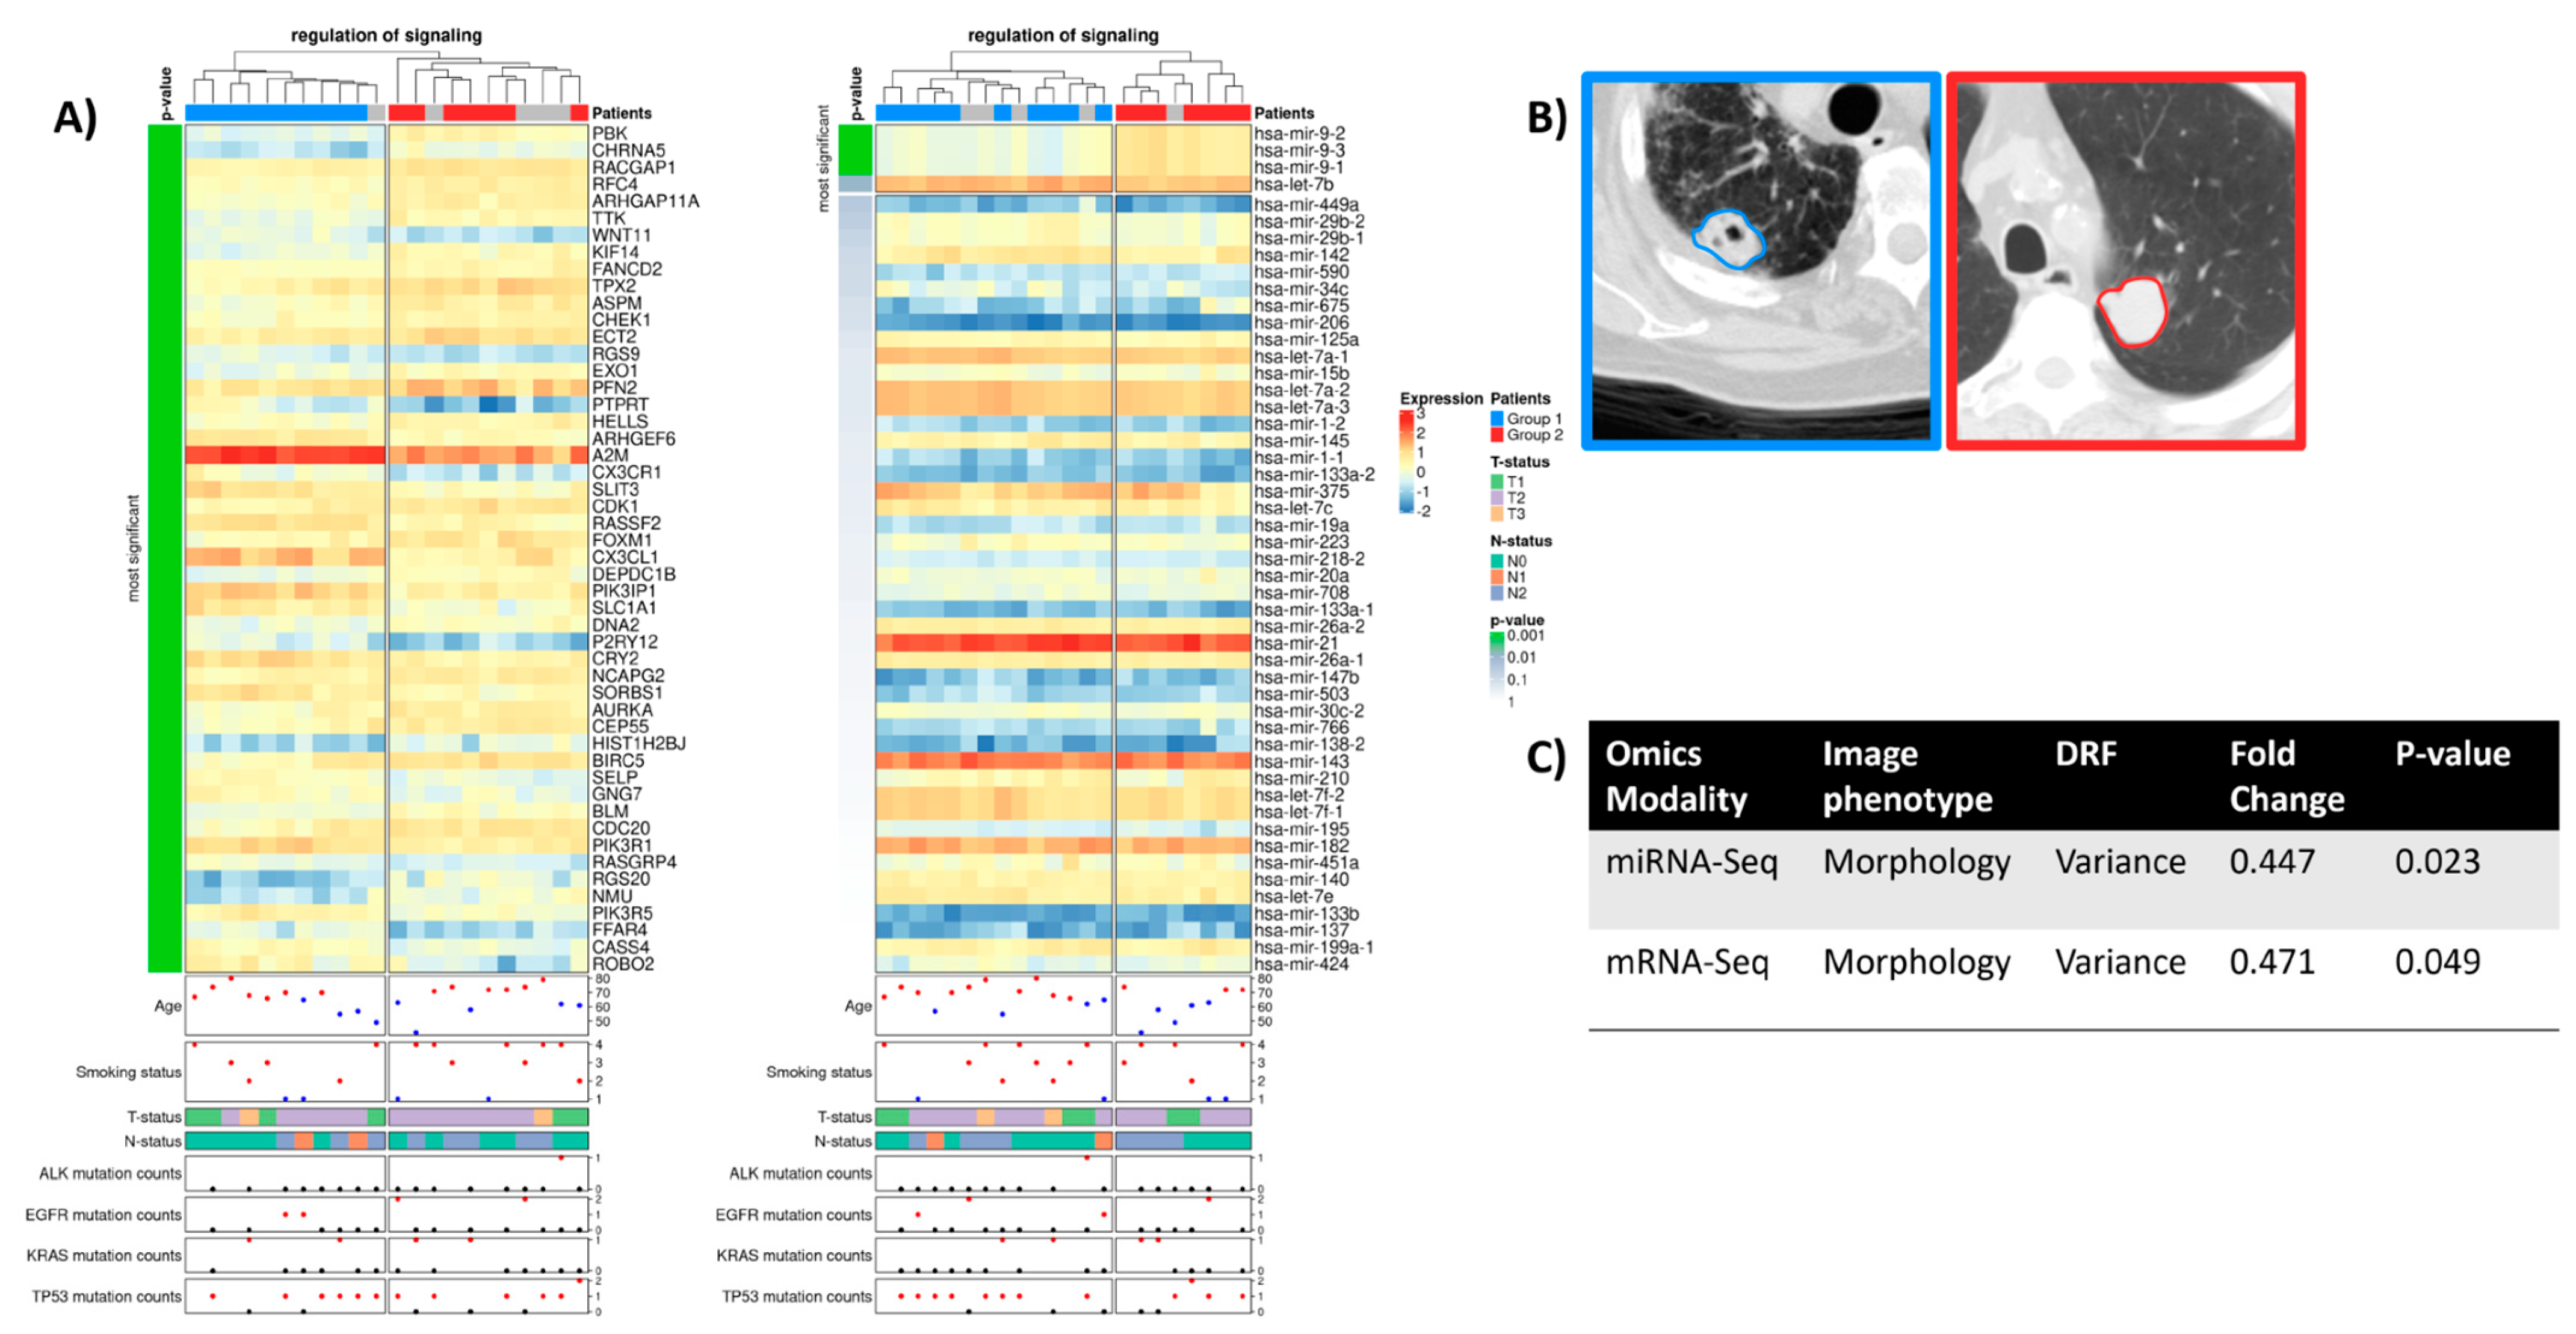
2.3. Regulation of Signaling
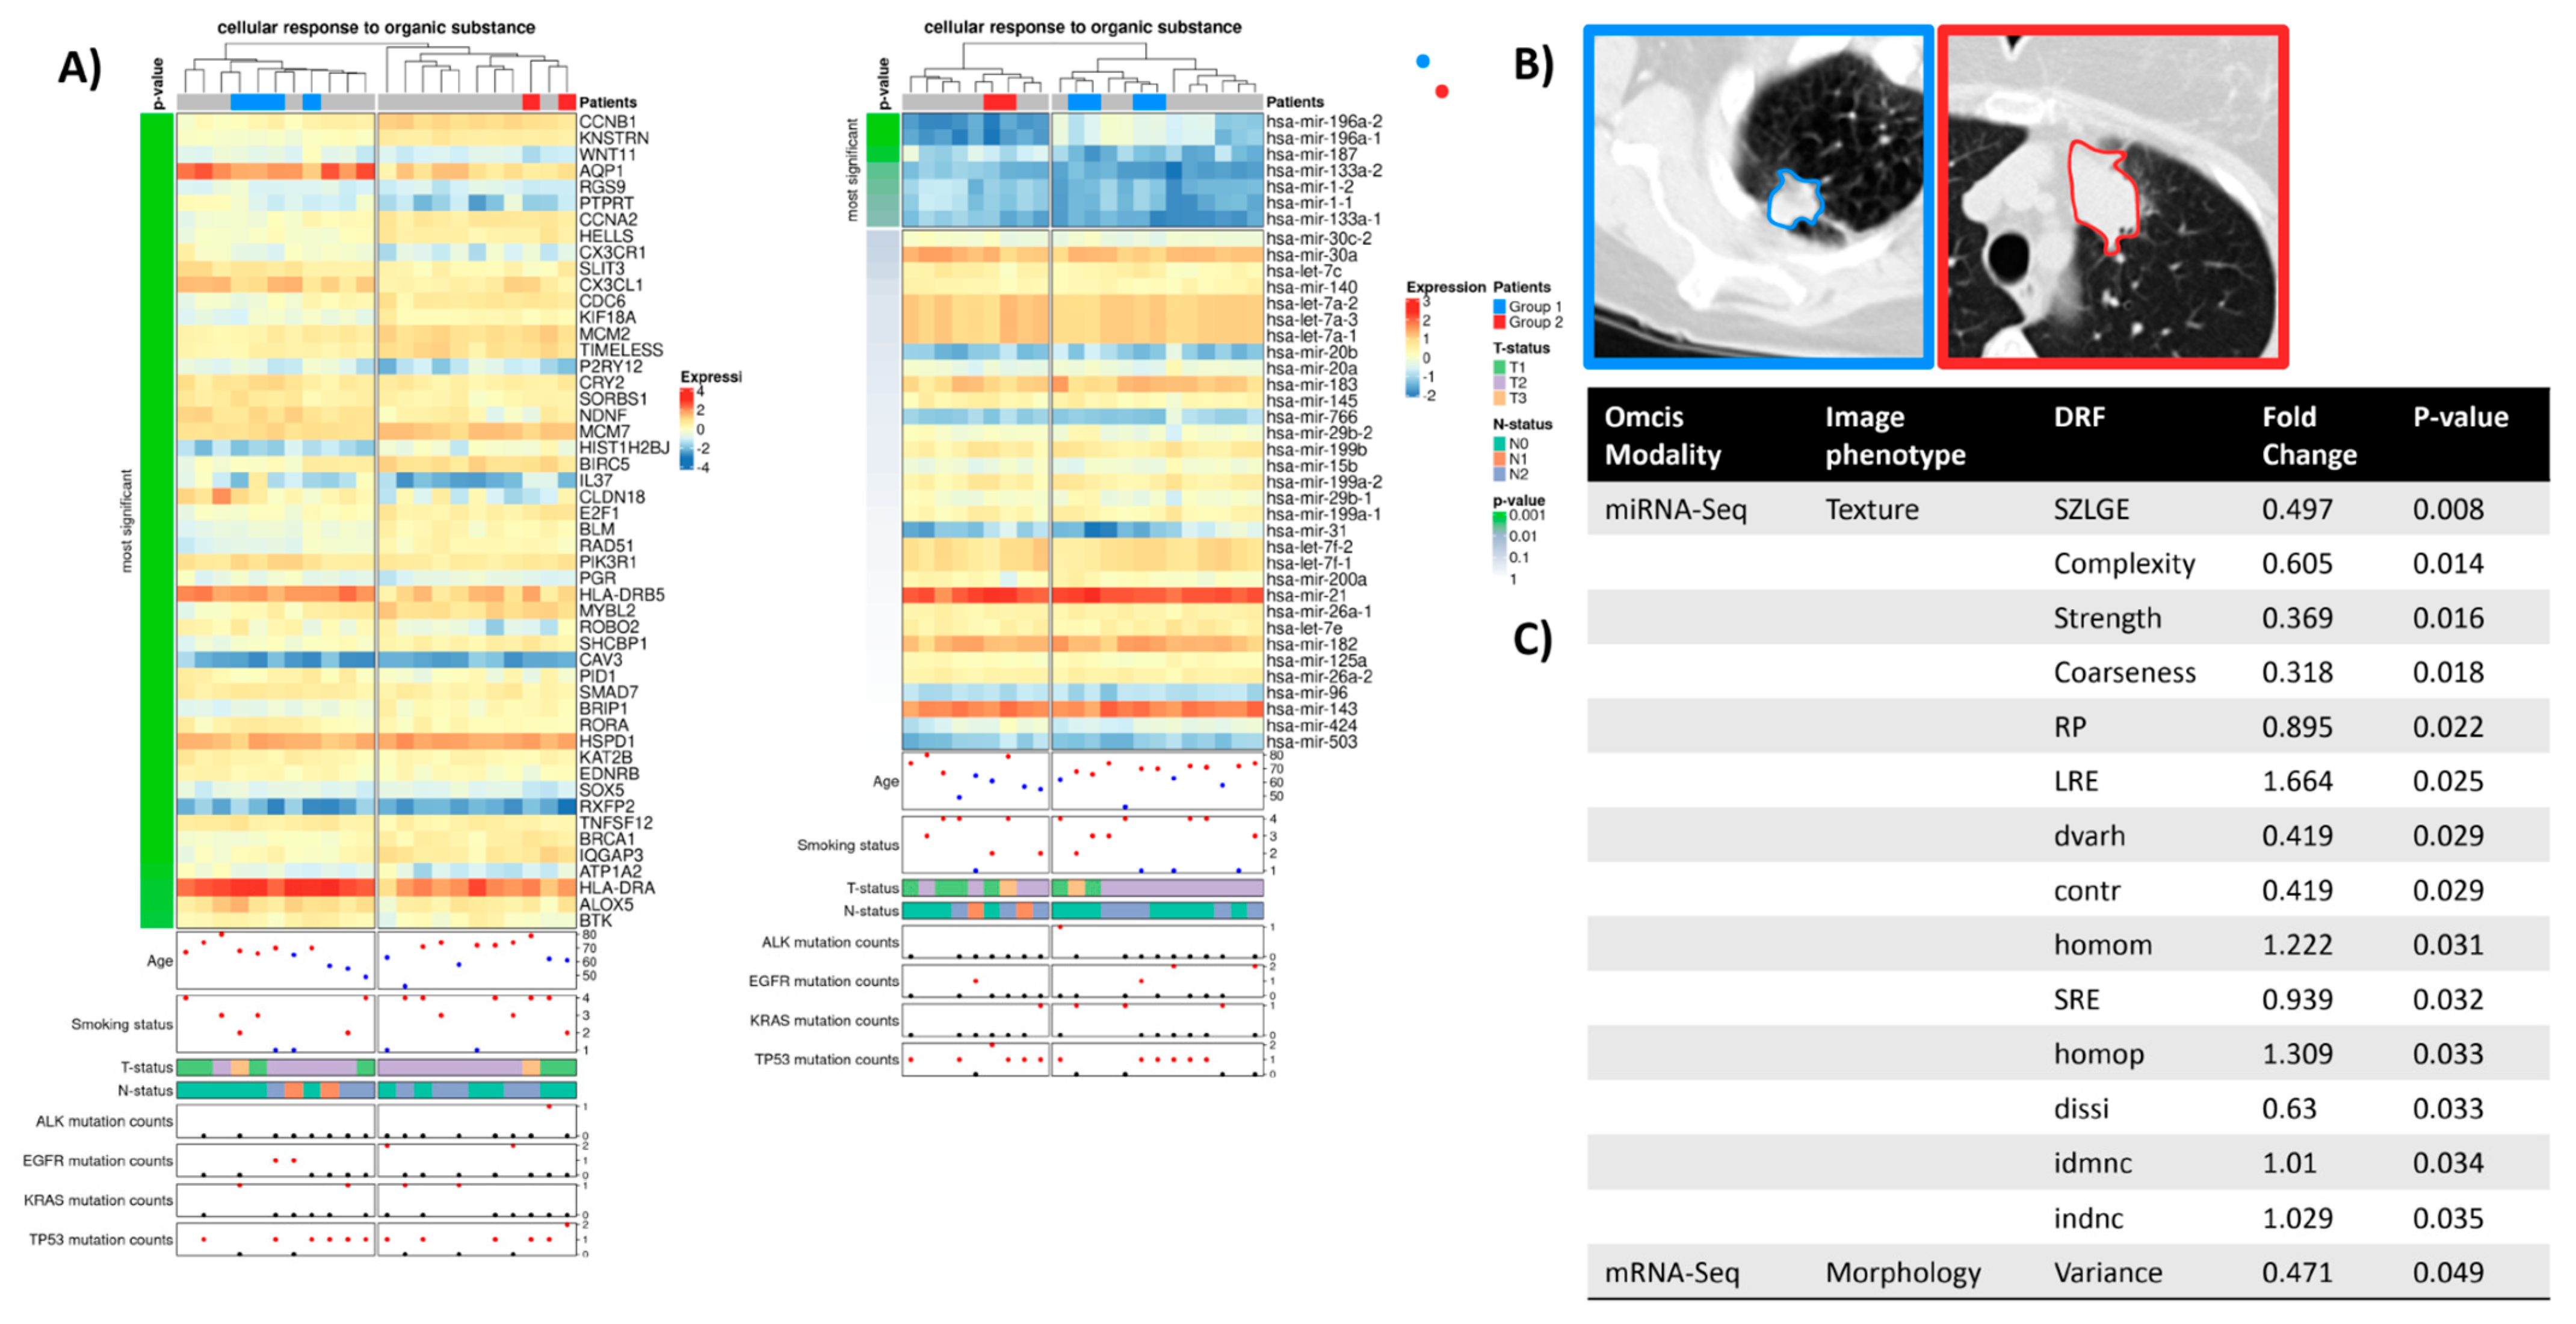
2.4. Cellular Response to Organic Substance
2.5. Regulatory Interactions Underlying Phenotypic Differences
3. Discussion
3.1. Study Limitations
3.2. A Word of Caution
4. Materials and Methods
4.1. Datasets Origin
4.2. Image Data Analysis
4.3. Genomic Data Analysis
4.4. Enrichment Analysis of Differentially Expressed Genes and miRNAs
4.5. Visualization of the Radiogenomic Association Maps
4.6. Identification of Differentially Representative Features (DRF)
4.7. Gene Regulatory Network Construction
5. Conclusions
Supplementary Materials
Author Contributions
Funding
Institutional Review Board Statement
Informed Consent Statement
Data Availability Statement
Acknowledgments
Conflicts of Interest
References
- Ferlay, J.; Colombet, M.; Soerjomataram, I.; Parkin, D.M.; Piñeros, M.; Znaor, A.; Bray, F. Cancer statistics for the year 2020: An overview. Int. J. Cancer 2021, 149, 778–789. [Google Scholar] [CrossRef] [PubMed]
- Herbst, R.S.; Morgensztern, D.; Boshoff, C. The biology and management of non-small cell lung cancer. Nature 2018, 553, 446–454. [Google Scholar] [CrossRef] [PubMed]
- Latimer, K.M.; Mott, T.F. Lung cancer: Diagnosis, treatment principles, and screening. Am. Fam. Physician 2015, 105, 487–494. [Google Scholar]
- Goldstraw, P.; Chansky, K.; Crowley, J.; Rami-Porta, R.; Asamura, H.; Eberhardt, W.E.; Nicholson, A.G.; Groome, P.; Mitchell, A.; Bolejack, V.; et al. The IASLC Lung Cancer Staging Project: Proposals for Revision of the TNM Stage Groupings in the Forthcoming (Eighth) Edition of the TNM Classification for Lung Cancer. J. Thorac. Oncol. 2016, 11, 39–51. [Google Scholar] [CrossRef] [PubMed] [Green Version]
- Mazieres, J.; Drilon, A.; Lusque, A.B.; Mhanna, L.; Cortot, A.; Mezquita, L.; Thai, A.A.; Mascaux, C.; Couraud, S.; Veillon, R.; et al. Immune checkpoint inhibitors for patients with advanced lung cancer and oncogenic driver alterations: Results from the IMMUNOTARGET registry. Ann. Oncol. 2019, 30, 1321–1328. [Google Scholar] [CrossRef]
- Incoronato, M.; Aiello, M.; Infante, T.; Cavaliere, C.; Grimaldi, A.M.; Mirabelli, P.; Monti, S.; Salvatore, M. Radiogenomic Analysis of Oncological Data: A Technical Survey. Int. J. Mol. Sci. 2017, 18, 805. [Google Scholar] [CrossRef] [Green Version]
- Sholl, L. Molecular diagnostics of lung cancer in the clinic. Transl. Lung Cancer Res. 2017, 6, 560–569. [Google Scholar] [CrossRef] [Green Version]
- Wu, K.-L.; Tsai, Y.-M.; Lien, C.-T.; Kuo, P.-L.; Hung, J.-Y. The Roles of MicroRNA in Lung Cancer. Int. J. Mol. Sci. 2019, 20, 1611. [Google Scholar] [CrossRef] [Green Version]
- Langevin, S.M.; Kratzke, R.A.; Kelsey, K.T. Epigenetics of lung cancer. Transl. Res. 2014, 165, 74–90. [Google Scholar] [CrossRef] [Green Version]
- De Sousa, V.M.L.; Carvalho, L. Heterogeneity in Lung Cancer. Pathobiology 2018, 85, 96–107. [Google Scholar] [CrossRef]
- Le, V.-H.; Kha, Q.-H.; Hung, T.; Le, N. Risk Score Generated from CT-Based Radiomics Signatures for Overall Survival Prediction in Non-Small Cell Lung Cancer. Cancers 2021, 13, 3616. [Google Scholar] [CrossRef] [PubMed]
- Moreno, S.; Bonfante, M.; Zurek, E.; Cherezov, D.; Goldgof, D.; Hall, L.; Schabath, M. A Radiogenomics Ensemble to Predict EGFR and KRAS Mutations in NSCLC. Tomography 2021, 7, 154–168. [Google Scholar] [CrossRef]
- Le, N.Q.K.; Kha, Q.H.; Nguyen, V.H.; Chen, Y.-C.; Cheng, S.-J.; Chen, C.-Y. Machine Learning-Based Radiomics Signatures for EGFR and KRAS Mutations Prediction in Non-Small-Cell Lung Cancer. Int. J. Mol. Sci. 2021, 22, 9254. [Google Scholar] [CrossRef]
- Tomaszewski, M.R.; Gillies, R.J. The Biological Meaning of Radiomic Features. Radiology 2021, 298, 505–516. [Google Scholar] [CrossRef] [PubMed]
- Aerts, H.J.W.L.; Velazquez, E.R.; Leijenaar, R.T.H.; Parmar, C.; Grossmann, P.; Carvalho, S.; Bussink, J.; Monshouwer, R.; Haibe-Kains, B.; Rietveld, D.; et al. Decoding tumour phenotype by noninvasive imaging using a quantitative radiomics approach. Nat. Commun. 2014, 5, 4006. [Google Scholar] [CrossRef] [PubMed] [Green Version]
- Gevaert, O.; Xu, J.; Hoang, C.D.; Leung, A.N.; Xu, Y.; Quon, A.; Rubin, D.L.; Napel, S.; Plevritis, S.K. Non–Small Cell Lung Cancer: Identifying Prognostic Imaging Biomarkers by Leveraging Public Gene Expression Microarray Data—Methods and Preliminary Results. Radiology 2012, 264, 387–396. [Google Scholar] [CrossRef]
- Zhou, M.; Leung, A.; Echegaray, S.; Gentles, A.; Shrager, J.B.; Jensen, K.C.; Berry, G.J.; Plevritis, S.K.; Rubin, D.L.; Napel, S.; et al. Non–Small Cell Lung Cancer Radiogenomics Map Identifies Relationships between Molecular and Imaging Phenotypes with Prognostic Implications. Radiology 2018, 286, 307–315. [Google Scholar] [CrossRef] [Green Version]
- Fischer, S.; Tahoun, M.; Klaan, B.; Thierfelder, K.M.; Weber, M.-A.; Krause, B.J.; Hakenberg, O.; Fuellen, G.; Hamed, M. A Radiogenomic Approach for Decoding Molecular Mechanisms Underlying Tumor Progression in Prostate Cancer. Cancers 2019, 11, 1293. [Google Scholar] [CrossRef] [Green Version]
- Yamamoto, S.; Maki, D.D.; Korn, R.L.; Kuo, M.D. Radiogenomic Analysis of Breast Cancer Using MRI: A Preliminary Study to Define the Landscape. Am. J. Roentgenol. 2012, 199, 654–663. [Google Scholar] [CrossRef]
- Wang, S.; Shi, J.; Ye, Z.; Dong, D.; Yu, D.; Zhou, M.; Liu, Y.; Gevaert, O.; Wang, K.; Zhu, Y.; et al. Predicting EGFR mutation status in lung adenocarcinoma on computed tomography image using deep learning. Eur. Respir. J. 2019, 53, 1800986. [Google Scholar] [CrossRef] [Green Version]
- Zhang, T.; Xu, Z.; Liu, G.; Jiang, B.; de Bock, G.; Groen, H.; Vliegenthart, R.; Xie, X. Simultaneous Identification of EGFR, KRAS, ERBB2, and TP53 Mutations in Patients with Non-Small Cell Lung Cancer by Machine Learning-Derived Three-Dimensional Radiomics. Cancers 2021, 13, 1814. [Google Scholar] [CrossRef]
- Zwanenburg, A.; Vallières, M.; Abdalah, M.A.; Aerts, H.J.W.L.; Andrearczyk, V.; Apte, A.; Ashrafinia, S.; Bakas, S.; Beukinga, R.J.; Boellaard, R.; et al. The Image Biomarker Standardization Initiative: Standardized Quantitative Radiomics for High-Throughput Image-based Phenotyping. Radiology 2020, 295, 328–338. [Google Scholar] [CrossRef] [Green Version]
- Hoffman, J.M.; Gambhir, S.S. Molecular Imaging: The Vision and Opportunity for Radiology in the Future. Radiology 2007, 244, 39–47. [Google Scholar] [CrossRef]
- Kuo, M.D.; Jamshidi, N. Behind the Numbers: Decoding Molecular Phenotypes with Radiogenomics—Guiding Principles and Technical Considerations. Radiology 2014, 270, 320–325. [Google Scholar] [CrossRef]
- Hassan, M.; Mollick, S.; Yasmin, F. An unsupervised cluster-based feature grouping model for early diabetes detection. Health Anal. 2022, 2, 100112. [Google Scholar] [CrossRef]
- Schindelin, J.; Arganda-Carreras, I.; Frise, E.; Kaynig, V.; Longair, M.; Pietzsch, T.; Preibisch, S.; Rueden, C.; Saalfeld, S.; Schmid, B.; et al. Fiji: An open-source platform for biological-image analysis. Nat. Methods 2012, 9, 676–682. [Google Scholar] [CrossRef] [Green Version]
- Raudvere, U.; Kolberg, L.; Kuzmin, I.; Arak, T.; Adler, P.; Peterson, H.; Vilo, J. g:Profiler: A web server for functional enrichment analysis and conversions of gene lists (2019 update). Nucleic Acids Res. 2019, 47, W191–W198. [Google Scholar] [CrossRef] [PubMed] [Green Version]
- Väremo, L.; Nielsen, J.; Nookaew, I. Enriching the gene set analysis of genome-wide data by incorporating directionality of gene expression and combining statistical hypotheses and methods. Nucleic Acids Res. 2013, 41, 4378–4391. [Google Scholar] [CrossRef]
- Gu, Z.; Eils, R.; Schlesner, M. Complex heatmaps reveal patterns and correlations in multidimensional genomic data. Bioinformatics 2016, 32, 2847–2849. [Google Scholar] [CrossRef] [Green Version]
- Nazarieh, M.; Hamed, M.; Spaniol, C.; Will, T.; Helms, V. TFmiR2: Constructing and analyzing disease-, tissue- and process-specific transcription factor and microRNA co-regulatory networks. Bioinformatics 2019, 36, 2300–2302. [Google Scholar] [CrossRef] [PubMed]
- Yeh, A.; Li, H.; Zhu, Y.; Zhang, J.; Khramtsova, G.; Drukker, K.; Edwards, A.; McGregor, S.; Yoshimatsu, T.; Zheng, Y.; et al. Radiogenomics of breast cancer using dynamic contrast enhanced MRI and gene expression profiling. Cancer Imaging 2019, 19, 1–11. [Google Scholar] [CrossRef] [PubMed] [Green Version]
- Xu, T.; Liu, X.; Han, L.; Shen, H.; Liu, L.; Shu, Y. Up-regulation of miR-9 expression as a poor prognostic biomarker in patients with non-small cell lung cancer. Clin. Transl. Oncol. 2013, 16, 469–475. [Google Scholar] [CrossRef] [PubMed]
- WHO. World Health Organization International Agency for Research on Cancer IARC Monographs on the Evaluation of Carcinogenic Risks to Humans VOLUME 83 Tobacco Smoke and Involuntary Smoking. Tob. Smoke Involunary Smok. 2004, 83, 83. [Google Scholar]
- Sardo, F.L.; Pulito, C.; Sacconi, A.; Korita, E.; Sudol, M.; Strano, S.; Blandino, G. YAP/TAZ and EZH2 synergize to impair tumor suppressor activity of TGFBR2 in non-small cell lung cancer. Cancer Lett. 2020, 500, 51–63. [Google Scholar] [CrossRef]
- Vagapova, E.R.; Spirin, P.V.; Lebedev, T.D.; Prassolov, V.S. The Role of TAL1 in Hematopoiesis and Leukemogenesis. Acta Naturae 2018, 10, 15–23. [Google Scholar] [CrossRef] [PubMed]
- Li, X.; Ma, C.; Luo, H.; Zhang, J.; Wang, J.; Guo, H. Identification of the differential expression of genes and upstream microRNAs in small cell lung cancer compared with normal lung based on bioinformatics analysis. Medicine 2020, 99, e19086. [Google Scholar] [CrossRef]
- Fois, S.S.; Paliogiannis, P.; Zinellu, A.; Fois, A.G.; Cossu, A.; Palmieri, G. Molecular Epidemiology of the Main Druggable Genetic Alterations in Non-Small Cell Lung Cancer. Int. J. Mol. Sci. 2021, 22, 612. [Google Scholar] [CrossRef]
- Kim, G.; Kim, J.; Cha, H.; Park, W.-Y.; Ahn, J.S.; Ahn, M.-J.; Park, K.; Park, Y.-J.; Choi, J.Y.; Lee, K.-H.; et al. Metabolic radiogenomics in lung cancer: Associations between FDG PET image features and oncogenic signaling pathway alterations. Sci. Rep. 2020, 10, 1–13. [Google Scholar] [CrossRef]
- Kong, D.; Wang, K.; Zhang, Q.-N.; Bing, Z.-T. Systematic analysis reveals key microRNAs as diagnostic and prognostic factors in progressive stages of lung cancer. arXiv 2022, arXiv:2201.05408. [Google Scholar] [CrossRef]
- Gong, L.; Shu, J.; Chen, X.; Pan, H.; Chen, G.; Bi, Y.; Cui, D.; Li, X.; Liu, D.; Wang, L.; et al. DEPTOR inhibits lung tumorigenesis by inactivating the EGFR-mTOR signals. Cancer Lett. 2021, 519, 263–276. [Google Scholar] [CrossRef]
- Huang, Q.; Tan, Q.; Mao, K.; Yang, G.; Ma, G.; Luo, P.; Wang, S.; Mei, P.; Wu, F.; Xu, J.; et al. The role of adrenergic receptors in lung cancer. Am. J. Cancer Res. 2018, 8, 2227–2237. [Google Scholar] [PubMed]
- The Cancer Genome Atlas Research Network. Comprehensive molecular profiling of lung adenocarcinoma. Nature 2014, 511, 262. [Google Scholar] [CrossRef] [Green Version]
- Clark, K.; Vendt, B.; Smith, K.; Freymann, J.; Kirby, J.; Koppel, P.; Moore, S.; Phillips, S.; Maffitt, D.; Pringle, M.; et al. The Cancer Imaging Archive (TCIA): Maintaining and Operating a Public Information Repository. J. Digit. Imaging 2013, 26, 1045–1057. [Google Scholar] [CrossRef] [Green Version]
- Rueden, C.T.; Schindelin, J.; Hiner, M.C.; Dezonia, B.E.; Walter, A.E.; Arena, E.T.; Eliceiri, K.W. ImageJ2: ImageJ for the next generation of scientific image data. BMC Bioinform. 2017, 18, 529. [Google Scholar] [CrossRef] [PubMed] [Green Version]
- Ollion, J.; Cochennec, J.; Loll, F.; Escudé, C.; Boudier, T. TANGO: A generic tool for high-throughput 3D image analysis for studying nuclear organization. Bioinformatics 2013, 29, 1840–1841. [Google Scholar] [CrossRef] [PubMed] [Green Version]
- Radiomics/TextureToolbox at Master·Mvallieres/Radiomics·GitHub. Available online: https://github.com/mvallieres/radiomics/tree/master/TextureToolbox (accessed on 14 March 2021).
- Vallières, M.; Freeman, C.R.; Skamene, S.R.; El Naqa, I. A radiomics model from joint FDG-PET and MRI texture features for the prediction of lung metastases in soft-tissue sarcomas of the extremities. Phys. Med. Biol. 2015, 60, 5471–5496. [Google Scholar] [CrossRef]
- Love, M.I.; Huber, W.; Anders, S. Moderated estimation of fold change and dispersion for RNA-seq data with DESeq2. Genome Biol. 2014, 15, 550. [Google Scholar] [CrossRef] [Green Version]
- Benjamini, Y.; Hochberg, Y. Controlling the False Discovery Rate: A Practical and Powerful Approach to Multiple Testing. J. R. Stat. Soc. Ser. B Methodol. 1995, 57, 289–300. [Google Scholar] [CrossRef]
- Shannon, P.; Markiel, A.; Ozier, O.; Baliga, N.S.; Wang, J.T.; Ramage, D.; Amin, N.; Schwikowski, B.; Ideker, T. Cytoscape: A software environment for integrated models of Biomolecular Interaction Networks. Genome Res. 2003, 13, 2498–2504. [Google Scholar] [CrossRef]
- Haralick, R.M.; Shanmugam, K.; Dinstein, I.H. Textural Features for Image Classification. IEEE Trans. Syst. Man Cybern. 1973, SMC-3, 610–621. [Google Scholar] [CrossRef] [Green Version]
- Galloway, M.M. Texture analysis using gray level run lengths. Comput. Graph. Image Process. 1975, 4, 172–179. [Google Scholar] [CrossRef]
- Soh, L.-K.; Tsatsoulis, C. Texture analysis of SAR sea ice imagery using gray level co-occurrence matrices. IEEE Trans. Geosci. Remote. Sens. 1999, 37, 780–795. [Google Scholar] [CrossRef] [Green Version]
- Clausi, D.A. An analysis of co-occurrence texture statistics as a function of grey level quantization. Can. J. Remote. Sens. 2002, 28, 45–62. [Google Scholar] [CrossRef]
- Thibault, G.; Fertil, B.; Navarro, C.; Pereira, S.; Cau, P.; Levy, N. Texture Indexes and Gray Level Size Zone Matrix Application to Cell Nuclei Classification. In Proceedings of the International Conference on Pattern Recognition Applications and Methods, Vienna, Austria, 4–6 February 2009. [Google Scholar]
- Chu, A.; Sehgal, C.; Greenleaf, J. Use of gray value distribution of run lengths for texture analysis. Pattern Recognit. Lett. 1990, 11, 415–419. [Google Scholar] [CrossRef]
- Dasarathy, B.V.; Holder, E.B. Image characterizations based on joint gray level—run length distributions. Pattern Recognit. Lett. 1991, 12, 497–502. [Google Scholar] [CrossRef]
- Amadasun, M.; King, R. Textural features corresponding to textural properties. IEEE Trans. Syst. Man, Cybern. 1989, 19, 1264–1274. [Google Scholar] [CrossRef]
- Li, Q.; Griffiths, J.G. Least squares ellipsoid specific fitting. In Proceedings of the Geometric Modeling and Processing 2004, Beijing, China, 13–15 April 2004; pp. 35–340. [Google Scholar] [CrossRef]
- Andrey, P.; Kiêu, K.; Kress, C.; Lehmann, G.; Tirichine, L.; Liu, Z.; Biot, E.; Adenot, P.-G.; Hue-Beauvais, C.; Houba-Hérin, N.; et al. Statistical Analysis of 3D Images Detects Regular Spatial Distributions of Centromeres and Chromocenters in Animal and Plant Nuclei. PLOS Comput. Biol. 2010, 6, e1000853. [Google Scholar] [CrossRef] [PubMed] [Green Version]
- Sheets, K.G.; Bokkyoo, J.; Zhou, Y.; Winkler, J.; Zhu, M.; Petasis, N.; Gordon, W.C.; Bazan, N.G. Topical Neuroprotectin D1 Attenuates Experimental CNV and Induces Activated Microglia Redistribution. Investig. Ophthalmol. Vis. Sci. 2011, 52, 5470. [Google Scholar]

| mRNA Seq LUAD (n = 515) | mRNA Seq Normal (n = 59) | mRNA LUAD- vs. Normal | miRNA Seq LUAD (n = 513) | miRNA Seq Normal (n = 46) | miRNA LUAD vs. Normal | Common (n = 22) | Common vs. mRNA LUAD | Common vs. miRNA LUAD | ||
|---|---|---|---|---|---|---|---|---|---|---|
| t-test statistic | t-test statistic | t-test statistic | t-test statistics | |||||||
| Cohort size | Clinical data | 515 | 59 | 513 | 46 | 22 | ||||
| No data | 0 | 0 | 0 | 0 | 0 | |||||
| Age (years) | Median | 66 | 66 | −0.558 p = 0.578 | 66 | 67 | −0.171 p = 0.865 | 67.5 | 0.294 p = 0.722 | 0.229 p = 0.821 |
| Min–Max | 33–88 | 42–86 | 38–88 | 47–85 | 42–80 | |||||
| No data | 19 | 0 | 19 | 0 | 0 | |||||
| Gender | Female | 276 | 34 | / | 274 | 26 | / | 14 | / | / |
| Male | 239 | 25 | 239 | 20 | 8 | |||||
| Pack-years smoked | Median | 40 | 48 | 0.181 p = 0.857 | 40 | 40 | 0.290 p = 0.773 | 25 | −0.574 p = 0.581 | −0.591 p = 0.57 |
| Min–Max | 0.15–154 | 5–94 | 0.15–154 | 2–124 | 10–120 | |||||
| No data | 163 | 26 | 163 | 10 | 13 | |||||
| Vital status at last follow-up | Alive | 389 | 37 | / | 388 | 41 | / | 14 | / | / |
| Dead | 126 | 22 | 125 | 5 | 8 | |||||
| Last Follow-up | Median days | 157 | 306 | −1.73 | 157.5 | 182 | −0.345 | 242 | −1.18 | −1.24 |
| No data | 134 | 19 | p = 0.091 | 133 | 4 | p = 0.732 | 8 | p = 0.251 | p = 0.229 | |
| KRAS mutation | Tested and mutation found | 23 | 3 | 23 | 2 | 3 | ||||
| Tested and no mutation found | 36 | 3 | 36 | 2 | 8 | |||||
| EGFR mutation | Tested and mutation found | 23 | 1 | 23 | - | 2 | ||||
| Tested and no mutation found | 57 | 4 | 57 | 3 | 10 |
| GO Terms | Patient Cluster 1 | Patient Cluster 2 | Overlap | Percent Overlap | DRFs Associated with DEGs | DRFs Associated with DEMs |
|---|---|---|---|---|---|---|
| cell population proliferation | 11 | 1 | 12/22 | 55% | Variance | Variance |
| regulation of cell population proliferation | 11 | 1 | 12/22 | 55% | Variance | RLN, GLN_GLSZM, ZSN |
| positive regulation of developmental process | 7 | 1 | 8/22 | 36% | RLN, GLN_GLSZM, ZSN | RLV, volume, size, solidity, eccentricity |
| potassium ion transmembrane transport | 9 | 5 | 14/22 | 64% | Ell_Flatness, Moment5, cprom | Moment4 |
| cellular response to chemical stimulus | 4 | 3 | 7/22 | 32% | Variance | LRLGE, SZLGE, Complexity |
| response to organic substance | 5 | 2 | 7/22 | 32% | Variance | No DRF |
| muscle structure development | 11 | 1 | 12/22 | 55% | RLN, GLN_GLSZM, ZSN | Moment4 |
| negative regulation of developmental process | 10 | 7 | 17/22 | 77% | Variance | Variance |
| regulation of cell differentiation | 10 | 7 | 17/22 | 77% | Variance | Variance |
| cellular response to organic substance | 4 | 2 | 6/22 | 27% | Variance | contr,dissi,homom, homop, dvarh,indnc,idmnc, SRE, LRE, RP, SZLGE, Coarseness, Complexity, Strength |
| regulation of signaling | 10 | 7 | 17/22 | 77% | Variance | Variance |
Disclaimer/Publisher’s Note: The statements, opinions and data contained in all publications are solely those of the individual author(s) and contributor(s) and not of MDPI and/or the editor(s). MDPI and/or the editor(s) disclaim responsibility for any injury to people or property resulting from any ideas, methods, instructions or products referred to in the content. |
© 2023 by the authors. Licensee MDPI, Basel, Switzerland. This article is an open access article distributed under the terms and conditions of the Creative Commons Attribution (CC BY) license (https://creativecommons.org/licenses/by/4.0/).
Share and Cite
Fischer, S.; Spath, N.; Hamed, M. Data-Driven Radiogenomic Approach for Deciphering Molecular Mechanisms Underlying Imaging Phenotypes in Lung Adenocarcinoma: A Pilot Study. Int. J. Mol. Sci. 2023, 24, 4947. https://doi.org/10.3390/ijms24054947
Fischer S, Spath N, Hamed M. Data-Driven Radiogenomic Approach for Deciphering Molecular Mechanisms Underlying Imaging Phenotypes in Lung Adenocarcinoma: A Pilot Study. International Journal of Molecular Sciences. 2023; 24(5):4947. https://doi.org/10.3390/ijms24054947
Chicago/Turabian StyleFischer, Sarah, Nicolas Spath, and Mohamed Hamed. 2023. "Data-Driven Radiogenomic Approach for Deciphering Molecular Mechanisms Underlying Imaging Phenotypes in Lung Adenocarcinoma: A Pilot Study" International Journal of Molecular Sciences 24, no. 5: 4947. https://doi.org/10.3390/ijms24054947
APA StyleFischer, S., Spath, N., & Hamed, M. (2023). Data-Driven Radiogenomic Approach for Deciphering Molecular Mechanisms Underlying Imaging Phenotypes in Lung Adenocarcinoma: A Pilot Study. International Journal of Molecular Sciences, 24(5), 4947. https://doi.org/10.3390/ijms24054947


