Abstract
Adipose tissue inflammation in obesity has a deleterious impact on organs such as the liver, ultimately leading to their dysfunction. We have previously shown that activation of the calcium-sensing receptor (CaSR) in pre-adipocytes induces TNF-α and IL-1β expression and secretion; however, it is unknown whether these factors promote hepatocyte alterations, particularly promoting cell senescence and/or mitochondrial dysfunction. We generated conditioned medium (CM) from the pre-adipocyte cell line SW872 treated with either vehicle (CMveh) or the CaSR activator cinacalcet 2 µM (CMcin), in the absence or presence of the CaSR inhibitor calhex 231 10 µM (CMcin+cal). HepG2 cells were cultured with these CM for 120 h and then assessed for cell senescence and mitochondrial dysfunction. CMcin-treated cells showed increased SA-β-GAL staining, which was absent in TNF-α- and IL-1β-depleted CM. Compared to CMveh, CMcin arrested cell cycle, increased IL-1β and CCL2 mRNA, and induced p16 and p53 senescence markers, which was prevented by CMcin+cal. Crucial proteins for mitochondrial function, PGC-1α and OPA1, were decreased with CMcin treatment, concomitant with fragmentation of the mitochondrial network and decreased mitochondrial transmembrane potential. We conclude that pro-inflammatory cytokines TNF-α and IL-1β secreted by SW872 cells after CaSR activation promote cell senescence and mitochondrial dysfunction, which is mediated by mitochondrial fragmentation in HepG2 cells and whose effects were reversed with Mdivi-1. This investigation provides new evidence about the deleterious CaSR-induced communication between pre-adipocytes and liver cells, incorporating the mechanisms involved in cellular senescence.
1. Introduction
Cell senescence is described as a mechanism whereby a dividing cell enters a stable cell cycle arrest upon a stressing stimulus while remaining metabolically active. Senescent cells show the senescence-associated secretory phenotype (SASP) which involves the production of pro-inflammatory cytokines and other signaling factors and they become unresponsive to mitogenic and apoptotic signals [1]. Depending on the context, cell senescence can result in beneficial or detrimental effects to the organism. In young individuals or upon acute damage, senescence-related cell cycle arrest and SASP contribute to tumor suppression, wound healing, and tissue homeostasis [2].
Obesity is described as a chronic low-grade inflammatory process, where hypertrophic adipocytes accumulate in adipose tissue. This organ has an important endocrine role, secreting pro- or anti-inflammatory factors such as tumor necrosis factor α (TNF-α) and interleukin-1β (IL-1β) or interleukin-10 (IL-10) and adiponectin, respectively. The pro-inflammatory cytokines are associated with dysfunctional adipose tissue, which alters local and systemic metabolism, leading to obesity-related comorbidities [3,4]. Adipose tissue dysfunction has also been related to age-related diseases [3].
Adipose progenitor cells or “pre-adipocytes” are a cell population within adipose tissue with the ability to proliferate and differentiate into mature adipocytes, maintaining homeostasis through tissue plasticity and expandability [5,6,7]. An inflammatory environment can alter the homeostasis of pre-adipocytes, reducing their differentiation capacity and increasing their proliferation and pro-inflammatory cytokine expression [8,9]. Multiple inflammatory pathways have been described in adipose tissue, including the activation of the calcium-sensing receptor (CaSR), a G-protein coupled receptor that responds to several ligands and signals through multiple pathways. Pre-adipocytes express CaSR, and its activity is involved in the release of pro-inflammatory cytokines TNF-α and IL-1β [10,11,12], which may promote stress-mediated cellular senescence development in other tissues [13,14].
Aging and obesity modulate the cellular senescence program, leading to the accumulation of senescent cells that promote tissue dysfunction, chronic inflammation, and fibrosis in the liver [4,15]. Alterations in liver cell function are important because of its role in the control of metabolism, biomolecule secretion, and energy homeostasis [16,17]. The liver is rich in mitochondria and is responsible for 15% of the total body oxygen consumption. Depending on the nutrient demand, the liver can oxidize various nutrients, such as carbohydrates and lipids, which are metabolized in mitochondria. Indeed, the liver can provide glucose to other tissues and, during fasting, its mitochondria can oxidize the fatty acids released from adipose tissue, producing ketones and ATP. Therefore, mitochondria are key players for hepatocyte energy homeostasis and their dysfunction is involved in the development of metabolic diseases [18,19].
It has been suggested that cell senescence and mitochondrial dysfunction are key hallmarks of aging [20]. During cell senescence, dysfunctional mitochondria accumulate due to a reduction in mitophagy [21]. Moreover, the senescent phenotype in hepatocytes is associated with decreased lipid oxidation, which favors hepatic inflammation and lipid accumulation (steatosis) [22].
The inflammatory environment generated by cytokines such as IL-1β and TNF-α alters the liver’s morphology and function, promotes fibrosis, mitochondrial dysfunction, and increases the number of senescent cells [22,23,24]. However, it is unknown whether the secretion products of pre-adipocytes after CaSR activation promote cell senescence and mitochondrial dysfunction in hepatocytes. Our aim was to investigate if CaSR activation induces pro-inflammatory secretion in the human pre-adipocyte cell line SW872, leading to pro-inflammatory cytokine expression, cellular senescence, and mitochondrial dysfunction in HepG2 cells.
2. Results
2.1. Pro-Inflammatory Secretion Factors from CaSR-Activated SW872 Pre-Adipocytes Induce Cell Senescence in HepG2 Cells
To evaluate the pro-senescence effect of pre-adipocyte-secreted factors, we obtained conditioned medium (CM) from SW872 cells treated with the CaSR activator cinacalcet 2 µM for 16 h (CMcin). As the control, we used CM from SW782 cells treated with vehicle alone (CMveh). The senescence-associated β-galactosidase (SA-β-GAL) assay (a marker of residual lysosomal activity associated with cell senescence) [13,25] showed that CMcin-treated HepG2 cells displayed higher SA-β-GAL expression, as well as cytomegaly compared to CMveh-treated cells (p < 0.05) (Figure 1a). We quantified SA-β-GAL expression both as the count of positive cells and colorimetry (Figure 1b,c). To test whether these changes depended on CaSR activation, we obtained CM from SW872 cells treated with cinacalcet in the presence of the CaSR inhibitor calhex 231 10 µM (CMcin+cal), which abolished the effect of CMcin (Figure 1b,c).
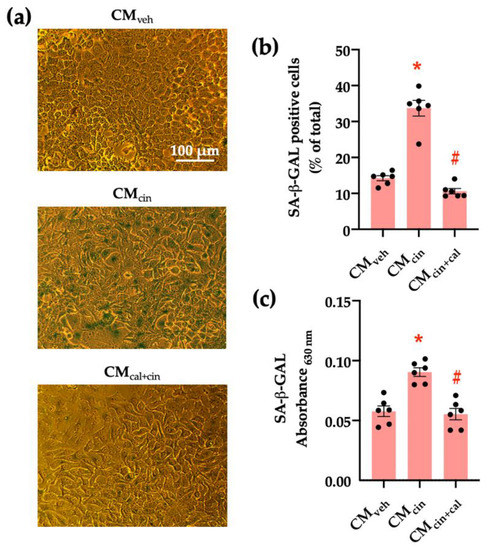
Figure 1.
CaSR activation in SW872 pre-adipocytes induces the secretion of factors that induce cell senescence in HepG2 hepatocytes: (a) Representative images of SA-β-GAL staining of HepG2 cells exposed to the CMveh, CMcin, and CMcin+cal (scale bar = 100 μm); (b) Quantification of SA-β-GAL positive cells normalized by total cells in the field; and (c) SA-β-GAL absorbance recorded at 630 nm. Each dot represents an individual experiment (n = 6). * p < 0.05 versus the control, # p < 0.05 versus CMcin, Friedman’s test, and Dunn’s post-hoc test.
To further characterize the senescent phenotype in our model, we evaluated the p53/p21/p16 signaling cascade. Cell cycle regulation by p53, p21, and p16 can be activated by stress signals, such as DNA damage or mitochondrial dysfunction [26,27,28]. CMcin-treated HepG2 cells showed increased protein levels of p16 and p21, but not p53, as assessed by Western blot analysis (p < 0.05) (Figure 2a–d). Again, treatment with CMcin+cal failed to induce any change, thereby supporting the role of CaSR activation in this process.
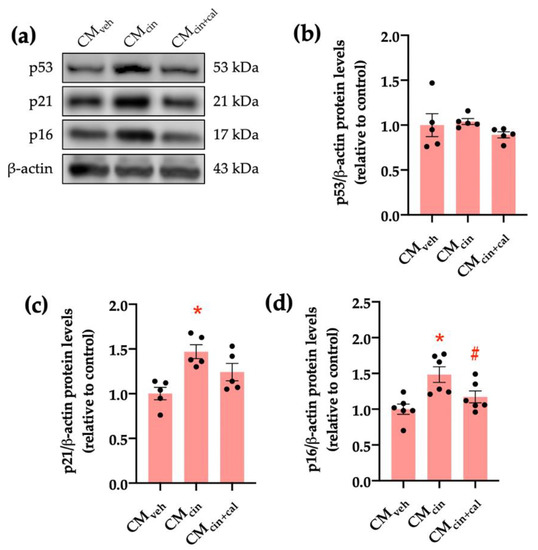
Figure 2.
CaSR activation in SW872 pre-adipocytes induces the secretion of factors that activate the p16/p21/p53 cascade in HepG2 cells: (a) immunodetection of p53, p21, and p16 protein levels in HepG2 cells exposed to the CMveh, CMcin, and CMcin+cal; (b) quantification of p53 protein levels; (c) quantification of p21 protein levels; (d) quantification of p16 protein levels. Each dot represents an individual experiment (n = 5–6). * p < 0.05, versus the control, # p < 0.05 versus CMcin, Friedman’s test, and Dunn’s post-hoc test.
Cell cycle arrest is a hallmark of cell senescence, which we evaluated by the location of the protein Ki67. This protein is diminished in the nucleus of senescent cells, and together with other markers, allows us to assess cell senescence [29]. As expected, HepG2 cells treated with CMcin showed a decreased Ki67 immunofluorescence signal compared with the control condition (p < 0.05). This change did not take place in the CMcin+cal condition (Figure 3a,b).

Figure 3.
CaSR activation in SW872 pre-adipocytes induces the secretion of factors that induce cell cycle arrest in HepG2 cells: (a) representative images of HepG2 cells exposed to the CMveh, CMcin, and CMcin+cal. Hoechst (blue) was used to identify the nuclei and anti-Ki67 antibody (green) to evaluate the nuclear localization of Ki67 (scale bar = 100 μm); (b) quantification of total Ki67 immunofluorescence. The inset shows CMcal immunofluorescence relative to the control. Each dot represents an individual experiment (n = 5). * p < 0.05 versus the control, Friedman’s test, and Dunn’s post-hoc test.
Another key feature of senescent cells is the senescence-associated secretory phenotype (SASP), which consists of the induction of pro-inflammatory cytokines and chemoattractants, such as IL-1β and CCL2, respectively [30,31]. Our results show that HepG2 cells treated with CMcin increased the relative abundance of both IL-1β and CCL2 mRNA compared to CMveh (p < 0.05), while CMcin+cal prevented these changes (Figure 4a–c).
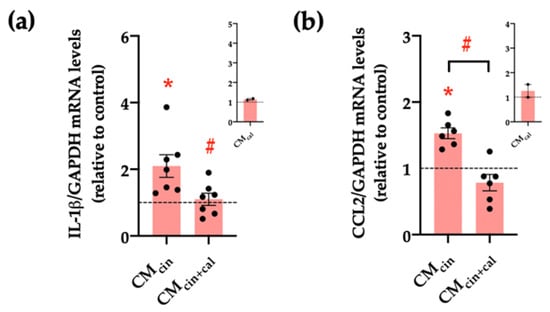
Figure 4.
CaSR activation in SW872 pre-adipocytes induces the secretion of factors that induce the secretion of pro-inflammatory cytokines in HepG2 cells: relative abundance of (a) IL-1β and (b) CCL2 mRNA in HepG2 cells exposed to CMcin and CMcin+cal; expressed as fold from CMveh, (represented by the dotted line). mRNA levels were normalized to GAPDH mRNA. The insets show CMcal normalized mRNA levels relative to the control. Each dot represents an individual experiment (n = 2–7). * p < 0.05 versus the control, # p < 0.05 versus CMcin, and the Wilcoxon signed rank test.
To explore the mediators of this pro-senescence effect, we separately immunoprecipitated IL-6, IL-1β, or TNF-α from the SW872-derived CMcin, given the evidence of their release by preadipocytes [10,11,32] in addition to their association with stress-associated cell senescence [33,34,35]. Our approach specifically reduced the levels of each cytokine from the CM (Figure 5a). We verified the effectiveness of the procedure by observing that each cytokine was enriched in the pellet of their respective immune complex (Figure 5b). Immunoprecipitation of either TNF-α (CMTNF-α[−]) or IL-1β (CMIL-1β[−]) prevented the increase in SA-β-GAL in CMcin-treated HepG2 cells, while IL-6 immunoprecipitation (CMIL-6[−]) did not evoke a significant effect (Figure 5c–e).
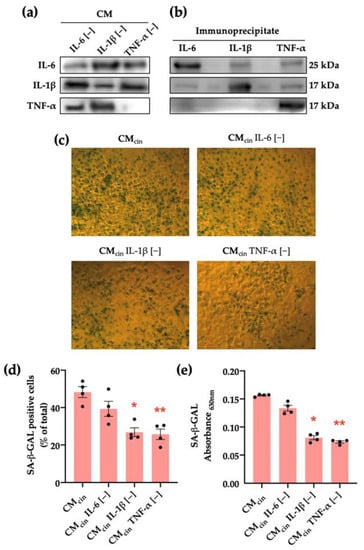
Figure 5.
CaSR activation in SW872 pre-adipocytes elevates IL-1β and TNF-α secretion, which induce cell senescence in HepG2 cells: (a) immunodetection of IL-6, IL-1β, and TNF-α protein levels in CMcin after immunoprecipitation (n = 1); (b) immunodetection of IL-6, IL-1β, and TNF-α protein levels in the CMcin pellet after immunoprecipitation (n = 1); (c) Representative images of SA-β-GAL staining of HepG2 cells exposed to CMcin, CMIL-6 [−], CMIL-1β [−], and CMTNF-α [−] (scale bar = 100 μm); (d) quantification of SA-β-GAL-positive cells normalized by total cells in the field; (e) SA-β-GAL absorbance recorded at 630 nm. Each dot represents an individual experiment (n = 6). * p < 0.05, and ** p < 0.01, the versus control, Friedman’s test, and Dunn’s post-hoc test.
2.2. Secretion Products from CaSR-Activated SW872 Pre-Adipocytes Alter the Mitochondrial Dynamics and Function of HepG2 Cells
Given that cell senescence is characterized by a general decrease in cell function including mitochondrial dysfunction [27,36], we evaluated key factors for mitochondrial dynamics. Our results show that the protein levels of OPA1, which maintains mitochondrial cristae structure, and PGC-1α, which promotes mitochondrial biogenesis, significantly decrease in HepG2 cells exposed to CMcin (p < 0.05) compared to CMveh. In the case of MFN2 protein levels, which mediates mitochondrial fusion, there was a trend to decrease (p < 0.08). Conversely, the protein levels of DRP1, which participates in mitochondrial fission, increased upon treatment with CMcin (Figure 6a–f). As with previous results, these observations were reversed in the CMcin+cal condition.
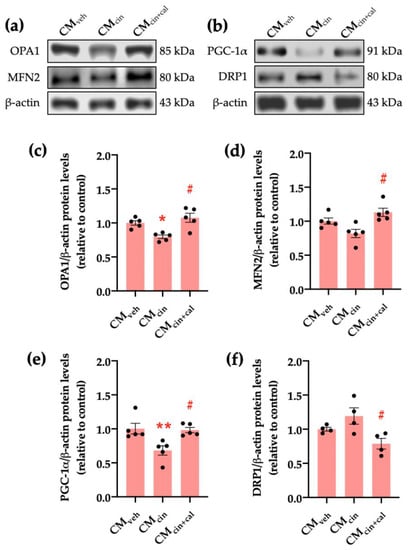
Figure 6.
CaSR activation in SW872 pre-adipocytes induces the secretion of factors that alter proteins governing mitochondrial dynamics in HepG2 cells: (a) immunodetection of OPA1 and MFN2 protein levels in HepG2 cells exposed to CMveh, CMcin, and CMcin+cal; (b) immunodetection of PGC-1α and DRP1 protein levels in treated HepG2 cells; quantification of (c) OPA1; (d) MFN2; (e) PGC-1α; and (f) DRP1 protein levels. Each dot represents an individual experiment (n = 4–5). * p < 0.05 and ** p < 0.01 versus the control, # p < 0.05 versus CMcin, Friedman’s test, and Dunn’s post-hoc test.
Next, we analyzed the mitochondrial transmembrane potential (Δψ) through immunofluorescence using the Δψ-sensitive probe MitoTracker Orange (MTO) normalized by mtHsp70 as a marker of mitochondrial mass. We observed that HepG2 cells exposed to CMcin had a decreased MTO/mtHsp70 fluorescence ratio (p < 0.05), indicative of decreased Δψ (Figure 7a,b). In addition, CMcin-treated cells presented a higher number of mitochondria per cell compared to the CMveh condition and a trend towards reduced average mitochondrial area (p < 0.08) (Figure 7c,d). Altogether, these results indicate that CMcin treatment in pre-adipocytes induces the secretion of factors that promote mitochondrial fragmentation and the decrease of bioenergetics in HepG2 cells, thus suggesting mitochondrial dysfunction.
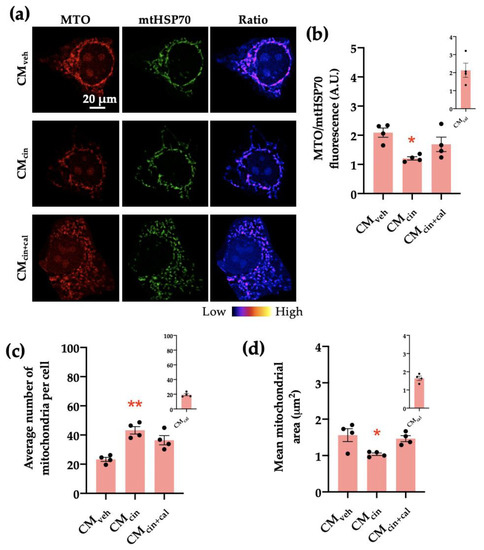
Figure 7.
CaSR activation in SW872 pre-adipocytes induces the secretion of factors that induce mitochondrial alterations in HepG2 cells: (a) representative immunofluorescence images obtained through confocal microscopy of HepG2 cells treated with CMveh, CMcin, or CMcin+cal stained with MitoTracker Orange (MTO, red) and an anti-mtHsp70 antibody (green); the ratio of MTO/mtHSP70 fluorescence is shown in pseudo colors (right column of images); (b) quantification of the overall fluorescence ratios between MTO mtHsp70; (c) quantification of the mean mitochondrial area; (d) quantification of the average number of mitochondria per cell. The insets show CMcal levels relative to the control. Each dot represents an individual experiment (n = 4). * p < 0.05 and ** p < 0.01 versus the control, Friedman’s test, and Dunn’s post-hoc test.
2.3. Inhibition of Mitochondrial Fission in HepG2 Cells Prevents Cell Senescence Induced by Cinacalcet-Treated SW872 Pre-Adipocyte Secretion Factors
We addressed whether the observed mitochondrial fragmentation contributes to the development of MCcin-induced cell senescence in HepG2 cells by inhibiting mitochondrial network fragmentation using the DRP1 inhibitor Mdivi-1 during the last 24 h of the treatment with SW872 CM. As expected, Mdivi-1 treatment prevented CMcin-induced mitochondrial fragmentation, maintaining the mitochondrial number similar to CMveh-treated cells (Figure 8a,c,d). Similarly, Mdivi-1 treatment prevented the decrease in Δψ observed upon CMcin treatment (Figure 8b).
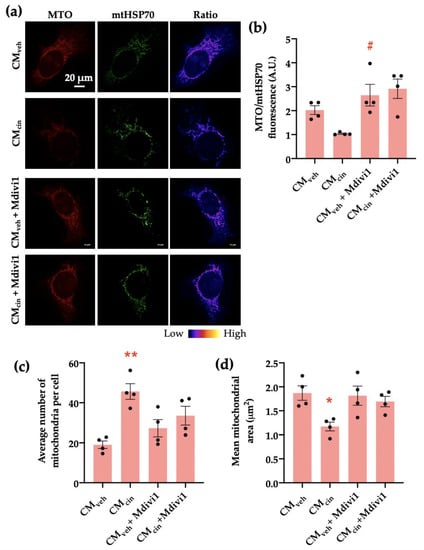
Figure 8.
Mdivi1 prevents mitochondrial alterations induced by CMcin on HepG2 cells: (a) representative immunofluorescence images obtained through confocal microscopy of HepG2 cells treated with CMveh and CMcin and subsequently treated or not with Mdivi-1, stained with MitoTracker Orange (MTO, red) and an anti-mtHsp70 antibody (green); the ratio of MTO/mtHSP70 fluorescence is shown in pseudo colors (right column of images); (b) quantification of the overall fluorescence ratios between MTO mtHsp70; (c) quantification of the mean mitochondrial area; (d) quantification of the average number of mitochondria per cell. Each dot represents an individual experiment (n = 4). * p < 0.05 and ** p < 0.01 versus the control, # p < 0.05 versus CMcin, Friedman’s test, and Dunn’s post-hoc test.
We next investigated how Mdivi1 affects the mitochondrial bioenergetics of HepG2 treated with CMcin. We observed that while CMcin did not significantly alter baseline respiration compared to CMveh, it decreased both non-ATP associated and maximal capacity respiration rates, confirming mitochondrial dysfunction. In both cases, treatment with Mdivi-1 reverted said changes (Figure 9a–c).
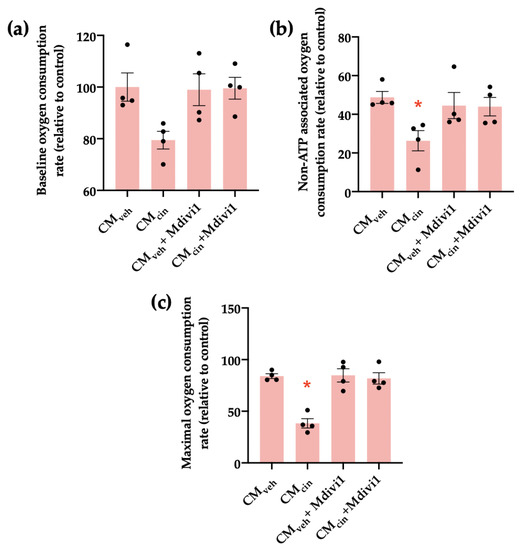
Figure 9.
Mdivi1 inhibits the mitochondrial bioenergetics alterations induced by CMcin on HepG2 cells: (a) quantification of baseline oxygen consumption rates of HepG2 cells treated with CMveh or CMcin and subsequently treated or not with Mdivi-1; (b) quantification of non-ATP-associated oxygen consumption rates of treated HepG2 cells; (c) quantification of maximal capacity oxygen consumption rates of treated HepG2 cells. Each dot represents an individual experiment (n = 4). * p < 0.05 versus the control, Friedman’s test, and Dunn’s post-hoc test.
Finally, we assessed whether mitochondrial fragmentation inhibition counteracts CMcin-induced cell senescence, evaluated as cell cycle arrest and SASP in HepG2 cells. Indeed, Mdivi-1 treatment prevented the decrease in Ki67 nuclear fluorescence (Figure 10a,b) induced by CMcin, as well as the increase in IL-1β and CCL2 mRNA levels (Figure 11a,b). Altogether, these results highlight the importance of mitochondrial fragmentation for the progression of cell senescence induced by CaSR-activated pre-adipocytes.
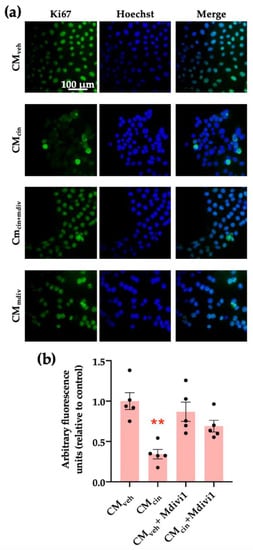
Figure 10.
Inhibition of mitochondrial fission prevents the cell cycle arrest induced by CMcin in HepG2 cells: (a) representative images of HepG2 cells exposed to the CMveh, CMcin, CMveh + Mdivi1, and CMcin + Mdivi1. Hoechst (blue) was used to identify the nuclei and anti-Ki67 antibody (green) to evaluate the nuclear localization of Ki67 (scale bar = 100 μm); (b) quantification of total Ki67 immunofluorescence. Each dot represents an individual experiment (n = 5). ** p < 0.01 versus the control, Friedman’s test, and Dunn’s post-hoc test.
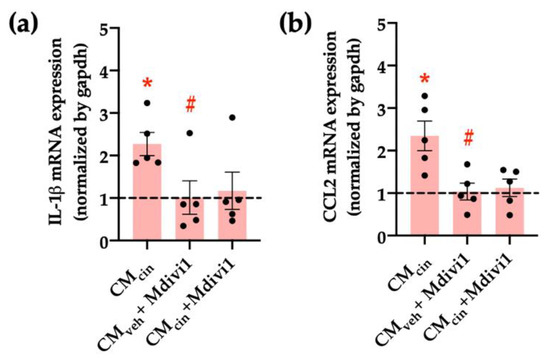
Figure 11.
Inhibition of mitochondrial fission prevents the increase in pro-inflammatory cytokines induced by CMcin in HepG2 cells: relative abundance of (a) IL-1β and (b) CCL2 mRNA in HepG2 cells exposed to CMcin, CMveh + Mdivi1, and CMcin + Mdivi1, expressed as fold from CMveh, represented by the dotted line. mRNA levels were normalized to GAPDH mRNA. Each dot represents an individual experiment (n = 5). * p < 0.01 versus the control, # p < 0.05 versus CMcin, and the Wilcoxon signed rank test.
3. Discussion
The present work evaluated whether CaSR activation in SW872 pre-adipocytes promotes pro-inflammatory signaling that induces senescence and mitochondrial dysfunction in HepG2 cells. Our observations indicate that CaSR activation in the SW872 cell line stimulated the production of factors that increased senescence, the production of pro-inflammatory cytokines, cell cycle arrest, and mitochondrial dysfunction markers in HepG2 cells.
In pre-adipocytes, CaSR activation has been shown to promote the secretion of the pro-inflammatory cytokines TNF-α and IL-1β [10,11]. Elevated circulating TNF-α is associated with an increase in cellular senescence markers, such as SA-β-GAL, p21, and p53 in the liver and kidneys [37]. Our observations are consistent with other investigations where TNF-α was able to increase SA-β-GAL [37]. Moreover, we also observed that removing IL-1β prevented an increase in SA-β-GAL. Thus, our results highlight that both IL-1β and TNF-α in the conditioned medium from CaSR-activated pre-adipocytes contribute to cellular senescence development in the HepG2 cell line.
Studies in macrophages have shown that exposure to conditioned medium from senescent pre-adipocytes increase p16 and p21 expression, which was attributed to the secretory products that make up the SASP, such as TNF-α and CCL2 [38,39]. Other reports on human vascular smooth muscle cell cultures have shown that IL-1β exposure increases p16 and p21 expression through a mechanism involving SIRT1 deregulation [40]. Decreased activation of the SIRT1 metabolic pathway has been observed in models of aging and inflammation. In rats, SIRT1 activation promoted mitochondrial biogenesis and the endogenous antioxidant system through PGC1a and NRF2 activity on neuronal tissue [41]. A study in cells from the nucleus pulposus showed that TNF-α promoted the cellular senescence markers SA-β-GAL and p21, a change that was related to greater activity of NF-κB [42]. Unlike p16 and p21, in our experiments we did not observe significant changes on p53, a protein that modulates p21 expression. In relation to this, it has been described that p21 can be regulated in a p53-independent manner through ERK1/2 and p38 MAPK [43].
It is well-accepted that the inflammatory activity of TNF-α and IL-1β initiates stress-driven cellular senescence. The process begins with an increase in cellular senescence markers such as SA-β-GAL and greater expression of pro-inflammatory cytokines and chemoattractants such as IL-1β and CCL2 [44]. In this context, the increased expression of IL-1β and CCL2 triggers the spread of inflammation and the attraction of immune cells, which eliminate senescent cells [14,44,45].
Studies in animal models have shown that the low expression of OPA1 is related to the increase in the pro-inflammatory cytokines TNF-α and IL-1β in the circulation [46]. In the liver of OPA1-deficient mice, the markers for cellular senescence, SA-β-GAL and p21, were increased [46]. We observed low expression of PGC-1α in CMcin-treated HepG2 cells, which is consistent with results in mouse liver tissue showing that stimuli such as a high-fat diet decreases PGC-1α expression and increases cellular senescence markers, such as SASP [47]. Moreover, the low expression of PGC-1α is related to reduced protection against oxidative stress and cellular senescence [48]. In the CMcin+cal treatment, MFN2 recovered its expression and DRP1 decreased compared to CMcin. Low expression of MFN2 has been associated with increased fragmentation of the mitochondrial network and lower membrane potential [49,50]. It has been reported that pro-inflammatory stimuli such as TNF-α increase mitochondrial dysfunction markers such as the fragmentation of the mitochondrial network [51].
In senescent cells, mitochondrial alterations such as fragmentation in the mitochondrial network or loss in the Δψ are common features [52,53]. Our results coincide with those reported in colon and melanocyte cell lines exposed to overexpression of TNF-α, which decreased the Δψ and increased the fragmentation of the mitochondrial network. After an early process of apoptosis, the remaining cells show mitochondrial dysfunction and increased cytokine expression, which is associated with cellular senescence [53]. The evidence on altered mitochondrial dynamics and cellular senescence is under discussion because the results may vary depending on the cell type under study [22,54]. Based on our findings, we propose that the secretion products in CMcin affect mitochondrial morphology through decreased expression of proteins that promote organelle biogenesis and fusion, as well as increased fragmentation of the mitochondrial network. In addition, treated cells presented an alteration in mitochondrial bioenergetics, showing a lower Δψ and lower respiratory rate. These data suggest that CMcin damages the mitochondrial network, and thus limits the biogenesis and bioenergetics of this organelle.
Losing mitochondrial network integrity favors the development of mitochondrial dysfunction, and in our HepG2 cells treated with CMcin this indicator increased. In experiments in HepG2 cells where Ki67 was pharmacologically reduced, Ki67 was recovered after Mdivi-1 treatment [55]. Furthermore, in a rat model of ischemia, Mdivi-1 increased Δψ and the authors attribute this behavior to the regulatory action of the reagent on mitophagy mediated by PINK/Parking proteins [56]. It was also shown in LPS-exposed cardiomyocytes that Mdivi-1 contributes to the recovery of Δψ [57]. The effects of Mdivi-1 on the Δψ regulation would be related to mitochondrial membrane integrity maintenance. Our results show that Mdivi-1 inhibited the increase in IL-1β and CCL2 expression caused by CMcin. Published studies in animal models exposed to amyloid β reveal that treatment with Mdivi-1 protects hippocampal cells from increased expression of IL-1β, which changes in mitochondrial dynamics, decreasing the MFN2 and OPA1 proteins [58]. In a cell model, it has been observed that treatment with Mdivi-1 before LPS exposure impaired the increase in pro-inflammatory cytokines such as IL-1β and CCL2 [59].
The present work addresses a line of research that innovates on the relationship between CaSR activation in pre-adipocytes and the development of the senescent phenotype and mitochondrial dysfunction in hepatic cells. It highlights and supports previous research on the importance of pre-adipocytes as potential promoters of deleterious effects in other cell types, further evidencing the participation of mitochondrial dysfunction as a regulator of the senescent phenotype. Future studies should also include a wider use of CaSR inhibition strategies such as the CaSR-negative modulator calhex 231 and possibly others, and furthermore with CaSR gene downregulation via siRNA, in order to better understand the involvement of this receptor in the observed effects. Further characterization of the senescent phenotype would have been desirable, such as cell cycle analysis through flow cytometry or chromatin remodeling or DNA damage via fluorescence microscopy. In addition, we did not explore other functional outcomes in senescent HepG2 cells, such as lipid uptake or insulin signaling. Finally, this model of cellular communication can be used with other cell types. Thus, the effects of conditioned media from CaSR-activated pre-adipocytes can be assessed in smooth muscle or endothelial cells as a future research direction.
Our results indicate that inhibiting mitochondrial network fragmentation protects HepG2 cells from changes related to CMcin exposure, seen in the recovery of Δψ and the decreased expression of pro-inflammatory cytokines. In summary, the conditioned medium from pre-adipocytes after CaSR activation promotes senescence and mitochondrial dysfunction in hepatocytes. Our investigation provides evidence about the communication between pre-adipocytes and liver cells mediated by CaSR activation, raising new questions such as further pre-adipocyte conditioned medium characterization or the consequences of CaSR activation at the organismal level on liver senescence phenotype and disease.
4. Materials and Methods
4.1. Cell Culture
A human liposarcoma-derived SW872 pre-adipose cell line (HTB-92, ATCC, Manassas, VA, USA) was grown in DMEM/F12 medium. A human hepatocellular carcinoma-derived HepG2 cell line (HB-8065, ATCC, Manassas, VA, USA) was cultured in MEM medium. All media were supplemented with 10% fetal bovine serum and antibiotics (penicillin–streptomycin) and the cells were maintained in a 37 °C 5% CO2 atmosphere. The medium was changed for a fresh medium twice per week.
4.2. SW872 Cells’ Conditioned Media Collection
SW872 cells were cultured at a 10,000 cells/cm2 density in 100 mm plastic culture dishes. To obtain conditioned media, the cells were treated with either vehicle (DMSO) or 2 µM cinacalcet with or without 30 min of pre-incubation with the negative allosteric CaSR modulator calhex-231 (10 µM). After 16 h, the media were replaced with fresh DMEM/F12 and conditioned for 24 h. The conditioned media were centrifuged at 800× g for 10 min at 4 °C and stored at −80 °C until use.
4.3. HepG2 Cells’ Exposure to Conditioned Media and Mdivi1
HepG2 cells were cultured at 9000 cells/cm2 density in culture dishes, according to each experimental protocol. The cells were washed twice with PBS and the media were replaced with fresh MEM media containing 50% of the conditioned media from SW872 cells. The HepG2 cells were then grown for 5 days under standard culture conditions, replacing the media for fresh conditioned media after 3 days.
For treatment with Mdivi1, the cells were conditioned as described above, and during the last 24 h of exposure they were treated with vehicle (DMSO) of 50 µM of Mdivi1.
4.4. Immunoprecipitation
IL-6, IL-1β, or TNF-α were immunoprecipitated from the CMcin. For that, 10 μg of IL-6, IL-1β, or TNF-α antibodies (Table 1) were incubated with 200 μL of hydrated Protein A-Sepharose CL-4B (17-0963-03, Sigma, St. Louis, MO, USA) for 16 h to obtain a solution with the immobilized antibody. Then, the immobilized antibody solution was mixed with 1 mL of CMcin 12 h at 4 °C in a rotary mixer. The sample was then centrifuged at 3000× g for 5 min at 4 °C. Supernatants were used to treat HepG2 cells and evaluate SA-β-GAL. To analyze cytokine protein levels in the immunoprecipitate, the pellets were resuspended in 30 µL of Laemmli loading buffer and evaluated through Western blot analysis.

Table 1.
Primary antibodies for Western blot analysis.
4.5. HepG2 SA-β-GAL Activity
The cells were cultured in 96-well plates and observed under an inverted phase contrast microscope before and after treatment for 5 days. Images were recorded with a Motic AE2000 camera and Motic Images Plus 2.0 ML software (Motic, Vancouver, BC, Canada). The cultures were treated with the senescence-associated β-galactosidase staining kit (Cell Signaling Technology, Danvers, MA, USA) following the manufacturer’s instructions. After incubating overnight at 37 °C, the cells were examined by microscopy and the respective blue staining in positive cells was recorded. Next, the number of positive cells was normalized by the total number of cells in the photograph to obtain an indicator of the percentage of senescent cells in each experiment. Then, X-gal blue products were dissolved with DMSO and the absorbance was measured at 630 mn [60].
4.6. RNA Isolation, Reverse Transcription, and mRNA Expression by RT-PCR
The cells were cultured in 6-well plates and after experimentation, Trizol (Invitrogen, Life Technologies, Carlsbad, CA, USA) was used to lyse the HepG2 cells and isolate total RNA following the manufacturer’s instructions. RNA was reverse-transcribed into complementary DNA (cDNA) using a high-capacity cDNA reverse transcription kit (Applied Biosystems, Foster City, CA, USA). The cDNA levels were analyzed with a step-one real-time PCR system using the SYBR FAST qPCR kit (Applied Biosystems, Foster City, CA, USA) and specific primers for: il-1β (forward: 5′ GGACAAGCTGAGGAAGATGC 3′; reverse: 5′ TCGTTATCCCATGTGTCGAA 3′, NM_000576), ccl2 (forward: 5′ TGTCCCAAAGAAGCTGTGATCT 3′; Reverse: 5′ GGAATCCTGAACCCACTTCTG 3′; NM_002982), and gapdh (forward: 5′ GAAGGTGAAGGTCGGAGTCAAC 3′; reverse: 5′ CAGAGTTAAAAGCAGCCCTGGT 3′; NM_020). Thermal cycling consisted of an initial pre-incubation cycle of 20 s at 95 °C, followed by 40 cycles of 30 s at 95 °C. The results were normalized for the gapdh gene and relative mRNA levels were calculated using the Pfaffl method [61].
4.7. Protein Levels by Western Blot Analysis
The cells were cultured in 6-well plates and after experimentation, they were washed three times with cold PBS and lysed with NP40 buffer (Invitrogen™, Carlsbad, CA, USA), complete protease inhibitor (#11697498001, Sigma-Aldrich, St. Louis, MO, USA), and PhosSTOP phosphatase inhibitor (#4906845001, Sigma-Aldrich, St. Louis, MO, USA). The lysed cells were centrifuged at 12,000× g for 15 min and the supernatant was stored at −80 °C until use. At concentrations of 1 μg/μL, the proteins were subjected to electrophoresis in SDS-polyacrylamide gels under denaturing conditions and were electrotransferred to a 0.2 μm pore PVDF membrane. The membranes were then blocked with TBS 5% skim milk 0.05% Tween 20 (#7949, Sigma, St. Louis, MO, USA).
The following proteins were detected after 16 h of incubation with the primary antibodies: p16, p21, p53, PGC1α, MFN2, DRP1, OPA1, and β-actin (Table 1). The detection of immune complexes was performed with the incubation of anti-rabbit IgG, anti-mouse IgG, or anti-goat IgG peroxidase-conjugated secondary antibodies, depending on the origin of each primary antibody (Table 2). The membranes were incubated for 1 min with chemiluminescence reagents (#20-500-500A and 20-500-500B, Biological Industries, Cromwell, CT, USA), the digitized luminescent signal was detected in a LI-COR C-Digit scanner 3600 (LI-COR Biosciences, Lincoln, NE, USA), and the intensity of the bands was quantified with the ImageJ program (National Institutes of Health, USA). The expression of each protein was normalized by β-actin and expressed as arbitrary units.
Table 2.
Secondary antibodies for Western blot analysis.
4.8. Immunofluorescence
The HepG2 cells were seeded in 12-well plates with 0.17 mm and treated as indicated. For analysis of mitochondrial membrane potential, the cells were loaded with MitoTracker Orange 400 nM (M7510, Invitrogen™, Carlsbad, CA, USA) for 25 min at 37 °C. Then, the culture medium was removed and the cells were washed twice with PBS. The cells were fixed with 4% paraformaldehyde at 4 °C for 15 min. The fixation medium was removed and washed twice with cold PBS. To permeabilize the cells, they were incubated with PBS 0.1% Triton X-100 for 10 min. After permeabilization, the cells were washed twice with cold PBS and blocked with PBS 3% BSA for 1 h at room temperature. The samples were treated with primary antibodies in PBS 3% BSA overnight at 4 °C in a humid chamber protected from light.
The primary antibodies and their dilutions were: anti-Ki-67 (#9449, Cell Signaling, proliferation marker) 1:400 or anti-mtHsp70 (MA3-028, Thermo Fisher Scientific, mitochondrial marker) 1:500, according to the assay. The next day, the coverslips were washed twice with cold PBS to remove excess primary antibodies, and the samples were incubated for 1 h with an Alexa Fluor 488 secondary antibody (A32723, Thermo Fisher Scientific, Waltham, MA, USA) 1:600 in a chamber protected from light at room temperature. After washing with PBS, the samples were incubated with the fluorescent probe Hoechst (B2261, Merck (Rahway, NJ, USA), nucleus marker) 1:1000 diluted in PBS BSA 3% for 15 min at room temperature in a chamber protected from light. The coverslips were then washed twice with cold PBS to remove excess probes and mounted on a clean slide with Dako fluorescence mounting medium (S3023, Dako-Agilent, Santa Clara, CA, USA). The samples were stored at 4 °C protected from light until analysis.
4.9. Image Capture and Processing
Images were taken with a Zeiss LSM-5, Pascal 5 Axiovert 200 confocal microscope, with a Plan-Apochromat 40×/1.5 Oil DIC objective, using 365 (for Hoechst), 488 (for Alexa Fluor 488), and 555 nm (for MitoTracker Orange) excitation lasers. For each independent experiment, it averaged the signal from 5 to 15 cells. The analysis was performed on 1 focal plane corresponding to the equator of the cells. The pixel size was 68 nm, following the Nyquist sampling criterion. The images thus obtained were deconvolved, the background noise was subtracted, a median filter was applied, and fluorescence intensity was quantified using the ImageJ software.
4.10. Oxygraphy
HepG2 cells were seeded in 60 mm dishes. After the 5 days of treatment, the cells were trypsinized and resuspended in a Clark electrode chamber (Strathkelvin Instruments, North Lanarkshire, Scotland) to quantify the oxygen consumption of living cells. Basal respiration was measured for 5 min at 25 °C, then 10 μg/mL of oligomycin was added to assess non-ATP-associated respiration for 5 min, followed by 200 nM CCCP to quantify maximal respiration capacity for another 5 min. Then, the cells were recovered to quantify total proteins using a BCA kit to normalize oxygen consumption rates.
4.11. Statistical Analysis
Data are shown as the mean ± the standard error of the mean (SEM). Differences between conditions were evaluated with the non-parametric Friedman test and multiple comparisons were made with the Dunn’s test. The Wilcoxon signed rank test was used to detect differences in the results obtained through real-time PCR. A p value less than 0.05 was considered as a significant change, while p values less than 0.1 were considered a trend.
Author Contributions
Conceptualization, R.B.-S., M.C. and L.B.-S.; methodology, L.B.-S.; software, M.C., R.B.-S. and L.B.-S.; formal analysis, M.C., R.B.-S. and L.B.-S.; investigation, L.B.-S.; writing—original draft preparation, M.C., R.B.-S. and L.B.-S.; writing—review and editing, M.C., R.B.-S. and L.B.-S.; project administration, M.C. and R.B.-S.; funding acquisition, M.C. and R.B.-S. All authors have read and agreed to the published version of the manuscript.
Funding
This research was funded by grants PAI 77170004-2017 to R.B.-S., FONDECYT 11201267 to R.B.-S., FONDECYT 1211477 to M.C., and FONDAP 15130011 to M.C. from Agencia Nacional de Investigación y Desarrollo (ANID), Chile, and by the University of Chile grant UI-006/19 to R.B.-S. and by the Department of Nutrition and Public Health, University of Bío-Bío C.C. 20503000 to L.B.-S.
Institutional Review Board Statement
Not applicable.
Informed Consent Statement
Not applicable.
Data Availability Statement
The data presented in this study are available on request from the corresponding author.
Acknowledgments
We thank Cecilia Fuentes and Camila Donoso for helping with the cell cultures.
Conflicts of Interest
The authors declare no conflict of interest.
References
- Hernandez-Segura, A.; Nehme, J.; Demaria, M. Hallmarks of Cellular Senescence. Trends Cell Biol. 2018, 28, 436–453. [Google Scholar] [CrossRef] [PubMed]
- Burton, D.G.A.; Faragher, R.G.A. Cellular Senescence: From Growth Arrest to Immunogenic Conversion. Age 2015, 37, 27. [Google Scholar] [CrossRef] [PubMed]
- Spritzer, P.M.; Lecke, S.B.; Satler, F.; Morsch, D.M. Adipose Tissue Dysfunction, Adipokines, and Low-Grade Chronic Inflammation in Polycystic Ovary Syndrome. Reproduction 2015, 149, R219–R227. [Google Scholar] [CrossRef] [PubMed]
- Hotamisligil, G.S. Inflammation, Metaflammation and Immunometabolic Disorders. Nature 2017, 542, 177–185. [Google Scholar] [CrossRef]
- Cawthorn, W.P.; Scheller, E.L.; MacDougald, O.A. Adipose Tissue Stem Cells Meet Preadipocyte Commitment: Going Back to the Future. J. Lipid Res. 2012, 53, 227–246. [Google Scholar] [CrossRef] [PubMed]
- Gesta, S.; Tseng, Y.-H.; Kahn, C.R. Developmental Origin of Fat: Tracking Obesity to Its Source. Cell 2007, 131, 242–256. [Google Scholar] [CrossRef]
- Ouchi, N.; Parker, J.L.; Lugus, J.J.; Walsh, K. Adipokines in Inflammation and Metabolic Disease. Nat. Rev. Immunol. 2011, 11, 85. [Google Scholar] [CrossRef]
- Gerhardt, C.C.; Romero, I.A.; Cancello, R.; Camoin, L.; Strosberg, A.D. Chemokines Control Fat Accumulation and Leptin Secretion by Cultured Human Adipocytes. Mol. Cell Endocrinol. 2001, 175, 81–92. [Google Scholar] [CrossRef]
- Zamboni, M.; Nori, N.; Brunelli, A.; Zoico, E. How Does Adipose Tissue Contribute to Inflammageing? Exp. Gerontol. 2021, 143, 111162. [Google Scholar] [CrossRef]
- D’Espessailles, A.; Mora, Y.A.; Fuentes, C.; Cifuentes, M. Calcium-Sensing Receptor Activates the NLRP3 Inflammasome in LS14 Preadipocytes Mediated by ERK1/2 Signaling. J. Cell. Physiol. 2018, 233, 6232–6240. [Google Scholar] [CrossRef]
- Mattar, P.; Bravo-Sagua, R.; Tobar, N.; Fuentes, C.; Troncoso, R.; Breitwieser, G.; Lavandero, S.; Cifuentes, M. Autophagy Mediates Calcium-Sensing Receptor-Induced TNFalpha Production in Human Preadipocytes. Biochim. Biophys. Acta Mol. Basis Dis. 2018, 1864, 3585–3594. [Google Scholar] [CrossRef]
- Cifuentes, M.; Fuentes, C.; Tobar, N.; Acevedo, I.; Villalobos, E.; Hugo, E.; Ben-Jonathan, N.; Reyes, M. Calcium Sensing Receptor Activation Elevates Proinflammatory Factor Expression in Human Adipose Cells and Adipose Tissue. Mol. Cell Endocrinol. 2012, 361, 24–30. [Google Scholar] [CrossRef] [PubMed]
- Aravinthan, A.; Shannon, N.; Heaney, J.; Hoare, M.; Marshall, A.; Alexander, G.J.M. The Senescent Hepatocyte Gene Signature in Chronic Liver Disease. Exp. Gerontol. 2014, 60, 37–45. [Google Scholar] [CrossRef]
- Chandler, H.; Peters, G. Stressing the Cell Cycle in Senescence and Aging. Curr. Opin. Cell Biol. 2013, 25, 765–771. [Google Scholar] [CrossRef] [PubMed]
- Ferrucci, L.; Fabbri, E. Inflammageing: Chronic Inflammation in Ageing, Cardiovascular Disease, and Frailty. Nat. Rev. Cardiol. 2018, 15, 505–522. [Google Scholar] [CrossRef] [PubMed]
- Hashimoto, S. Glucose Metabolism and Liver. In The Liver in Systemic Diseases; Springer: Tokyo, Japan, 2016; pp. 77–103. ISBN 978-4-431-55790-6. [Google Scholar]
- Robinson, M.W.; Harmon, C.; O’Farrelly, C. Liver Immunology and Its Role in Inflammation and Homeostasis. Cell Mol. Immunol. 2016, 13, 267–276. [Google Scholar] [CrossRef]
- Morio, B.; Panthu, B.; Bassot, A.; Rieusset, J. Role of Mitochondria in Liver Metabolic Health and Diseases. Cell Calcium. 2021, 94, 102336. [Google Scholar] [CrossRef]
- Shum, M.; Ngo, J.; Shirihai, O.S.; Liesa, M. Mitochondrial Oxidative Function in NAFLD: Friend or Foe? Mol. Metab. 2021, 50, 101134. [Google Scholar] [CrossRef]
- López-Otín, C.; Blasco, M.A.; Partridge, L.; Serrano, M.; Kroemer, G. The Hallmarks of Aging. Cell 2013, 153, 1194–1217. [Google Scholar] [CrossRef]
- Korolchuk, V.I.; Miwa, S.; Carroll, B.; von Zglinicki, T. Mitochondria in Cell Senescence: Is Mitophagy the Weakest Link? EBioMedicine 2017, 21, 7–13. [Google Scholar] [CrossRef]
- Ogrodnik, M.; Miwa, S.; Tchkonia, T.; Tiniakos, D.; Wilson, C.L.; Lahat, A.; Day, C.P.; Burt, A.; Palmer, A.; Anstee, Q.M.; et al. Cellular Senescence Drives Age-Dependent Hepatic Steatosis. Nat. Commun. 2017, 8, 15691. [Google Scholar] [CrossRef]
- Luedde, T.; Schwabe, R.F. NF-ΚB in the Liver—Linking Injury, Fibrosis and Hepatocellular Carcinoma. Nat. Rev. Gastroenterol. Hepatol. 2011, 8, 108–118. [Google Scholar] [CrossRef]
- Papatheodoridi, A.-M.; Chrysavgis, L.; Koutsilieris, M.; Chatzigeorgiou, A. The Role of Senescence in the Development of Nonalcoholic Fatty Liver Disease and Progression to Nonalcoholic Steatohepatitis. Hepatology 2020, 71, 363–374. [Google Scholar] [CrossRef] [PubMed]
- Nagano, T.; Nakano, M.; Nakashima, A.; Onishi, K. Identification of Cellular Senescence-Specific Genes by Comparative Transcriptomics. Sci Rep. 2016, 6, 31758. [Google Scholar] [CrossRef]
- González-Gualda, E.; Baker, A.G.; Fruk, L.; Muñoz-Espín, D. A Guide to Assessing Cellular Senescence in Vitro and in Vivo. FEBS J. 2021, 288, 56–80. [Google Scholar] [CrossRef] [PubMed]
- Kumari, R.; Jat, P. Mechanisms of Cellular Senescence: Cell Cycle Arrest and Senescence Associated Secretory Phenotype. Front. Cell. Dev. Biol. 2021, 9, 645593. [Google Scholar] [CrossRef] [PubMed]
- Sun, X.; Kaufman, P.D. Ki-67: More than a Proliferation Marker. Chromosoma 2018, 127, 175–186. [Google Scholar] [CrossRef] [PubMed]
- Biran, A.; Zada, L.; Abou Karam, P.; Vadai, E.; Roitman, L.; Ovadya, Y.; Porat, Z.; Krizhanovsky, V. Quantitative Identification of Senescent Cells in Aging and Disease. Aging Cell 2017, 16, 661–671. [Google Scholar] [CrossRef] [PubMed]
- Hansel, C.; Jendrossek, V.; Klein, D. Cellular Senescence in the Lung: The Central Role of Senescent Epithelial Cells. Int. J. Mol. Sci. 2020, 21, 3279. [Google Scholar] [CrossRef]
- Yoshimoto, S.; Loo, T.M.; Atarashi, K.; Kanda, H.; Sato, S.; Oyadomari, S.; Iwakura, Y.; Oshima, K.; Morita, H.; Hattori, M.; et al. Obesity-Induced Gut Microbial Metabolite Promotes Liver Cancer through Senescence Secretome. Nature 2013, 499, 97–101. [Google Scholar] [CrossRef]
- Renovato-Martins, M.; Moreira-Nunes, C.; Atella, G.C.; Barja-Fidalgo, C.; de Moraes, J.A. Obese Adipose Tissue Secretion Induces Inflammation in Preadipocytes: Role of Toll-Like Receptor-4. Nutrients 2020, 12, 2828. [Google Scholar] [CrossRef] [PubMed]
- Li, Y.; Lu, L.; Xie, Y.; Chen, X.; Tian, L.; Liang, Y.; Li, H.; Zhang, J.; Liu, Y.; Yu, X. Interleukin-6 Knockout Inhibits Senescence of Bone Mesenchymal Stem Cells in High-Fat Diet-Induced Bone Loss. Front. Endocrinol. 2021, 11, 622950. [Google Scholar] [CrossRef] [PubMed]
- Romero, A.; San Hipólito-Luengo, Á.; Villalobos, L.A.; Vallejo, S.; Valencia, I.; Michalska, P.; Pajuelo-Lozano, N.; Sánchez-Pérez, I.; León, R.; Bartha, J.L.; et al. The Angiotensin-(1-7)/Mas Receptor Axis Protects from Endothelial Cell Senescence via Klotho and Nrf2 Activation. Aging Cell 2019, 18, e12913. [Google Scholar] [CrossRef] [PubMed]
- Wang, Q.; Chen, Q.; Sui, J.; Tu, Y.; Guo, X.; Li, F. Celecoxib Prevents Tumor Necrosis Factor-α (TNF-α)-Induced Cellular Senescence in Human Chondrocytes. Bioengineered 2021, 12, 12812–12820. [Google Scholar] [CrossRef]
- Gorgoulis, V.; Adams, P.D.; Alimonti, A.; Bennett, D.C.; Bischof, O.; Bishop, C.; Campisi, J.; Collado, M.; Evangelou, K.; Ferbeyre, G.; et al. Cellular Senescence: Defining a Path Forward. Cell 2019, 179, 813–827. [Google Scholar] [CrossRef] [PubMed]
- Desdín-Micó, G.; Soto-Heredero, G.; Aranda, J.F.; Oller, J.; Carrasco, E.; Gabandé-Rodríguez, E.; Blanco, E.M.; Alfranca, A.; Cussó, L.; Desco, M.; et al. T Cells with Dysfunctional Mitochondria Induce Multimorbidity and Premature Senescence. Science 2020, 368, 1371–1376. [Google Scholar] [CrossRef]
- Kumar, R.; Sharma, A.; Padwad, Y.; Sharma, R. Preadipocyte Secretory Factors Differentially Modulate Murine Macrophage Functions during Aging Which Are Reversed by the Application of Phytochemical EGCG. Biogerontology 2020, 21, 325–343. [Google Scholar] [CrossRef]
- Parvizi, M.; Ryan, Z.C.; Ebtehaj, S.; Arendt, B.K.; Lanza, I.R. The Secretome of Senescent Preadipocytes Influences the Phenotype and Function of Cells of the Vascular Wall. Biochim. Biophys. Acta (BBA)-Mol. Basis Dis. 2021, 1867, 165983. [Google Scholar] [CrossRef]
- Zhao, J.; He, X.; Zuo, M.; Li, X.; Sun, Z. Anagliptin Prevented Interleukin 1 β (IL-1 β) -Induced Cellular Senescence in Vascular Smooth Muscle Cells through Increasing the Expression of Sirtuin1. Bioengineered 2021, 12, 3968–3977. [Google Scholar] [CrossRef]
- Chuang, Y.C.; der Chen, S.; Jou, S.-B.; Lin, T.K.; Chen, S.F.; Chen, N.C.; Hsu, C.Y. Sirtuin 1 Regulates Mitochondrial Biogenesis and Provides an Endogenous Neuroprotective Mechanism Against Seizure-Induced Neuronal Cell Death in the Hippocampus Following Status Epilepticus. Int. J. Mol. Sci. 2019, 20, 3588. [Google Scholar] [CrossRef]
- Chen, Z.; Yang, X.; Zhou, Y.; Liang, Z.; Chen, C.; Han, C.; Cao, X.; He, W.; Zhang, K.; Qin, A.; et al. Dehydrocostus Lactone Attenuates the Senescence of Nucleus Pulposus Cells and Ameliorates Intervertebral Disc Degeneration via Inhibition of STING-TBK1/NF-ΚB and MAPK Signaling. Front. Pharmacol. 2021, 12, 641098. [Google Scholar] [CrossRef] [PubMed]
- Hou, X.; Shi, J.; Sun, L.; Song, L.; Zhao, W.; Xiong, X.; Lu, Y. The Involvement of ERK1/2 and P38 MAPK in the Premature Senescence of Melanocytes Induced by H2O2 through a P53-Independent P21 Pathway. J. Dermatol. Sci. 2022, 105, 88–97. [Google Scholar] [CrossRef] [PubMed]
- Wang, Y.; Che, M.; Xin, J.; Zheng, Z.; Li, J.; Zhang, S. The Role of IL-1β and TNF-α in Intervertebral Disc Degeneration. Biomed. Pharmacother. 2020, 131, 110660. [Google Scholar] [CrossRef] [PubMed]
- Huang, Z.; Lan, J.; Gao, X. Feprazone Mitigates IL-1β-Induced Cellular Senescence in Chondrocytes. ACS Omega 2021, 6, 9442–9448. [Google Scholar] [CrossRef]
- Tezze, C.; Romanello, V.; Desbats, M.A.; Fadini, G.P.; Albiero, M.; Favaro, G.; Ciciliot, S.; Soriano, M.E.; Morbidoni, V.; Cerqua, C.; et al. Age-Associated Loss of OPA1 in Muscle Impacts Muscle Mass, Metabolic Homeostasis, Systemic Inflammation, and Epithelial Senescence. Cell Metab. 2017, 25, 1374–1389.e6. [Google Scholar] [CrossRef]
- Barroso, W.A.; Victorino, V.J.; Jeremias, I.C.; Petroni, R.C.; Ariga, S.K.K.; Salles, T.A.; Barbeiro, D.F.; de Lima, T.M.; de Souza, H.P. High-Fat Diet Inhibits PGC-1α Suppressive Effect on NFκB Signaling in Hepatocytes. Eur. J. Nutr. 2018, 57, 1891–1900. [Google Scholar] [CrossRef]
- Xiong, S.; Patrushev, N.; Forouzandeh, F.; Hilenski, L.; Alexander, R.W. PGC-1α Modulates Telomere Function and DNA Damage in Protecting against Aging-Related Chronic Diseases. Cell Rep. 2015, 12, 1391–1399. [Google Scholar] [CrossRef]
- Filadi, R.; Pendin, D.; Pizzo, P. Mitofusin 2: From Functions to Disease. Cell Death Dis. 2018, 9, 330. [Google Scholar] [CrossRef]
- Putti, R.; Sica, R.; Migliaccio, V.; Lionetti, L. Diet Impact on Mitochondrial Bioenergetics and Dynamics. Front. Physiol. 2015, 6, 109. [Google Scholar] [CrossRef]
- Zhang, L.; Gan, X.; He, Y.; Zhu, Z.; Zhu, J.; Yu, H. Drp1-Dependent Mitochondrial Fission Mediates Osteogenic Dysfunction in Inflammation through Elevated Production of Reactive Oxygen Species. PLoS ONE 2017, 12, e0175262. [Google Scholar] [CrossRef]
- Ji, S.; Zheng, Z.; Liu, S.; Ren, G.; Gao, J.; Zhang, Y.; Li, G. Resveratrol Promotes Oxidative Stress to Drive DLC1 Mediated Cellular Senescence in Cancer Cells. Exp. Cell. Res. 2018, 370, 292–302. [Google Scholar] [CrossRef] [PubMed]
- Tyciakova, S.; Valova, V.; Svitkova, B.; Matuskova, M. Overexpression of TNFα Induces Senescence, Autophagy and Mitochondrial Dysfunctions in Melanoma Cells. BMC Cancer 2021, 21, 507. [Google Scholar] [CrossRef] [PubMed]
- Ogrodnik, M.; Salmonowicz, H.; Jurk, D.; Passos, J.F. Expansion and Cell-Cycle Arrest: Common Denominators of Cellular Senescence. Trends Biochem. Sci. 2019, 44, 996–1008. [Google Scholar] [CrossRef] [PubMed]
- Niu, Z.; Zhang, W.; Gu, X.; Zhang, X.; Qi, Y.; Zhang, Y. Mitophagy Inhibits Proliferation by Decreasing Cyclooxygenase-2 (COX-2) in Arsenic Trioxide-Treated HepG2 Cells. Environ. Toxicol. Pharmacol. 2016, 45, 212–221. [Google Scholar] [CrossRef]
- Huang, Y.; Gao, X.; Zhou, X.; Zhang, Y.; Tan, Z.T.; Zhu, S.B. Remote Ischemic Postconditioning Inhibited Mitophagy to Achieve Neuroprotective Effects in the Rat Model of Cardiac Arrest. Neurochem. Res. 2021, 46, 573–583. [Google Scholar] [CrossRef]
- Zhu, Y.; Kuang, L.; Wu, Y.; Deng, H.; She, H.; Zhou, Y.; Zhang, J.; Liu, L.; Li, T. Protective Effects of Inhibition of Mitochondrial Fission on Organ Function After Sepsis. Front. Pharmacol. 2021, 12, 712489. [Google Scholar] [CrossRef]
- Batista, A.F.; Rody, T.; Forny-Germano, L.; Cerdeiro, S.; Bellio, M.; Ferreira, S.T.; Munoz, D.P.; de Felice, F.G. Interleukin-1β Mediates Alterations in Mitochondrial Fusion/Fission Proteins and Memory Impairment Induced by Amyloid-β Oligomers. J. Neuroinflamm. 2021, 18, 54. [Google Scholar] [CrossRef]
- Nair, S.; Sobotka, K.S.; Joshi, P.; Gressens, P.; Fleiss, B.; Thornton, C.; Mallard, C.; Hagberg, H. Lipopolysaccharide-Induced Alteration of Mitochondrial Morphology Induces a Metabolic Shift in Microglia Modulating the Inflammatory Response in Vitro and in Vivo. Glia 2019, 67, 1047–1061. [Google Scholar] [CrossRef]
- Lan, F.; Lin, Y.; Gao, Z.; Cacicedo, J.M.; Weikel, K.; Ido, Y. Activation of LKB1 Rescues 3T3-L1 Adipocytes from Senescence Induced by Sirt1 Knock-down: A Pivotal Role of LKB1 in Cellular Aging. Aging 2020, 12, 18942–18956. [Google Scholar] [CrossRef]
- Pfaffl, M.W. A New Mathematical Model for Relative Quantification in Real-Time RT-PCR. Nucleic. Acids Res. 2001, 29, e45. [Google Scholar] [CrossRef]


Disclaimer/Publisher’s Note: The statements, opinions and data contained in all publications are solely those of the individual author(s) and contributor(s) and not of MDPI and/or the editor(s). MDPI and/or the editor(s) disclaim responsibility for any injury to people or property resulting from any ideas, methods, instructions or products referred to in the content. |
© 2023 by the authors. Licensee MDPI, Basel, Switzerland. This article is an open access article distributed under the terms and conditions of the Creative Commons Attribution (CC BY) license (https://creativecommons.org/licenses/by/4.0/).