Article

Combinatorial Network of Transcriptional and miRNA Regulation in Colorectal Cancer

1
Department of Biotechnology, Jaypee Institute of Information Technology, A-10, Sector 62, Noida 201309, India
2
King Fahd Medical Research Center, King Abdulaziz University, Jeddah 21589, Saudi Arabia
3
Department of Medical Laboratory Sciences, Faculty of Applied Medical Sciences, King Abdulaziz University, Jeddah 21589, Saudi Arabia
4
Molecular Genetics and Enzymology Department, Human Genetics and Genome Research Institute, National Research Centre, Cairo 12622, Egypt
5
Department of General Surgery, Faculty of Medicine, King Abdulaziz University, Jeddah 21589, Saudi Arabia
6
Research and Scientific Studies Unit, College of Nursing and Allied Health Sciences, Jazan University, Jazan 45142, Saudi Arabia
7
Gilbert and Rose-Marie Chagoury School of Medicine, Lebanese American University, Beirut 13-5053, Lebanon
8
Centre of Medical and Bio-Allied Health Sciences Research, Ajman University, Ajman P.O. Box 346, United Arab Emirates
9
King Fahd Medical Research Center, and Yousef Abdullatif Jameel Chair of Prophetic Medicine Application, Faculty of Medicine, King Abdulaziz University, Jeddah 21589, Saudi Arabia
10
Biotechnology Division, National Centre for Disease Control, New Delhi 110054, India
*
Authors to whom correspondence should be addressed.
Int. J. Mol. Sci. 2023, 24(6), 5356; https://doi.org/10.3390/ijms24065356
Submission received: 30 January 2023 / Revised: 2 March 2023 / Accepted: 6 March 2023 / Published: 10 March 2023
(This article belongs to the Special Issue Molecular Advances in Colorectal Cancer)

Abstract

:
Colorectal cancer is one of the leading causes of cancer-associated mortality across the worldwide. One of the major challenges in colorectal cancer is the understanding of the regulatory mechanisms of biological molecules. In this study, we aimed to identify novel key molecules in colorectal cancer by using a computational systems biology approach. We constructed the colorectal protein–protein interaction network which followed hierarchical scale-free nature. We identified TP53, CTNBB1, AKT1, EGFR, HRAS, JUN, RHOA, and EGF as bottleneck-hubs. The HRAS showed the largest interacting strength with functional subnetworks, having strong correlation with protein phosphorylation, kinase activity, signal transduction, and apoptotic processes. Furthermore, we constructed the bottleneck-hubs’ regulatory networks with their transcriptional (transcription factor) and post-transcriptional (miRNAs) regulators, which exhibited the important key regulators. We observed miR-429, miR-622, and miR-133b and transcription factors (EZH2, HDAC1, HDAC4, AR, NFKB1, and KLF4) regulates four bottleneck-hubs (TP53, JUN, AKT1 and EGFR) at the motif level. In future, biochemical investigation of the observed key regulators could provide further understanding about their role in the pathophysiology of colorectal cancer.

1. Introduction

Different types of cancers are the leading causes of death worldwide, and the mortality rate of colorectal cancer (CRC) is the second highest (9.4%) (https://gco.iarc.fr/today/explore) accessed on 1 March 2022. The rate of incidence and mortality of CRC is increasing rapidly with an estimate of 60% by the year 2030 [1]. The cumulative risk rate of death from CRC is 0.65% (in men) and 0.45% (in women). CRC, which results from the gradual accumulation of genetic and epigenetic changes leads to normal colonic mucosa transformation to adenocarcinoma [2]. CRC is caused by mutations in different genes (target oncogene, tumor suppressors, and genes involved in DNA repairing mechanism) which mainly affect the signaling pathways [3]. These related genes lead to uncontrolled cell cycle progression with the inactivation of the apoptosis process [3]. There are three molecular pathway disruptions that lead to CRC pathogenesis: (i) chromosomal instability (CIN), (ii) microsatellite instability (MSI), and (iii) CpG island methylation phenotype [4]. Along with these, types of CRC pathogenesis, mismatch repair (MMR), and translocation have been identified to affect important mechanisms/pathways (WNT, MAPK/PI3K, TP53, and TGF-beta). In addition, the presence of gene mutations (c-MYC, BRAF, KRAS, NRAS, PIK3CA, SMAD4, and P53) and alteration in non-coding RNAs like miRNAs (miRNA-31, miRNA-146, miRNA-147b, and miRNA-1288) can be used as therapeutic markers for patient outcome.
Various high-throughput genomics technologies have been extensively employed to study the involvement of genes and pathways associated with CRC pathogenesis [5]. In the development of drugs, computational methods have been widely utilized to understand disease mechanisms [6,7,8]. The systems biology approach has been used to identify gene network signatures for CRC (TP53, PCNA, and IL8 sub-network (SN)) related to apoptosis, DNA repair, and immune response, respectively [9]. Due to the involvement of multiple genes and pathways, the understanding of CRC pathogenesis is still unclear.
The protein–protein interaction (PPI) networks and gene-regulatory network topological studies provided an understanding of key molecules which control the overall integrity and functionality of neighboring proteins [10], SN [11], and related diseases [12,13]. Network theory has been proposed to play a significant role in understanding the complex regulatory network dynamics. From the different types of networks (scale-free, random, small-world, and hierarchical), the hierarchical network type gained special attention from biologists because hubs (high-degree nodes), SN (clusters of nodes), and self-organization are the important structural units of such networks [14,15]. Previous studies based on network theory approaches identified some central genes in CRC–protein–protein interaction (CRC–PPIN) using some topological parameters such as degree centrality, betweenness centrality, closeness centrality, and stress [16,17,18].
From a list of CRC-related genes, we constructed a CRC–PPI network to identify the key regulatory molecules (hubs, bottlenecks, and bottleneck-hubs), functionality of SN, transcriptional (transcription factors: TFs) and post-transcriptional (micro-RNA: miRNA). We also showed the crosstalk between bottleneck-hubs (Bn-Hs) and SN, which is another level of regulation that helps to maintain the CRC network stability. The PPIN and gene-regulatory network study helps us to understand the systematic regulation of the CRC gene, which followed a complex regulatory mechanism. We also predicted the key regulatory switches in between Bn-H-TFs-miRNAs which could influence the disease CRC.

2. Material and Methods

2.1. Network Statistical Analysis of Colorectal Cancer

The proteins associated with colorectal cancer were retrieved from the KEGG database [19]. The PPI of CRC proteins was retrieved from the STRING database [20]. The topological properties of the CRC–PPIN were characterized by using three topological parameters (degree distribution, clustering coefficient, neighborhood connectivity) and three centrality parameters (betweenness, closeness, eigenvector). We analyzed the constructed network by using Network Analyzer [21], a plugin in Cytoscape v3.8.2.

2.1.1. Degree (k) and Probability of Degree Distribution (P(k))

Degree (k) is a basic characteristic that has an impact on a node’s centrality and is represented by the number of connections of a node to others in the network. The probability of degree distribution (P(k)) is represented by the given equation (Equation (1)).
P ( k ) = N k N
where N k represents the total number of nodes with degree k and N represents a node.

2.1.2. Clustering Coefficient C(k)

Clustering coefficient C(k) defines the strength of internal connections between the node’s neighborhood with the overall organization of the formation of clusters in the network. For a particular node, it is calculated using C ( k i ) = 2 m i / k i ( k i 1 ) , where m i represents the total number of connections with its close neighbors.

2.1.3. Neighborhood Connectivity C N ( k )

Neighborhood connectivity C N ( k ) is the number of neighbors connected with a node, and it defines the correlation pattern of connectivity for the interacting nodes of the network. C N ( k ) can be calculated using Equation (2).
C N   ( k ) = q q P   ( q | k )
where P ( q | k ) is the conditional probability of creating a link from a node with a k degree to another node having a q degree [22].

2.1.4. Betweenness Centrality ( C B ( v ) )

It measures a node occurring several times to bridge along the shortest path between nodes i to j . It is calculated using Equation (3).
C B ( v ) = i , j ; i j k d i j ( ν ) d i j
where d i j ( v ) denotes the number of geodesic paths connecting node i to node j passing through node v. A high betweenness value indicates that the node lies on a path with many other nodes and has the significant ability to propagate information in the network [23].

2.1.5. Closeness Centrality ( C c )

It is defined in terms of ‘shortest path lengths’ among the pair of nodes in a network. It can be calculated in terms of farness and is given using Equation (4).
C C   ( k ) = N j d i j  
where d i j is the geodesic distance between the pair of nodes i and j, and N is the nodes present in the network.

2.1.6. Eigenvector Centrality ( C E )

It is proportional to the total sum of the centrality of all neighborhood nodes. It describes the effect of a node on signal processing. It is calculated using Equation (5).
C E   ( i ) = 1 λ j = n n ( i ) v j  
where nn(i) represents the nearest neighbor of the i node in the network, with eigenvalue λ and eigenvector v i of the eigenvalue equations, A v i = λ v i where A is the network adjacency matrix.

2.2. Tracing of Bottleneck-Hubs

In a CRC–PPIN, the nodes with a high degree were considered as hubs [24,25,26,27] and high betweenness centrality (BC) value nodes as bottlenecks (Bn). Here, we filtered the nodes based on high degree and betweenness, which were called bottleneck-hubs (Bn-Hs). Bn-Hs play an important role in information flow and controlling capability in the network [28]. We selected the top 10 with the highest degree (k) and BC nodes from the constructed network. From the top 10 nodes in each category, we considered overlapped nodes as bottleneck-hubs for further analysis.

2.3. Detection of Subnetwork and Key Mediator Bottleneck-Hub

In our analysis, we used Molecular Complex Detection (MCODE) v2.0.0 [29] to identify the nodes that are highly interconnected in the form of SN. To separate the dense areas according to provided parameters, the approach uses vertex weighting by local neighborhood density and outward traversal from a locally dense seed protein. We used the default parameters of MCODE, a node score cutoff (0.2), haircut, node density cutoff (0.1), K-score (2), and maximum depth (100). The interaction between the Bn-Hs and the subnetworks was identified using Cytoscape v3.8.2. In this, study we focused on identifying the functional dependency between the Bn-Hs and SNs. Here, we calculated the interacting strength of each Bn-H with the highest scoring SN, which may provide the internal stability of PPIN. The Bn-H could be the most influencing node and become a vital means for communication between its interacting SNs, which may result in a more accurate understanding of the biological functions [30].

2.4. Functional Analysis of Subnetworks

We performed Gene Ontology (GO) for nodes forming the SNs using the g:Profiler package [31] to relate their biological significance. The g:Profiler tool executes the statistical enrichment analysis to predict the over-representation of information from GO terms such as molecular function (MF), biological processes (BP), cellular component (CC), PPI, biological pathways, and gene–disease association. In our study, we included GO terms (BP, MF, CC) for identified SN. We used the default parameters, such as the domain size set to “only annotated”, default g:SCS method (for multiple testing correction of p-values), p-value (0.05), and numeric IDs as prefix ENTERZGENE_ACC. We represented the GO enrichment analysis results of SNs in the form of a Manhattan plot.

2.5. Pathway Analysis of Bn-Hs

We conducted the GO enrichment analysis to expound the potential pathways of Bn-Hs involved in CRC. We performed the analysis of eight Bn-Hs (TP53, CTNBB1, AKT1, EGFR, HRAS, JUN, RHOA, and EGF) using the Enricher tool (https://maayanlab.cloud/Enrichr/#), accessed on 1 March 2023, containing 210 gene set libraries [32]. The results were sorted based on the p-value. We selected the top 10 highly enriched pathways and showed their odds ratio and combined score in the form of a table.

2.6. Construction of a Bn-H Regulatory Network

The combinatorial network of CRC included transcriptional and post-transcriptional regulatory molecules’ TFs and miRNAs, respectively. To identify the miRNA targets of Bn-Hs, we used two computational-based miRNA target prediction tools (TargetScan v8.0 and miRDB V6.0) [33,34] and one experimental validated database (miRTarbase) [35]. We considered the miRNA which was predicted by all three databases. Further, to identify the relation between miRNA-TFs, and TFs-Bn-H, we used the TransmiR v2.0 and TRRUST databases, respectively [36,37]. The regulatory function of TFs with Bn-H and miRNAs is categorized as (i) activators and (ii) repressors. Finally, we constructed the combinatorial regulatory network for Bn-H of colorectal cancer with TFs and miRNAs and visualized using Cytoscape v3.8.2 [38].

Coherent and Incoherent Feed-Forward Loops

Various types of topological motifs are found in large-scale biological networks, which are formed by a great variety of interactions between biological molecules. It is interesting to understand the dynamic behavior of CRC gene regulatory networks at the transcriptional and post-transcriptional level and to understand the importance of significant recurring wiring, known as the “network motif” [39,40,41]. The pattern of network motifs, such as the feed-forward loop associated with Bn-Hs, is termed as “coherent”, meaning the symbol of the regulation path (from TF to Bn-H) is similar to the overall sign of the indirect regulatory path (from TF through miRNA to the gene) [40,42]. If the sign of the directed and in-directed regulation were opposite, the network motif is considered as an incoherent type [40]. Both of these coherent and incoherent FFL motif behaviors were signed sensitive, and they selectively responded to stimulus steps in two ways—either more quickly or more slowly, depending on the sign [30,40].

3. Results

3.1. Hierarchal Scale-Free CRC-PPIN Topology

We extracted 86 colorectal cancer-related proteins from the KEGG database which to further fetch the interacting partners in the STRING database. The constructed CRC–PPIN consists of 6556 nodes and 32,048 edges (Figure 1A). The statistical analysis of the topological parameters’ degree and BC of all 6556 nodes is given in (Supplementary Table S1). The statistical parameters of the CRC–PPIN followed power-scaling behavior against k. In overall analysis, (P(k)) obeys power law distribution P   ( k ) ~   k γ with a value of exponent γ = 0.38   ± 1.33   (Figure 1B), where the regression line fitted with the curve to the data point with P   ( k ) ~   k 1.33 , with correlation coefficient (r) 0.92 fitted with the data. The value γ   ( 1.33 ) provides hierarchical scale-free behavior to the network. The clustering coefficient C(k) also followed the power law scale as a function of degree C ( k ) k α with a negative exponent value of ( α = 2.09 ± 0.41 ) , which showed that the CRC–PPIN follows a hierarchical nature. The straight line fitted curve with C ( k ) k 0.41 results from a coefficient value ( r = 0.86 ) correlated to the data set (Figure 1C). The neighbourhood connectivity C N ( k ) showed a negative exponent value (β = 1355.22 ± 0.34 ) given using the power-law fitting model C N ( k ) ~ k β . The fitted curve line with C N ( k ) ~ k 0.34 gives the correlation coefficient ( r = 0.83 ) (Figure 1D). The network showed a disassortative nature due to the calculated negative value of β 0 , the exponent of connectivity parameter, and reflects that the Bn-Hs are still a significant part of regulating the stability of the network. To recognize the importance of the Bn-H nodes’ strength in signal processing in a network, we used three topological centrality parameters, such as closeness centrality ( C c ) , betweenness centrality ( C B ) and eigenvector ( C E ) . In the CRC–PPIN, these parameters followed power law against degree (K) and showed positive exponents values, indicating the strong regulating behavior of the leading Bn-H. The calculated values of exponents and correlation coefficients (r) are C B ( ε = 1.60 , r = 0.96 ) , C c ( η = 0.76 , r = 0.81 ,   C E ( δ = 0.59 ,   r = 0.94 ) ,   respectively (Figure 1E–G). The graph of betweenness against degree showed that high-connecting nodes have more controlling strength to outspread signals throughout the network. Our network followed a hierarchical scale-free nature and means that the network has a modular structure and system level of organization.

3.2. Central Bottleneck-Hubs

The Bn-Hs are the most influencing proteins and provide stability and control of the flow of information in the network. In the CRC–PPIN, we found the top 10 nodes as hubs (TP53, AKT1, CTNNB1, EGFR, HRAS, JUN, MAPK3, RHOA, EGF, and KRAS) and the top 10 nodes as bottlenecks (TP53, CTNNB1, AKT1, EGFR, CYCS, RHOA, JUN, HRAS, EGF, and FOS). Eight nodes (TP53, AKTI, CTNNB1, EGFR, HRAS, JUN, RHOA, and EGF) are common in both the parameters (K and BC) and were considered as Bn-Hs (Table 1). Node TP53 showed the highest degree (1817) and BC (0.19876) in the CRC–PPIN. The Bn-H proteins function as the backbone of the network and have a great influence on information flow with more control over the network (Figure 1A). Mutations in such potential regulators (Bn-Hs), as well as deregulation of their expression, could alter protein interactions, influencing multiprotein complex formations and signaling pathways, disrupting system dynamics and resulting in tumor development in CRC and other associated diseases.

3.3. Subnetworks and Their Cross-Talk with Bottleneck-Hub

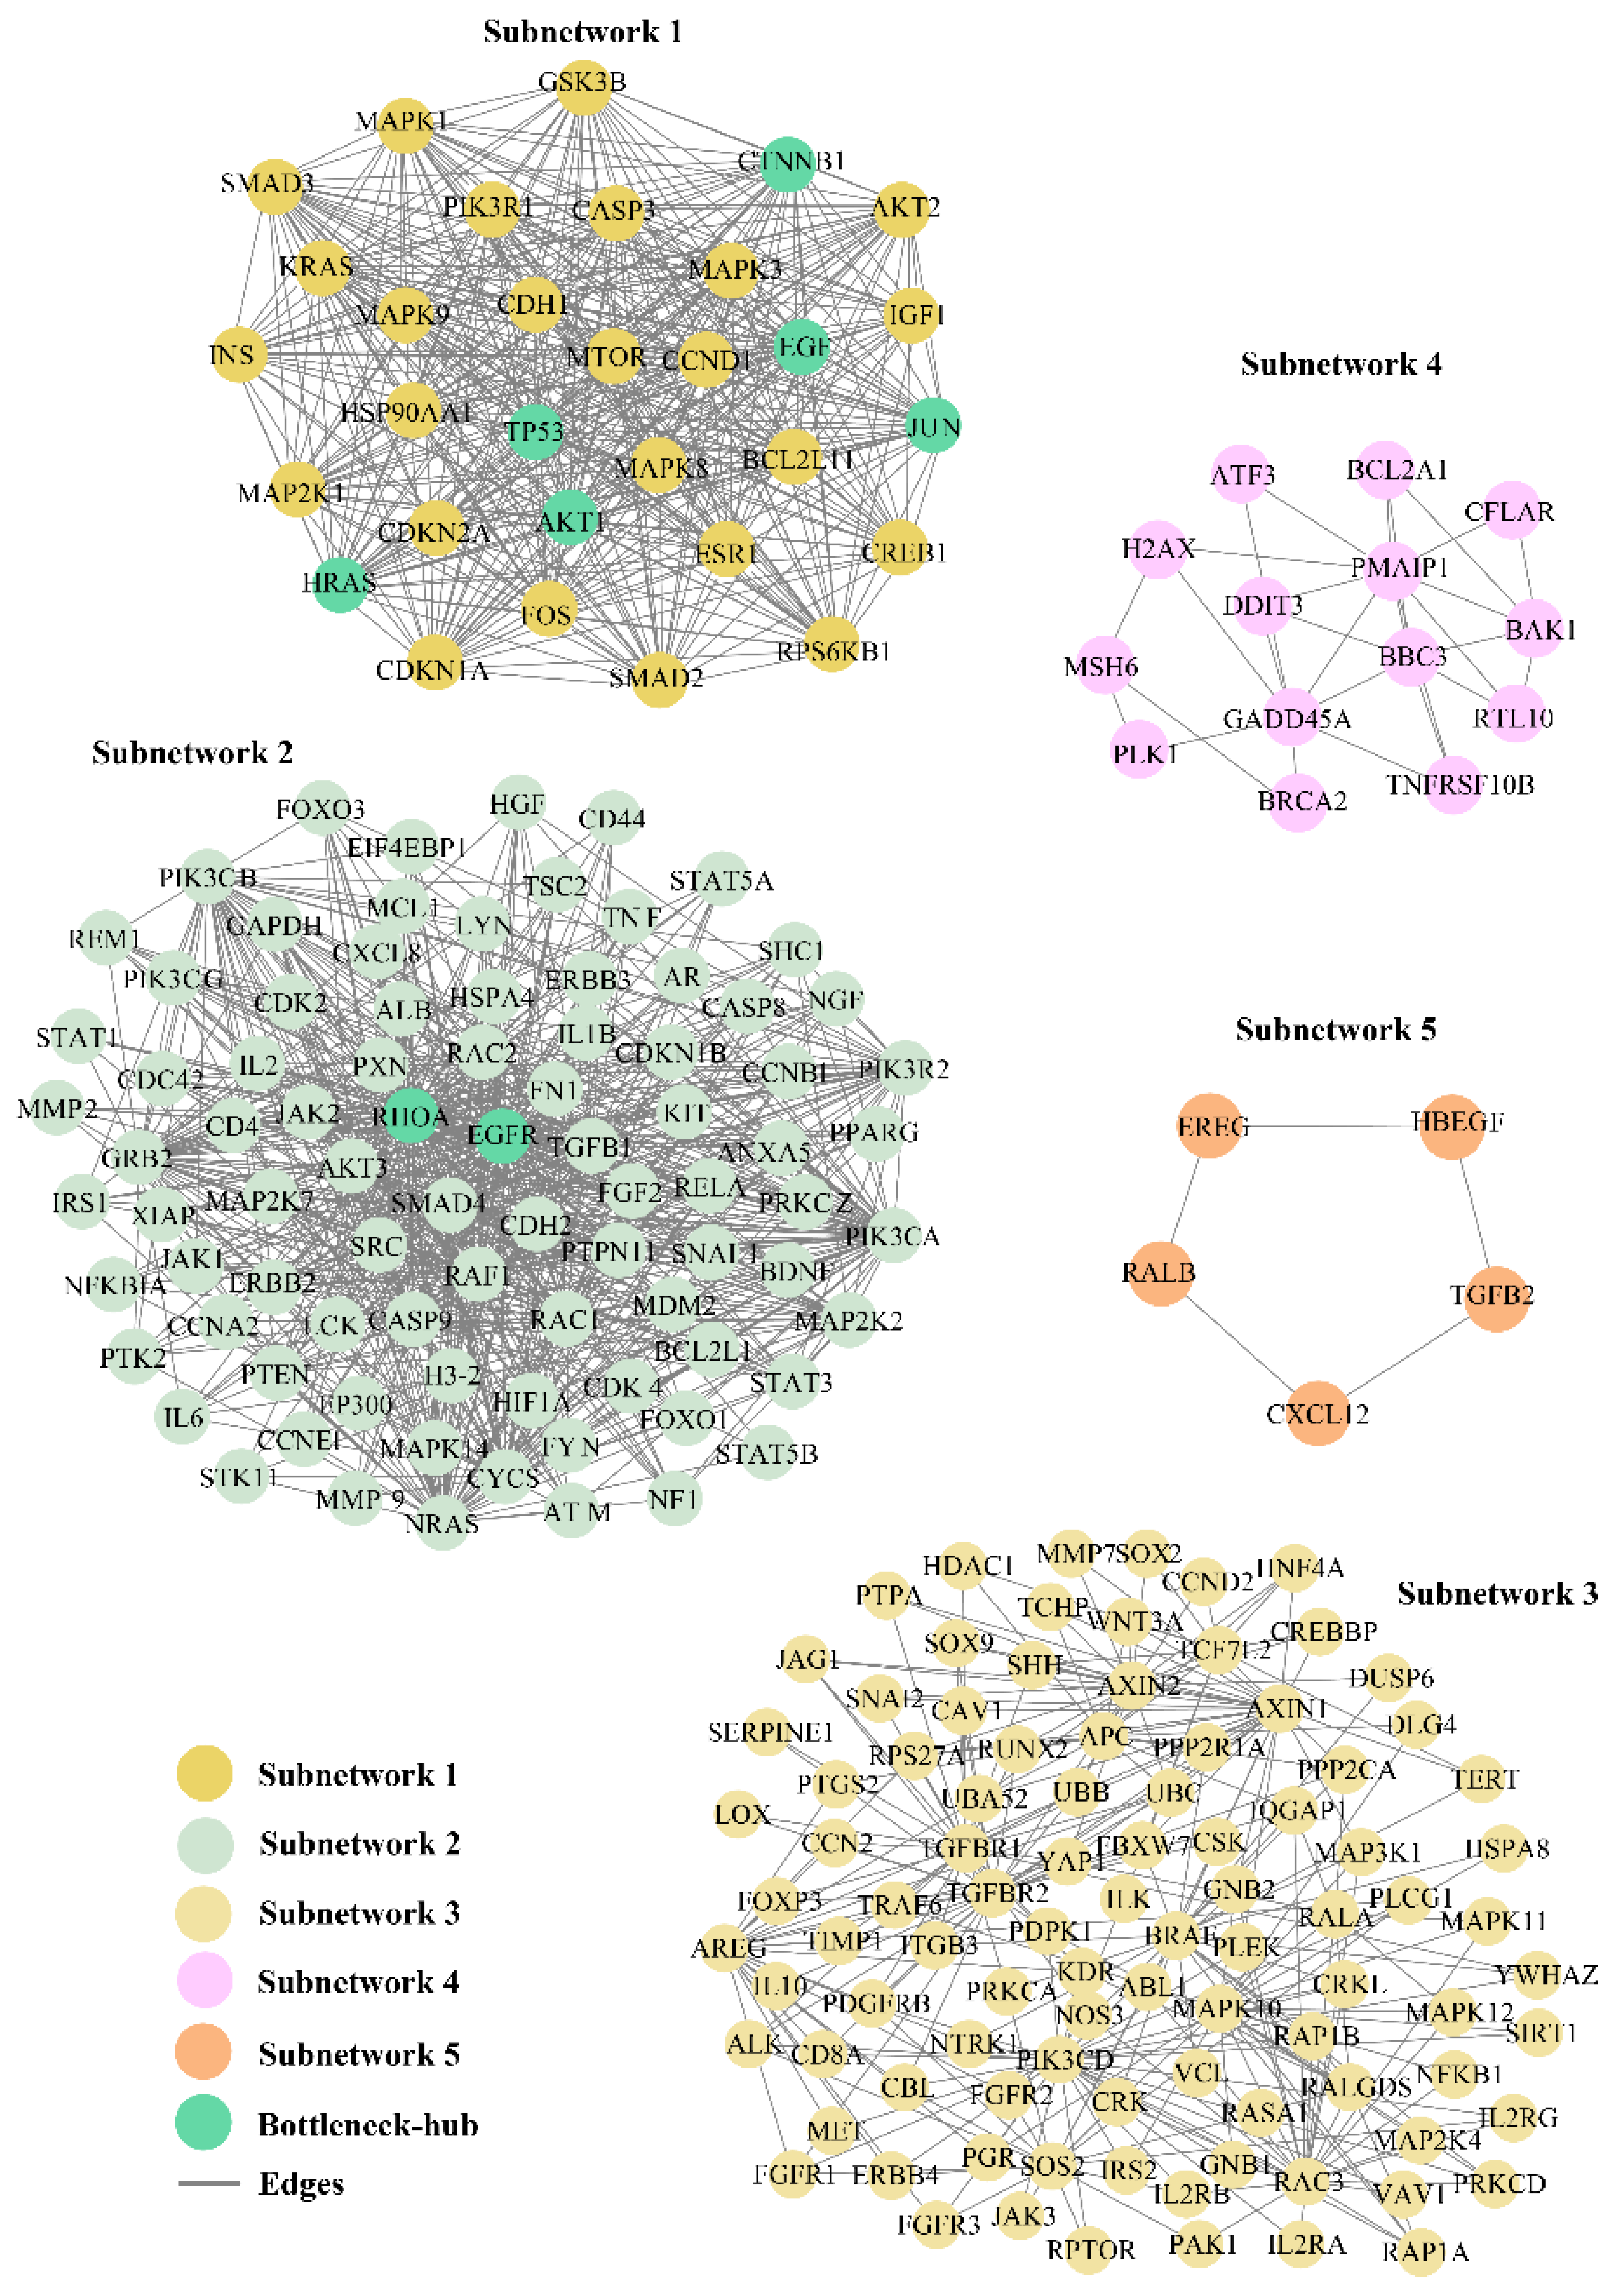
In the CRC–PPIN, we identified the five SNs that are highly interconnected clusters of nodes representing corresponding stable units that function as a single entity in the network (Figure 2). The SN-1 had 31 nodes and 422 edges with the highest M-scoring value (28.13). The second, third, fourth, and fifth SNs consisted of 86, 95, 14, and 5 nodes, respectively, with the corresponding edges of 681, 284, 28, and 5 (Figure 3). These SNs have a system-level organization that was maintained by connecting with other nodes and provided overall functionality to the network [43]. We found six (TP53, AKT1, CTNBB1, HRAS, JUN, and EGF) and two Bn-Hs (EGFR and RHOA) present in SN-1 and 2, respectively, which not only controls the internal regulation of their SN but also influences other subnetworks by interacting with different nodes. SNs 3, 4, and 5 showed the absence of Bn-Hs, suggesting that Bn-Hs are indirectly connected with the modular function of these three SNs (Figure 2). Crosstalk between the SNs may be possible due to the interaction with common Bn-Hs, and the removal of such regulators can affect the functionality of SNs and lead to the distortion of the network.
Based on the crosstalk between Bn-Hs and SNs, we found HRAS showed the highest strength of interaction (216) with all five SNs, followed by TP53, EGFR, JUN, AKT1, CTNNB1, EGF, and RHOA (Figure 3 and Table 2). Three Bn-Hs (HRAS, TP53, and JUN) showed more connections (30 nodes each) in SN-1, and also HRAS, TP53, and JUN showed the highest connection in SN-2 (85, 83, and 83), respectively, in comparison with other Bn-Hs. (Figure 3 and Table 2). Both HRAS and TP53 also showed high control of the SN-3 and SN-4 with an interaction strength of 92 and 14, respectively. Surprisingly, HRAS also showed interactions with 5 Bn-Hs (TP53, AKT1, CTNBB1, JUN, and EGF in SN-1) and two Bn-Hs (EGFR and RHOA in SN-2) in the CRC–PPIN. The SN-5 is highly controlled by EGFR, AKT1, and RHOA with interaction strength (5).
SN-2, 3, and 4 are least controlled by EGF and RHOA, whereas in SN-5, RHOA has the highest number of interacting strengths (5) (Table 2). The Bn-Hs TP53 and AKT1 showed high connections with SN-4 and 5, with an interaction strength of 14 and 5 nodes, respectively. In the overall result from the analysis of the Bn-H and SN interaction, we found HRAS, JUN, TP53, EGFR, and AKT1 are the significant Bn-Hs present in the CRC–PPIN. We also found among all eight Bn-Hs that HRAS not only controls the other five Bn-Hs (TP53, AKT1, CTNBB1, JUN, and EGF), but that it is also performing their important role in SN-1.

3.4. Gene Ontology (GO) Analysis of Subnetworks

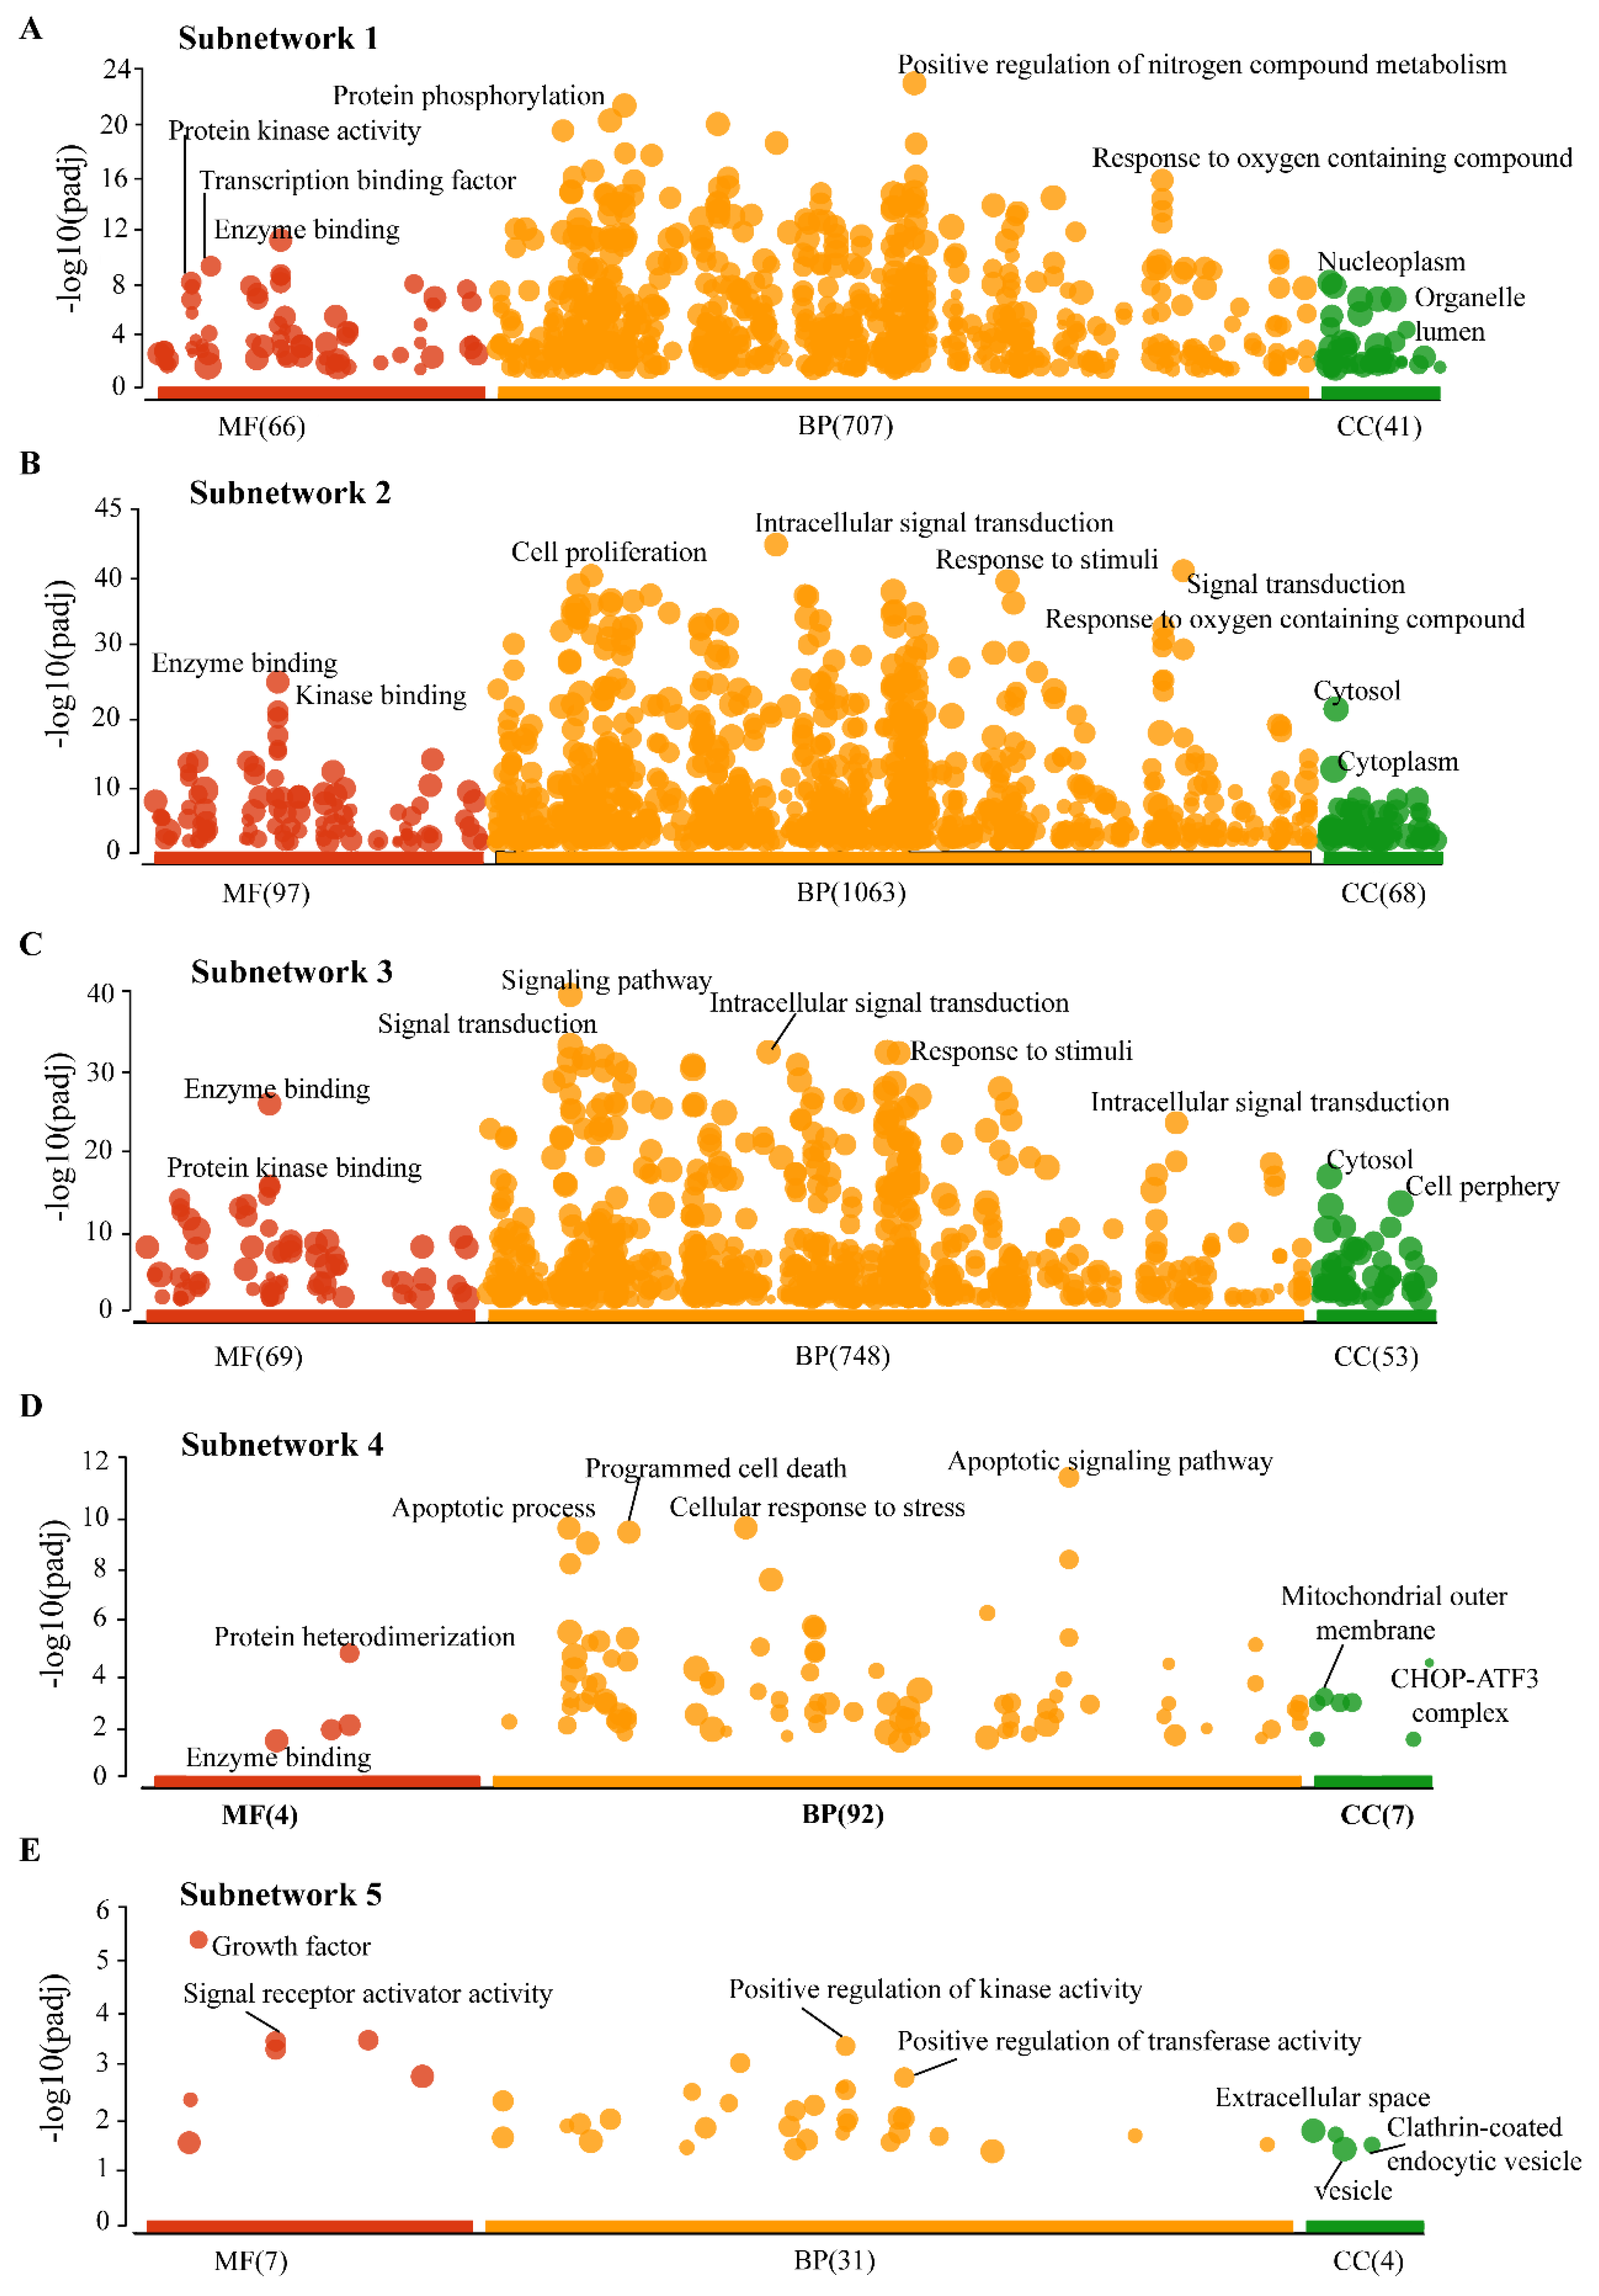
We performed the GO for all five SNs to understand their functional importance in the CRC–PPIN. SN-1 was functionally enriched with proteins that have protein phosphorylation, protein kinase activity, and transcription binding and that are related to biological processes such as the positive regulation of nitrogen compound metabolism and also a response to oxygen-containing compounds. SN-1 and associated proteins were found to be localized in the nucleoplasm and organelle lumen (Figure 4A). SN-2 and 3 were found to have similar functions, such as enzyme and kinase binding-like activity, and its proteins found to be biologically involved in cell proliferation, signal transduction, responses to stimuli, and intracellular signal transduction activity in the cytoplasm (Figure 4B,C). SN-4, the proteins’ molecular function enriched with protein hetero-dimerization, enzyme binding, and their biological processes were found to be like apoptotic processes and cellular stress responses. The SN-4 proteins are mainly located in the mitochondrial outer membrane and CHOP–ATF3 complex (Figure 4D). Associated proteins with SN-5 were mainly presented in extracellular space, the clathrin-coated endocytic vesicle to perform molecular functions (growth factor, signal receptor activity), and biological processes such as the positive regulation of kinase and transferase activity (Figure 4E). We also observed that 8 Bn-Hs presents in SN-1 and 2 were functionally enriched with protein phosphorylation, kinase activity, signal transduction, and apoptotic processes, suggesting their significance in their own SNs.

3.5. Highly Enriched Pathway Associated with Bn-Hs

From the pathway enrichment analysis, we identified that eight Bn-Hs (TP53, AKTI, CTNNB1, EGFR, HRAS, JUN, RHOA, and EGF) were mostly associated with signaling by ERBB2, non-receptor tyrosine kinases, and the ESR-mediated, extra-nuclear estrogen signaling pathways shown in (Table 3). Previous studies reported that gene mutations pinpointed in EGFR/MAPK, Notch, PI3K, TGF-β, and Wnt signaling pathways showed dysregulation in CRC [44]. So, understanding the relationships between these pathways and Bn-Hs may promote the development of new therapeutic or preventive CRC approaches.

3.6. Combinatorial Regulatory Network of Bottleneck-Hubs

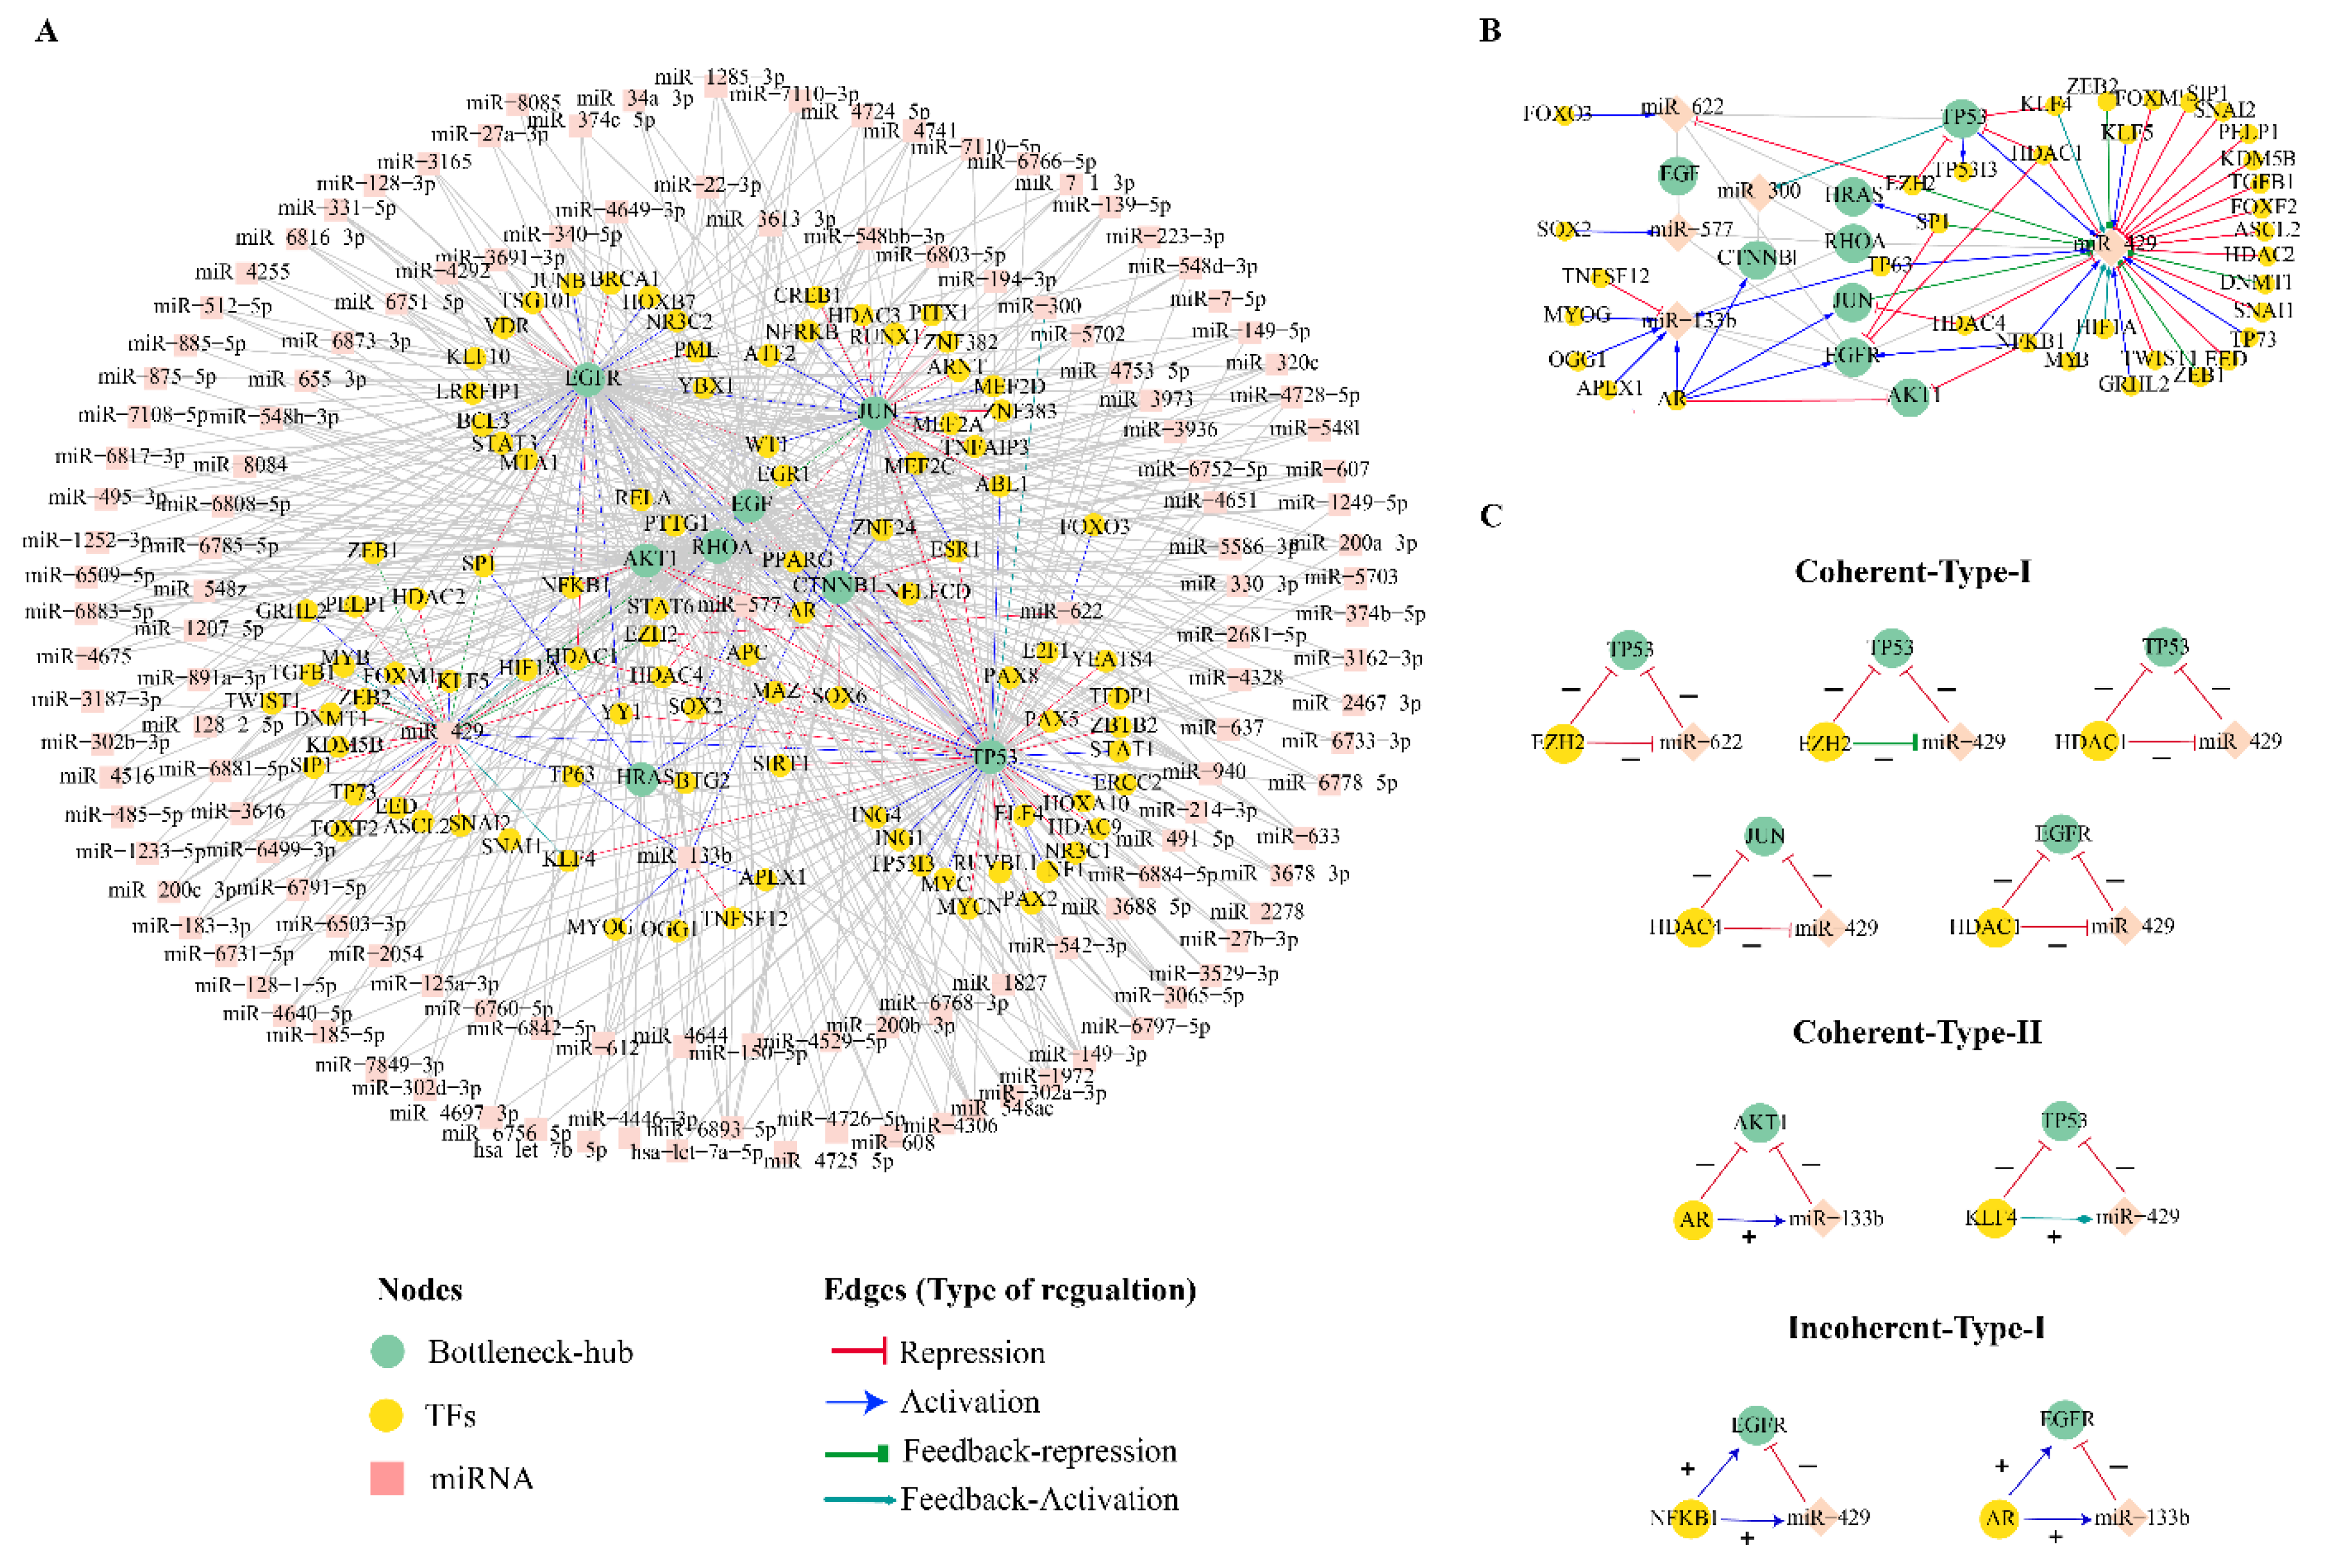
The miRNA-target prediction tools, miRDB V6.0 and TargetScan v8.0, predicted 626 and 2239 miRNAs target Bn-Hs, respectively. The experimentally validated mirTarbase database showed that 393 miRNAs target Bn-Hs. All these three programs depicted 135 common miRNA target Bn-Hs, which were further used to identify TFs using the TransmiR database. Out of these 135 miRNAs, seven miRNAs (miR-6893-5p, miR-940, and miR-6808-5p, miR-6785-5p, miR-6883-5p, miR-149-3p and miR-4728-5p) target six Bn-Hs (AKT1, EGF, EGFR, JUN, RHOA, and TP53 (Figure 5A).
We found only 36 TFs regulate 5 miRNAs (miR-622, miR-300, miR-577, miR-133b, and miR-429) out of 135 miRNAs using the TransmiR database. The miR-429 is highly regulated by the large number of TFs. We also retrieved 68 TF targets for 8 Bn-Hs and observed miR-429 is also post-transcriptionally regulated by two Bn-Hs, TP53 and JUN (Figure 5B). The Bn-H regulatory network represented the relation between the Bn-Hs, TFs, and miRNAs shown in Figure 5A. The constructed Bn-Hs regulatory network consisted of 239 nodes and 596 edges (Figure 5A). From the analysis of the regulatory network, we extracted the regulatory relation between TFs and miRNA which were commonly regulating Bn-Hs. A few TFs (EZH2, HDAC1, AR) were found to regulate more than one Bn-H. Among all the Bn-Hs, TP53 has the largest number of regulating targets (miRNAs:77 and TFs:37). The TFs (EZH2, KLF4, and HDAC1) directly repressed the transcription process of TP53 (Figure 5B,C). Transcription factors AR and NFKB1 both activated the EGFR, but AR also repressed the transcription process of AKT1. Furthermore, Bn-H and JUN were directly inhibited by HDAC4 in the process of transcription (Figure 5B,C).
By the analogy of Bn-H, TP53 and JUN also function as TF-targeting miR-429. TP53 activates miR-429, whereas JUN showed a feedback repression mechanism against miR-429. TP53, post-transcriptionally was repressed by two miRNAs (miR-622 and miR-429) and EGFR was commonly repressed by miR-133b and miR-429. The miRNA miR-133b also represses the transcription process of AKT1 (Figure 5B). The miRNA (miR-429) transcription is regulated by the feedback activation process by TF (KLF4).

3.7. Coherent and Incoherent Type Feed-forward Loops in the CRC Bn-H Regulatory Network

The Bn-H regulatory network of CRC consisted of a few network motifs as coherent (type I and II) and in-oherent types of the feed-forward loop (FFL) in-between TF:miRNAs and Bn-Hs. Incoherent type-I, the resultant regulation of the indirect path from TF to Bn-H (TP53, JUN, EGFR), was observed as a negative inhibition (EZH2:miR-622:TP53, EZH2:miR-429:TP53, HDAC1:miR-429:TP53, HDAC4:miR-429:JUN, and HDAC1:miR-429:EGFR) (Figure 5C). In the case of coherent type-II FFL, both TP53 and AKT1 were positively inhibited in indirect regulation by TFs (AR:miR-133b: AKT1, and KLF4:miR-429:TP53). In FFL incoherent type-I, TFs NFKB1 and AR both activated the miRNAs (miR-429 and miR-133b), respectively, but these two miRNAs further repressed the Bn-H EGFR, so the net result of the effect of the indirect path from TF to gene is repression (Figure 5C).

4. Discussion

The term “targeted cancer therapies” refers to a new class of anti-cancer medications developed to block particular molecular targets thought to be essential for tumor development or progression [45]. The efficacy of targeted cancer therapies depends on the molecules selected as drug targets. It is important to provide a new therapeutic target for different types of cancers in order to have a much greater understanding of the mechanisms of the disease that contribute to the cell death that leads to CRC. To study these processes, researchers are modeling other elements of CRC, in a range of model organisms, directed by recent insights into its genetic and molecular basis. Animal models or cell cultures that are indicative of a carcinogenic condition in humans may be employed in studies related to the growth, treatment, and prevention of CRC malignancies. There are mainly three molecular pathway disruptions that lead to CRC pathogenesis: chromosomal instability (CIN), microsatellite instability (MSI) of the CpG island methylation phenotype, and mismatch repair (MMR); translocation has been identified to affect important mechanisms/pathways (WNT, MAPK/PI3K, TP53, and TGF-beta). Animal models are important for studies of the development and pathogenesis of colorectal tumors, as well as for the evaluation of possible risk factors, preventive agents, and treatments. Current studies revealed that chemotherapy and anti-epidermal growth factor receptor therapy are recommended for microsatellite stability or proficient mismatch repair left-sided treatment [46].
Here, we applied a computational systems biology approach which is less-time consuming, more cost effective, and coincides with the growing demand for developing targeted therapeutics. It could be used to predict the CRC target regulators and their robustness in maintaining self-organized behavior, as well as unravel the challenges of signaling involved in the basic processes of cellular death, survival, and developing strategies to stimulate cancer cells.
We constructed and analyzed the CRC–PPIN and identified the Bn-Hs. Further, the regulatory network (TF and miRNA) targets of the identified Bn-Hs were constructed. The statistical results of the CRC–PPIN revealed the hierarchical scale-free nature of the network. Overlapped nodes in between the top 10 highest K and BC were considered as Bn-Hs (TP53, CTNBB1, AKT1, EGFR, HRAS, JUN, RHOA, and EGF) in the CRC–PPIN (Figure 1A). The Bn-Hs are the most influencing proteins and provide stability and control of the flow of information in the network. The network showed a disassortative nature due to the calculated negative value of β 0 ; the exponent means that the Bn-H is still a significant part of regulating the stability of the network. Based on Bn-H and SN interactions, we found among the Bn-Hs that HRAS showed the highest strength of interaction (216 edges) with all five SNs, indicating it as the key mediator of the subnetworks (Figure 3). In SN-1, functionally related to protein phosphorylation, protein kinase activity and transcription binding, HRAS controls the function of SN-1 with five other Bn-Hs (TP53, AKT1, CTNBB1, JUN, and EGF). The relationship between Bn-H and SN interactions was involved in the regulation of the CRC–PPIN. The network’s crosstalk for these key proteins (Bn-Hs) as well as functional SNs is likely an attempt to maintain structural aspects of the network that facilitate disease biology.
The eight Bn-Hs (TP53, AKTI, CTNNB1, EGFR, HRAS, JUN, RHOA, and EGF) identified using computations were already known for the CRC and validated by many previously studied experimental evidence. To check their association with other types of cancers, we used the versatile platform “disgenet2r”, an R package, and the literature [47]. We found Bn-Hs associated with CRC were also related to other types of cancers such as liver carcinoma, osteosarcoma, breast cancer, pancreatic cancer, lung cancer, ovarian neoplasm, brain neoplasms, and oesophageal neoplasm [47,48,49]. In CRC, the TP53 gene is mutated in 43% of tumors, and the remaining tumors often have compromised p53 functioning due to changes in regulatory mechanisms [50]. The gain of function and loss of function activities of mutated TP53 is linked to cell proliferation, metastasis, and invasion that is further associated with CRC progression and other types of cancers [50,51,52]. Interactions of p53 with other transcription factors can enhance or repress their activity. Interaction of mutant p53 with the STAT3 was associated with STAT3 phosphorylation, JAK2/STAT3 signaling process, and CRC cells proliferation [53]. Additionally, mutant p53 also interacts with another transcription SP1; this PPI has been shown to regulate cell migration, metastasis, angiogenesis, and chemoresistance [54]. p53 knockout animals with tumor-inducer AOM was efficient in inducing carcinogenesis in the colon of the animals [55,56]. One of the major causes of CRC pathogenesis is the activation and deregulation of the AKT/mTOR signaling pathway. Dysregulation in the AKT1 gene, such as mutations, altered the function and/or its protein expression, thus modifying the response and sensitivity to cancers. The mutations altered the function of AKT1 observed in various forms of human malignancies, such as breast, lung, bladder [57], and digestive tract malignancies [58,59,60]. AKT1 protein plays an important role in the development of cancer therapies. CTNNB1 is altered in 3.10% of all cancers, with lung, colon, prostate, and hepatocellular carcinomas having the highest rate of prevalence [61]. The majority of catenin mutations in colorectal cancer are homozygous [62]. CTNNB1 functions as a coactivator downstream of the oncogenic Wnt signaling pathway, and mutations in this gene have been associated with oncogenesis in CRC [63,64,65]. HRAS is a GTP-binding protein that plays an important role in many cellular networks that control a variety of signaling pathways, such as growth regulation, proliferation, survival, differentiation, adhesion, and cell survival, all of which lead to many types of cancers on their disruption [66]. HRAS protein is majorly involved in the MAP-kinase signaling pathway [67]. HRAS is altered in 0.94% of all cancers such as bladder urothelial carcinoma, breast, lung, prostate, and colon adenocarcinoma [61]. K-rasv12 mutation alone is not capable of inducing tumorigenesis, but once it is associated with mutations in repair genes, such as the MSH2 gene, it promotes and accelerates tumor development [68,69]. JUN is a proto-oncogene also known as p39 involved in the regulation of gene expression. The JUN family gene c-Jun and its increased expression have been reported in human colorectal tumors [70]. In many cell types, c-Jun is found to function as a proliferation-promoting gene, and its activation is required for cell cycle progression and neoplastic transformation [71,72]. JUN is altered in 0.87% of all cancers due to missense, nonsense mutations, silent and frameshift insertions, and deletions are observed in cancers such as intestinal cancer, lung cancer, and skin cancer [61]. Downregulation of AP-1 gene expression is an initial event in the oridonin-mediated inhibition of colorectal cancer, as shown in studies in vitro and in vivo [73]. RHOA is a member of the small GTPase family of proteins that regulates a cell signaling pathway that connects plasma membrane receptors to the formation of focal adhesions and actin stress fibers. It has been linked to a variety of critical cancer-related processes in mammalian cells, including proliferation, migration, and survival [74]. RHOA expression in tumor samples is higher than in normal tissues [75]. EGFR is a gene that encodes for the epidermal growth factor receptor protein. EGFR is mainly associated with receptor tyrosine kinase/growth factor signaling [76]. Activating EGFR mutations enhances EGFR kinase activity, resulting in increased activation of downstream pro-survival signaling pathways [77]. It is commonly mutated and/or overexpressed in various types of human cancers and is the center of many cancer therapies currently used in clinical practice [78]. The higher degree nodes of the CRC PPI network corresponded to the majority of the Bn-Hs and essential genes, indicating their important role in the maintenance of the system and ultimately the survival of CRC cells. Mutations in two or more genes are often associated with tumor malignancy [79]. Loss of such important Bn-H from the CRC network may change the interaction pattern of proteins and can lead to the disintegration of the functional/pathway modules rendering the CRC cells weaker.
Regulatory network and understanding its topological properties help in clarifying the functional role of target-associated transcription factors and miRNAs, which could provide novel therapeutic targets, e.g., gene-regulated analysis based on gene expression data that revealed potential candidate genes for squamous lung cancer [80]. Various bioinformatic integrative analyses identified candidate target genes, miRNA, and TF as signatures in prostate cancer [28]. We integrated multi-omics analysis to evaluate transcriptome patterns to decode the system-level molecular signatures of the protein (Bn-Hs, TFs) and RNA levels (miRNAs). The results suggested that Bn-H was positively and negatively activated or repressed by a number of common TFs and miRNAs at the transcriptional and post-transcriptional level, respectively. The coherent and incoherent types of FFLs indicated the key targets (TP53, JUN, EGFR, and AKT1) and their mode of regulation by TFs and miRNAs. In the analysis of three node motifs, miR-429 was critical for CRC regulation and post-transcriptionally regulated Bn-Hs (TP53 and EGFR, and JUN), and it is largely targeted by a number of TFs. KLF4 transcription factor directly represses the p53 transcription element in human breast cancer cells and lead to p53 apoptosis [81]. Overexpression of SIRT1 promotes HG-attenuated corneal epithelial wound healing via p53 regulation [82]. The repression of the transcriptional activity of the AR by PTEN is likely to involve the downregulation of AKT1 [83]. HDAC4 individually upregulate JUN promoter activity [84]. AR is the transcription factor known to be involved in CRC and it is regulating the transcription process as activator for three Bn-Hs (AKT1, CTNNB1, and JUN) [83,85,86,87]. The connection between the Bn-H, TFs, and miRNAs was found to be important for regulation, which controlled the overall network topology.

5. Conclusions

A computational systems biology approach could be used to predict CRC target regulators (Gene/TF/miRNA) and their robustness in maintaining self-organized behavior, as well as to unravel the challenges of signaling involved in the basic processes of cellular death, survival and to develop strategies to stimulate cancer cells. Network biology approaches such as the feed-forward loop (FFL) are effective for investigating the underlying global topological structures of molecular networks. We observed miR-429, miR-622, and miR-133b, and that transcription factors (EZH2, HDAC1, HDAC4, AR, NFKB1, and KLF4) regulate four bottleneck-hubs (TP53, JUN, AKT1, and EGFR) at the motif level. Our results indicated some insightful data as well as a few miRNA and TF candidates, as well as their regulation, for future experimental validation in CRC. The CRC-specific gene-miRNA-TF regulatory network will help to understand the complicated CRC regulatory processes and guide clinical treatment.

Supplementary Materials

The following supporting information can be downloaded at: https://www.mdpi.com/article/10.3390/ijms24065356/s1.

Author Contributions

R.K.: Conceptualization; data curation; methodology; investigation; formal analysis; writing—original draft. M.M.M.: writing—review and editing; funding acquisition. H.M.T.: writing—review and editing; funding acquisition. S.H. (Shafiul Haque): writing—review and editing; funding acquisition. S.H. (Steve Harakeh): writing—review and editing; funding acquisition. K.P.: conceptualization; writing—review editing; supervision. S.H. (Shazia Haider): conceptualization; writing—review and editing; supervision; funding acquisition. All authors have read and agreed to the published version of the manuscript.

Funding

This research work was funded by the Institutional Fund Projects under grant no. (IFPIP: 1829-141-1443).

Institutional Review Board Statement

Not applicable.

Informed Consent Statement

Not applicable.

Data Availability Statement

All the data is available with the authors and shall be provided upon request.

Acknowledgments

This research work was funded by the Institutional Fund Projects under grant no. (IFPIP: 1829-141-1443). Therefore, authors gratefully acknowledge technical and financial support provided by the Ministry of Education and King Abdulaziz University, Deanship of Scientific Research (DSR), Jeddah, Saudi Arabia. Rupesh Kumar is grateful to Council for Scientific and Industrial Research for the award of Senior Research Fellowship. The authors, Rupesh Kumar and Shazia Haider sincerely thank Jaypee Institute of Information Technology, Noida, Sec-62, Uttar Pradesh, India for providing infrastructural support for this study.

Conflicts of Interest

The authors declare no conflict of interest.

Abbreviations

AR (Androgen receptor), AKT1 (AKT serine/threonine kinase 1), Bn-H (Bottleneck-hubs), BP (Biological Process), CC (Cellular component), CRC (Colorectal cancer), CRC-PPIN (Colorectal cancer- protein-protein interaction, CTNBB1 (Catenin beta-1), EGF (Epidermal growth factor), EGFR (Epidermal growth factor receptor), EZH2 (Enhancer of zeste homolog 2), HDAC1 (Histone deacetylase 1), HDAC4 (Histone deacetylase 1), HRAS (Harvey Rat sarcoma virus), JUN (transcription factor Jun), KLF4 (KLF transcription factor 5), KRAS (proto-oncogene), MF (Molecular function), miRNA (micro-RNA), NFKB1(Nuclear factor kappa B subunit 1), PPI (Protein-Protein Interaction), PPIN (Protein-Protein Interaction Network), RHOA (Ras homolog family member A), SN (Sub-network), TF (Transcription factor), TP53 (Tumor protein P53).

References

  1. Jemal, A.; Siegel, R.; Xu, J.Q.; Ward, E. Cancer Statistics, 2010. CA Cancer J. Clin. 2010, 60, 277–300. [Google Scholar] [CrossRef] [PubMed]
  2. Yamagishi, H.; Kuroda, H.; Imai, Y.; Hiraishi, H. Molecular pathogenesis of sporadic colorectal cancers. Chin. J. Cancer 2016, 35, 4. [Google Scholar] [CrossRef] [PubMed] [Green Version]
  3. Alzahrani, S.M.; Al Doghaither, H.A.; Al-Ghafari, A.B. General insight into cancer: An overview of colorectal cancer (Review). Mol. Clin. Oncol. 2021, 15, 271. [Google Scholar] [CrossRef] [PubMed]
  4. Pino, M.S.; Chung, D.C. The chromosomal instability pathway in colon cancer. Gastroenterology 2010, 138, 2059–2072. [Google Scholar] [CrossRef] [PubMed] [Green Version]
  5. Allison, D.B.; Cui, X.; Page, G.; Sabripour, M. Microarray data analysis: From disarray to consolidation and consensus. Nat. Rev. Genet. 2006, 7, 55–65. [Google Scholar] [CrossRef]
  6. Chen, Y.; Gao, Z.; Wang, B.; Xu, R. Towards precision medicine-based therapies for glioblastoma: Interrogating human disease genomics and mouse phenotypes. BMC Genom. 2016, 17 (Suppl. S7), 516. [Google Scholar] [CrossRef] [Green Version]
  7. Chen, Y.; Xu, R. Context-sensitive network-based disease genetics prediction and its implications in drug discovery. Bioinformatics 2017, 33, 1031–1039. [Google Scholar] [CrossRef] [Green Version]
  8. Moreau, Y.; Tranchevent, L.C. Computational tools for prioritizing candidate genes: Boosting disease gene discovery. Nat. Rev. Genet. 2012, 13, 523–536. [Google Scholar] [CrossRef]
  9. Sonachalam, M.; Shen, J.; Huang, H.; Huang, H.; Wu, X.; Wu, X. Systems biology approach to identify gene network signatures for colorectal cancer. Front. Genet. 2012, 3, 80. [Google Scholar] [CrossRef] [Green Version]
  10. Khan, M.M.; Serajuddin, M.; Malik, M.Z. Identification of microRNA and gene interactions through bioinformatic integrative analysis for revealing candidate signatures in prostate cancer. Gene Rep. 2022, 27, 101607. [Google Scholar] [CrossRef]
  11. Barabasi, A.L.; Oltvai, Z.N. Network biology: Understanding the cell’s functional organization. Nat. Rev. Genet. 2004, 5, 101–113. [Google Scholar] [CrossRef] [PubMed]
  12. Vidal, M.; Cusick, M.E.; Barabasi, A.L. Interactome networks and human disease. Cell 2011, 144, 986–998. [Google Scholar] [CrossRef] [PubMed] [Green Version]
  13. Hahn, M.W.; Kern, A.D. Comparative genomics of centrality and essentiality in three eukaryotic protein-interaction networks. Mol. Biol. Evol. 2005, 22, 803–806. [Google Scholar] [CrossRef] [PubMed] [Green Version]
  14. Ravasz, E.; Somera, A.L.; Mongru, D.A.; Oltvai, Z.N.; Barabási, A.L. Hierarchical organization of modularity in metabolic networks. Science 2002, 297, 1551–1555. [Google Scholar] [CrossRef] [Green Version]
  15. Ravasz, E.; Barabasi, A.L. Hierarchical organization in complex networks. Phys. Rev. E Stat. Nonlin. Soft Matter. Phys. 2003, 67, 026112. [Google Scholar] [CrossRef] [Green Version]
  16. Valizadeh, R.; Bahadorimonfared, A.; Rezaei-Tavirani, M.; Norouzinia, M.; Ehsani Ardakani, M.I. Evaluation of involved proteins in colon adenocarcinoma: An interactome analysis. Gastroenterol. Hepatol. Bed Bench 2017, 10, S129–S138. [Google Scholar]
  17. Mansouri, V.; Rezaei Tavirani, M.; Rezaei Tavirani, S. Gene screening of colorectal cancers via network analysis. Gastroenterol. Hepatol. Bed Bench 2019, 12, 149–154. [Google Scholar]
  18. Arjmand, B.; Khodadoost, M.; Jahani Sherafat, S.; Rezaei Tavirani, M.; Ahmadi, N.; Hamzeloo Moghadam, M.; Rezaei Tavirani, S.; Khanabadi, B.; Iranshahi, M. Assessment of colon cancer molecular mechanism: A system biology approach. Gastroenterol. Hepatol. Bed Bench 2021, 14, S51–S57. [Google Scholar]
  19. Kanehisa, M.; Goto, S. KEGG: Kyoto encyclopedia of genes and genomes. Nucleic Acids Res. 2000, 28, 29–34. [Google Scholar] [CrossRef]
  20. Von Mering, C.; Huynen, M.; Jaeggi, D.; Schmidt, S.; Bork, P.; Snel, B. STRING: A database of predicted functional associations between proteins. Nucleic Acids Res. 2003, 31, 258–261. [Google Scholar] [CrossRef]
  21. Assenov, Y.; Ramirez, F.; Schelhorn, S.E.; Lengauer, T.; Albrecht, M. Computing topological parameters of biological networks. Bioinformatics 2008, 24, 282–284. [Google Scholar] [CrossRef] [PubMed] [Green Version]
  22. Traag, V.A.; Krings, G.; Van Dooren, P. Significant scales in community structure. Sci. Rep. 2013, 3, 2930. [Google Scholar] [CrossRef] [PubMed] [Green Version]
  23. Borgatti, S.P.; Everett, M.G. A Graph-theoretic perspective on centrality. Soc. Netw. 2006, 28, 466–484. [Google Scholar] [CrossRef]
  24. Barabasi, A.L.; Gulbahce, N.; Loscalzo, J. Network medicine: A network-based approach to human disease. Nat. Rev. Genet. 2011, 12, 56–68. [Google Scholar] [CrossRef] [Green Version]
  25. Lim, J.; Hao, T.; Shaw, C.; Patel, A.J.; Szabo, G.; Rual, J.F.; Fisk, C.J.; Li, N.; Smolyar, A.; Hill, D.E.; et al. A protein-protein interaction network for human inherited ataxias and disorders of Purkinje cell degeneration. Cell 2006, 125, 801–814. [Google Scholar] [CrossRef] [Green Version]
  26. Stelzl, U.; Worm, U.; Lalowski, M.; Haenig, C.; Brembeck, F.H.; Goehler, H.; Stroedicke, M.; Zenkner, M.; Schoenherr, A.; Koeppen, S.; et al. A human protein-protein interaction network: A resource for annotating the proteome. Cell 2005, 122, 957–968. [Google Scholar] [CrossRef] [Green Version]
  27. Verma, R.N.; Malik, M.Z.; Subbarao, N.; Singh, G.P.; Sinha, D.N. Entamoeba histolytica HM-1: IMSS gene expression profiling identifies key hub genes, potential biomarkers, and pathways in Amoebiasis infection: A systematic network meta-analysis. BioSci. Rep. 2022, 42, BSR20220191. [Google Scholar] [CrossRef]
  28. Mangangcha, I.R.; Malik, M.Z.; Kucuk, O.; Ali, S.; Singh, R.K.B. Kinless hubs are potential target genes in prostate cancer network. Genomics 2020, 112, 5227–5239. [Google Scholar] [CrossRef]
  29. Bader, G.D.; Hogue, C.W. An automated method for finding molecular complexes in large protein interaction networks. BMC Bioinform. 2003, 4, 2. [Google Scholar] [CrossRef] [Green Version]
  30. Nafis, S.; Kalaiarasan, P.; Brojen Singh, R.K.; Husain, M.; Bamezai, R.N. Apoptosis regulatory protein-protein interaction demonstrates hierarchical scale-free fractal network. Brief Bioinform. 2015, 16, 675–699. [Google Scholar] [CrossRef] [Green Version]
  31. Reimand, J.; Arak, T.; Adler, P.; Kolberg, L.; Reisberg, S.; Peterson, H.; Vilo, J. g:Profiler-a web server for functional interpretation of gene lists (2016 update). Nucleic Acids Res. 2016, 44, W83–W89. [Google Scholar] [CrossRef] [PubMed]
  32. Xie, Z.; Bailey, A.; Kuleshov, M.V.; Clarke, D.J.B.; Evangelista, J.E.; Jenkins, S.L.; Lachmann, A.; Wojciechowicz, M.L.; Kropiwnicki, E.; Jagodnik, K.M.; et al. Gene Set Knowledge Discovery with Enrichr. Curr. Protoc. 2021, 1, e90. [Google Scholar] [CrossRef] [PubMed]
  33. Agarwal, V.; Bell, G.W.; Nam, J.W.; Bartel, D.P. Predicting effective microRNA target sites in mammalian mRNAs. Elife 2015, 4, e05005. [Google Scholar] [CrossRef] [PubMed]
  34. Chen, Y.; Wang, X. miRDB: An online database for prediction of functional microRNA targets. Nucleic Acids Res. 2020, 48, D127–D131. [Google Scholar] [CrossRef] [PubMed] [Green Version]
  35. Huang, H.Y.; Lin, Y.C.; Li, J.; Huang, K.Y.; Shrestha, S.; Hong, H.C.; Tang, Y.; Chen, Y.G.; Jin, C.N.; Yu, Y.; et al. miRTarBase 2020: Updates to the experimentally validated microRNA-target interaction database. Nucleic Acids Res. 2020, 48, D148–D154. [Google Scholar] [CrossRef] [Green Version]
  36. Han, H.; Shim, H.; Shin, D.; Shim, J.E.; Ko, Y.; Shin, J.; Kim, H.; Cho, A.; Kim, E.; Lee, T.; et al. TRRUST: A reference database of human transcriptional regulatory interactions. Sci. Rep. 2015, 5, 11432. [Google Scholar] [CrossRef] [PubMed] [Green Version]
  37. Wang, J.; Lu, M.; Qiu, C.; Cui, Q. TransmiR: A transcription factor-microRNA regulation database. Nucleic Acids Res. 2010, 38, D119–D122. [Google Scholar] [CrossRef] [Green Version]
  38. Excoffier, L.; Gouy, A.; Daub, J.T.; Shannon, P.; Markiel, A.; Ozier, O.; Baliga, N.S.; Wang, J.T.; Ramage, D.; Amin, N.; et al. Cytoscape: A Software Environment for Integrated Models of Biomolecular Interaction Networks. Nucleic Acids Res. 2017, 13, 2498–2504. [Google Scholar]
  39. Le, D.H.; Kwon, Y.K. A coherent feedforward loop design principle to sustain robustness of biological networks. Bioinformatics 2013, 29, 630–637. [Google Scholar] [CrossRef] [Green Version]
  40. Mangan, S.; Alon, U. Structure and function of the feed-forward loop network motif. Proc. Natl. Acad. Sci. USA 2003, 100, 11980–11985. [Google Scholar] [CrossRef] [Green Version]
  41. Su, L.N.; Song, X.Q.; Xue, Z.X.; Zheng, C.Q.; Yin, H.F.; Wei, H.P. Network analysis of microRNAs, transcription factors, and target genes involved in axon regeneration. J. Zhejiang Univ. Sci. B 2018, 19, 293–304. [Google Scholar] [CrossRef] [PubMed]
  42. Kalir, S.; Mangan, S.; Alon, U. A coherent feed-forward loop with a SUM input function prolongs flagella expression in Escherichia coli. Mol. Syst. Biol. 2005, 1, 2005-0006. [Google Scholar] [CrossRef] [PubMed] [Green Version]
  43. Dong, J.; Horvath, S. Understanding network concepts in modules. BMC Syst. Biol. 2007, 1, 24. [Google Scholar] [CrossRef] [PubMed] [Green Version]
  44. Koveitypour, Z.; Panahi, F.; Vakilian, M.; Peymani, M.; Seyed Forootan, F.; Nasr Esfahani, M.H.; Ghaedi, K. Signaling pathways involved in colorectal cancer progression. Cell Biosci. 2019, 9, 97. [Google Scholar] [CrossRef] [Green Version]
  45. Bhullar, K.S.; Lagarón, N.O.; McGowan, E.M.; Parmar, I.; Jha, A.; Hubbard, B.P.; Rupasinghe, H.P.V. Kinase-targeted cancer therapies: Progress, challenges and future directions. Mol. Cancer 2018, 17, 48. [Google Scholar] [CrossRef] [Green Version]
  46. Morris, V.K.; Kennedy, E.B.; Baxter, N.N.; III, A.B.B.; Cercek, A.; Cho, M.; Ciombor, K.K.; Cremolini, C.; Davis, A.; Deming, D.A.; et al. Treatment of Metastatic Colorectal Cancer: ASCO Guideline. J. Clin. Oncol. 2023, 41, 678–700. [Google Scholar] [CrossRef]
  47. Pinero, J.; Ramirez-Anguita, J.M.; Sauch-Pitarch, J.; Ronzano, F.; Centeno, E.; Sanz, F.; Furlong, L.I. The DisGeNET knowledge platform for disease genomics: 2019 update. Nucleic Acids Res. 2020, 48, D845–D855. [Google Scholar] [CrossRef] [Green Version]
  48. Li, V.D.; Li, K.H.; Li, J.T. TP53 mutations as potential prognostic markers for specific cancers: Analysis of data from The Cancer Genome Atlas and the International Agency for Research on Cancer TP53 Database. J. Cancer Res. Clin. Oncol. 2019, 145, 625–636. [Google Scholar] [CrossRef]
  49. Chen, S.L.; Liu, L.L.; Wang, C.H.; Lu, S.X.; Yang, X.; He, Y.F.; Zhang, C.Z.; Yun, J.P. Loss of RDM1 enhances hepatocellular carcinoma progression via p53 and Ras/Raf/ERK pathways. Mol. Oncol. 2020, 14, 373–386. [Google Scholar] [CrossRef]
  50. Liebl, M.C.; Hofmann, T.G. The Role of p53 Signaling in Colorectal Cancer. Cancers 2021, 13, 2125. [Google Scholar] [CrossRef]
  51. Baugh, E.H.; Ke, H.; Levine, A.J.; Bonneau, R.A.; Chan, C.S. Why are there hotspot mutations in the TP53 gene in human cancers? Cell Death Differ. 2018, 25, 154–160. [Google Scholar] [CrossRef] [PubMed]
  52. Roszkowska, K.A.; Piecuch, A.; Sady, M.; Gajewski, Z.; Flis, S. Gain of Function (GOF) Mutant p53 in Cancer-Current Therapeutic Approaches. Int. J. Mol. Sci. 2022, 23, 13287. [Google Scholar] [CrossRef] [PubMed]
  53. Pham, T.H.; Park, H.M.; Kim, J.; Hong, J.T.; Yoon, D.Y. STAT3 and p53: Dual Target for Cancer Therapy. Biomedicines 2020, 8, 637. [Google Scholar] [CrossRef] [PubMed]
  54. Levine, A.J.; Oren, M. The first 30 years of p53: Growing ever more complex. Nat. Rev. Cancer 2009, 9, 749–758. [Google Scholar] [CrossRef] [PubMed] [Green Version]
  55. Sakai, H.; Tsukamoto, T.; Yamamoto, M.; Shirai, N.; Iidaka, T.; Hirata, A.; Yanai, T.; Masegi, T.; Donehower, L.A.; Tatematsu, M. High susceptibility of nullizygous p53 knockout mice to colorectal tumor induction by 1,2-dimethylhydrazine. J. Cancer Res. Clin. Oncol. 2003, 129, 335–340. [Google Scholar] [CrossRef] [PubMed]
  56. Hu, Y.; Le Leu, R.K.; Belobrajdic, D.; Young, G.P. The potential of sphingomyelin as a chemopreventive agent in AOM-induced colon cancer model: Wild-type and p53+/– mice. Mol. Nutr. Food Res. 2008, 52, 558–566. [Google Scholar] [CrossRef] [PubMed]
  57. Mundhenk, J.; Hennenlotter, J.; Zug, L.; Alloussi, S.H.; Todenhoefer, T.; Gakis, G.; Aufderklamm, S.; Scharpf, M.; Kuehs, U.; Stenzl, A.; et al. Evidence for PTEN-independent Akt activation and Akt-independent p27(Kip1) expression in advanced bladder cancer. Oncol. Lett. 2011, 2, 1089–1093. [Google Scholar] [CrossRef] [Green Version]
  58. Zhang, X.; Chen, X.; Zhai, Y.; Cui, Y.; Cao, P.; Zhang, H.; Wu, Z.; Li, P.; Yu, L.; Xia, X.; et al. Combined effects of genetic variants of the PTEN, AKT1, MDM2 and p53 genes on the risk of nasopharyngeal carcinoma. PLoS ONE 2014, 9, e92135. [Google Scholar] [CrossRef]
  59. Ying, J.; Xu, Q.; Liu, B.; Zhang, G.; Chen, L.; Pan, H. The expression of the PI3K/AKT/mTOR pathway in gastric cancer and its role in gastric cancer prognosis. Onco Targets Ther. 2015, 8, 2427–2433. [Google Scholar] [CrossRef] [Green Version]
  60. Wang, M.Y.; He, J.; Zhu, M.L.; Teng, X.Y.; Li, Q.X.; Sun, M.H.; Wang, X.F.; Yang, Y.J.; Wang, J.C.; Jin, L.; et al. A Functional Polymorphism (rs2494752) in the AKT1 Promoter Region and Gastric Adenocarcinoma Risk in an Eastern Chinese Population. Sci. Rep. 2016, 6, 20008. [Google Scholar] [CrossRef] [Green Version]
  61. Dang, K.; Davidson, N.E.; Del Vecchio Fitz, C.; Dogan, S.; DuBois, R.N.; Ducar, M.D.; Futreal, P.A.; Gao, J.; Garcia, F.; Gardos, S.; et al. AACR Project GENIE: Powering Precision Medicine through an International Consortium. Cancer Discov. 2017, 7, 818–831. [Google Scholar]
  62. Arnold, A.A.-O.; Tronser, M.; Sers, C.; Ahadova, A.; Endris, V.; Mamlouk, S.; Horst, D.; Möbs, M.; Bischoff, P.; Kloor, M.; et al. The majority of β-catenin mutations in colorectal cancer is homozygous. BMC Cancer 2020, 20, 1–10. [Google Scholar]
  63. Korinek, V.; Barker, N.; Morin, P.J.; van Wichen, D.; de Weger, R.; Kinzler, K.W.; Vogelstein, B.; Clevers, H. Constitutive transcriptional activation by a beta-catenin-Tcf complex in APC-/- colon carcinoma. Science 1997, 275, 1784–1787. [Google Scholar] [CrossRef] [PubMed] [Green Version]
  64. Morin, P.J.; Sparks, A.B.; Korinek, V.; Barker, N.; Clevers, H.; Vogelstein, B.; Kinzler, K.W. Activation of beta-catenin-Tcf signaling in colon cancer by mutations in beta-catenin or APC. Science 1997, 275, 1787–1790. [Google Scholar] [CrossRef] [Green Version]
  65. Polakis, P. Wnt signaling in cancer. Cold Spring Harb. Perspect. Biol. 2012, 4, a008052. [Google Scholar] [CrossRef] [Green Version]
  66. Murugan, A.K.; Grieco, M.; Tsuchida, N. RAS mutations in human cancers: Roles in precision medicine. Semin. Cancer Biol. 2019, 59, 23–35. [Google Scholar] [CrossRef] [PubMed]
  67. Zenonos, K.; Kyprianou, K. RAS signaling pathways, mutations and their role in colorectal cancer. World J. Gastrointest. Oncol. 2013, 5, 97–101. [Google Scholar] [CrossRef]
  68. Luo, F.; Brooks, D.G.; Ye, H.; Hamoudi, R.; Poulogiannis, G.; Patek, C.E.; Winton, D.J.; Arends, M.J. Conditional expression of mutated K-ras accelerates intestinal tumorigenesis in Msh2-deficient mice. Oncogene 2007, 26, 4415–4427. [Google Scholar] [CrossRef] [Green Version]
  69. Haigis, K.M.; Kendall, K.R.; Wang, Y.; Cheung, A.; Haigis, M.C.; Glickman, J.N.; Niwa-Kawakita, M.; Sweet-Cordero, A.; Sebolt-Leopold, J.; Shannon, K.M.; et al. Differential effects of oncogenic K-Ras and N-Ras on proliferation, differentiation and tumor progression in the colon. Nat. Genet. 2008, 40, 600–608. [Google Scholar] [CrossRef] [Green Version]
  70. Wang, H.; Birkenbach, M.; Hart, J. Expression of Jun family members in human colorectal adenocarcinoma. Carcinogenesis 2000, 21, 1313–1317. [Google Scholar] [CrossRef]
  71. Hughes, M.; Sehgal, A.; Hadman, M.; Hadman, M.; Bos, T.; Bos, T. Heterodimerization with c-Fos is not required for cell transformation of chicken embryo fibroblasts by Jun. Cell Growth Differ. 1992, 3, 889–897. [Google Scholar]
  72. Castellazzi, M.; Spyrou, G.; La Vista, N.; Dangy, J.P.; Piu, F.; Yaniv, M.; Brun, G. Overexpression of c-jun, junB, or junD affects cell growth differently. Proc. Natl. Acad. Sci. USA 1991, 88, 8890–8894. [Google Scholar] [CrossRef] [PubMed] [Green Version]
  73. Jin, H.; Tan, X.; Liu, X.; Ding, Y. Downregulation of AP-1 gene expression is an initial event in the oridonin-mediated inhibition of colorectal cancer: Studies in vitro and in vivo. J. Gastroenterol. Hepatol. 2011, 26, 706–715. [Google Scholar] [CrossRef] [PubMed]
  74. Wang, T.; Rao, D.; Yu, C.; Sheng, J.; Luo, Y.; Xia, L.; Huang, W. RHO GTPase family in hepatocellular carcinoma. Exp. Hematol. Oncol. 2022, 11, 91. [Google Scholar] [CrossRef] [PubMed]
  75. Takami, Y.; Higashi, M.; Kumagai, S.; Kuo, P.C.; Kawana, H.; Koda, K.; Miyazaki, M.; Harigaya, K. The activity of RhoA is correlated with lymph node metastasis in human colorectal cancer. Dig. Dis. Sci. 2008, 53, 467–473. [Google Scholar] [CrossRef] [PubMed]
  76. Wee, P.; Wang, Z. Epidermal Growth Factor Receptor Cell Proliferation Signaling Pathways. Cancers 2017, 9, 52. [Google Scholar] [CrossRef] [PubMed] [Green Version]
  77. Gazdar, A.F. Activating and resistance mutations of EGFR in non-small-cell lung cancer: Role in clinical response to EGFR tyrosine kinase inhibitors. Oncogene 2009, 28 (Suppl. S1), S24–S31. [Google Scholar] [CrossRef] [Green Version]
  78. Sigismund, S.; Avanzato, D.; Lanzetti, L. Emerging functions of the EGFR in cancer. Mol. Oncol. 2018, 12, 3–20. [Google Scholar] [CrossRef] [Green Version]
  79. Souza, A.; Costa-Casagrande, T.A. Animal Models for Colorectal Cancer. Arq. Bras. Cir. Dig. 2018, 31, e1369. [Google Scholar] [CrossRef]
  80. Bai, J.; Hu, S. Transcriptome network analysis reveals potential candidate genes for squamous lung cancer. Int. J. Mol. Med. 2012, 29, 95–101. [Google Scholar] [CrossRef] [Green Version]
  81. Rowland, B.; Bernards, R.; Peeper, D. The KLF4 tumour suppressor is a transcriptional repressor of p53 that acts as a context-dependent oncogene. Nat. Cell Biol. 2005, 7, 1074–1082. [Google Scholar] [CrossRef] [PubMed]
  82. Wang, Y.; Zhao, X.; Shi, D.; Chen, P.; Yu, Y.; Yang, L.; Xie, L. Overexpression of SIRT1 promotes high glucose-attenuated corneal epithelial wound healing via p53 regulation of the IGFBP3/IGF-1R/AKT pathway. Investig. Ophthalmol. Vis. Sci. 2013, 54, 3806–3814. [Google Scholar] [CrossRef] [PubMed] [Green Version]
  83. Li, P.; Nicosia, S.V.; Bai, W. Antagonism between PTEN/MMAC1/TEP-1 and androgen receptor in growth and apoptosis of prostatic cancer cells. J. Biol. Chem. 2001, 276, 20444–20450. [Google Scholar] [CrossRef] [PubMed] [Green Version]
  84. Wang, A.H.; Bertos, N.R.; Vezmar, M.; Pelletier, N.; Crosato, M.; Heng, H.H.; Th’ng, J.; Han, J.; Yang, X.-J. HDAC4, a Human Histone Deacetylase Related to Yeast HDA1, Is a Transcriptional Corepressor. Mol. Cell. Biol. 1999, 19, 7816–7827. [Google Scholar] [CrossRef] [Green Version]
  85. McGregor, N.; Patel, L.; Craig, M.; Weidner, S.; Wang, S.; Pienta, K.J. AT-101 (R-(-)-gossypol acetic acid) enhances the effectiveness of androgen deprivation therapy in the VCaP prostate cancer model. J. Cell Biochem. 2010, 110, 1187–1194. [Google Scholar] [CrossRef] [Green Version]
  86. Chen, M.; Cai, H.; Yang, J.-L.; Lu, C.-L.; Liu, T.; Yang, W.; Guo, J.; Hu, X.-Q.; Fan, C.-H.; Hu, Z.-Y.; et al. Effect of heat stress on expression of junction-associated molecules and upstream factors androgen receptor and Wilms’ tumor 1 in monkey sertoli cells. Endocrinology 2008, 149, 4871–4882. [Google Scholar] [CrossRef] [Green Version]
  87. Yuan, H.; Young, C.Y.; Tian, Y.; Liu, Z.; Zhang, M.; Lou, H. Suppression of the androgen receptor function by quercetin through protein-protein interactions of Sp1, c-Jun, and the androgen receptor in human prostate cancer cells. Mol. Cell Biochem. 2010, 339, 253–262. [Google Scholar] [CrossRef]
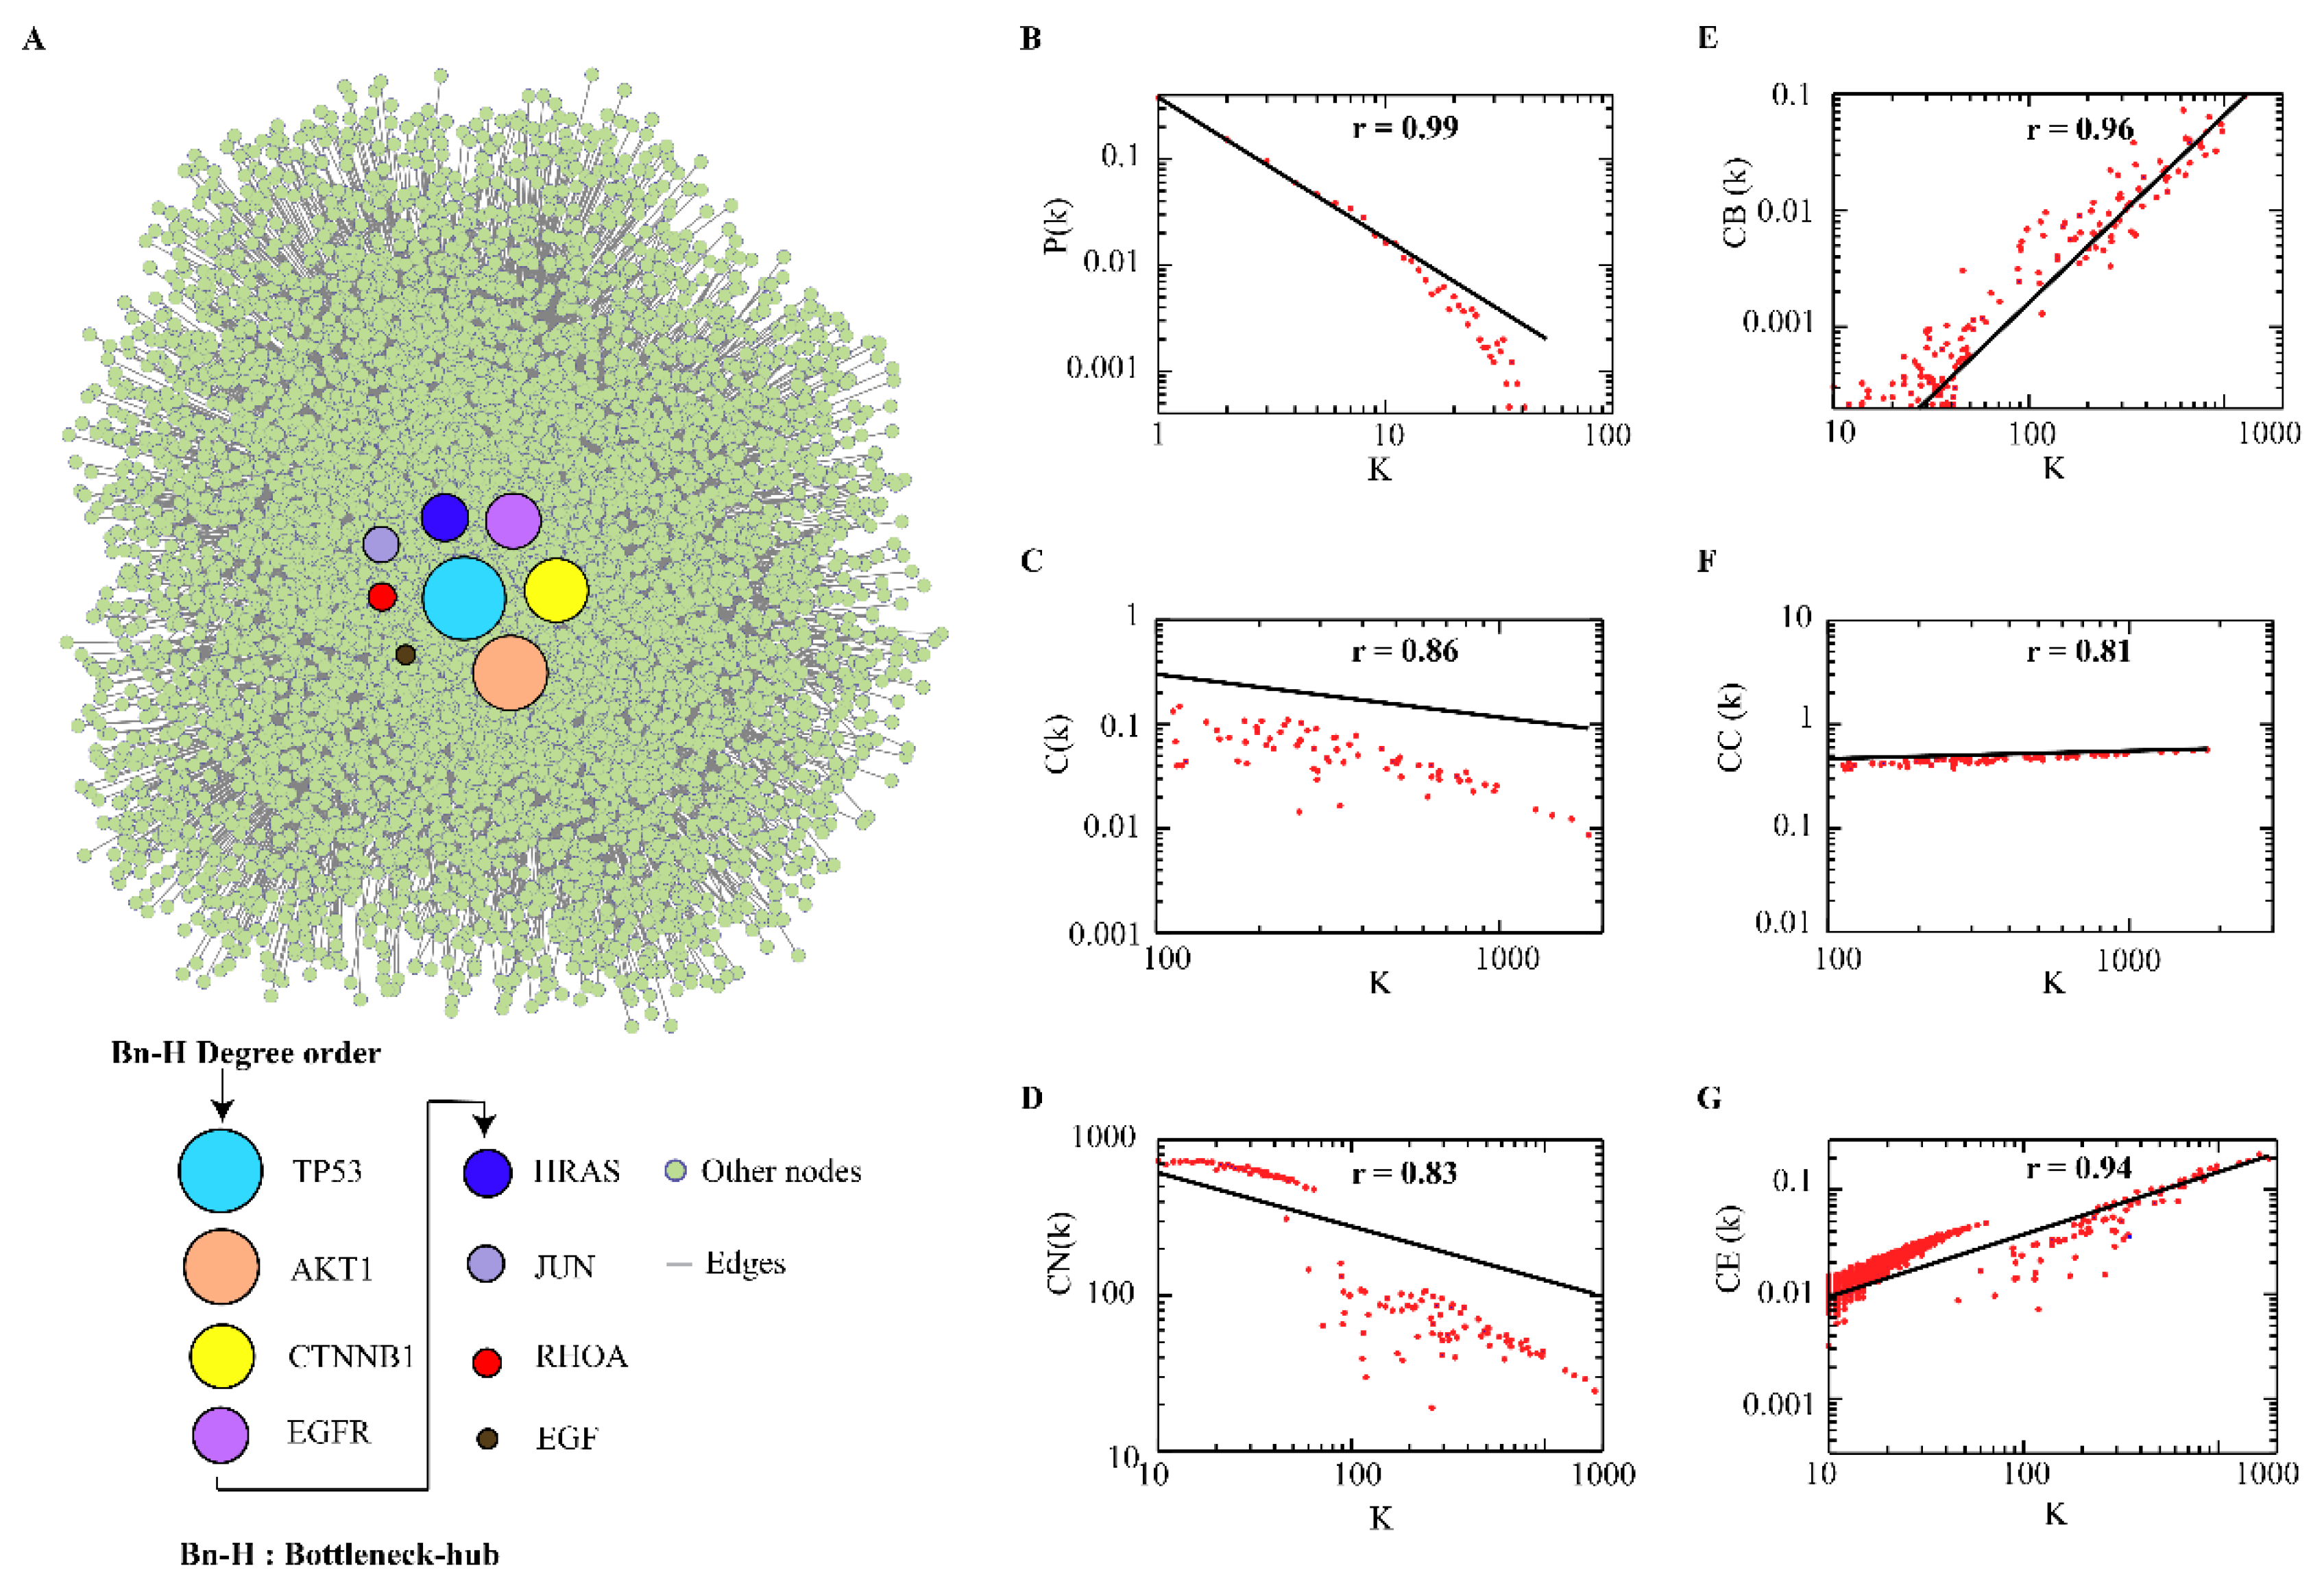
Figure 1. Central proteins and behavior of CRC-PPIN. (A) Overlapped nodes (8) in-between top 10 highest degree (k) and betweenness (CB) centrality parameters were considered as Bn-Hs and play an important role in information flow and controlling capability in the network. (BG) All topological properties followed power law distribution and provided a scale-free topology (presence of lesser no. of nodes having larger degree).
Ijms 24 05356 g001
Figure 2. Functionally significant highly interconnected regions. In the CRC–PPIN, top five sub–network was selected on the basis of M–score. Eight Bn–Hs were also found in two subnetworks (1 and 2) which not only control the internal regulation of their own subnetworks, but also influence other subnetworks by interacting with different nodes.
Ijms 24 05356 g002
Figure 3. Key mediator protein. Bn–H (HRAS) acted as key mediator for subnetworks crosstalk and was helpful for signal processing in-between unconnected proteins. HRAS showed the highest in–teracting strength in between other Bn–Hs.
Ijms 24 05356 g003
Figure 4. Cellular role of Subnetworks. (A) Functional enrichments showed that the MF of SN1 proteins associated with (phosphorylation, protein kinase activity, and transcription binding biological) processes, BP related to (positive regulation of nitrogen compound metabolism) processes in nucleoplasm and organelle lumen. (B) The MF of SN-2 were involved in enzyme and kinase binding-like activity, and in cytoplasm the BP of these protein enriched with cell proliferation, signal transduction, responses to stimuli, and intracellular signal transduction activity. (C) The proteins of SN-3 functionally enriched with enzyme and kinase binding-like activity, the BP mostly associated with signal transduction activity in cytosol and cell periphery. (D) The SN-4 proteins are located in the mitochondrial outer membrane and CHOP–ATF3 complex and involved majorly in apoptotic process and protein heterodimerization. (E) SN-5 were functionally enriched with extracellular space, the clathrin-coated endocytic vesicle to perform MF (growth factor, signal receptor activity), and BP such as the positive regulation of kinase and transferase activity. The sizes of the filled circle according to the term size—means larger terms have larger circles.
Ijms 24 05356 g004
Figure 5. Regulatory patterns of Bn-Hs in combinatorial network. (A) The top 8 Bn-Hs transcriptionally and post-transcriptionally regulated by numbers of TFs and miRNAs. (B) Common miRNAs and TFs targeting Bn-Hs and regulating their function in terms of upregulation, downregulation, and feedback activation. Few TFs regulate the function of more than one Bn-H and their miRNAs, for e.g., HDAC1 downregulating TP53 and EGFR and miRNA-429. (C) Recurring gene circuits. Three node motif regulation categories incoherent type 1, coherent type 2, and incoherent type 3 FFLs.
Ijms 24 05356 g005
Table 1. Topological properties of nodes presented in the CRC–PPIN.
S.NONameDegree (K)NameBetweeness (CB)
1TP53 *1817TP530.198765
2AKT1 *1623CTNNB10.11618
3CTNNB1 *1426AKT10.11499
4EGFR *1276EGFR0.096395
5HRAS *980CYCS0.072343
6JUN *966RHOA0.063284
7MAPK3908JUN0.054568
8RHOA *838HRAS0.0481
9EGF *814EGF0.047273
10KRAS801FOS0.041709
This table shows the top 10 highest degree nodes (hubs) and betweenness nodes (bottlenecks) out of the total (6556) nodes in the CRC–PPIN. The “*” highlighted the nodes considered as bottleneck-hubs used to identify the key mediator of the subnetworks’ crosstalk, which may be important for signal processing from the center to the periphery of the CRC–PPIN.
Table 2. The bottleneck-hub and their interaction strength with subnetworks in the CRC–PPIN.
Name of Bn-HSN-1SN-2SN-3SN-4SN-5Total
HRAS*30859254216
TP53308372143202
EGFR29807775198
JUN308370103196
AKT1277870125192
CTNNB127777363186
EGF29755914168
RHOA30686315167
The relationship between Bn-H and SN interactions were involved in the regulation of the CRC–PPIN. HRAS* showed highest strength of interaction (216 edges) with all five SNs, indicating it as the key mediator of the subnetworks. Abbreviation: subnetwork (SN), bottleneck-hub (Bn–H).
Table 3. List of top 10 pathways associated with bottleneck-hubs.
S.noTermp-ValueAdjusted p-ValueOdds RatioCombined ScoreGenes
1Signaling by ERBB2
R-HSA-1227986
3.98 × 10129.44 × 1010755.606119,833.86EGF, AKT1, HRAS, EGFR, RHOA
2Signaling by Non-Receptor Tyrosine Kinases
R-HSA-9006927
5.43 × 10129.44 × 1010707.269518,346.34EGF, AKT1, HRAS, EGFR, RHOA
3ESR-mediated signaling
R-HSA-8939211
3.81 × 1094.42 × 107180.40983497.451JUN, EGF, AKT1, HRAS, EGFR
4Signaling by NOTCH
R-HSA-157118
5.60 × 1094.87 × 107166.61623165.742JUN, EGF, AKT1, TP53, EGFR
5GRB2 events in EGFR signaling
R-HSA-179812
9.22 × 10125.62 × 1071332.224,647.6EGF, HRAS, EGFR
6Extra-nuclear estrogen signaling
R-HSA-9009391
1.13 × 1085.62 × 107288.73915283.369EGF, AKT1, HRAS, EGFR
7SHC1 events in EGFR signaling
R-HSA-180336
1.20 × 1085.62 × 1071198.9221,867.39EGF, HRAS, EGFR
8Constitutive signaling by EGFRvIII
R-HSA-5637810
1.53 × 1085.62 × 1071089.87319,615.82EGF, HRAS, EGFR
9GRB2 events in ERBB2 signaling
R-HSA-1963640
1.91 × 1085.62 × 10799917,757.53EGF, HRAS, EGFR
10Signaling by ERBB2 ECD mutants
R-HSA-9665348
1.91 × 1085.62 × 10799917,757.53EGF, HRAS, EGFR
Disclaimer/Publisher’s Note: The statements, opinions and data contained in all publications are solely those of the individual author(s) and contributor(s) and not of MDPI and/or the editor(s). MDPI and/or the editor(s) disclaim responsibility for any injury to people or property resulting from any ideas, methods, instructions or products referred to in the content.