Article

A Single Nucleotide Variation of CRS2 Affected the Establishment of Photosynthetic System in Rice

1
Key Laboratory of Rice Biology & Genetic Breeding in Northeast China, Ministry of Agriculture and Rural Areas, Rice Research Institute, Shenyang Agricultural University, Shenyang 110866, China
2
Cultivation and Tillage Institute, Heilongjiang Academy of Agricultural Sciences, Heilongjiang Provincial Engineering Technology Research Center of Crop Cold Damage, Harbin 150086, China
*
Authors to whom correspondence should be addressed.
Int. J. Mol. Sci. 2023, 24(6), 5796; https://doi.org/10.3390/ijms24065796
Submission received: 21 February 2023 / Revised: 11 March 2023 / Accepted: 15 March 2023 / Published: 18 March 2023
(This article belongs to the Special Issue Functional Genomics for Plant Breeding 3.0)

Abstract

:
Chloroplasts are essential sites for plant photosynthesis, and the biogenesis of the photosynthetic complexes involves the interaction of nuclear genes and chloroplast genes. In this study, we identified a rice pale green leaf mutant, crs2. The crs2 mutant showed different degrees of low chlorophyll phenotypes at different growth stages, especially at the seedling stage. Fine mapping and DNA sequencing of crs2 revealed a single nucleotide substitution (G4120A) in the eighth exons of CRS2, causing a G-to-R mutation of the 229th amino acid of CRS2 (G229R). The results of complementation experiments confirmed that this single-base mutation in crs2 is responsible for the phenotype of the crs2 mutant. CRS2 encodes a chloroplast RNA splicing 2 protein localized in the chloroplast. Western blot results revealed an abnormality in the abundance of the photosynthesis-related protein in crs2. However, the mutation of CRS2 leads to the enhancement of antioxidant enzyme activity, which could reduce ROS levels. Meanwhile, with the release of Rubisco activity, the photosynthetic performance of crs2 was improved. In summary, the G229R mutation in CRS2 causes chloroplast protein abnormalities and affects photosystem performance in rice; the above findings facilitate the elucidation of the physiological mechanism of chloroplast proteins affecting photosynthesis.

1. Introduction

A chloroplast is a kind of semiautonomous organelle in plant cells and contains approximately 3000 different proteins [1]. The genome of chloroplasts in higher plants is a circular double-stranded structure without histones and the superhelix structure of the nuclear genome. Chloroplast genes can be divided into three categories according to their function: photosystem genes (psaA, psbA, atpA and rbcL, etc.), genesis-related genes (rrn, rpl, rps, trn, rpoA, rpoB, rpoC1 and rpoC2, etc.) and biosynthesis-related genes (ndhA-F, etc.) [2]. Chloroplast RNA requires RNA-binding proteins for RNA post-transcriptional modifications, such as intron splicing and RNA editing, before translation [3]. Many nuclear-encoded proteins involved in chloroplast RNA post-transcriptional modifications have been identified, such as the pentatricopeptide repeat (PPR) protein, chloroplast RNA splicing and ribosome maturation (CMM) domain-containing protein and ribonuclease III domain-containing protein. In rice, AL2 encodes a chloroplast splicing facilitator (CRS1) that, by way of its three CRM domains, is involved in the shearing of group I and II introns [4]. The CRM domain contains a conserved “GxxG” motif, which has the ability to bind RNA [5]. OsPPR6 not only affects ycf3 RNA splicing efficiency but is also involved in ndhB RNA editing. The mutation of OsPPR6 can lead to abnormal chloroplast development and death due to albinism [6].
In addition to participating in post-transcriptional modification of RNA, RNA-binding proteins also facilitate translation. Ribosomes are protein-synthesizing organelles in living cells [7]. The 70S-type chloroplast ribosome consists of a 50S large subunit and a 30S small subunit. The 30S minor subunit is composed of 24 ribosomal proteins and 1 16S rRNA, while the 50S major subunit is composed of 33 ribosomal proteins and 3 rRNAs: 4.5S, 5S and 23S rRNA [8]. Unlike plastid ribosomal proteins, all four plastid rRNAs are encoded by plastid genes. Plastid ribosomal proteins can be divided into essential and nonessential types, among which the mutation of essential ribosomal proteins can severely hinder photosynthesis and plant growth and development and can even cause death [9]. The mutation of the chloroplast gene RPS4 in Chinese cabbage significantly reduced the abundance of chloroplast rRNA and chlorophyll content in the leaves [10]. Rice ASL2 encodes chloroplast ribosomal protein L21; L21 loss-of-function mutant plants exhibit an albino leaf phenotype and die after they reach the four-leaf stage [11]. Recent studies have found that chloroplast translation is generally coupled with transcription. As an RNA-binding protein, PPR53 contains a PPR domain and a carboxyterminal small-mut-related (SMR) domain. The mutation of PPR53 resulted in maize leaf chlorosis and death, loss of RRN23 and ndhA transcripts, and significantly decreased translation efficiency of ndhA mRNA [12]. In addition, PPR proteins, such as PPR10 [13], CRP1 [12] and PGR3 [14] have been shown to affect RNA processing and translation in maize simultaneously. However, all the mutations in these mutants affect RNA processing and translation at the same time and have no direct effect on the activity of RNA-binding proteins on RNA translation.
The photosynthesis system is generally divided into two components: photosystem I (PSI) and photosystem II (PSII). Major proteins of the photosystems, such as psaA and psbA, are encoded by chloroplast genes. Thus, impaired chloroplast translation significantly reduces the chlorophyll content and affects photosynthetic efficiency. In Arabidopsis thaliana, the expression of plastid-specific ribosomal protein genes (PSRPs) was shown to be significantly reduced in related mutants, resulting in defective chloroplast translation, reduced pigment contents and decreased maximum quantum efficiency (Fv/Fm) of PSII [15].
Chloroplasts are the main organelles of plant photosynthesis, and light provides the driving force for photosynthesis [16]. The light-harvesting complex consists of light-harvesting chlorophyll a/b-binding (LHCB) proteins and chlorophyll and transfers the light energy captured by chlorophyll to the reaction center proteins. Plant leaves tend to synthesize excess Chl to build larger light-harvesting antennas, which results in the plant obtaining more light energy than it needs for photosynthesis. Excessive sunlight energy can cause electrons to be transferred to O2, which results in the generation of superoxide anion (O2) radicals and hydrogen peroxide (H2O2), which can lead to photooxidative damage. In general, the production rate of reactive oxygen species (ROS) in rice chloroplasts increases when the light intensity surpasses 2000 μmol·m−2·s−1 [17]. Photosynthetic electron transport chains preferentially undergo cyclic and pseudocyclic electron transport and transfer electrons to O2 to form O2 [18]. In addition, a high ROS content negatively affects plant growth, leading to oxidative damage of proteins and nucleic acids, as well as membrane lipid peroxidation [19]. Plants employ a series of antioxidant enzymes, such as superoxide dismutase (SOD, EC: 1.15.1.1) and peroxidase (POD), to eliminate excess ROS [20]. Second to photosynthesis, photorespiration has the highest amount of metabolic flux; during photorespiration, plants catalyze ribulose-1,5-bisphosphate (RuBP) to generate glycolate-2-phosphate (2-PG) through the oxygenation activity of the ribulose 1,5-bisphosphate carboxylase and oxygenase (Rubisco, EC: 4.1.1.39) enzyme, and the 2-PG is promptly converted to glycolic acid [21]. Glycolate oxidase (GLO) functions in the peroxisome and can oxidize glycolic acid to glycolic acid and H2O2. To prevent damage, plants need to convert glycolic acid to 3-phosphoglycerate (PGA) through the photorespiration pathway to return to the Calvin cycle. Photorespiration not only removes toxic intermediates but also acts as an important regulatory mechanism of energy dissipation, effectively metabolizing reducing power and preventing photoinhibition [22]. Plants can also dissipate excess sunlight energy in the form of heat through nonphotochemical quenching (NPQ) to prevent high light stress.
In this study, the chloroplast RNA splicing 2 (crs2) mutant was obtained via ethyl methane sulfonate (EMS)-treated Oryza sativa japonica cv. Shennong 9816 (SN9816). The leaves of the mutants showed a pale green phenotype, and the chlorophyll content was reduced. Map-based cloning and genetic complementation tests revealed that the crs2 mutation was responsible for the abnormal chlorophyll content phenotype. Western blot and qPCR analyses indicated that CRS2 affects the expression of chloroplast rRNA and the relative abundance of major photosynthetic proteins. In addition, the crs2 mutant experienced less thermal dissipation and higher electron transfer efficiency, leading to an increase in the net assimilation rate (An). In conclusion, our study provides a new way in which the regulatory effects of CRS2 on chloroplast development and photosystem performance in rice are revealed.

2. Results

2.1. Phenotype of Mutant crs2

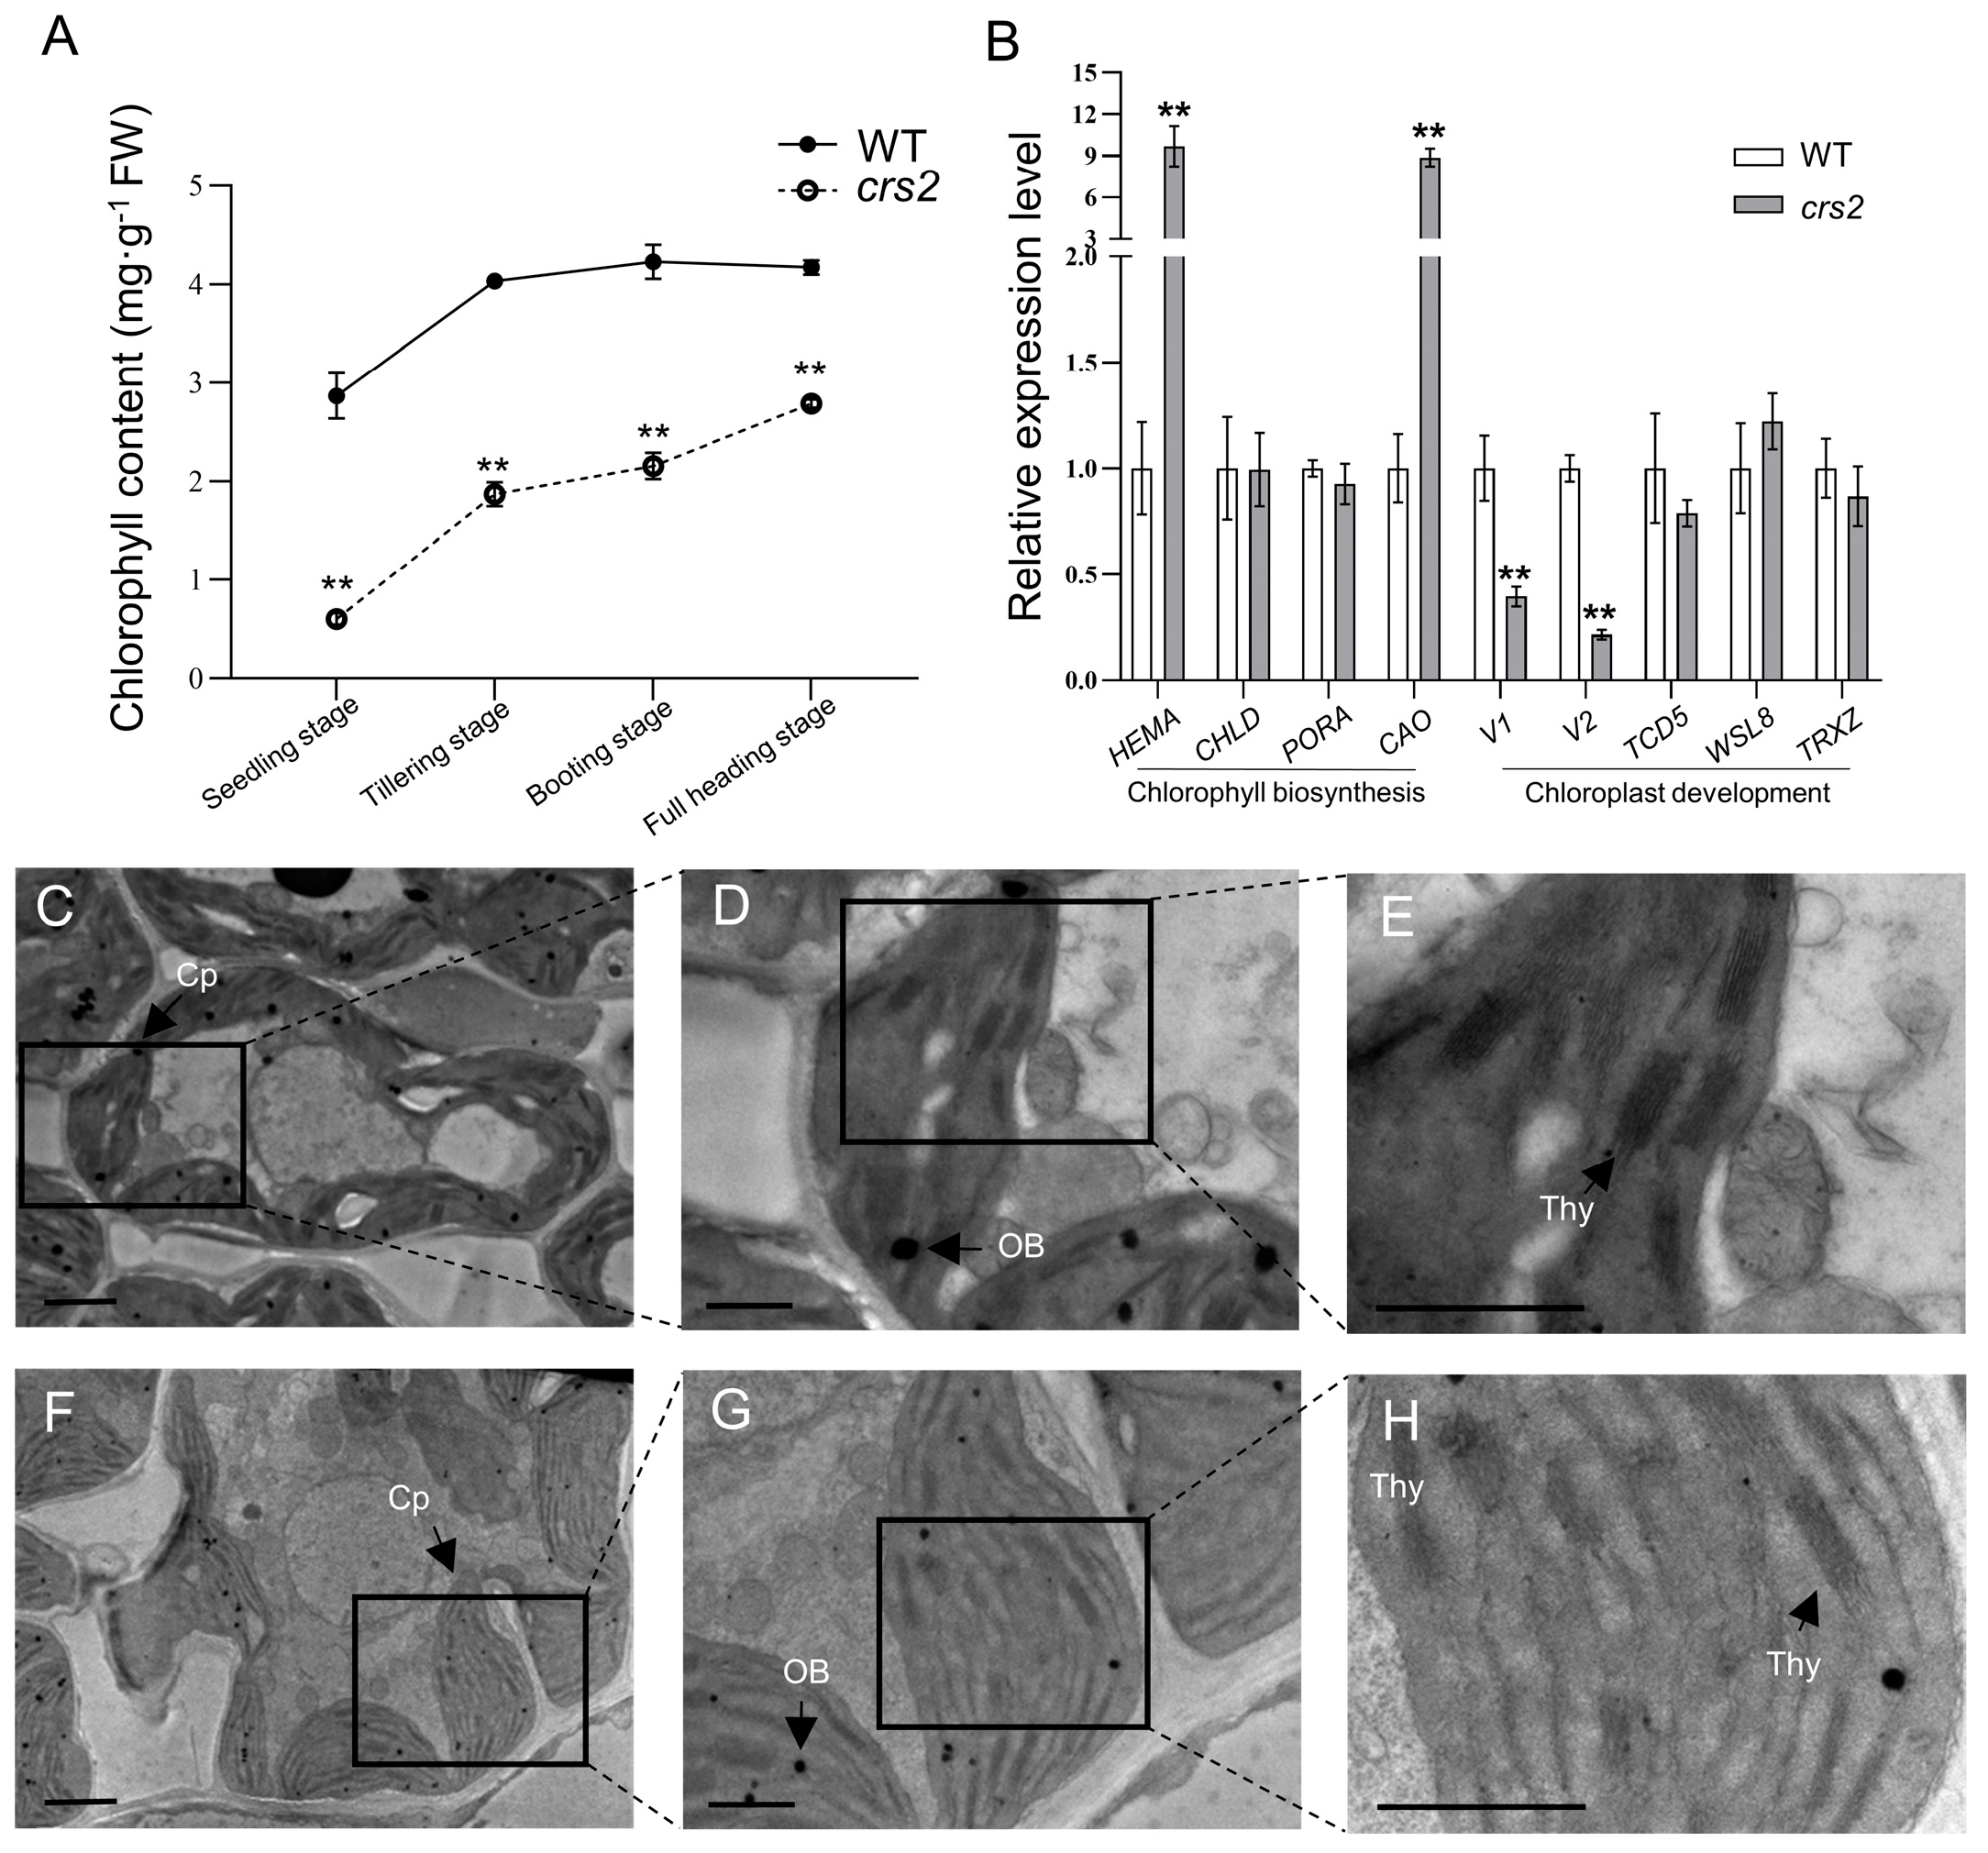
The crs2 mutant was obtained from an EMS mutant pool of the japonica rice cultivar SN9816. Under field conditions, the mutant crs2 leaves showed different degrees of pale green phenotypes. The difference in plant color was most obvious at the seedling stage and then gradually diminished (Figure 1A–F). The chlorophyll content of crs2 decreased by 79.0% compared with the WT at the seedling stage, while only a 22.2% decrease could be observed at the full-heading stage (Figure 2A). The results of the chlorophyll content were consistent with the phenotypes of the materials in the field, and they indicated that leaf color changes of the crs2 mutants were associated with a low photosynthetic pigment content.
Although the chlorophyll content of crs2 decreased, the relative expression levels of CHLD and PORA, which are related to chlorophyll biosynthesis, did not change significantly. Moreover, the expression levels of HEMA and CAO increased significantly (Figure 2B). Among those of chloroplast development-related genes, the expression levels of V1 and V2 in crs2 were significantly lower than those in the WT, while the expression levels of TCD5, WSL8 and TRXZ were not significantly different between the WT and crs2 (Figure 2B).
However, the results of TEM showed that the mesophyll cells of the WT and crs2 plants presented normal chloroplasts with well-developed stacked grana, thylakoid lamellae and thylakoid membranes at the tillering stage (Figure 2C–H). There were no significant differences in the average thickness of the granum stacks or the number of granum stacks per chloroplast between the WT and crs2 (Figure S1). Although the expression of the V1 and V2 genes in the crs2 mutant decreased, this probably did not affect chloroplast development.

2.2. Map-Based Cloning of CRS2 and Complementation Analysis

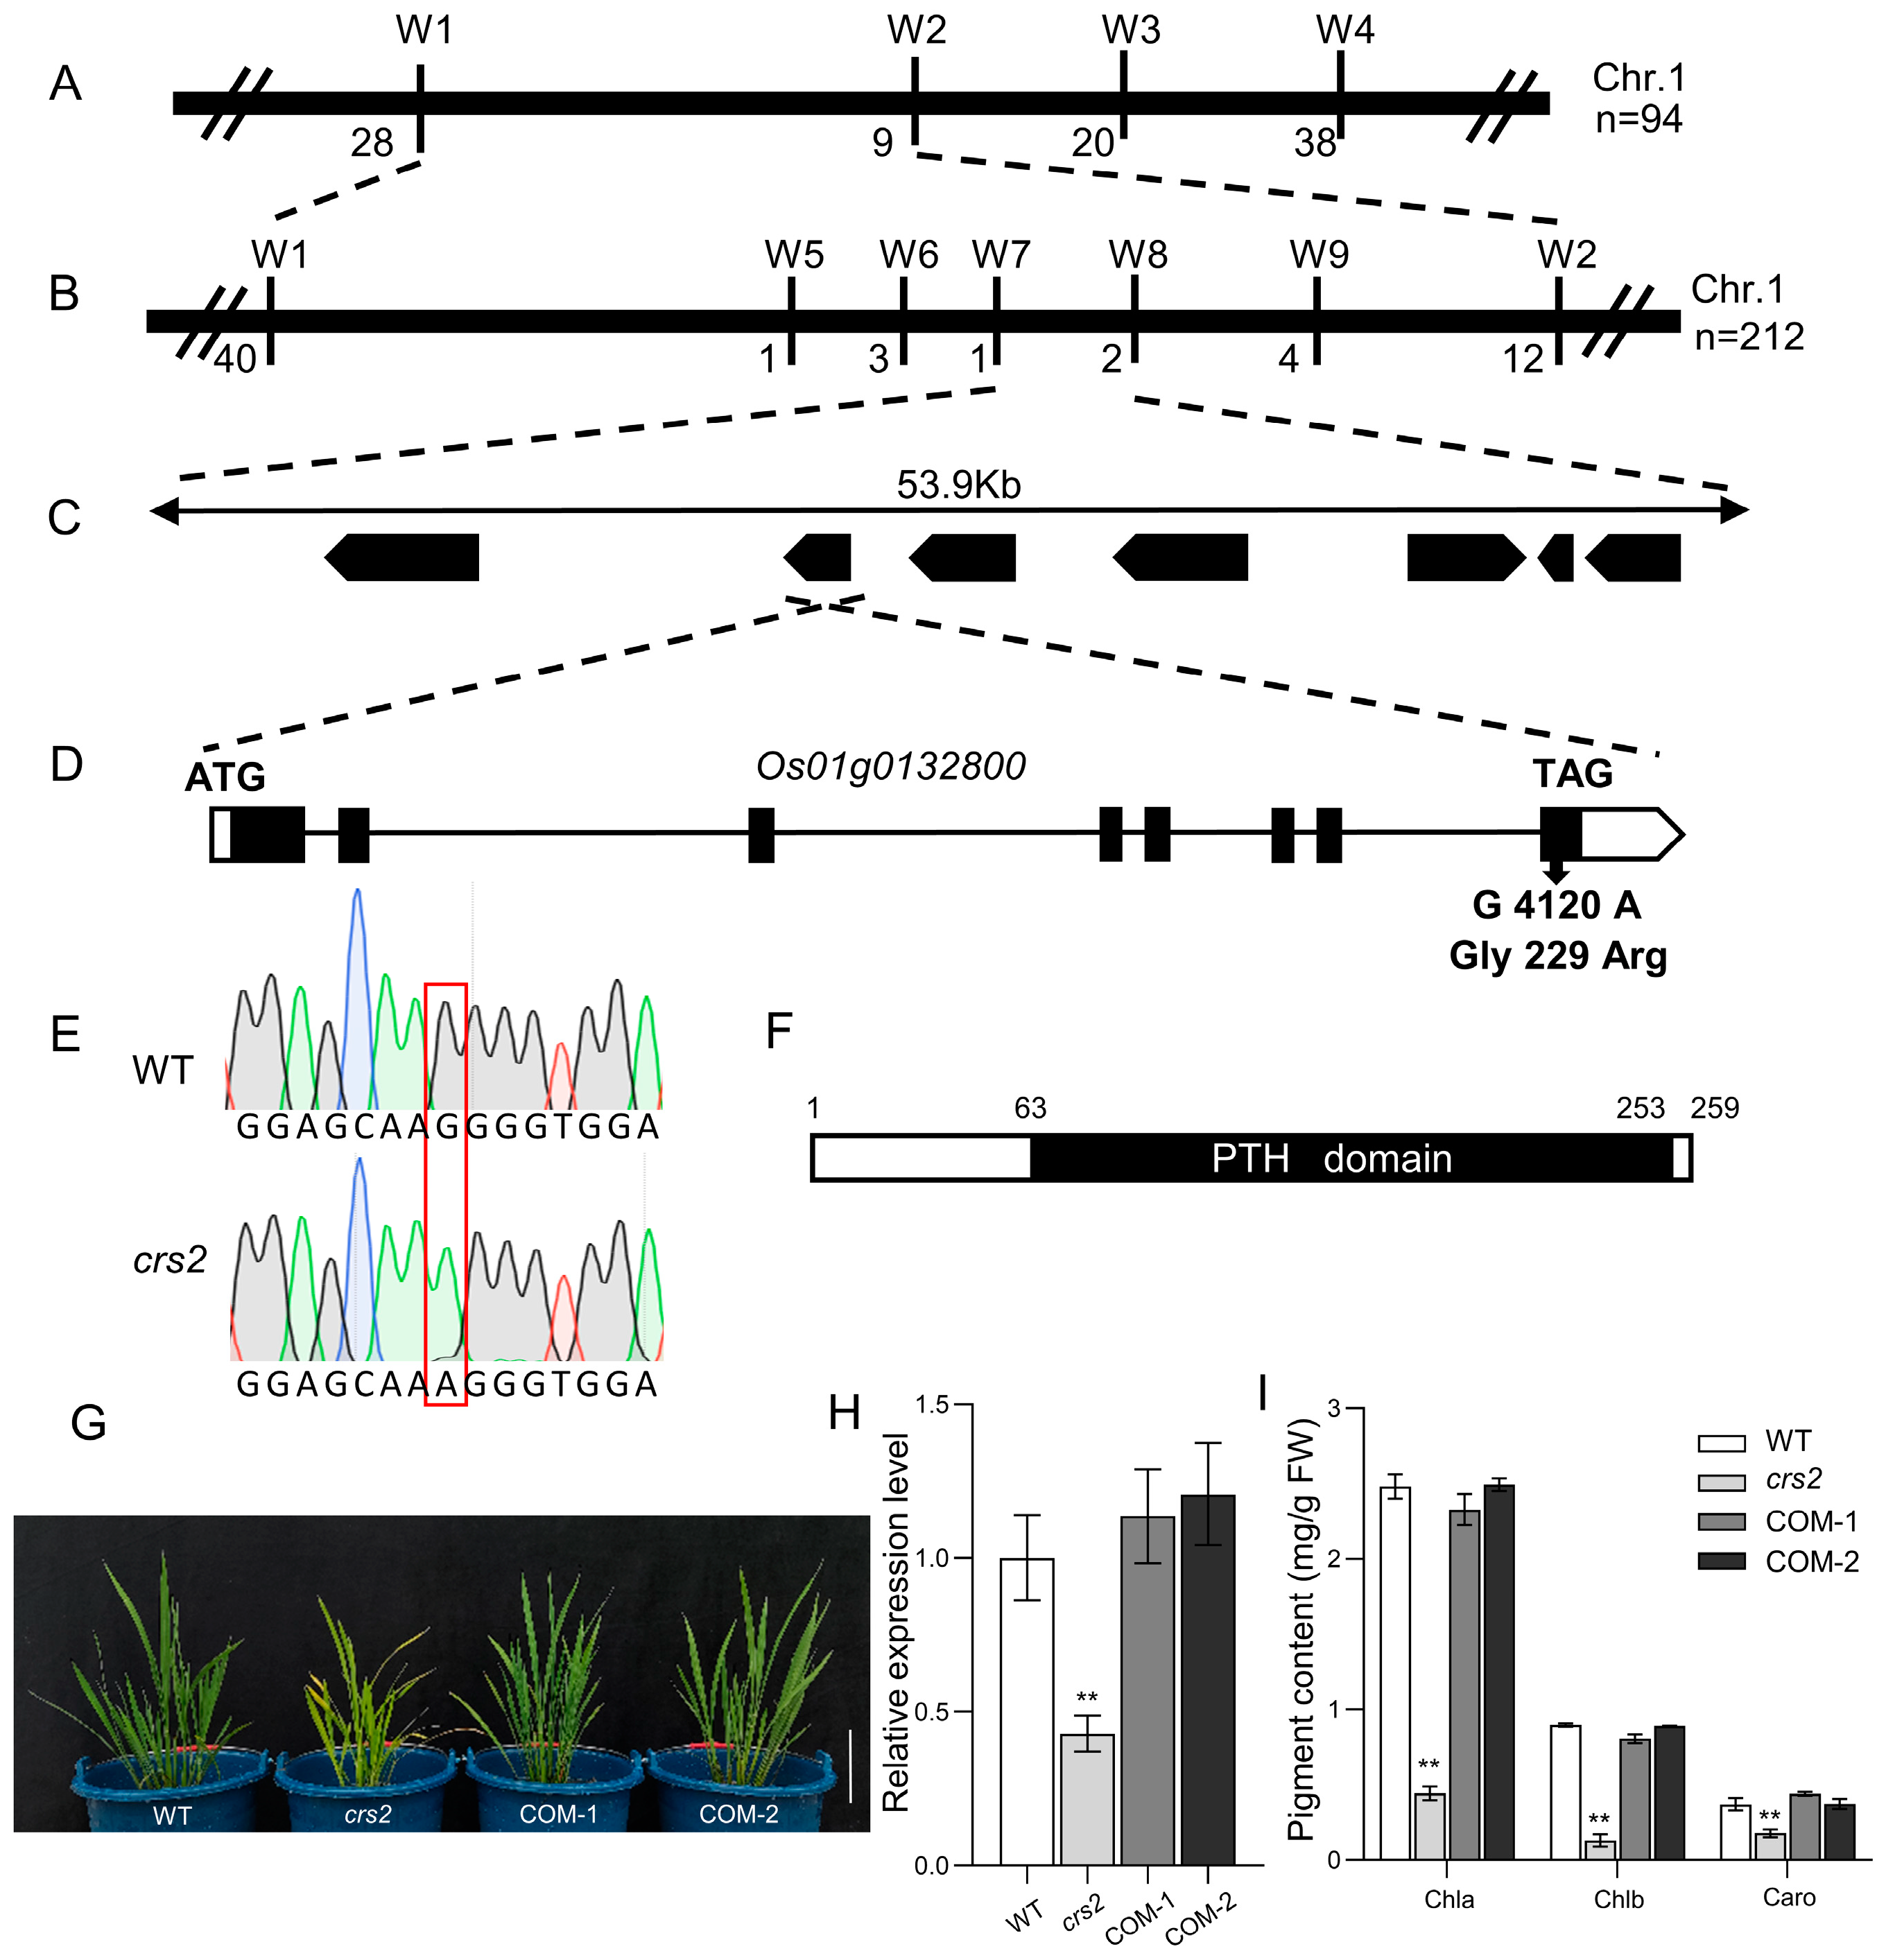
For genetic analysis, the crs2 mutant was crossed with the wild type, and the obtained F1 generation hybrids showed normal green leaves. Among all 1137 F2 population individual plants, 861 showed a normal phenotype, and 276 showed a mutant phenotype (Table S1), with a 3:1 ratio of trait isolation (χ2 = 0.319). These results indicate that the abnormal pigment phenotype of crs2 is attributable to the inheritance of a single recessive gene. To determine the physical location of the mutant gene, we constructed an F2 population with crs2 and Kasalath as parents and performed a chromosomal linkage analysis on 94 individual plants with a mutant phenotype (Figure 3A). After expanding the mapping population to 212, crs2 was precisely mapped to a 53.9 kb interval between W7 and W8 (Figure 3B), in which there are seven open-reading frames (ORFs) (Figure 3C). Then, these seven ORFs were sequenced, and only a single-nucleotide mutation (G4120A) was found at position 4120 bp from the ATG start codon in Os01g0132800, which resulted in the amino acid substitution of Gly229 to Arg229 (G229R) (Figure 3D–F). To confirm whether the mutation of Os01g0132800 resulted in a mutant phenotype, we transferred the complementary vector containing the CRS2 genome sequence into the crs2 mutant and obtained a total of 19 positive transgenic plants, all of whose mutant phenotype was rescued (Figure 3G). Pigment contents and gene expression levels were measured, and all of these parameters of the transgenic plants were restored to the WT levels (Figure 3H,I). Thus, these results confirmed that Os01g0132800 corresponded to the CRS2 gene and that the single-nucleotide substitution of Os01g0132800 is responsible for the abnormal chloroplast translation of the crs2 mutant. The CRS2 gene comprises eight exons and encodes a chloroplast RNA splicing 2 protein composed of 259 amino acids (Figure 3D). Only one peptidyl-tRNA hydrolase (PTH) domain was found via conserved domain analysis (Figure 3F).

2.3. Expression Pattern and Subcellular Localization of CRS2

To explore the expression pattern of CRS2 in WT plants, qRT–PCR analyses were performed on the roots, stems, leaves, leaf sheaths and panicles. In general, the CRS2 gene was expressed in all the aboveground parts of the rice plants. The highest expression part was found in the young leaves, followed by the mature leaves (Figure 4A). Furthermore, a histochemical staining analysis of CRS2-GUS transgenic plants was conducted to confirm the expression pattern of CRS2. The CRS2 gene was expressed in the stems, leaves, leaf sheaths and panicles and was expressed mainly in the leaves, but no CRS2 expression was detected in the roots (Figure 4B–E). These results were consistent with the qRT–PCR results.
We constructed a subcellular localization vector with pCAMBIA1300-EGFP, which uses the CaMV 35S promoter to drive the expression of the CRS2-GFP fusion protein. After transient expression in rice protoplasts, the green fluorescence signal of the CRS2-GFP fusion protein coincided with that of the chloroplast, and empty GFP was present in the cytoplasm (Figure 4F). These results confirm that CRS2 was localized in the chloroplasts and was mainly expressed in green tissues.

2.4. Abnormal Chloroplast Proteins in crs2

Analysis of chloroplast intron splicing showed that crs2 intron splicing was not affected (Figure S2), and the expression levels of 23S and 16S rRNA in the chloroplasts were significantly lower in crs2 than in the WT (Figure 5A). The qRT–PCR results showed that the expression levels of psaA, psbA, petA and atpA encoded by the chloroplast genome in crs2 were significantly higher than those in the WT, but the expression levels of lhcb1 and lhcb2 encoded by nuclear genome were significantly lower (Figure 5B). Western blot analysis revealed that the abundance of the PsaA, PsbA, PetA, AtpA, Lhcb1 and Lhcb2 proteins in crs2 significantly decreased (Figure 5C).

2.5. Analysis of Chlorophyll Fluorescence

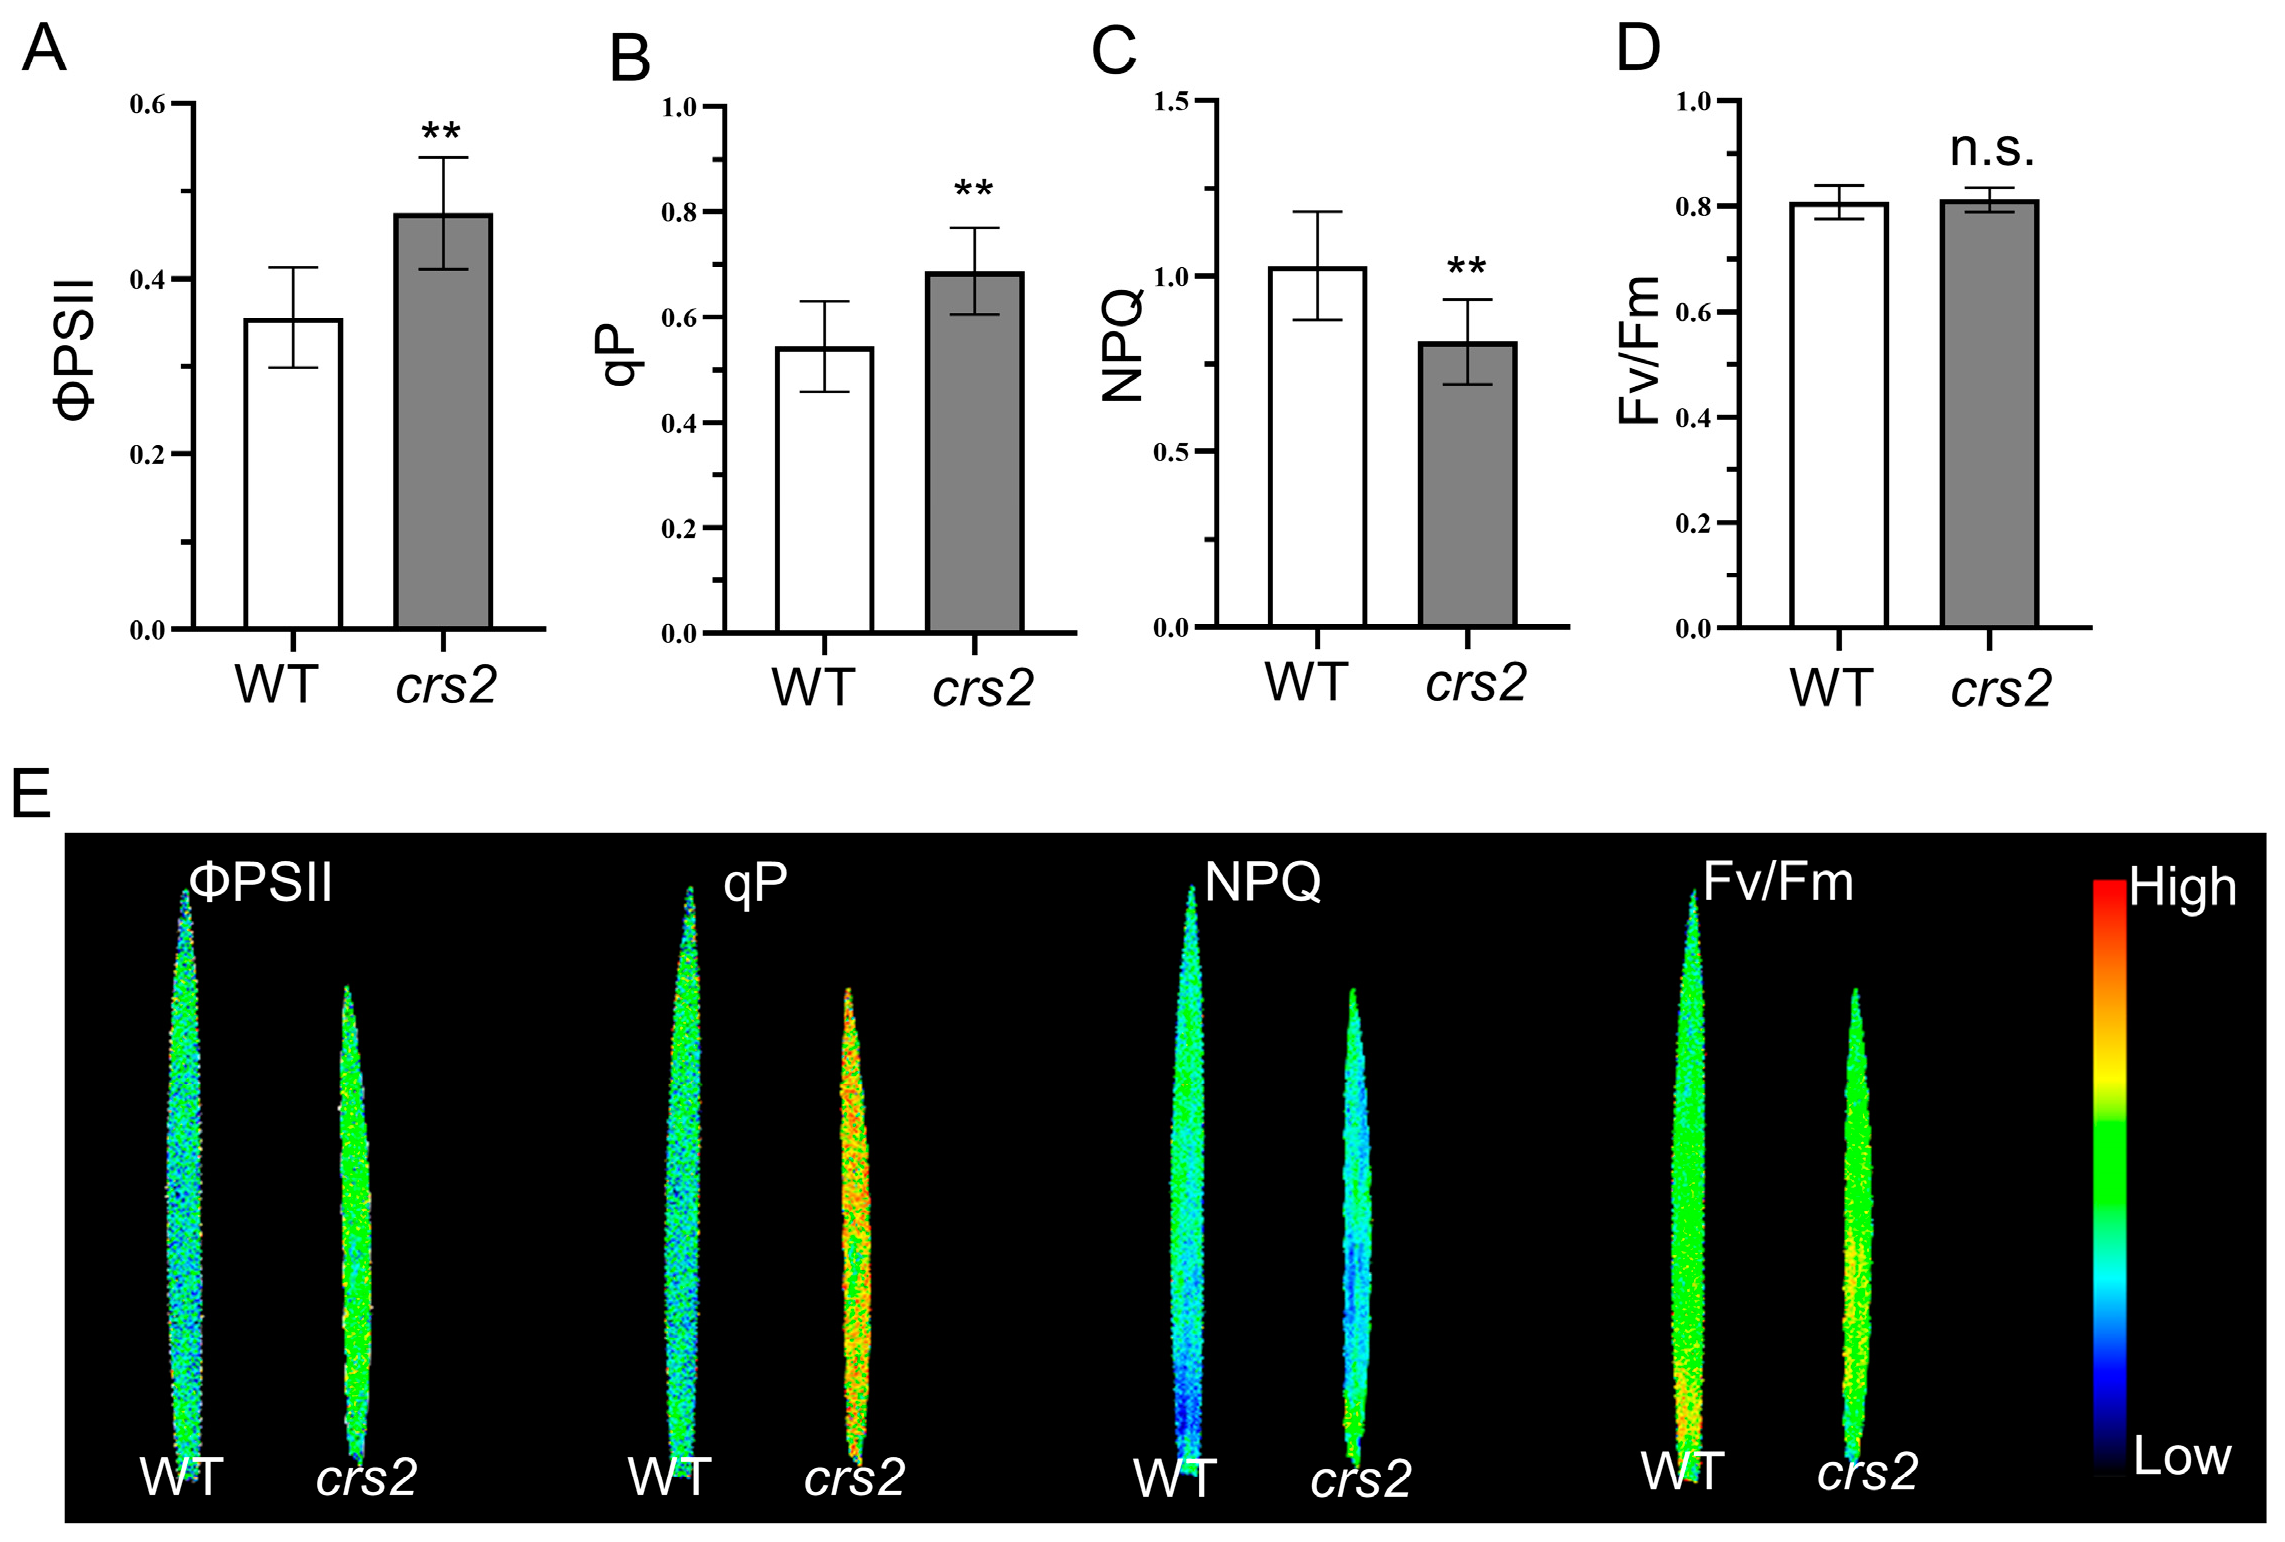
The reduction in chlorophyll content in the crs2 mutants not only resulted in the abnormal pigment phenotype but also affected the absorption and utilization of light energy in crs2. The chlorophyll fluorescence parameters under steady-state photosynthesis indicated that, compared with that of the WT, the Fv/Fm of crs2 did not change significantly; however, the quantum yield of PSII photochemistry (ΦPSII) and the photochemical quenching coefficient (qP) increased by 33.4 and 26.2%, respectively, and the NPQ decreased by 15.2% (Figure 6A–D). The chlorophyll fluorescence imaging results were also consistent with the above results (Figure 6E). The ΦPSII and qP of crs2 are significantly higher than that of the WT, while the NPQ is significantly decreased. The Fv/Fm images showed no significant difference between the WT and crs2. Taken together, these results indicated that the decrease in chlorophyll content in the mutant did not affect the photosynthesis potential at the full head stage. The light energy absorbed by the pigment in the antenna of the PSII reaction center was used more for photosynthetic electron transport, which might contribute to the release of the activity of PSII in the reaction center.

2.6. High Light Adaptability Comparison between WT and crs2

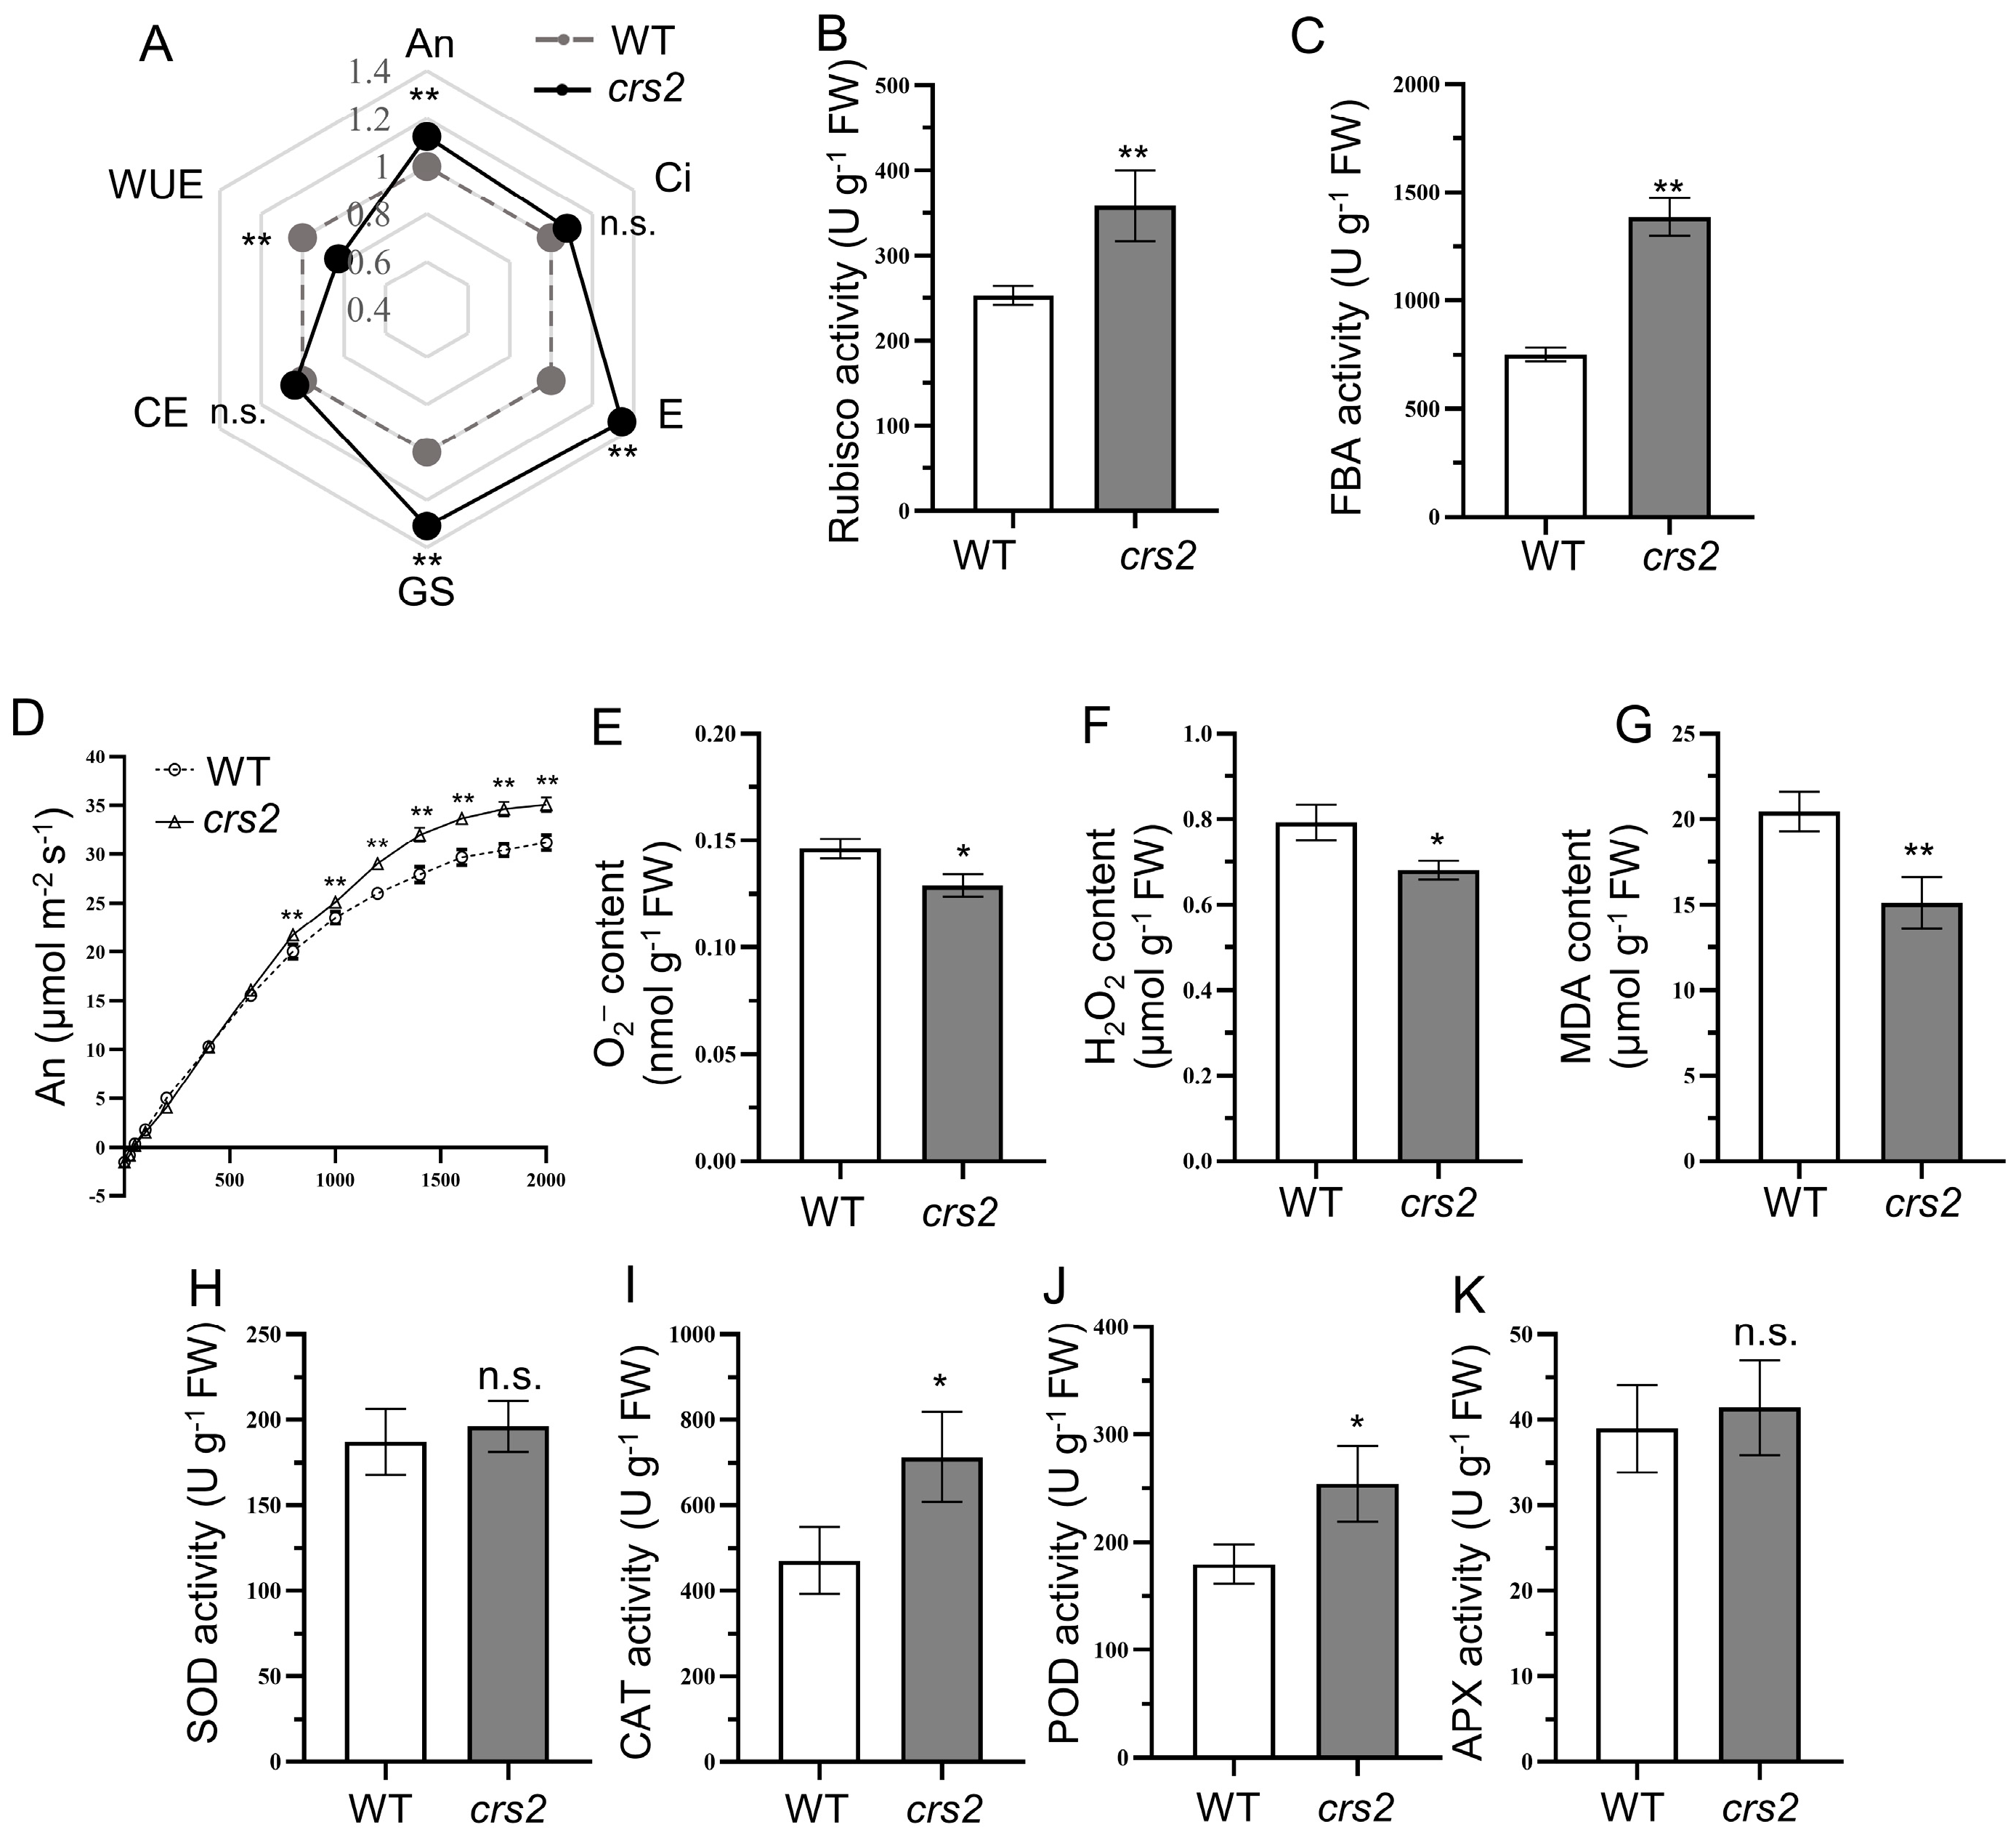
Compared with those of the WT, the chlorophyll content and photosynthesis-related protein abundance of crs2 decreased significantly, but the An, intercellular CO2 concentration (Ci), stomatal conductance (gs) and transpiration rate (E) increased by 12.4, 7.8, 30.9 and 34.2%, respectively. In addition, the water use efficiency (WUE) decreased significantly, and there was no significant difference in carboxylation efficiency (CE) (Figure 7A). In crs2, the activity of Rubisco and FBA enzymes were significantly increased and were 41.8 and 84.5% higher than those in the WT, respectively (Figure 7B,C). The light response curve showed that the An of crs2 was significantly higher than that of the WT when the PPFD was ≥800 μmol·m−2·s−1 (Figure 7D). For the antioxidant enzymes, the CAT and POD activities in crs2 significantly increased (Figure 7I,J), while the SOD and APX activities were not significantly different (Figure 7H,K). The increase in antioxidant enzyme activity in the leaves of the crs2 mutant indicated that the mutant had a high antioxidant capacity and could reduce the ROS content in mesophyll cells, and compared with the WT, the mutant had a better protective effect on mesophyll cells and chloroplasts. In addition, compared with those in the WT, the content of O2, H2O2 and MDA in the crs2 mutant were reduced by 11.8, 14.2 and 26.1%, respectively (Figure 7E–G). Therefore, crs2 can withstand ROS stress caused by high light intensity.

3. Discussion

3.1. The G229R Mutation in CRS2 Is Responsible for the Decreased Chlorophyll Content

In this study, the crs2 mutant was obtained by EMS mutagenesis, whose leaf was pale green. Although the chlorophyll content of crs2 was decreased, the expression level of genes involved in chlorophyll synthesis was significantly increased, indicating that the abnormal chlorophyll content of crs2 was not caused by the obstruction of chlorophyll synthesis. Map-based cloning and gene complementation validation indicated that a single nucleotide substitution of crs2 caused the abnormal chlorophyll content of the mutant. CRS2 encodes a chloroplast RNA splicing 2 protein, which is one of the best-characterized chloroplast RNA splicing factors [23]. Jenkins et al., identified a T-DNA insertion mutant zmcrs2 in maize, whose group II intron splicing was abnormal, and the albino leaf phenotype appeared [23]. CRS2 evolved from a peptidyl tRNA hydrolase, but a neofunctionalization resulted in it becoming one of the most important and conserved splicing factors in plant chloroplasts. Due to the lack of RNA binding ability, CRS2 needs to interact with CAF1 and CAF2 and form a splicing complex to participate in RNA splicing [24]. Both CAF1 and CAF2 are CRM domain-containing proteins, in which the CRM domain contains the conserved GxxG sequence and has the ability of RNA binding [5]. Studies on rice crs2 mutants found that CRS2 is also involved in the splicing of a group I intron and chloroplast rRNA maturation [25]. Null mutants of CRS2 are seedling-lethal in maize rice, but the G229R mutation seems to be hypomorphic and has a normal mRNA splicing length and did not show seedling albino lethal phenotypes. In the present study, the G229R mutations led to impaired biogenesis of chloroplast ribosomes and abnormal chloroplast protein abundance. Chlorophyll can be combined with light-harvesting chlorophyll a/b-binding proteins to form light-trapping pigment-protein complexes that capture light energy and rapidly transfer it to the reaction centers to trigger photochemical reactions [26]. The abundance of light-harvesting a/b-binding proteins in crs2 decreases along with that of PsaA and PsbA, thus leading to a decrease in chlorophyll content.

3.2. The crs2 Mutant Shows Higher Photosynthetic Efficiency

Chlorophyll fluorescence is an important photosynthesis parameter that reflects the absorption and utilization of light energy by PSII [27]. It is generally believed that the decrease of chlorophyll content may impair the photosynthetic performance, but the results of photosynthetic performance studies in some related mutants are different. For example, the mutation of YGL53 seriously affected chlorophyll synthesis in rice, but the electron transfer ability of the ygl53 mutant was significantly improved, which activated the activity of PSII [28]. Therefore, the chlorophyll fluorescence parameters were further detected in this study. The Fv/Fm value indicates PSII’s maximum potential for photosynthetic efficiency, while there was no significant difference observed between the WT and the mutant. ΦPSII represents the actual photochemical efficiency of PSII, and qP reflected the amount of energy consumed and the openness of the PSII reaction center. In this study, qP and ΦPSII were significantly increased in crs2 mutant, while it could be seen that NPQ was significantly decreased. NPQ represents the energy dissipated as heat in a non-photochemical quenching process. Some studies have demonstrated a negative correlation between ΦPSII and NPQ [29]. Similar to ygl53, the lower NPQ of the crs2 mutant indicated that, by reducing heat dissipation, the mutant may increase its electron transfer rate and light energy use efficiency. In addition, Rubisco and FBA are important rate-limiting enzymes in plant photosynthesis, and the improvement of the activities of Rubisco and FBA in crs2 can accelerate the rate of photosynthesis, thus improving the light energy using efficiency [30,31]. The results in the present study indicated that the crs2 mutant achieved a higher ΦPSII by increasing the qP to make better use of light energy, along with the reduction of non-photochemical quenching.

3.3. High Protective Enzyme Activity Is the Guarantee of crs2 to Cope with the Intensity of the High Light

It is widely believed that plant leaves tend to synthesize excess amounts of chlorophyll to build larger antennas that capture and absorb more light energy than that demanded by photosynthesis [32]. The excess light energy absorbed needs to be quenched by a variety of light energy dissipation mechanisms to avoid ROS stress and photoinhibition, avoiding the reduction in light energy conversion efficiency [33,34]. Both the chlorophyll content and the abundance of light-trapping antenna proteins in the crs2 mutant decreased, resulting in a smaller size of pigment antennas in the reaction center. Nonetheless, the measurement of photosynthetic indices showed that although the size of the pigment antenna of crs2 decreased, the net photosynthesis rate of crs2 increased significantly. This phenomenon was also observed in indica rice pe-1 mutants, which presented a decreased chlorophyll content but enhanced photosynthesis [35]. Therefore, the smaller pigment antenna of the crs2 mutant could still capture the light energy required for photosynthesis. The intact chloroplast structure indicated that crs2 had normal photosystem function. The increase in Rubisco activity ensured that the crs2 mutant had a high capacity for CO2 fixation. As the rate-limiting enzyme of photosynthesis, Rubisco is involved in the first step of catalytic photosynthetic carbon assimilation, and Rubisco activity has a positive effect on the CO2 assimilation rate of plants [36]. There are three pathways of photosynthetic electron transport in higher plants: noncyclic electron transport, cyclic electron transport and pseudocyclic electron transport [37]. In our study, the efficiency of electron transport in the crs2 mutant is improved through optimization of the use of light energy, and the photosystems capture more energy flowing as part of noncyclic electron transport. Due to the increase in ROS scavenging activity, the O2 and H2O2 content in crs2 decreased substantially. Normal conditions lead to a balance between ROS generation and scavenging, which is harmless to plants [38]. However, ROS stress can lead to lipid peroxidation and MDA production in plants, and MDA content is an important index for reflecting the degree of oxidative damage to cells [39]. The smaller size of the light-capturing antenna and higher light energy use efficiency of crs2 can reduce the production of ROS, consequently reducing the level of membrane lipid peroxidation and thus reducing the MDA content. Moreover, the increased activities of CAT and POD also reflected the enhanced ROS-scavenging ability of crs2. On the other hand, the reduction in ROS levels and the enhancement of the scavenger system are important for crs2 to prevent ROS stress and photoinhibition under high light intensity. The increase in CAT activity could also enhance the activity of Rubisco [40] and further improve the carbon assimilation ability of crs2.

4. Materials and Methods

4.1. Plant Materials and Growth Conditions

To map crs2, we constructed an F2 population derived from a cross of the crs2 mutant and the indica rice variety Kasalath. The seedlings of the materials were cultivated using thermal preservation and dry seedling–nursery technology. The seedlings were sown in mid-April and transplanted 30 days later. All the plants were transplanted under natural conditions into a paddy field of the Rice Research Institute, Shenyang Agricultural University (41° N, 123° E).

4.2. Measurement of Chlorophyll Content

Fresh leaf tissues (0.2 g) were soaked in 5 mL of 95% ethanol for 48 h in darkness. The absorbance values of the supernatant at 470, 649 and 665 nm were measured using a Hitachi U5100 spectrophotometer (Hitachi, Tokyo, Japan), and the pigment content was calculated using the method of Arnon [41]. Three biological replicates were performed for each sample.

4.3. Transmission Electron Microscopy (TEM)

WT and crs2 fresh leaves were taken and cut into 0.25 cm2 pieces. The cells were fixed in 3% glutaraldehyde solution and 1% OsO4 successively and then embedded in resin after being subjected to a dehydration gradient. Then, the leaves were stained with uranyl acetate and alkaline lead citrate and observed under a transmission electron microscope (HITACHI HT7800, Hitachi); the magnifications used for observation were 1.5, 5.0 and 12.0 k×.

4.4. Determination of ROS-Related Physiological Indices

Fresh leaves of WT and crs2 plants were taken at the tillering stage. The main veins were removed, and 0.1 g samples were taken for subsequent determination. Rubisco activity (BC0440), FBA activity (BC2270), O2 content (BC1290), H2O2 content (BC3590) and malondialdehyde (MDA) content (BC0020) were determined using a kit (Beijing Solarbio Science & Technology Co., Ltd., Beijing, China). The activities of SOD (A001-3-2), POD (A084-3-1), catalase (CAT) (A007-1-1) and ascorbate peroxidase (APX, EC: 1.11.1.11) (A123-1-1) were measured using kits obtained from the Nanjing Jiancheng Research Institute. All the protocols were followed according to the manufacturer’s instructions. A UV spectrophotometer was used to measure light absorption value and calculate each index. Three biological replicates were measured for each sample.

4.5. Measurement of Photosynthetic Gas Exchange and Chlorophyll Fluorescence Parameters

Photosynthesis and fluorescence parameters were determined on sunny day at full heading stage. Gas exchange parameters of flag leaves were measured using a portable photosynthesis system (CIRAS 3); the photosynthetic photon flux density (PPFD) was set to 1200 μmol·m−2·s−1, and the CO2 concentration was set to 390 ppm and stabilized using a CO2 injector system. To determine the response of plants to different light intensities, the net assimilation rates of WT and crs2 were measured under 0, 50, 100, 200, 400, 600, 800, 1000, 1200, 1400, 1600, 1800 and 2000 μmol·m−2·s−1 actinic light. After dark treatment with leaf clips for 30 min, an FMS-2 pulse-modulated fluorometer (Hansatech, Norfolk, UK) was used to measure modulated chlorophyll fluorescence, and the chlorophyll fluorescence was observed using a FluorCam 7 chlorophyll fluorescence imaging system (Photon Systems Instruments, Brno, Czech Republic). Five independent individuals were measured for each sample.

4.6. Map-Based Cloning and Complementation of CRS2

We obtained 212 plants with mutant epitopes from the constructed F2 population and extracted DNA for map-based cloning of CRS2. The genomic sequences of Nipponbare (japonica) and 93-11 (indica) were downloaded from the website of the Rice Genome Annotation Project and used to develop simple sequence repeat (SSR) and insertion–deletion (Indel) markers.
To complement the crs2 mutation, the 6734 bp genome sequence was amplified from DNA of wild-type SN9816 leaves and cloned into the binary expression vector pCAMBIA1300 to construct a pCAMBIA1300-CRS2 vector. The recombinant vector was subsequently transferred into mutant callus by Agrobacterium tumefaciens EHA105. The sequences of all the primers used are listed in Supplementary Table S2.

4.7. RNA Extraction and Quantitative Real-Time PCR (qRT–PCR) Analysis

Total RNA was extracted from tissue using a MiniBEST Plant RNA Extraction Kit (9769S, Takara Bio, Inc., Kusatsu, Japan) according to the manufacturer’s instructions. The cDNA was reverse-transcribed by using a PrimeScript RT Reagent Kit (RR047Q, Takara Bio, Inc.). qRT–PCR was subsequently performed using SYBR Premix Ex Taq II (RR820A, Takara Bio, Inc.) in an ABI 7500 Real-Time Fluorescent PCR System according to the manufacturer’s instructions. The real-time PCR experiments were repeated for three biological replicates.
For chloroplast gene intron splicing analysis, the group I and group II introns of the WT and crs2 genes were amplified and isolated via 1% agarose gel electrophoresis. The primers used for intron splicing and qRT–PCR are listed in Supplementary Table S2. Three independent experiments were repeated for each sample.

4.8. Histochemical β-Glucuronidase (GUS) Assays

To conduct active staining of the transgenic plants, a 2123 bp region of the CRS2 promoter was amplified from SN9816 genomic DNA using PCR and ligated into a pCAMBIA1305 vector such that it drove the expression of a GUS reporter gene. All the vectors were transformed into WT calli by Agrobacterium (EHA105)-mediated transformation. For GUS staining, we used excised tissues of independent T1 transgenic plants. The material was added to X-GluC buffer and incubated at 37 °C for 2 h. Afterward, the material was decolorized by soaking it in ethanol and imaged using a digital camera. The primers used for vector construction are listed in Supplementary Table S2.

4.9. Subcellular Localization of the CRS2 Protein

The full-length coding region of CRS2 was amplified using PCR and cloned into a pCAMBIA1300-EGFP vector to generate a p35S-CRS2-GFP fusion construct. The fusion construct was subsequently introduced into and transiently expressed in rice protoplasts. GFP signals were detected using a laser scanning confocal microscope (Zeiss, Oberkochen, Germany). The related primers used are listed in Supplementary Table S2.

4.10. Protein Extraction and Western Blotting

Total protein was extracted from rice leaf tissue via a plant protein extraction kit (BC3720, Beijing Solarbio Science & Technology Co., Ltd.), and the protein concentration was determined using the bicinchoninic acid assay (BCA) method. The total protein concentration of WT and crs2 was quantitatively consistent and denatured in boiling water bath for 5 min. The target protein was separated using SDS–PAGE and blotted onto a polyvinylidene difluoride (PVDF) membrane. After incubation with anti-PsaA (AS06 172, Agrisera, Vännäs, Sweden), anti-PsbA (AS05 084), anti-PetA (AS08 306) and anti-AtpA (AS08 304) antibodies, color development was performed using ECL Western Blotting Substrate (PE0010, Beijing Solarbio Science & Technology Co., Ltd.). The anti-β-actin antibody K800001M was used as an internal control.

4.11. Statistical Analysis

All of the data were statistically analyzed using Microsoft Excel 2016 (Microsoft Corporation, Washington, DC, USA) and SPSS 22 (SPSS Inc., Chicago, IL, USA). Student’s t-test was conducted to compare WT and crs2, and * and ** represent significant differences at the 0.05 and 0.01 levels, respectively. GraphPad Prism 8 (GraphPad Software, Inc., San Diego, CA, USA) and Microsoft Excel were used to construct graphs.

5. Conclusions

This study indicated that CRS2 in rice encodes a chloroplast RNA splicing 2 protein located in the chloroplast. The missense mutation of crs2 resulted in an abnormality in the abundance of chloroplast photosystem complex proteins, thereby causing a decrease in chlorophyll contents. However, this phenomenon did not affect the chloroplast ultrastructure, and the photosynthesis of crs2 mutants was maintained at normal levels. Taken together, the crs2 mutation causes abnormalities in rice chloroplast proteins and affects photosystem performance. This research helps to elucidate the physiological mechanism of chloroplast proteins affecting photosynthesis.

Supplementary Materials

The following supporting information can be downloaded at: https://www.mdpi.com/article/10.3390/ijms24065796/s1.

Author Contributions

X.C. and J.W. (Jiayu Wang) designed and conceived the research. H.C. and J.W. (Jiayu Wang) wrote the manuscript. H.C., Q.W., M.F. and P.F. analyzed the data. H.C., X.Z., L.Z. and J.W. (Jiayi Wu) performed the experiments. H.C. and J.W. (Jiayu Wang) edited the manuscript. All authors have read and agreed to the published version of the manuscript.

Funding

This research was funded by the Liaoning Revitalization Talents Program, No. XLYC2005004.

Institutional Review Board Statement

Not applicable.

Informed Consent Statement

Not applicable.

Data Availability Statement

All data generated or analyzed during this study are included in this published article.

Conflicts of Interest

The authors declare no conflict of interest.

References

  1. Zoschke, R.; Bock, R. Chloroplast Translation: Structural and Functional Organization, Operational Control, and Regulation. Plant Cell 2018, 30, 745–770. [Google Scholar] [CrossRef] [PubMed] [Green Version]
  2. Sato, S.; Nakamura, Y.; Kaneko, T.; Asamizu, E.; Tabata, S. Complete Structure of the Chloroplast Genome of Arabidopsis thaliana. DNA Res. 1999, 6, 283–290. [Google Scholar] [CrossRef] [PubMed]
  3. Varani, G.; Nagai, K. RNA Recognition by RNP Proteins during RNA Processing. Annu. Rev. Biophys. Biomol. Struct. 1998, 27, 407–445. [Google Scholar] [CrossRef]
  4. Liu, C.; Zhu, H.; Xing, Y.; Tan, J.; Chen, X.; Zhang, J.; Peng, H.; Xie, Q.; Zhang, Z. Albino Leaf 2 Is Involved in the Splicing of Chloroplast Group I and II Introns in Rice. J. Exp. Bot. 2016, 67, 5339–5347. [Google Scholar] [CrossRef]
  5. Muthusamy, M.; Kim, J.-H.; Kim, J.A.; Lee, S.-I. Plant RNA Binding Proteins as Critical Modulators in Drought, High Salinity, Heat, and Cold Stress Responses: An Updated Overview. Int. J. Mol. Sci. 2021, 22, 6731. [Google Scholar] [CrossRef]
  6. Tang, J.; Zhang, W.; Wen, K.; Chen, G.; Sun, J.; Tian, Y.; Tang, W.; Yu, J.; An, H.; Wu, T.; et al. OsPPR6, a Pentatricopeptide Repeat Protein Involved in Editing and Splicing Chloroplast RNA, Is Required for Chloroplast Biogenesis in Rice. Plant Mol. Biol. 2017, 95, 345–357. [Google Scholar] [CrossRef]
  7. Yusupov, M.M.; Yusupova, G.Z.; Baucom, A.; Lieberman, K.; Earnest, T.N.; Cate, J.H.; Noller, H.F. Crystal Structure of the Ribosome at 5.5 A Resolution. Science 2001, 292, 883–896. [Google Scholar] [CrossRef] [PubMed]
  8. Yamaguchi, K.; Subramanian, A.R. The Plastid Ribosomal Proteins. Identification of All the Proteins in the 50 S Subunit of an Organelle Ribosome (Chloroplast). J. Biol. Chem. 2000, 275, 28466–28482. [Google Scholar] [CrossRef] [Green Version]
  9. Rogalski, M.; Ruf, S.; Bock, R. Tobacco Plastid Ribosomal Protein S18 Is Essential for Cell Survival. Nucleic Acids Res. 2006, 34, 4537–4545. [Google Scholar] [CrossRef] [Green Version]
  10. Tang, X.; Wang, Y.; Zhang, Y.; Huang, S.; Liu, Z.; Fei, D.; Feng, H. A Missense Mutation of Plastid RPS4 Is Associated with Chlorophyll Deficiency in Chinese Cabbage (Brassica campestris ssp. pekinensis). BMC Plant Biol. 2018, 18, 130. [Google Scholar] [CrossRef] [Green Version]
  11. Lin, D.; Jiang, Q.; Zheng, K.; Chen, S.; Zhou, H.; Gong, X.; Xu, J.; Teng, S.; Dong, Y. Mutation of the Rice ASL2 Gene Encoding Plastid Ribosomal Protein L21 Causes Chloroplast Developmental Defects and Seedling Death. Plant Biol. Stuttg. Ger. 2015, 17, 599–607. [Google Scholar] [CrossRef] [PubMed]
  12. Zoschke, R.; Watkins, K.P.; Barkan, A. A Rapid Ribosome Profiling Method Elucidates Chloroplast Ribosome Behavior in Vivo. Plant Cell 2013, 25, 2265–2275. [Google Scholar] [CrossRef] [PubMed] [Green Version]
  13. Pfalz, J.; Bayraktar, O.A.; Prikryl, J.; Barkan, A. Site-Specific Binding of a PPR Protein Defines and Stabilizes 5′ and 3′ MRNA Termini in Chloroplasts. EMBO J. 2009, 28, 2042–2052. [Google Scholar] [CrossRef] [PubMed]
  14. Cai, W.; Okuda, K.; Peng, L.; Shikanai, T. PROTON GRADIENT REGULATION 3 Recognizes Multiple Targets with Limited Similarity and Mediates Translation and RNA Stabilization in Plastids. Plant J. Cell Mol. Biol. 2011, 67, 318–327. [Google Scholar] [CrossRef] [PubMed]
  15. Tiller, N.; Weingartner, M.; Thiele, W.; Maximova, E.; Schöttler, M.A.; Bock, R. The Plastid-Specific Ribosomal Proteins of Arabidopsis Thaliana Can Be Divided into Non-Essential Proteins and Genuine Ribosomal Proteins. Plant J. Cell Mol. Biol. 2012, 69, 302–316. [Google Scholar] [CrossRef]
  16. van Rooijen, R.; Kruijer, W.; Boesten, R.; van Eeuwijk, F.A.; Harbinson, J.; Aarts, M.G.M. Natural Variation of YELLOW SEEDLING1 Affects Photosynthetic Acclimation of Arabidopsis thaliana. Nat. Commun. 2017, 8, 1421. [Google Scholar] [CrossRef] [PubMed] [Green Version]
  17. Gururani, M.A.; Venkatesh, J.; Tran, L.S.P. Regulation of Photosynthesis during Abiotic Stress-Induced Photoinhibition. Mol. Plant 2015, 8, 1304–1320. [Google Scholar] [CrossRef] [Green Version]
  18. Gill, S.S.; Tuteja, N. Reactive Oxygen Species and Antioxidant Machinery in Abiotic Stress Tolerance in Crop Plants. Plant Physiol. Biochem. 2010, 48, 909–930. [Google Scholar] [CrossRef]
  19. Kalisz, A.; Sękara, A.; Pokluda, R.; Jezdinský, A.; Neugebauerová, J.; Slezák, K.A.; Kunicki, E. Sequential Response of Sage Antioxidant Metabolism to Chilling Treatment. Molecules 2019, 24, 4087. [Google Scholar] [CrossRef] [Green Version]
  20. Yang, Z.; Li, W.; Su, X.; Ge, P.; Zhou, Y.; Hao, Y.; Shu, H.; Gao, C.; Cheng, S.; Zhu, G.; et al. Early Response of Radish to Heat Stress by Strand-Specific Transcriptome and MiRNA Analysis. Int. J. Mol. Sci. 2019, 20, 3321. [Google Scholar] [CrossRef] [Green Version]
  21. Li, X.; Liao, M.; Huang, J.; Xu, Z.; Lin, Z.; Ye, N.; Zhang, Z.; Peng, X. Glycolate Oxidase-Dependent H2O2 Production Regulates IAA Biosynthesis in Rice. BMC Plant Biol. 2021, 21, 326. [Google Scholar] [CrossRef] [PubMed]
  22. Fahad, S.; Khan, F.A.; Pandupuspitasari, N.; Hussain, S.; Khan, I.A.; Saeed, M.; Saud, S.; Hassan, S.; Adnan, M.; Amanullah; et al. Suppressing Photorespiration for the Improvement in Photosynthesis and Crop Yields: A Review on the Role of S-Allantoin as a Nitrogen Source. J. Environ. Manag. 2019, 237, 644–651. [Google Scholar] [CrossRef] [PubMed]
  23. Jenkins, B.D.; Barkan, A. Recruitment of a Peptidyl-TRNA Hydrolase as a Facilitator of Group II Intron Splicing in Chloroplasts. EMBO J. 2001, 20, 872–879. [Google Scholar] [CrossRef] [PubMed]
  24. Zhang, Q.; Shen, L.; Wang, Z.; Hu, G.; Ren, D.; Hu, J.; Zhu, L.; Gao, Z.; Zhang, G.; Guo, L.; et al. OsCAF1, a CRM Domain Containing Protein, Influences Chloroplast Development. Int. J. Mol. Sci. 2019, 20, 4386. [Google Scholar] [CrossRef] [Green Version]
  25. Zhang, Q.; Wang, Y.; Shen, L.; Ren, D.; Hu, J.; Zhu, L.; Zhang, G.; Guo, L.; Zeng, D.; Qian, Q. OsCRS2 Encoding a Peptidyl-tRNA Hydrolase Protein Is Essential for Chloroplast Development in Rice. Plant Growth Regul. 2020, 92, 535–545. [Google Scholar] [CrossRef]
  26. Kühlbrandt, W.; Wang, D.N. Three-Dimensional Structure of Plant Light-Harvesting Complex Determined by Electron Crystallography. Nature 1991, 350, 130–134. [Google Scholar] [CrossRef]
  27. Wang, S.; Zheng, J.; Wang, Y.; Yang, Q.; Chen, T.; Chen, Y.; Chi, D.; Xia, G.; Siddique, K.H.M.; Wang, T. Photosynthesis, Chlorophyll Fluorescence, and Yield of Peanut in Response to Biochar Application. Front. Plant Sci. 2021, 12, 650432. [Google Scholar] [CrossRef]
  28. Liang, Y.; Wang, J.; Zeng, F.; Wang, Q.; Zhu, L.; Li, H.; Guo, N.; Chen, H. Photorespiration Regulates Carbon-Nitrogen Metabolism by Magnesium Chelatase D Subunit in Rice. J. Agric. Food Chem. 2021, 69, 112–125. [Google Scholar] [CrossRef]
  29. Herrera, A.; Fernández, M.D.; Taisma, M.A. Effects of Drought on CAM and Water Relations in Plants of Peperomia carnevalii. Ann. Bot. 2000, 86, 511–517. [Google Scholar] [CrossRef] [Green Version]
  30. Xue, G.-P.; Drenth, J.; McIntyre, C.L. TaHsfA6f Is a Transcriptional Activator That Regulates a Suite of Heat Stress Protection Genes in Wheat (Triticum aestivum L.) Including Previously Unknown Hsf Targets. J. Exp. Bot. 2015, 66, 1025–1039. [Google Scholar] [CrossRef] [Green Version]
  31. Zhao, W.; Liu, H.; Zhang, L.; Hu, Z.; Liu, J.; Hua, W.; Xu, S.; Liu, J. Genome-Wide Identification and Characterization of FBA Gene Family in Polyploid Crop Brassica Napus. Int. J. Mol. Sci. 2019, 20, 5749. [Google Scholar] [CrossRef] [PubMed] [Green Version]
  32. Ort, D.R.; Merchant, S.S.; Alric, J.; Barkan, A.; Blankenship, R.E.; Bock, R.; Croce, R.; Hanson, M.R.; Hibberd, J.M.; Long, S.P.; et al. Redesigning Photosynthesis to Sustainably Meet Global Food and Bioenergy Demand. Proc. Natl. Acad. Sci. USA 2015, 112, 8529–8536. [Google Scholar] [CrossRef] [PubMed] [Green Version]
  33. Melis, A. Solar Energy Conversion Efficiencies in Photosynthesis: Minimizing the Chlorophyll Antennae to Maximize Efficiency. Plant Sci. 2009, 177, 272–280. [Google Scholar] [CrossRef]
  34. Ko, S.-S.; Jhong, C.-M.; Shih, M.-C. Blue Light Acclimation Reduces the Photoinhibition of Phalaenopsis aphrodite (Moth Orchid). Int. J. Mol. Sci. 2020, 21, 6167. [Google Scholar] [CrossRef]
  35. Rao, Y.; Xu, N.; Li, S.; Hu, J.; Jiao, R.; Hu, P.; Lin, H.; Lu, C.; Lin, X.; Dai, Z.; et al. PE-1, Encoding Heme Oxygenase 1, Impacts Heading Date and Chloroplast Development in Rice (Oryza sativa L.). J. Agric. Food Chem. 2019, 67, 7249–7257. [Google Scholar] [CrossRef] [PubMed]
  36. Zhang, Y.; Zhou, Y.; Sun, Q.; Deng, D.; Liu, H.; Chen, S.; Yin, Z. Genetic Determinants Controlling Maize Rubisco Activase Gene Expression and a Comparison with Rice Counterparts. BMC Plant Biol. 2019, 19, 351. [Google Scholar] [CrossRef] [Green Version]
  37. Sukhov, V.; Surova, L.; Sherstneva, O.; Katicheva, L.; Vodeneev, V. Variation Potential Influence on Photosynthetic Cyclic Electron Flow in Pea. Front. Plant Sci. 2014, 5, 766. [Google Scholar] [CrossRef] [Green Version]
  38. Zhang, L.; Hu, T.; Amombo, E.; Wang, G.; Xie, Y.; Fu, J. The Alleviation of Heat Damage to Photosystem II and Enzymatic Antioxidants by Exogenous Spermidine in Tall Fescue. Front. Plant Sci. 2017, 8, 1747. [Google Scholar] [CrossRef] [Green Version]
  39. Toscano, S.; Farieri, E.; Ferrante, A.; Romano, D. Physiological and Biochemical Responses in Two Ornamental Shrubs to Drought Stress. Front. Plant Sci. 2016, 7, 645. [Google Scholar] [CrossRef] [Green Version]
  40. Feng, B.H.; Li, G.Y.; Islam, M.; Fu, W.M.; Zhou, Y.Q.; Chen, T.T.; Tao, L.X.; Fu, G.F. Strengthened Antioxidant Capacity Improves Photosynthesis by Regulating Stomatal Aperture and Ribulose-1,5-Bisphosphate Carboxylase/Oxygenase Activity. Plant Sci. 2020, 290, 110245. [Google Scholar] [CrossRef]
  41. Arnon, D.I. Copper enzymes in isolated chloroplasts. polyphenoloxidase in beta vulgaris. Plant Physiol. 1949, 24, 1. [Google Scholar] [CrossRef] [PubMed] [Green Version]
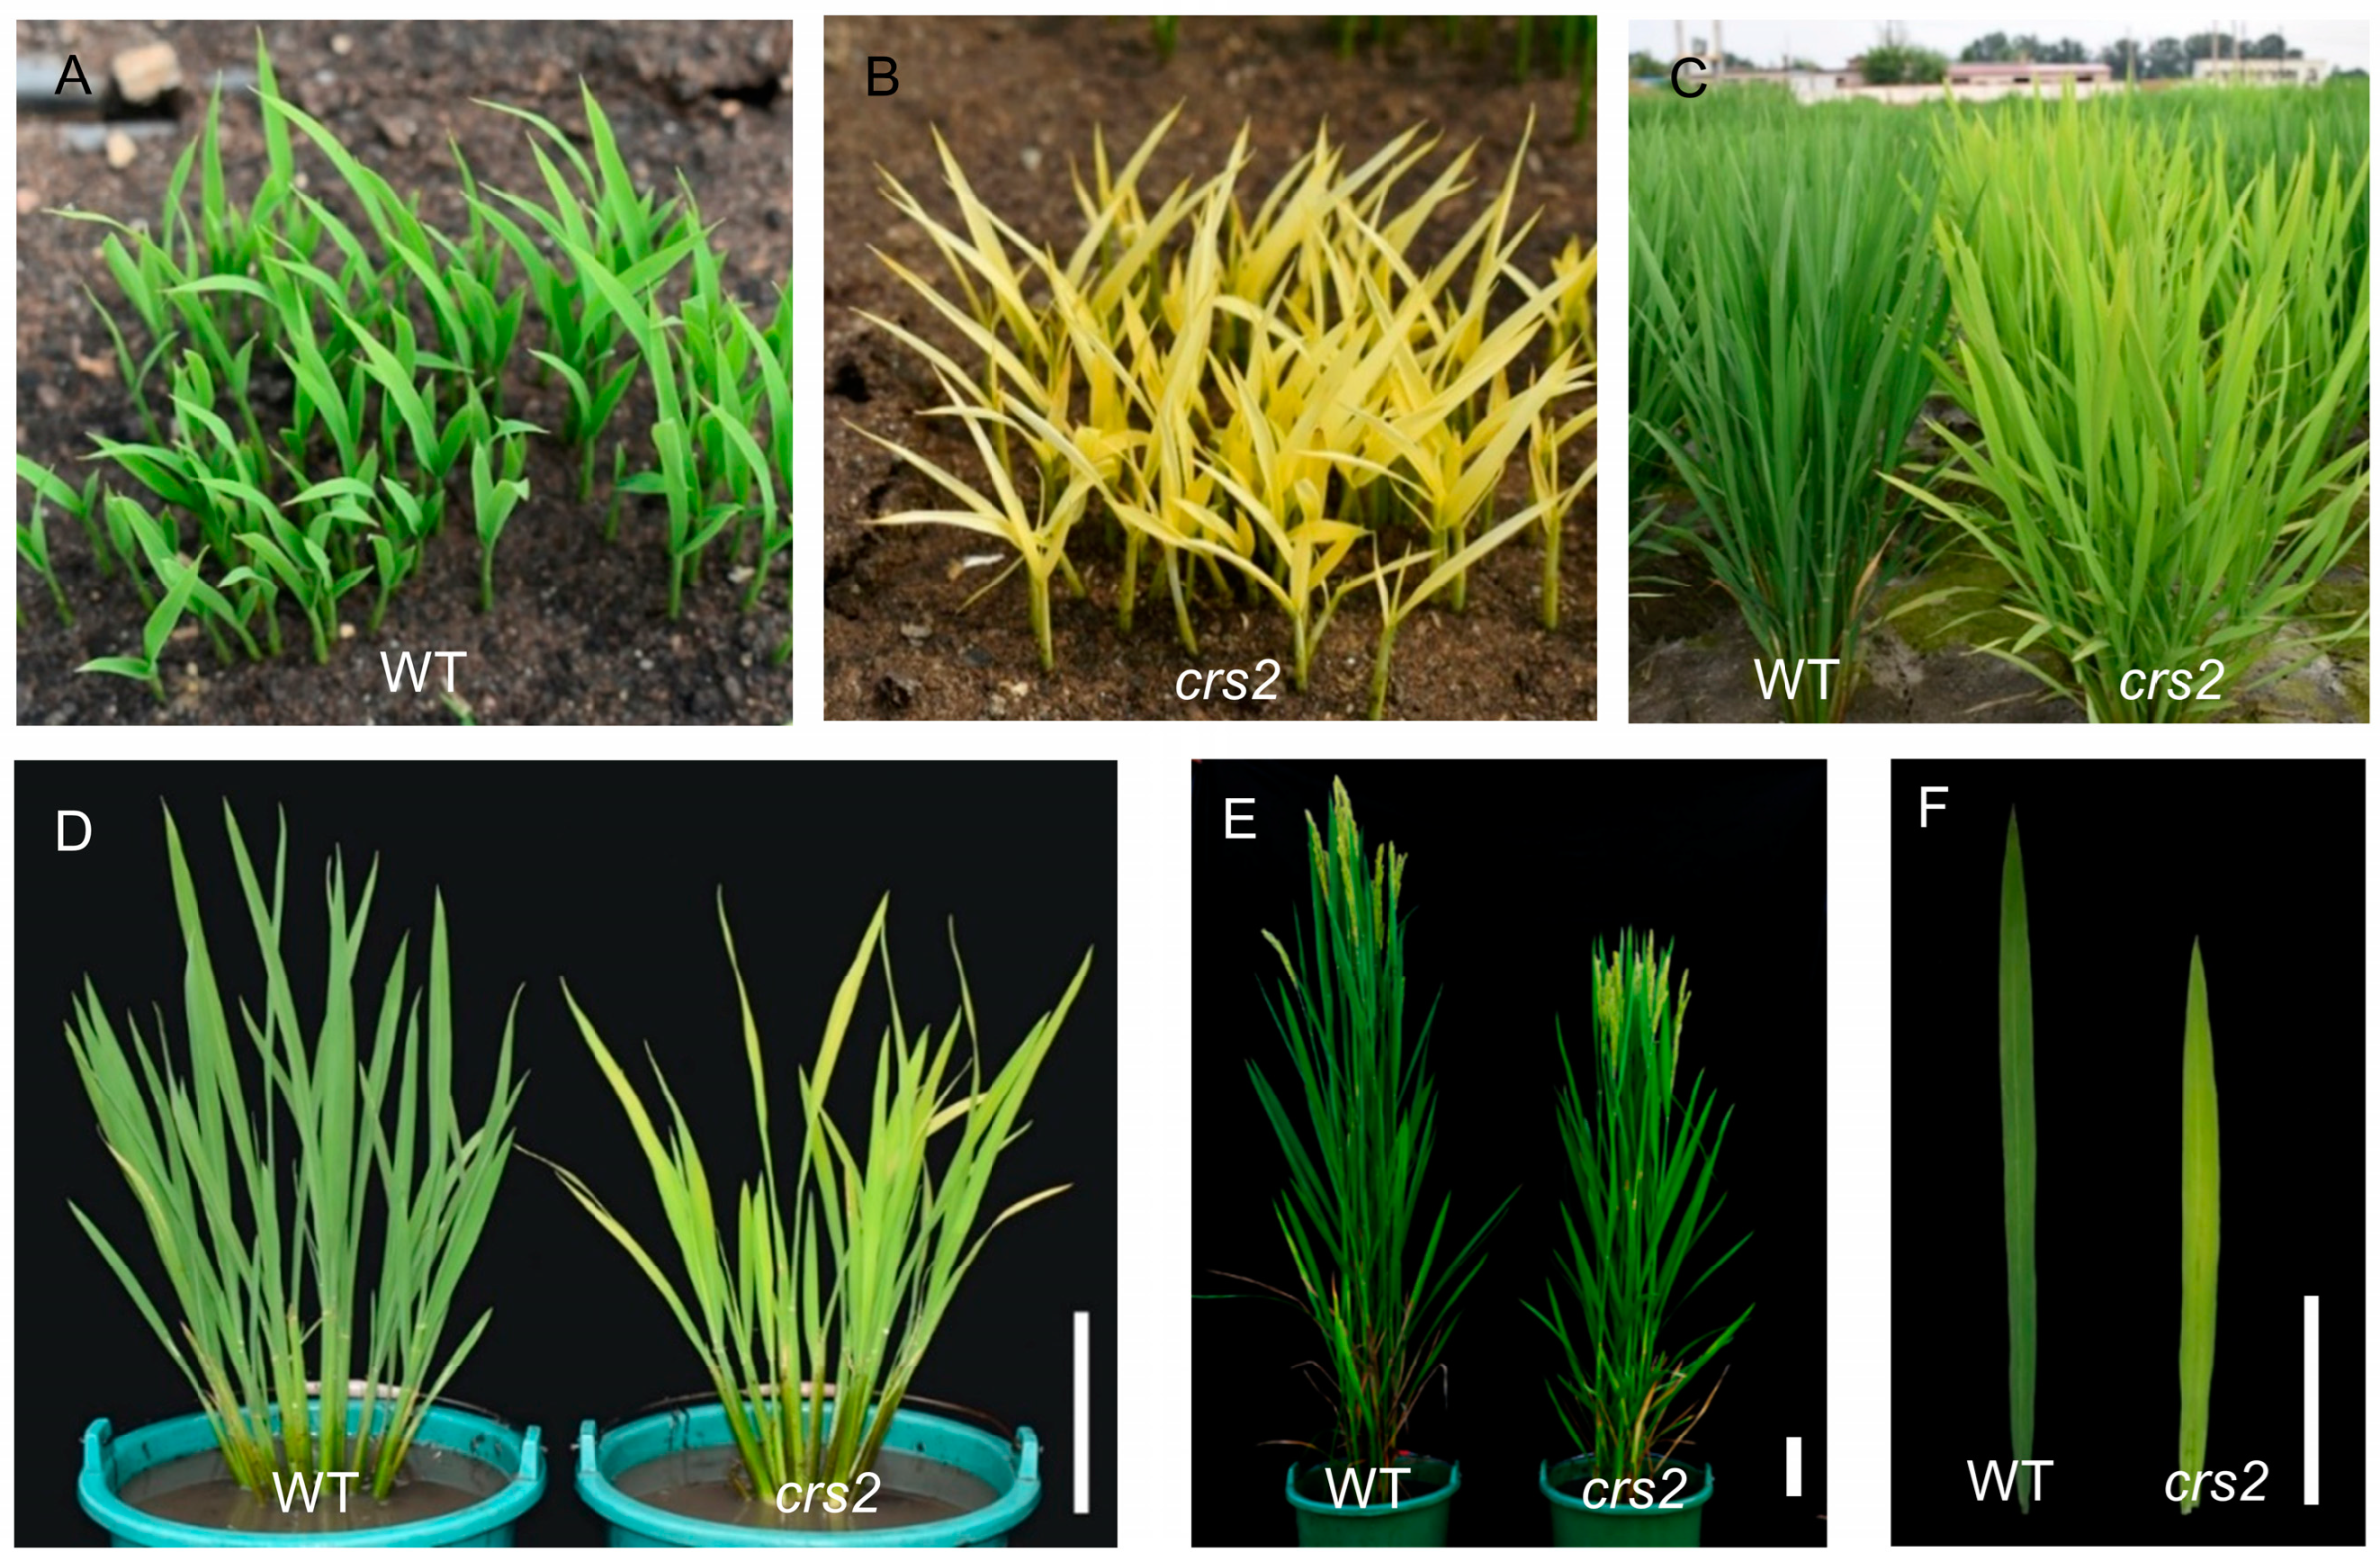
Figure 1. Phenotype and main agronomic traits of the WT and crs2. (A,B) Phenotypes of the WT and crs2 at the seedling stage (25 DAS). (C,D) Phenotypes of the WT and crs2 at the tillering stage (75 DAS). (E) Phenotypes of the WT and crs2 at the full-heading stage (110 DAS). (F) Flag leaves of the WT and crs2 at the heading stage. Bar = 10 cm.
Ijms 24 05796 g001
Figure 2. Analysis of chlorophyll biosynthesis and chloroplast development in the WT and crs2. (A) Chlorophyll content in the WT and crs2 at different stages. (B) Relative expression levels of genes related to chlorophyll biosynthesis and chloroplast development. HEMA (Os10g0502400); CHLD (Os03g0811100); PORA (Os04g0678700); CAO (Os10g0567400); V1 (Os03g0656900); V2 (Os03g0320900), virescent-2; TCD5 (Os05g0411200); WSL8 (Os05g0430200); TRXZ (Os08g0378900). (CH) Chloroplast ultrastructure images in the WT (CE) and crs2 (FH) plants. Bar = 1 μm. Cp, chloroplast; Thy, thylakoid lamella; OB, osmophilic body. Mean ± SD. ** extremely significance at p < 0.01 (Student’s t-test).
Ijms 24 05796 g002
Figure 3. Map-based cloning of CRS2 and transgenic complementation of the crs2 mutant. (A) CRS2 was mapped between markers W1 and W2 on chromosome 1. (B) Fine mapping of CRS2. The CRS2 locus was further mapped to a 53.9 kb region between markers W7 and W8. (C) Seven putative open-reading frames (ORFs) are located in this region. (D) Structure of the candidate gene Os01g0132800. The candidate gene Os01g0132800 comprises eight exons and seven introns, in which a single nucleotide G-to-A substitution occurs at position 4120 bp from the ATG start codon. The black rectangle represents the exon. (E) DNA sequencing peaks of the WT and crs2. (F) Domain analysis of the CRS2 protein. The CRS2 protein contains a PTH domain. (G) Functional complementation of CRS2 restored the phenotypes of the crs2. Bar = 10 cm. (H) Expression levels of CRS2 in the WT, crs2, COM-1 and COM-2 cells. (I) Content of pigment in the WT, crs2, COM-1 and COM-2. Mean ± SD. ** extremely significance at p < 0.01 (Student’s t-test).
Ijms 24 05796 g003
Figure 4. Tissue expression pattern of CRS2 and subcellular localization of the CRS2-GFP in rice protoplasts. (A) Relative expression levels of CRS2 in various tissues. (BE) β-glucuronidase (GUS) staining of leaves (B), stems (C), young leaves (D) and panicles (E) of transgenic rice expressing pCRS2::GUS. Bar = 1 cm. (F) Subcellular localization of the CRS2 protein. Rice protoplast transformed with p35S::CRS2::GFP and transformed with p35S::GFP as a control. Bar = 10 μm.
Ijms 24 05796 g004
Figure 5. Variations in photosynthesis-related gene expression levels. (A) Expression levels of 16S and 23S in the WT and crs2. (B) Relative expression levels of photosynthesis-related genes in the WT and crs2. (C) Western blots of proteins related to photosynthesis in the WT and crs2. β-actin was used as an internal control. Mean ± SD. ** extremely significance at p < 0.01 (Student’s t-test).
Ijms 24 05796 g005
Figure 6. Fluorescence parameters of the WT and crs2. (AD) Variations in the ΦPSII (A), qP (B), NPQ (C) and Fv/Fm (D). (E) Chlorophyll fluorescence image. Mean ± SD. ** extremely significance at p < 0.01, n.s., no significant (Student’s t-test).
Ijms 24 05796 g006
Figure 7. Variations in photosynthesis-related gas exchange parameters and enzyme activity in the WT and crs2. (A) Radar map of photosynthesis-related indicators, including net assimilation rate (An), intercellular CO2 concentration (Ci), transpiration rate (E), stomatal conductance (GS), carboxylation efficiency (CE) and the water use efficiency (WUE) per unit area of leaf surface area of the WT and crs2. (B) Rubisco activity. (C) FBA activity. (D) An of the WT and crs2 in response to light intensity. (E) Superoxide anion (O2) content. (F) H2O2 content. (G) MDA content. (H) SOD activity. (I) CAT activity. (J) POD activity. (K) APX activity. Mean ± SD. * significance at p < 0.05, ** extremely significance at p < 0.01, n.s., no significant (Student’s t-test).
Ijms 24 05796 g007
Disclaimer/Publisher’s Note: The statements, opinions and data contained in all publications are solely those of the individual author(s) and contributor(s) and not of MDPI and/or the editor(s). MDPI and/or the editor(s) disclaim responsibility for any injury to people or property resulting from any ideas, methods, instructions or products referred to in the content.