Article

The Expression Pattern of tRNA-Derived Small RNAs in Adult Drosophila and the Function of tRF-Trp-CCA-014-H3C4 Network Analysis

1
College of Animal Science and Technology, Sichuan Agricultural University, Chengdu 611130, China
2
Farm Animal Genetic Resources Exploration and Innovation Key Laboratory of Sichuan Province, Sichuan Agricultural University, Chengdu 611130, China
3
College of Veterinary Medicine, Sichuan Agricultural University, Chengdu 611130, China
*
Authors to whom correspondence should be addressed.
These authors have contributed equally to this work.
Int. J. Mol. Sci. 2023, 24(7), 6169; https://doi.org/10.3390/ijms24076169
Submission received: 15 February 2023 / Revised: 20 March 2023 / Accepted: 23 March 2023 / Published: 24 March 2023
(This article belongs to the Section Molecular Genetics and Genomics)

Abstract

:
tRNA-derived small RNAs (tsRNAs) are derived from tRNA and include tRNA halves (tiRNAs) and tRNA fragments (tRFs). tsRNAs have been implicated in a variety of important biological functions, such as cell growth, transcriptional regulation, and apoptosis. Emerging evidence has shown that Ago1-guided and Ago2-guided tsRNAs are expressed at 3 and 30 days in Drosophila and that tRF biogenesis in fruit flies affects tRNA processing and tRNA methylation. However, a wide analysis of tsRNA patterns in different ages of Drosophila have not been reported via the small RNA sequencing method. In the present study, tsRNAs of young (7 days) and old (42 days) Drosophila were sequenced and their expression characteristics were analysed. Then, a specific tRF (named tRF-Trp-CCA-014) was determined and was found to be conserved in fruit flies, mice, and humans. The expression patterns of tRF-Trp-CCA-014 in different tissues and stages of fruit flies and mice, and mouse NIH/3T3 cells were detected. Furthermore, mouse embryonic fibroblast NIH/3T3 cells were used as a model to analyse the function and targets of tRF-Trp-CCA-014. The RNA-seq data of six groups (Mimics, Mimic NC, Inhibitors, Inhibitor NC, Aging (adriamycin), and Control (Normal)) in mouse NIH3T3 cells were analysed. The results showed that the number of tsRNAs at 42 days (417) was more than at 7 days (288); thus, it was enriched with age. tRFs-1 were the most enriched, followed by 5′-tRFs and 3′-tRFs. Twenty-one differentially expressed tsRNAs were identified between 7 days and 42 days. Then, the conserved tRF tRF-Trp-CCA-014 was identified and found to accumulate in aged fruit flies and aged mouse NIH3T3 cells. RNA-seq data showed that most differentially expressed genes were involved in the immune system, cancer: overview, and signal translation. Furthermore, tRF-Trp-CCA-014 was found to bind to the 3′UTR of H3C4 in a dual-luciferase reporter gene assay. tRF-Trp-CCA-014 and H3C4 were detected in the cytoplasm of aged NIH3T3 cells by RNA in situ hybridization. These results suggest that the H3C4 gene is the target of tRF-Trp-CCA-014. This study will advance the current understanding of tRF roles and their implication in Drosophila and mouse studies.

1. Introduction

tRNA-derived small RNAs (tsRNAs) are a class of noncoding RNAs with important biological functions and include two major types: tRNA-derived fragments (tRFs) and tRNA halves (tiRNAs) [1,2]. Generally, tsRNAs have various mechanisms in biological processes, such as interacting with proteins to regulate gene expression [3], targeting genes to inhibit cancer cell proliferation and affect early neural development [4,5], and being involved in posttranscriptional methylation modification of tRNA [6]. To date, tsRNAs have been found to be expressed widely across a range of organisms: humans [4], Danio rerio [7], Caenorhabditis elegans [8], mice [9], Saccharomyces cerevisiae [10], and Drosophila melanogaster [11].
Based on the mapped positions of tRFs to tRNAs, there are four types: tRF-1, tRF-2, tRF-3, and tRF-5 [1,12,13,14]. tRF-1 (14–33 nt) is generated from the 3′ ends of the precursor tRNA. The 5′ end of tRF-1 matches the cut site of RNase Z, and the 3′ end matches an RNA polymerase III (RNA pol III) transcription termination signal. tRF-2 includes only the anticodon stem and loop tRNA. tRF-3 is generated from the 3′ ends of the mature tRNA and subclassified as tRF-3a (17–18 nt) and tRF-3b (19–22 nt). Furthermore, tRF-5 is produced from the 5′ ends of the mature tRNA and is subclassified as tRF-5a (14–16 nt), tRF-5b (22–24 nt), and tRF-5c (28–32 nt). tiRNAs (31–40 nt) are derived from specific cleavage in the anticodon loops of mature tRNA and classified as 5′-tiRNA or 3′-tiRNA. 5′-tiRNA begins from the 5′ end of mature tRNA and ends at the end of the anticodon loop, whereas 3′-tiRNA starts at the anticodon loop and ends at the 3′ end of the mature tRNA.
Drosophila is an important classic model organism for the study of human diseases and behaviours [15]. Recent studies have reported that tRFs bind to Argonaute (Ago) to function as miRNAs by combining the 3′ untranslated region (3′ UTR) sequence of the target gene mRNA [4,16]. In previous studies, the abundance of tRFs in complex with Ago1 and Ago2 was analysed to identify Ago1-guided and Ago2-guided fragments at 3 and 30 days in Drosophila [11,17]. However, that analysis had limitations and could not fully capture the expression profile of tRFs in Drosophila because tRFs have other mechanisms in addition to miRNA-like roles, such as binding proteins. Furthermore, the expression patterns of tRFs in Drosophila embryos and S2 cells have been determined and a small number of tRFs have been identified [18,19]. Thus, systematic and comprehensive research should be carried out at different ages in adult Drosophila.
In this study, tsRNAs of young (7 days old, 7 days) and old (42 days old, 42 days) Drosophila were sequenced and their expression characteristics were analysed. Then, a novel tRF was named tRF-Trp-CCA-014 and was significantly upregulated at 42 days in flies (it is conserved in Drosophila, mouse, and human). The transcriptomes of NIH/3T3 mouse embryonic fibroblasts were analysed after transfection of tRF-Trp-CCA-014 mimics (Mimics), tRF-Trp-CCA-014 inhibitor (Inhibitors), the negative control of tRF-Trp-CCA-014 mimics (Mimic NC), the negative control of tRF-Trp-CCA-014 inhibitor (Inhibitor NC), and in adriamycin-treated cells (aged cells, Aging (ADR)) and the corresponding control without ADR treating ((Control (Normal)), respectively. The results showed that tRF-Trp-CCA-014 had binding activity with the H3C4 gene. The results will advance the understanding of the expression pattern of tsRNAs in adult Drosophila and the function of tRF-Trp-CCA-014.

2. Results

2.1. Expression Pattern of Drosophila tsRNAs

For ten samples (five biological replicates for 7 days and 42 days, respectively), 64.6 M clean reads were obtained (NCBI SRA_PRJNA716466). The Q30 values ranged from 89.95–93.05%. A total of 487 tsRNAs (449 newly discovered and 38 known, Figure 1A) were identified, including tRF-1, tRF-2, tRF-3a, tRF-3b, tRF-5a, tRF-5b, tRF-5c, and tiRNA-5 (Dataset S1). Then, tRF-Asp-GTC (36 tRFs) and tRF-Glu-CTC (36 tRFs) were the most abundant types, followed by tRF-Gln-CTG (27 tRFs) and tRF-Val-CAC (25 tRFs). A total of 288 and 417 tsRNAs were identified at 7 days and 42 days, respectively. A total of 218 common tsRNAs were expressed at 7 days and 42 days. Among them, tRF-1, tRF-5a, tRF-5c, and tRF-3a were the main types (Figure 1B,C).
tRFs-1 had the highest abundance, followed by 3′-tRFs and 5′-tRFs. The length distribution of tsRNAs had similar patterns at 7 days (Figure 1D) and 42 days (Figure 1E). tRF-1 was distributed from 14 nt to 32 nt and focused on 19–21 nt and 25–27 nt. The length of tRF-2 was 14–15 nt. tRF-5a, tRF-5b, and tRF-5c were focused on 14–17 nt, 22–25 nt, and 28–32 nt, respectively. tRF-3a and tRF-3b were focused on 19–22 nt and 17–18 nt, respectively. In addition, tiRNA-5 was focused on 33–34 nt. However, there was a slight difference between 7 days and 42 days. The frequency of tRF-1 with 25 nt in 7 days was more than that in 42 days.
According to a fold change ≥1.5 and p ≤ 0.05, 18 tRFs were upregulated and 3 tsRNAs (1 tiRNA and 2 tRFs) were downregulated at 42 days compared with 7 days (Figure 1F,G, Dataset S1). In addition, 466 tRFs and tiRNAs were not significantly different between 7 days and 42 days. There were 18 upregulated tRFs, including 7 tRF-1, 2 tRF-3a, 2 tRF-5a, and 7 tRF-5b. Among those tRFs, 9 non-annotated and nine annotated tRFs were identified. Five tRFs (tRF-Ala-TGC-004, tRF-Ala-TGC-005, tRF-Ala-TGC-006, tRF-Trp-CCA-014, and tRF-Val-CAC-011) were conserved in mouse and fly. Specifically, tRF-Trp-CCA-014 was conserved in fly, mouse, human, fish, and Xenopus. Furthermore, there were three downregulated tRFs, tiRNA-Pro-CGG-001, tRF-Cys-GCA-014, and tRF-Val-CAC-016.

2.2. Verification of Differentially Expressed tsRNAs

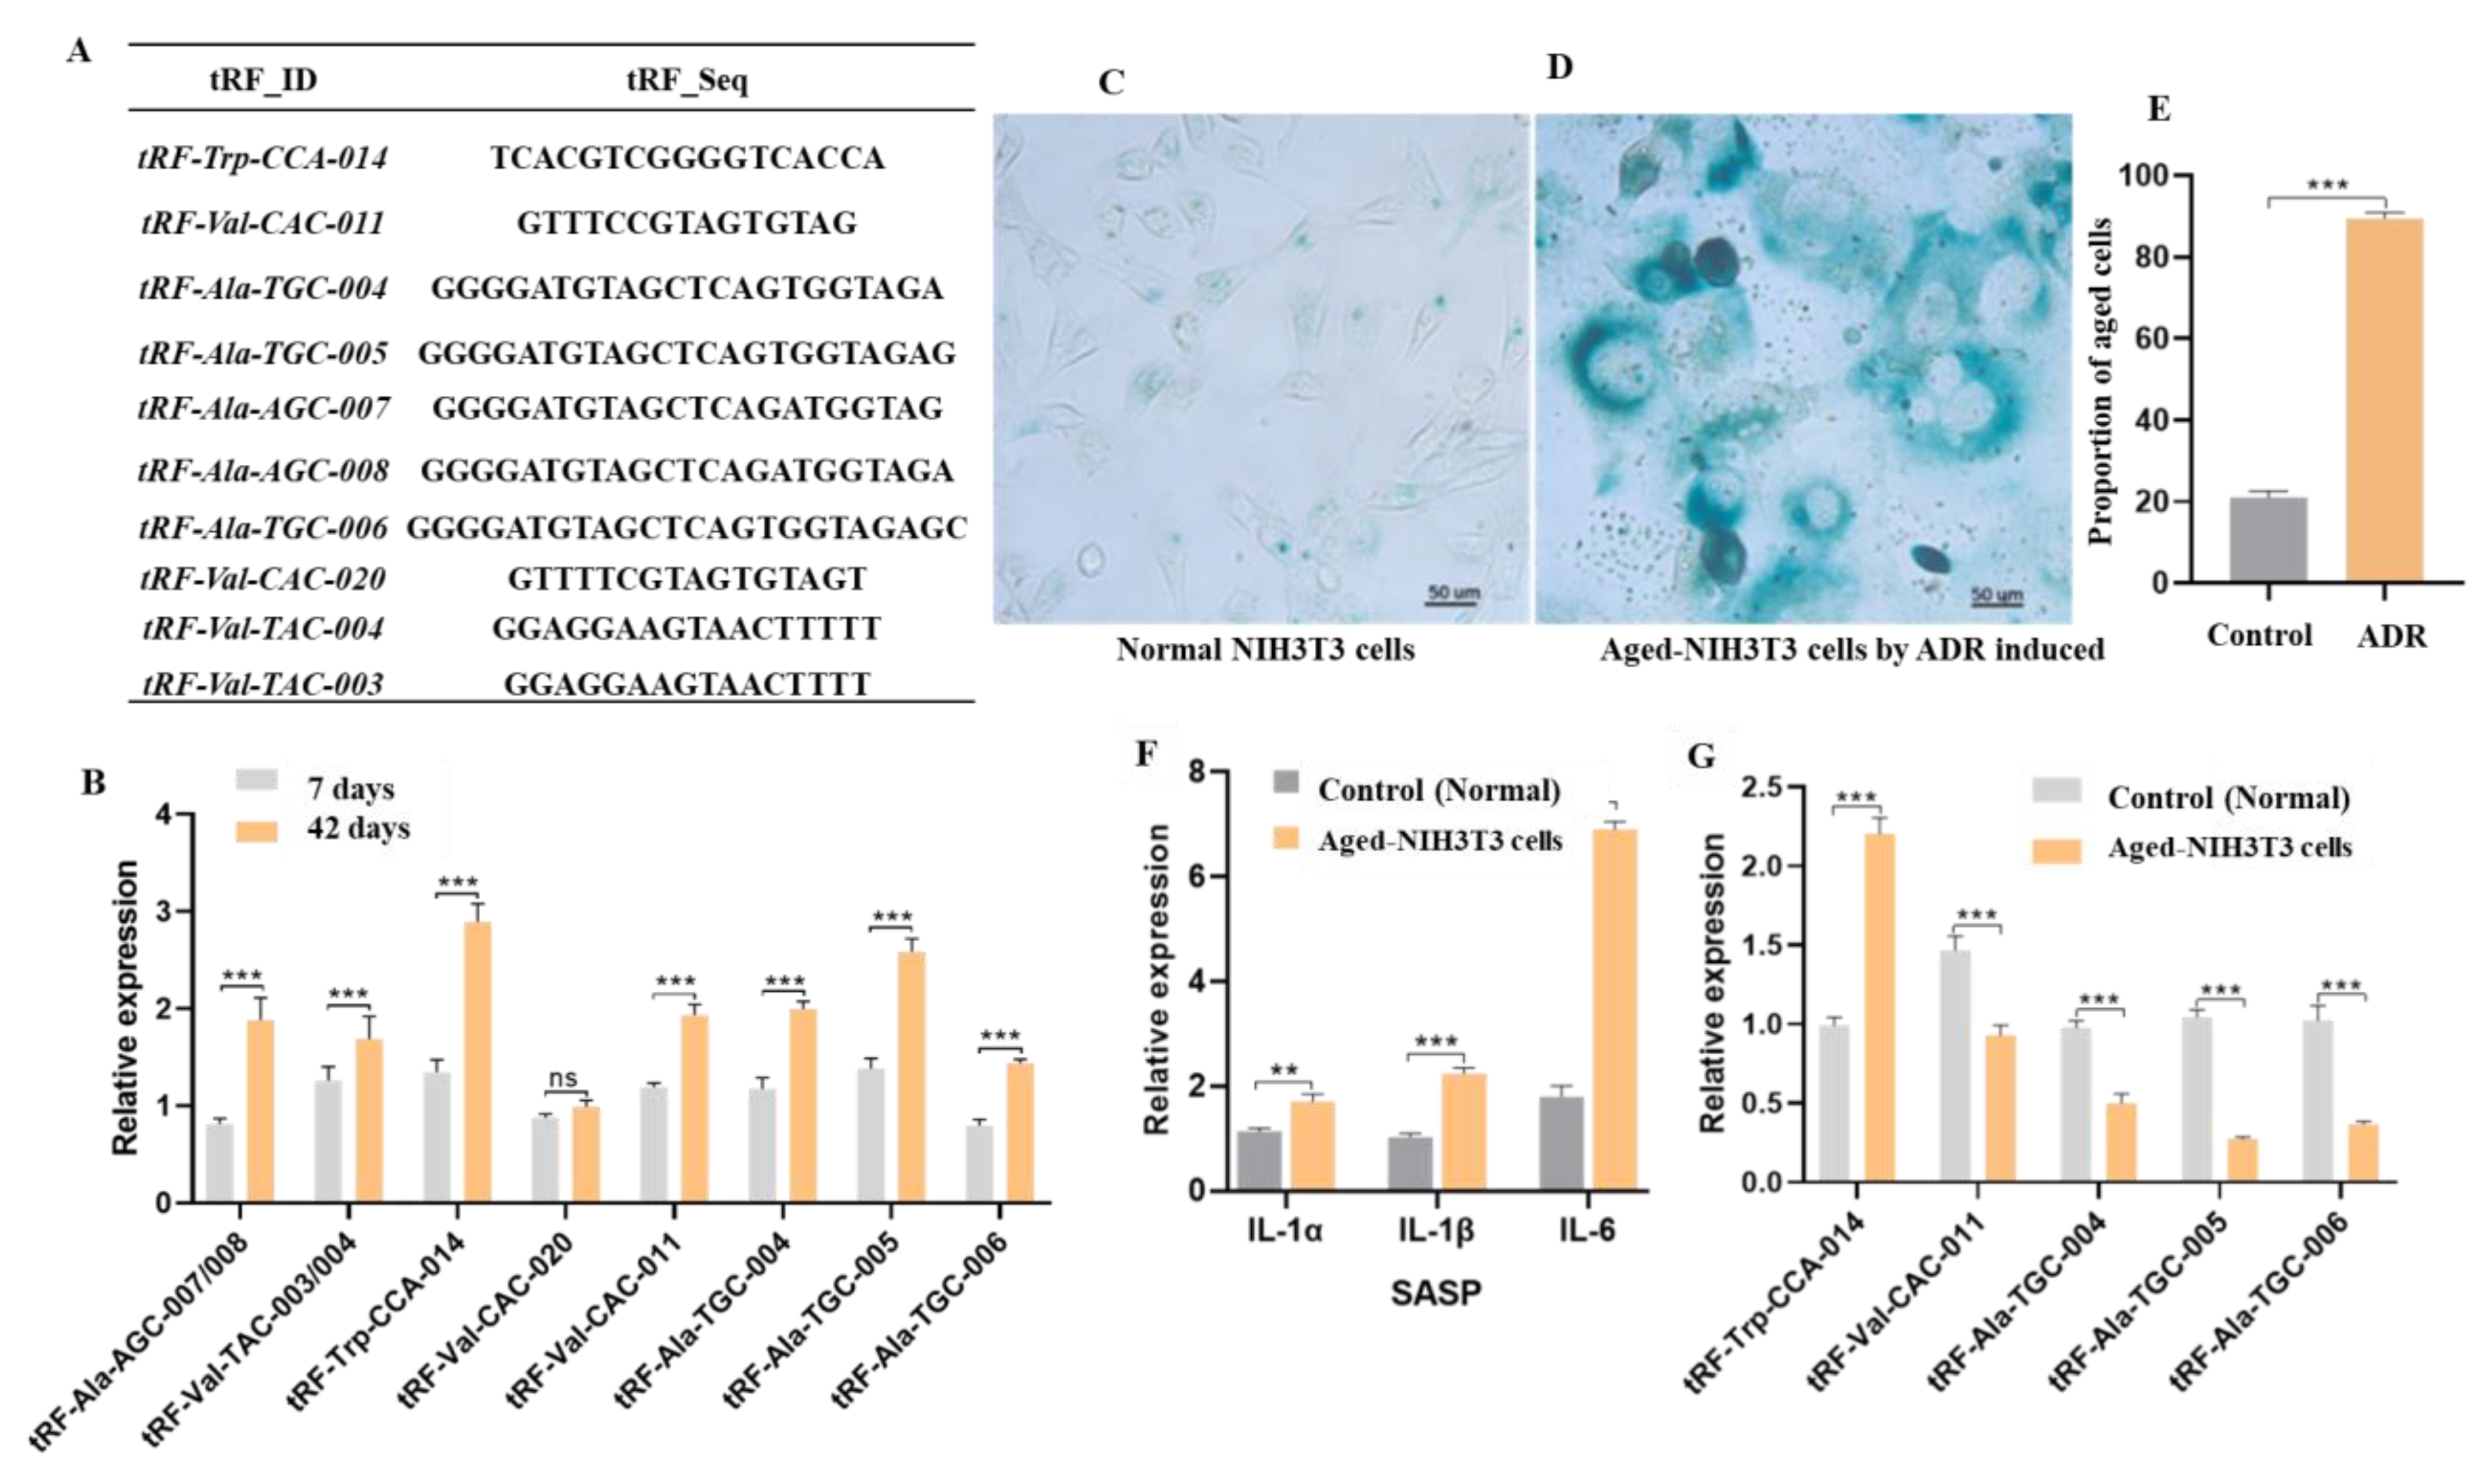
Because of tsRNA accumulation at 42 days (417 tsRNAs), this study focused on the upregulated tsRNAs at 42 days. Ten upregulated tRFs were chosen to test their expression by realtime fluorescence quantitative PCR (qPCR) (Figure 2A). The difference between the tRF-Val-TAC-003 and the tRF-Val-TAC-004 sequences was only one base and they were regarded as one gene if they could not be distinguished. The same situation was true for tRF-Ala-AGC-007 and tRF-Ala-AGC-008. The results show that the expression patterns of tRF-Ala-AGC-007/008, tRF-Val-TAC-003/004, tRF-Trp-CCA-014, tRF-Val-CAC-011, tRF-Ala-TGC-004, tRF-Ala-TGC-005, and tRF-Ala-TGC-006 by qPCR were consistent with the RNA-seq results (Figure 2B). There was no significant difference in the expression levels of tRF-Val-CAC-020 at 7 days and 42 days. Significantly, tRF-Trp-CCA-014 had the highest expression among these tRFs.
ADR is an anthracycline antineoplastic drug widely used to construct a model of mouse cell senescence [20]. The β-galactosidase activity and pro-inflammatory cytokines IL-1 and IL-6 are consistently present in the senescence-associated secretory phenotype (SASP) [21,22,23]. The β-gal staining (Figure 2C–E) and the expression levels of IL-1α, IL-1β, and IL-6 (Figure 2F) increased in aged mouse NIH3T3 cells. The above results show that the aged mouse NIH3T3 cell model was successfully built using ADR. Then, tRF-Trp-CCA-014 was quantified and found to be significantly higher in senescent cells than in normal cells (Figure 2G). Thus, tRF-Trp-CCA-014 was used as the subject of follow-up studies.

2.3. Expression Features of tRF-Trp-CCA-014

Based on bioinformatic analysis, tRF-Trp-CCA-014 (tRF-3a type, 17 bp) is conserved in Drosophila, mouse, human, zebrafish, and Xenopus tropicalis (Figure 3A). The length of tRF-Trp-CCA-014 was 17 bp in Drosophila and 18 bp in the other four species. The tRF-Trp-CCA-014 of Drosophila was derived from tRNA-Trp-CCA-1-1 and tRNA-Trp-CCA-2-1 in chr.2R (chromosome 2R) and the tRF-Trp-CCA-014 of mice was derived from chr.11 tRNA 1849-Trp-CCA, chr.11 tRNA 1820-Trp-CCA, chr.11 tRNA 398-Trp-CCA, chr.13 tRNA 109-Trp-CCA, chr.10 tRNA 857-Trp-CCA, chr.1 tRNA 107-Trp-CCA, and chr.10 tRNA 1282-Trp-CCA. Human tRF-Trp-CCA-014 was derived from chr.7 tRNA 1-Trp-CCA, chr.12 tRNA 6-Trp-CCA, chr.17 tRNA6-Trp-CCA, chr.6 tRNA 168-Trp-CCA, chr.6 tRNA170-Trp-CCA, and chr.17 tRNA39-Trp-CCA.
The expression patterns of tRF-Trp-CCA-014 in different developmental stages and tissues (42 days) were quantified. Throughout the developmental cycle, tRF-Trp-CCA-014 was mainly expressed in the third larval and pupal stages (Figure 3B). The expression level of tRF-Trp-CCA-014 began to increase at 42 days and the accumulation at 49 days was significantly higher than that at 42 days in the adult stage (Figure 3C). Its expression level was significantly higher in the head and fat body than in the gut and ovary of Drosophila (Figure 3D). Furthermore, tRF-Trp-CCA-014 was mainly expressed in the cytoplasm of mouse NIH3T3 cells (Figure 3E). The expression level of tRF-Trp-CCA-014 in tissues from 5-month- and 9-month-old young mice was detected; it was upregulated in the thigh muscle, the liver, and the brain of 19-month-old mice when compared with 5-month-old young mice (Figure 3F).

2.4. RNA-seq of Mouse NIH3T3 Cells

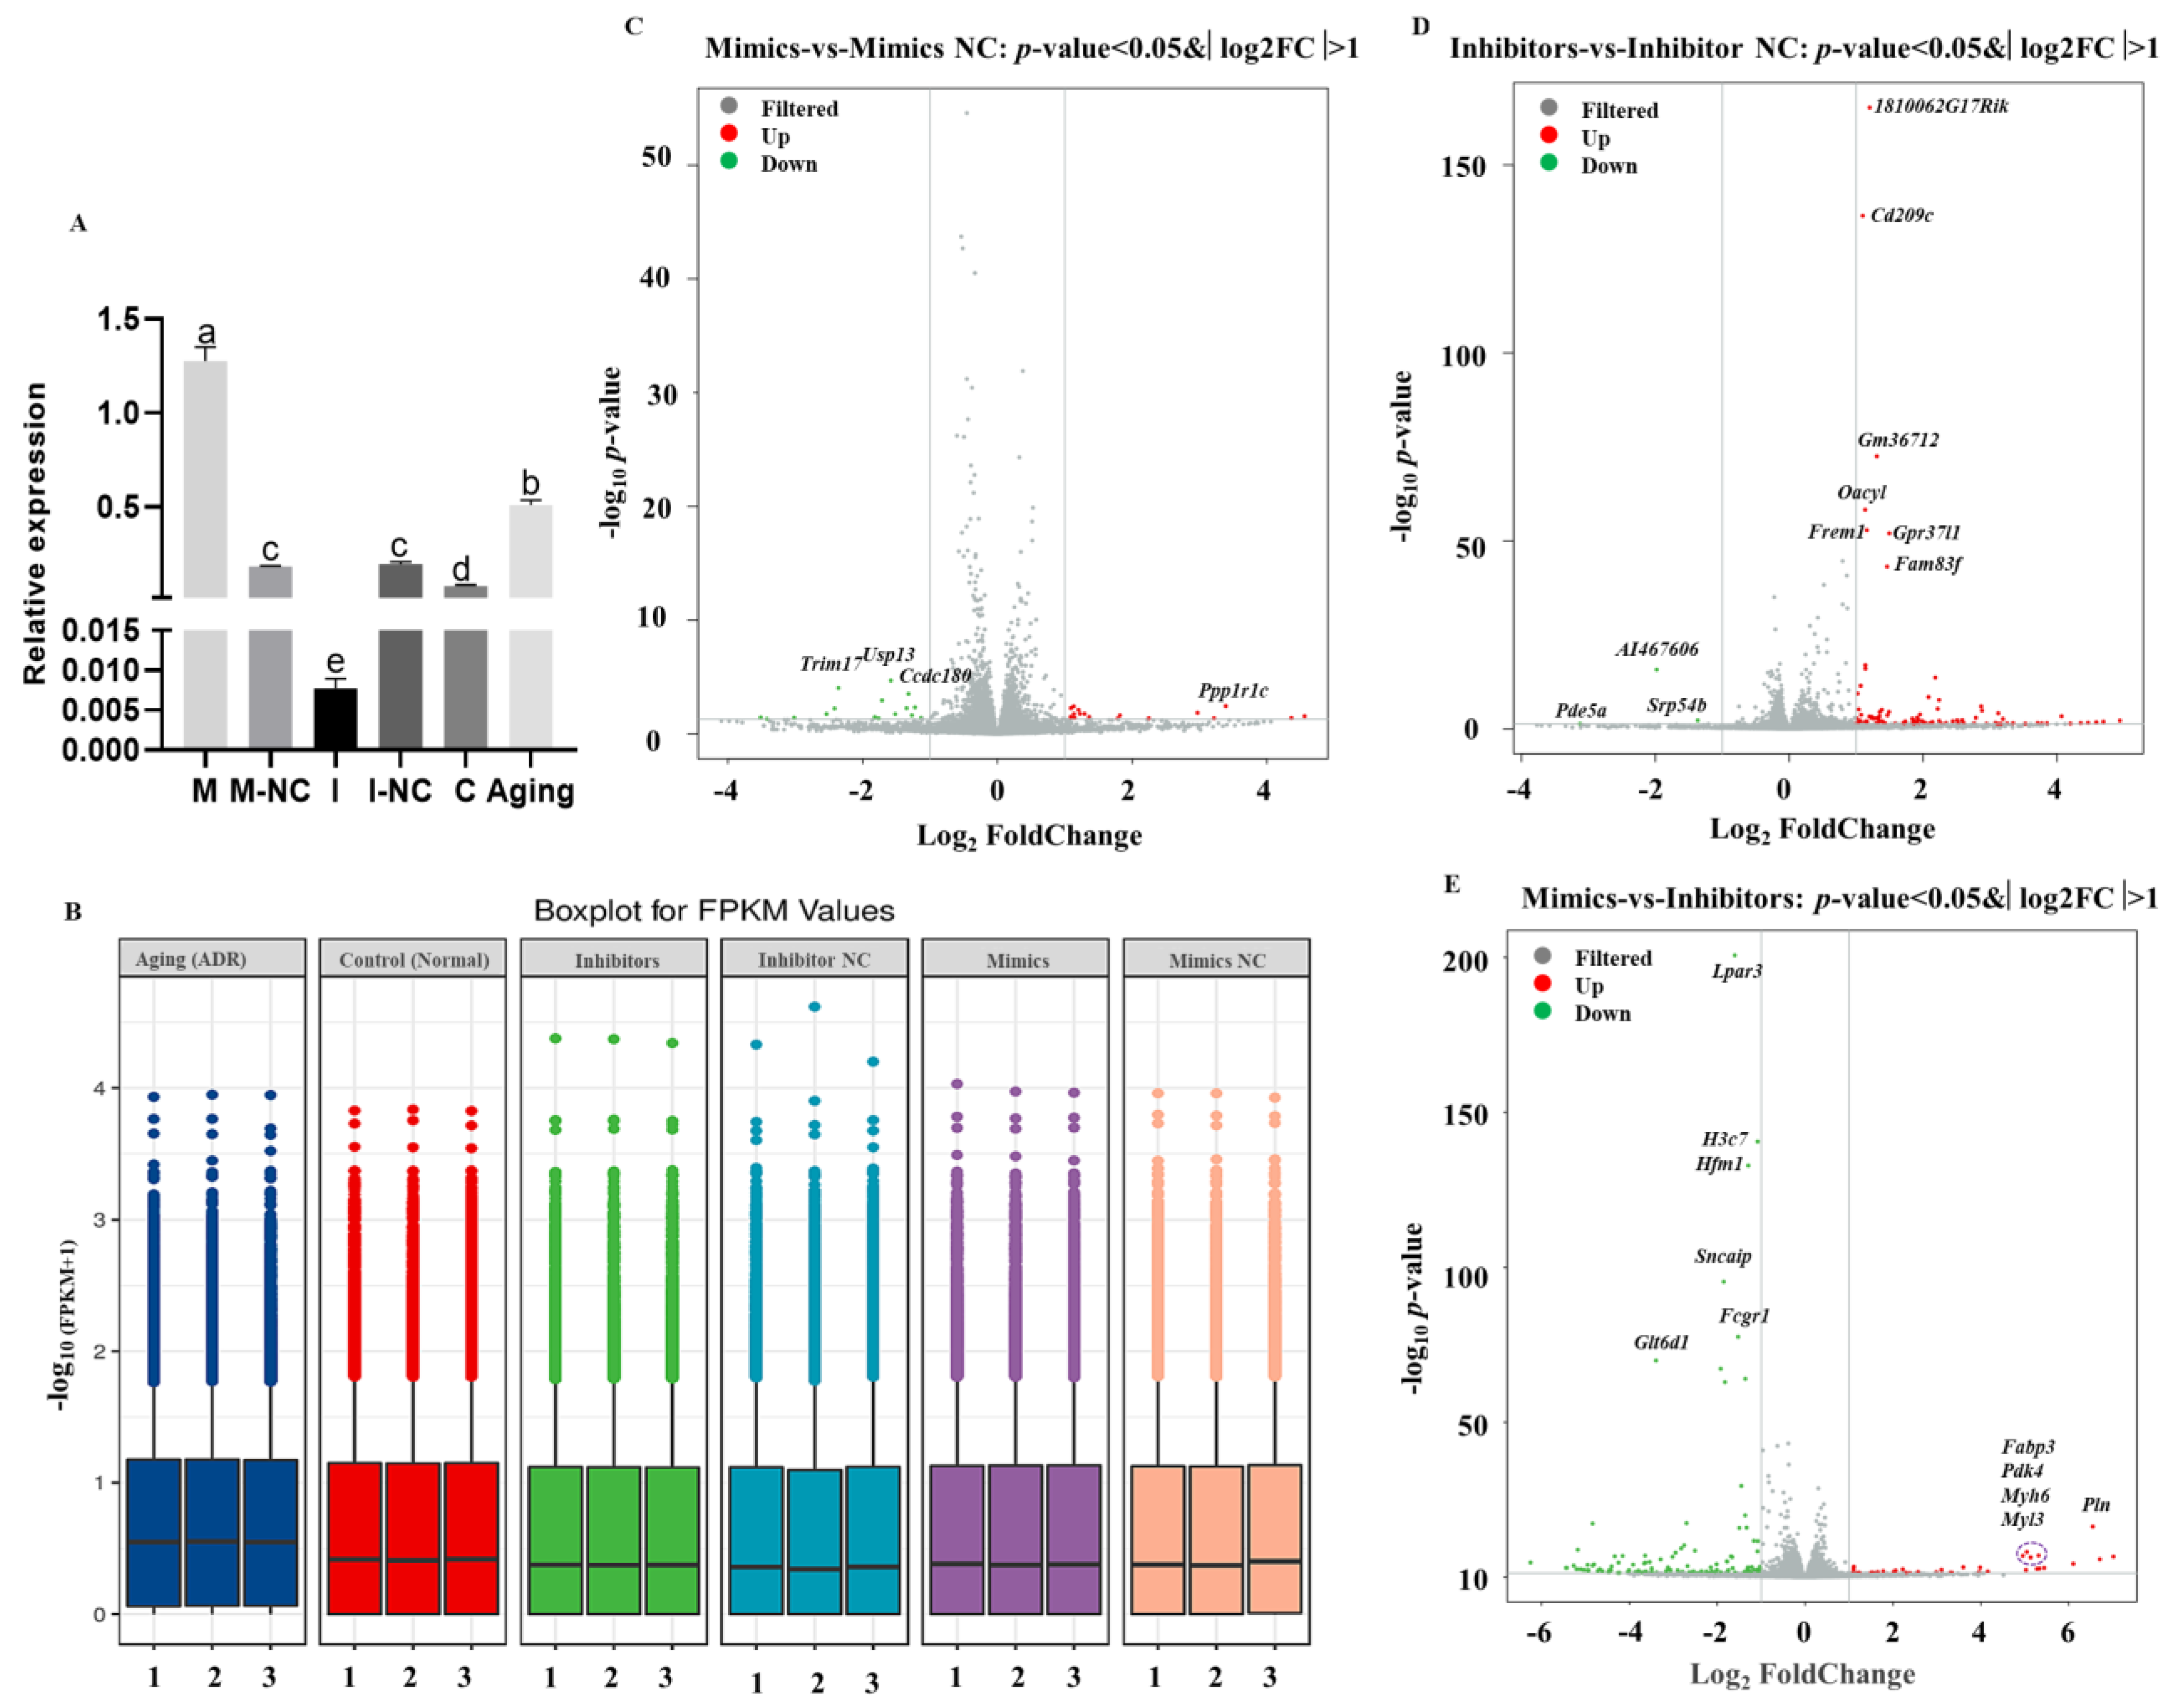
The mimics and inhibitors of tRF-Trp-CCA-014 were successfully transfected into mouse NIH3T3 cells to overexpress and knock down the gene expression level, respectively (Figure 4A). The results showed that tRF-Trp-CCA-014 cannot induce NIH3T3 cell senescence (Figure S1). The β-gal staining and expression level of p16 protein were not changed after transfection of the mimics and inhibitors of tRF-Trp-CCA-014 (Figure S1). Then, transcriptomes were analysed for six groups (Mimics, Mimic NC, Inhibitors, Inhibitor NC, Aging (ADR), and Control (Normal)) by RNA-seq. A total of 123.62 G of clean data were obtained (Dataset S2). The effective data volume of each sample was 6.03–7.28 G (NCBI SRA_PRJNA934729). The Q30 base was distributed in 93.23–95.41% of the transcriptome and the average GC content was 51.21%. By aligning the reads to the reference genome, the alignment rate was 87.66–92.40%. The fragments per kilobase million, fragments per kilobase of exon model per million mapped fragments (FPKM) value patterns of different groups were similar (Figure 4B).
Based on p < 0.05 and f|log2FC| > 1, differentially expressed genes (DEGs) were identified (Dataset S3). There were 33 (17 upregulated and 16 downregulated in the Mimics group, Figure 4C), 104 (101 upregulated and 3 downregulated in the Inhibitors group, Figure 4D), and 172 (39 upregulated and 133 downregulated in the Mimics group, Figure 4E) DEGs among the Mimics vs. Mimic NC groups, Inhibitors vs. Inhibitor NC groups, and Mimics vs. Inhibitors groups, respectively. The most DEGs, 5316 were identified between the ADR treatment group (ageing) and the Control group (normal).

2.5. KEGG and GO Enrichment of DEGs

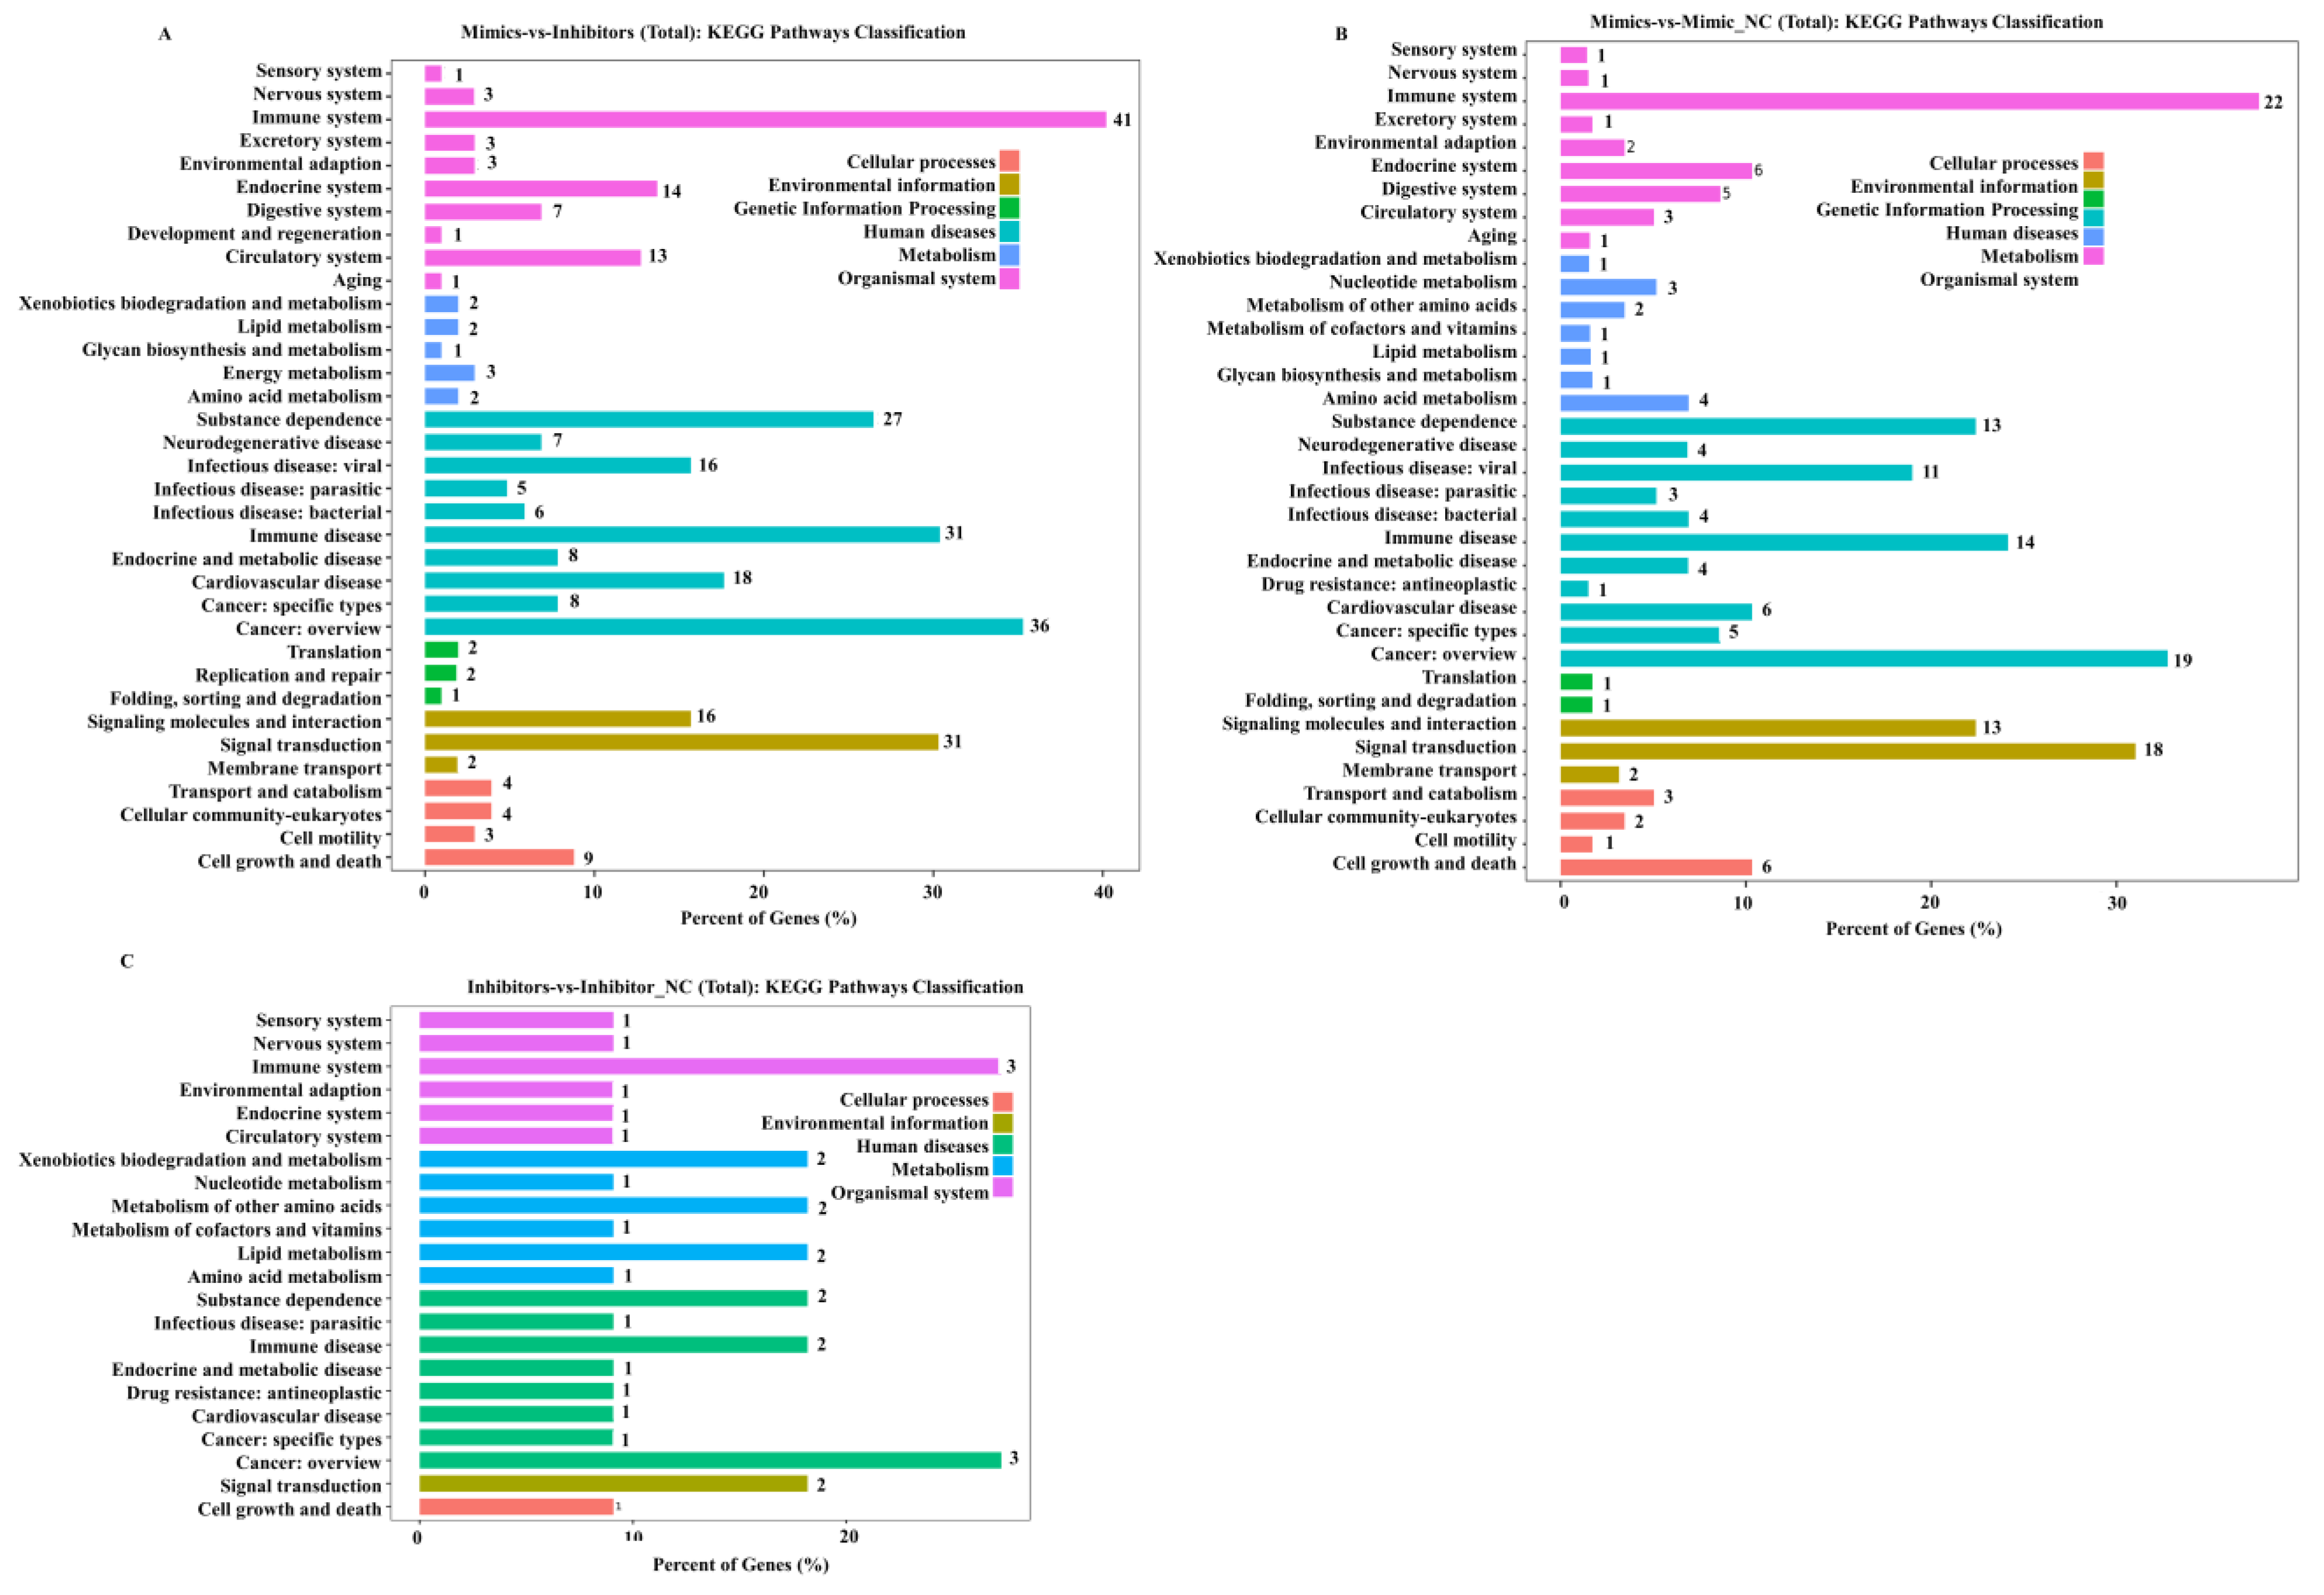
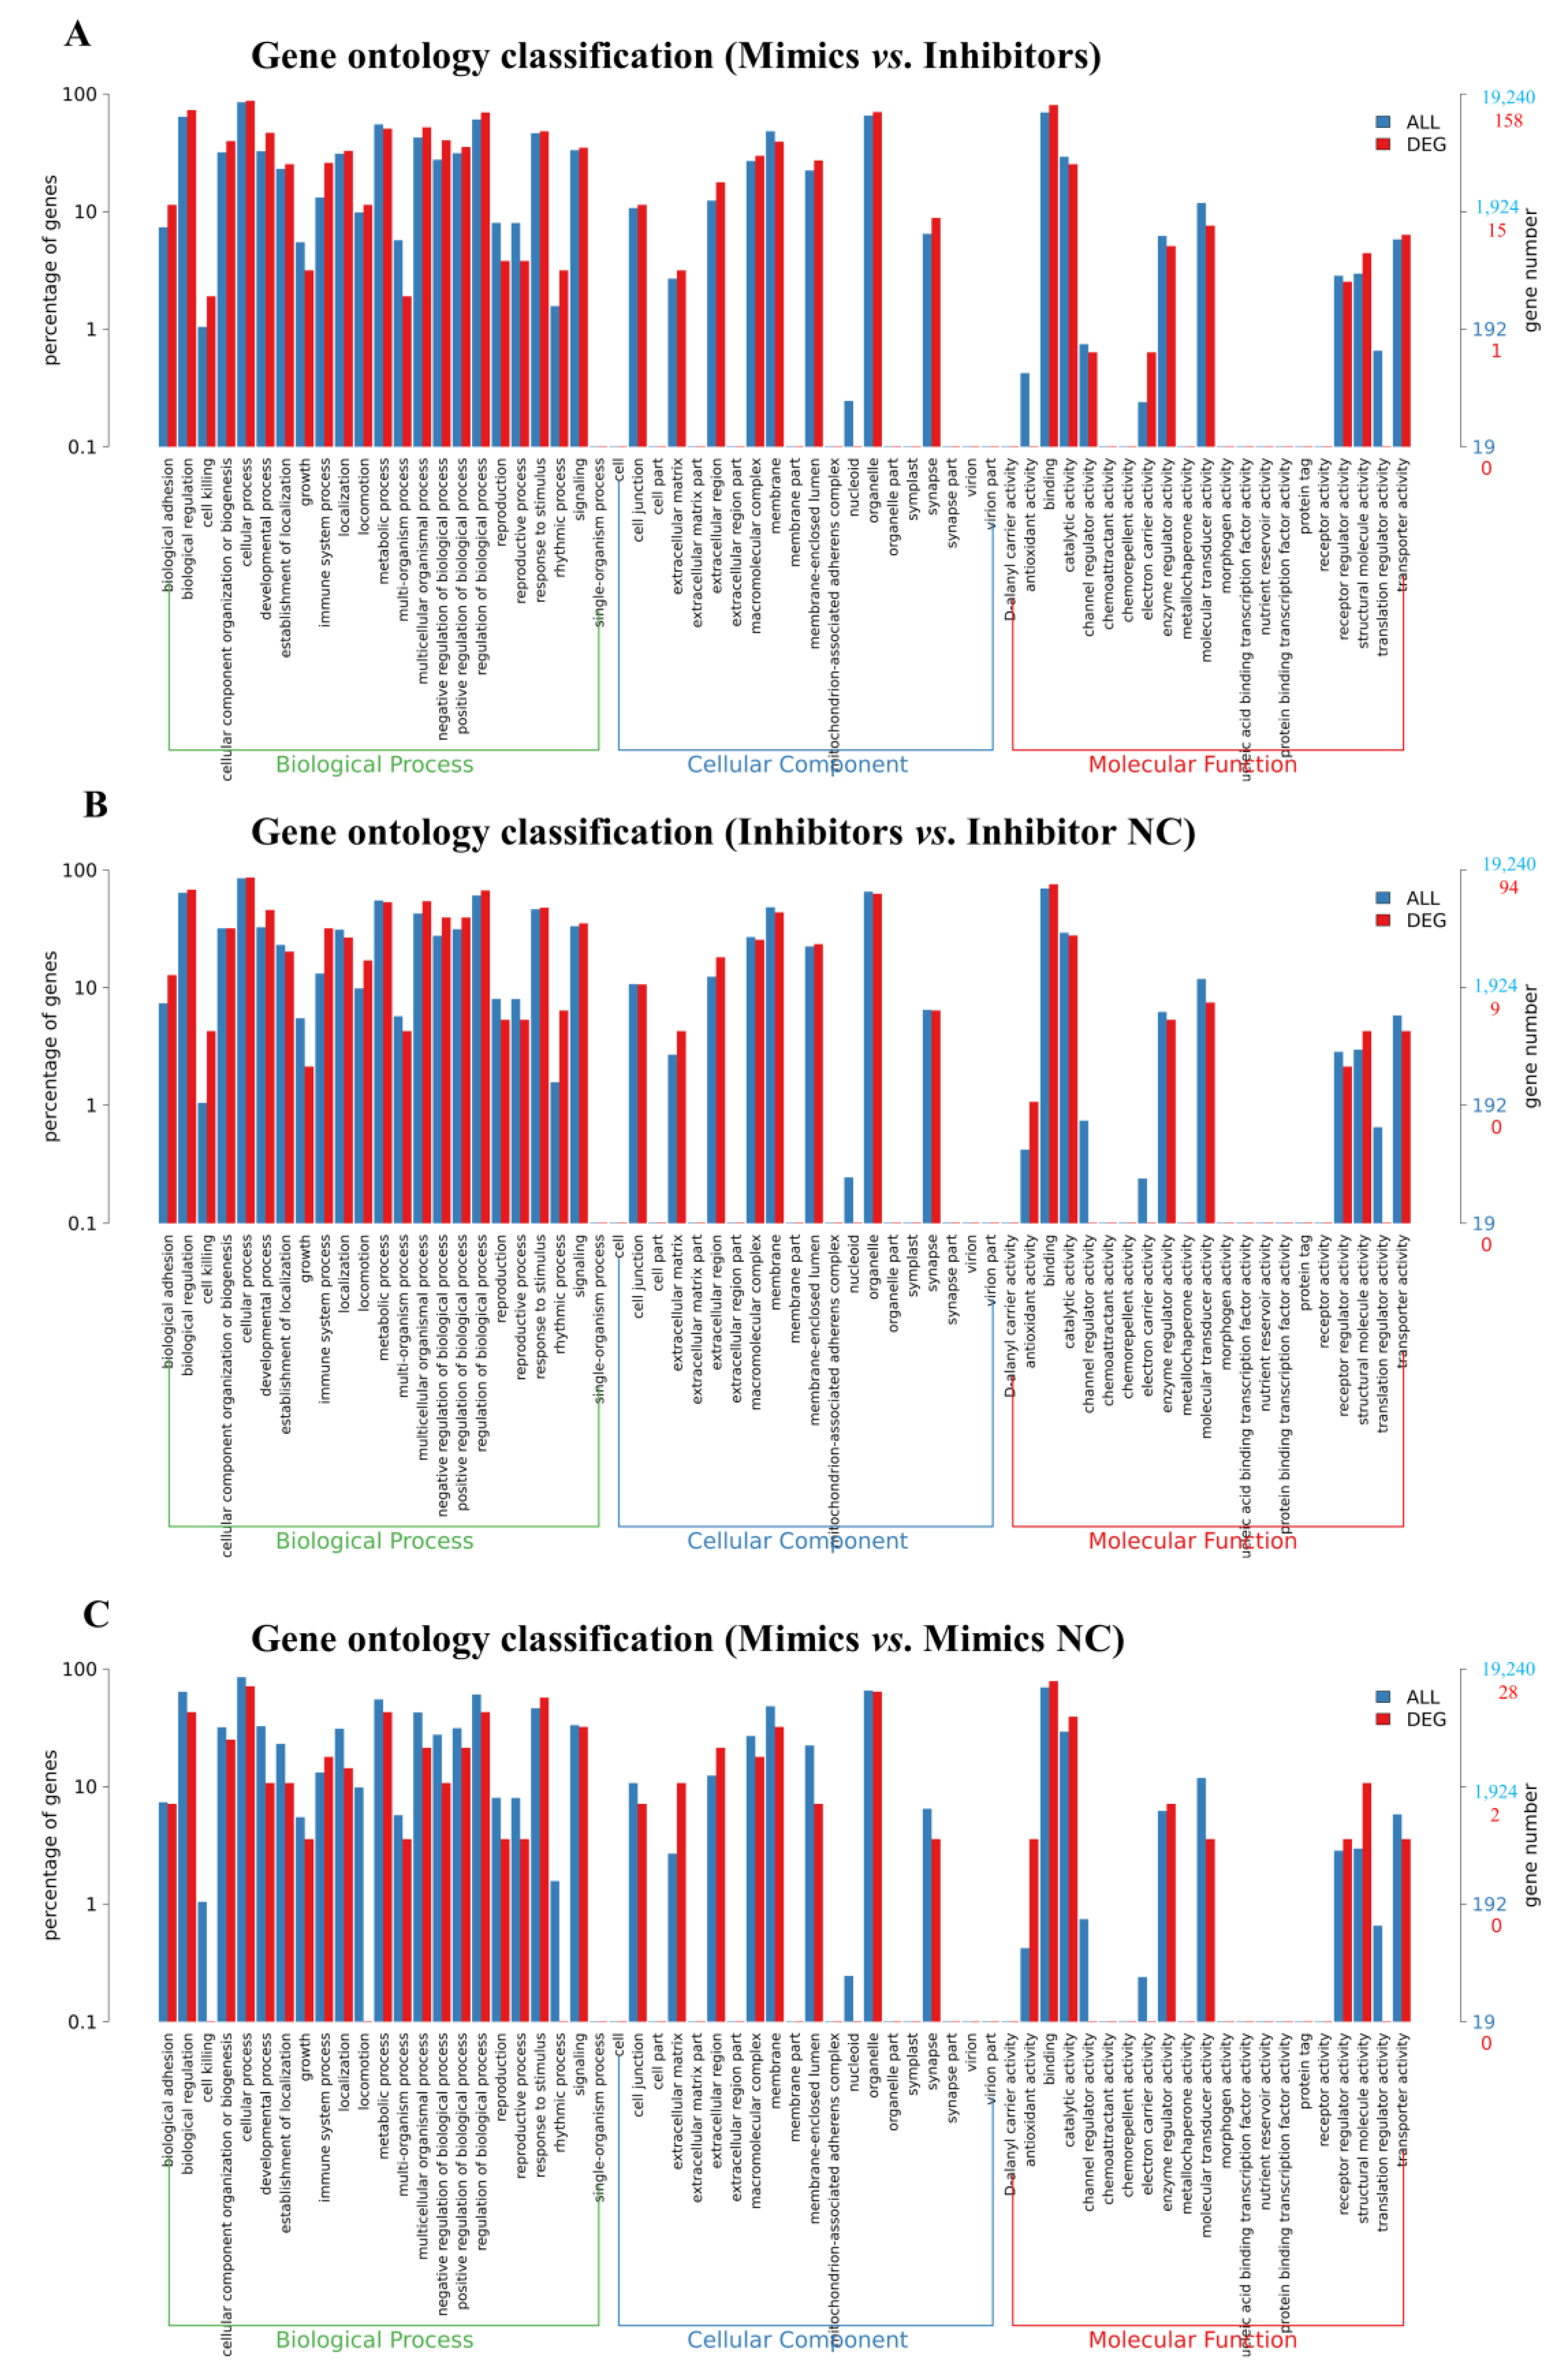
KEGG and GO enrichment analyses of the identified DEGs were performed. The overlapping KEGG signalling pathways (Dataset S4) were enriched in cellular processes, environmental information, genetic information processing, human diseases, metabolism, and organismal systems among Mimics vs. Inhibitors groups (Figure 5A), Mimics vs. Mimic NC groups (Figure 5B), and Inhibitors vs. Inhibitor NC groups (Figure 5C). The signalling pathways associated with the most DEGs focused on the immune system, cancer: overview, and signal translation. Furthermore, the results showed that most DEGs were enriched in similar biological processes in GO analysis (Dataset S3) among Mimics vs. Inhibitors groups (Figure 6A), Inhibitors vs. Inhibitor NC groups (Figure 6B), and Mimics vs. Mimic NC groups (Figure 6C). The most enriched biological process terms included “biological regulation”, “cellular process”, “metabolic process”, “regulation of biological process”, and “signalling”; the cellular component terms included “macromolecular complex”, “membrane”, “membrane-enclosed lumen”, and “organelle”; the molecular function terms included “binding”, “catalytic activity”, “molecular transducer activity”, and “transporter activity”.

2.6. Analysis of tRF-Trp-CCA-014 Targets

Targets of tRF-Trp-CCA-014 were screened through two methods based on the DEGs from the RNA-seq data of mouse NIH3T3 cells.
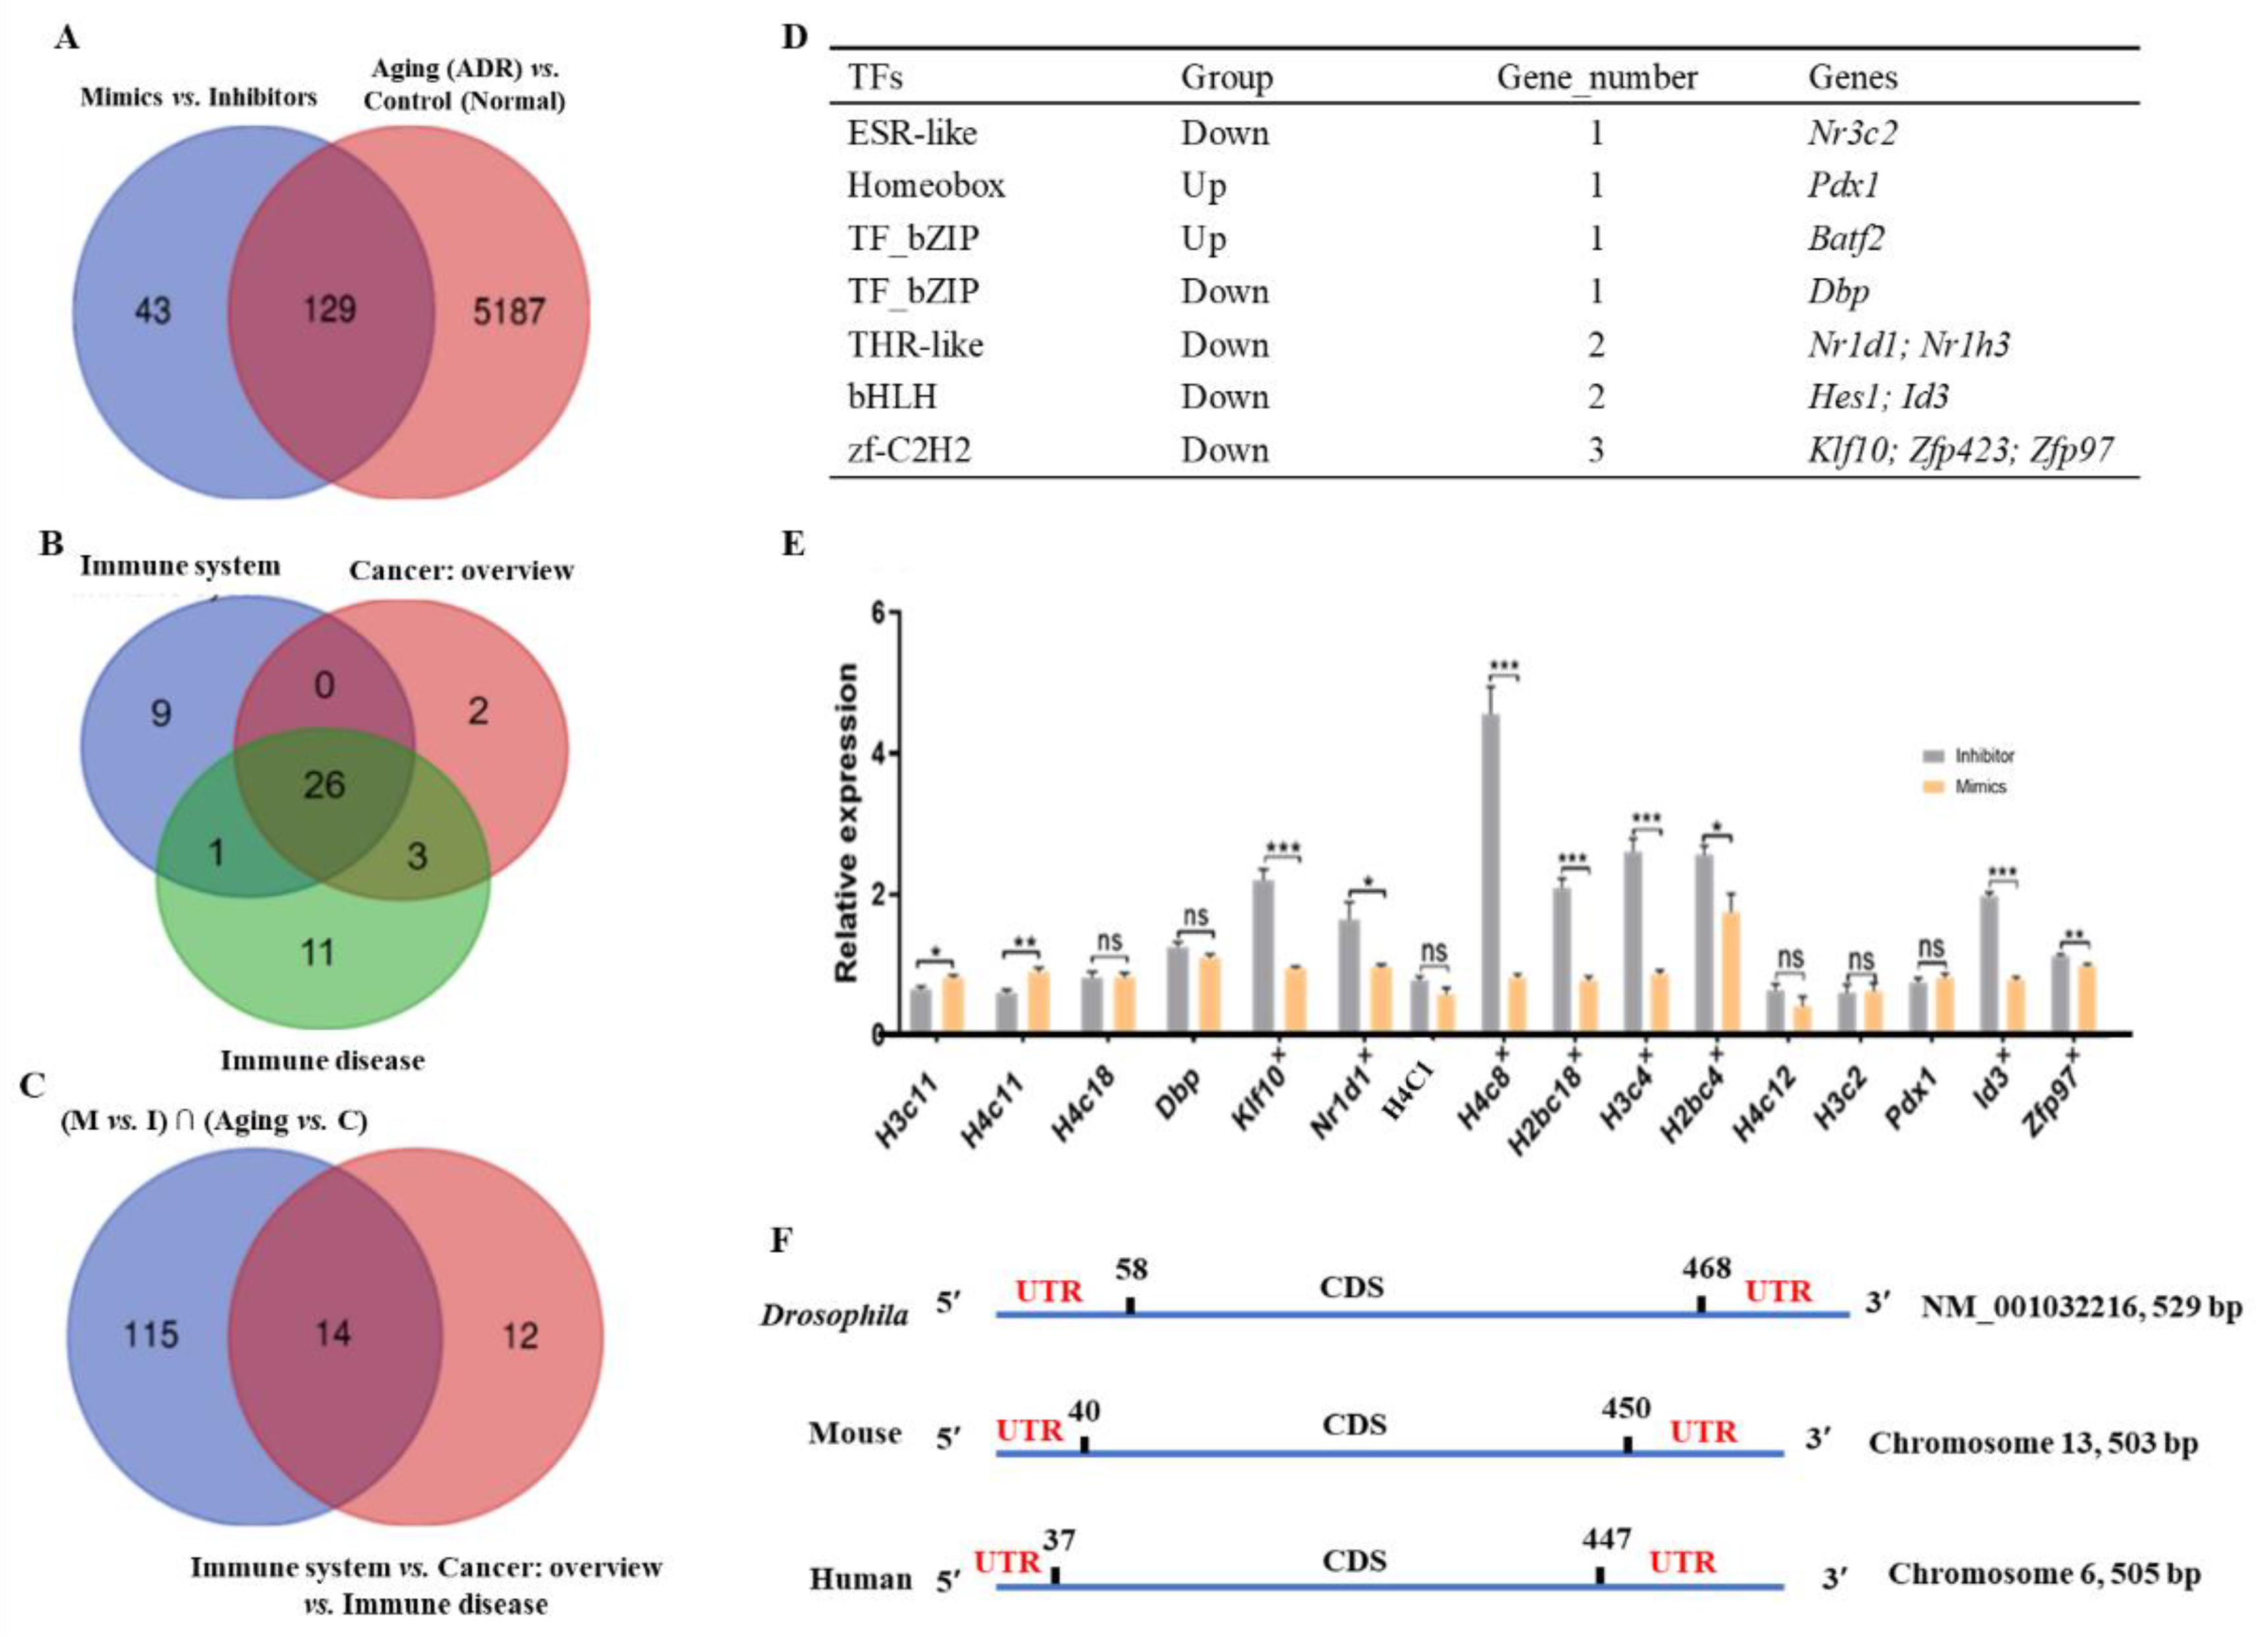
The functional DEGs were utilized for screening. First, 129 functional DEGs were identified from the overlapping genes between 5316 DEGs (Aging (ADR) vs. Control (Normal)) and 172 DEGs (Mimics vs. Inhibitors) (Figure 7A). Second, 26 common functional DEGs were enriched in immune system, cancer: overview, and immune disease (Figure 7B). Finally, 14 functional DEGs were identified in the intersection of two sets (129 common DEGs vs. 26 DEGs), including H4C11, H4C1, H4C18, Fcgr1, H4C8, H2bc6, H2bc18, H3C4, H2bc4, H3C11, H4C12, H3C2, H4C9, and H4C14 (Figure 7C).
Additionally, the DEGs of transcription factor families were used to select the targets of tRF-Trp-CCA-014. Previous studies reported that tsRNAs are involved in DNA-binding transcription factor activity and protein binding in endometriosis patients [24]. In the present study, by comparing the DEGs of the transcription factor families of the Mimics vs. Inhibitors groups, 11 transcription factor genes of six families had significant changes in the Inhibitors group, including 2 upregulated genes (Pdx1 and Batf2) and 9 downregulated genes (Figure 7D).
Finally, 16 targets were selected randomly for verification by qPCR, including H3C11, H4C11, H4C18, Dbp, Klf10, and Nr1d1. The results showed that the expression levels of eight targets (Klf10, Nr1d1, H4C8, H2bc18, H3C4, H2bc4, Id3, and Zfp97) were consistent with the RNA-seq results (Figure 7E). In addition, the H3C4 gene was conserved in humans, mice, and Drosophila, with 90.51% sequence similarity (Figure 7F). Thus, the targeting relationship between tRF-Trp-CCA-014 and H3C4 was selected for further study.

2.7. Analysis of the tRF-Trp-CCA-014-H3C4 Network

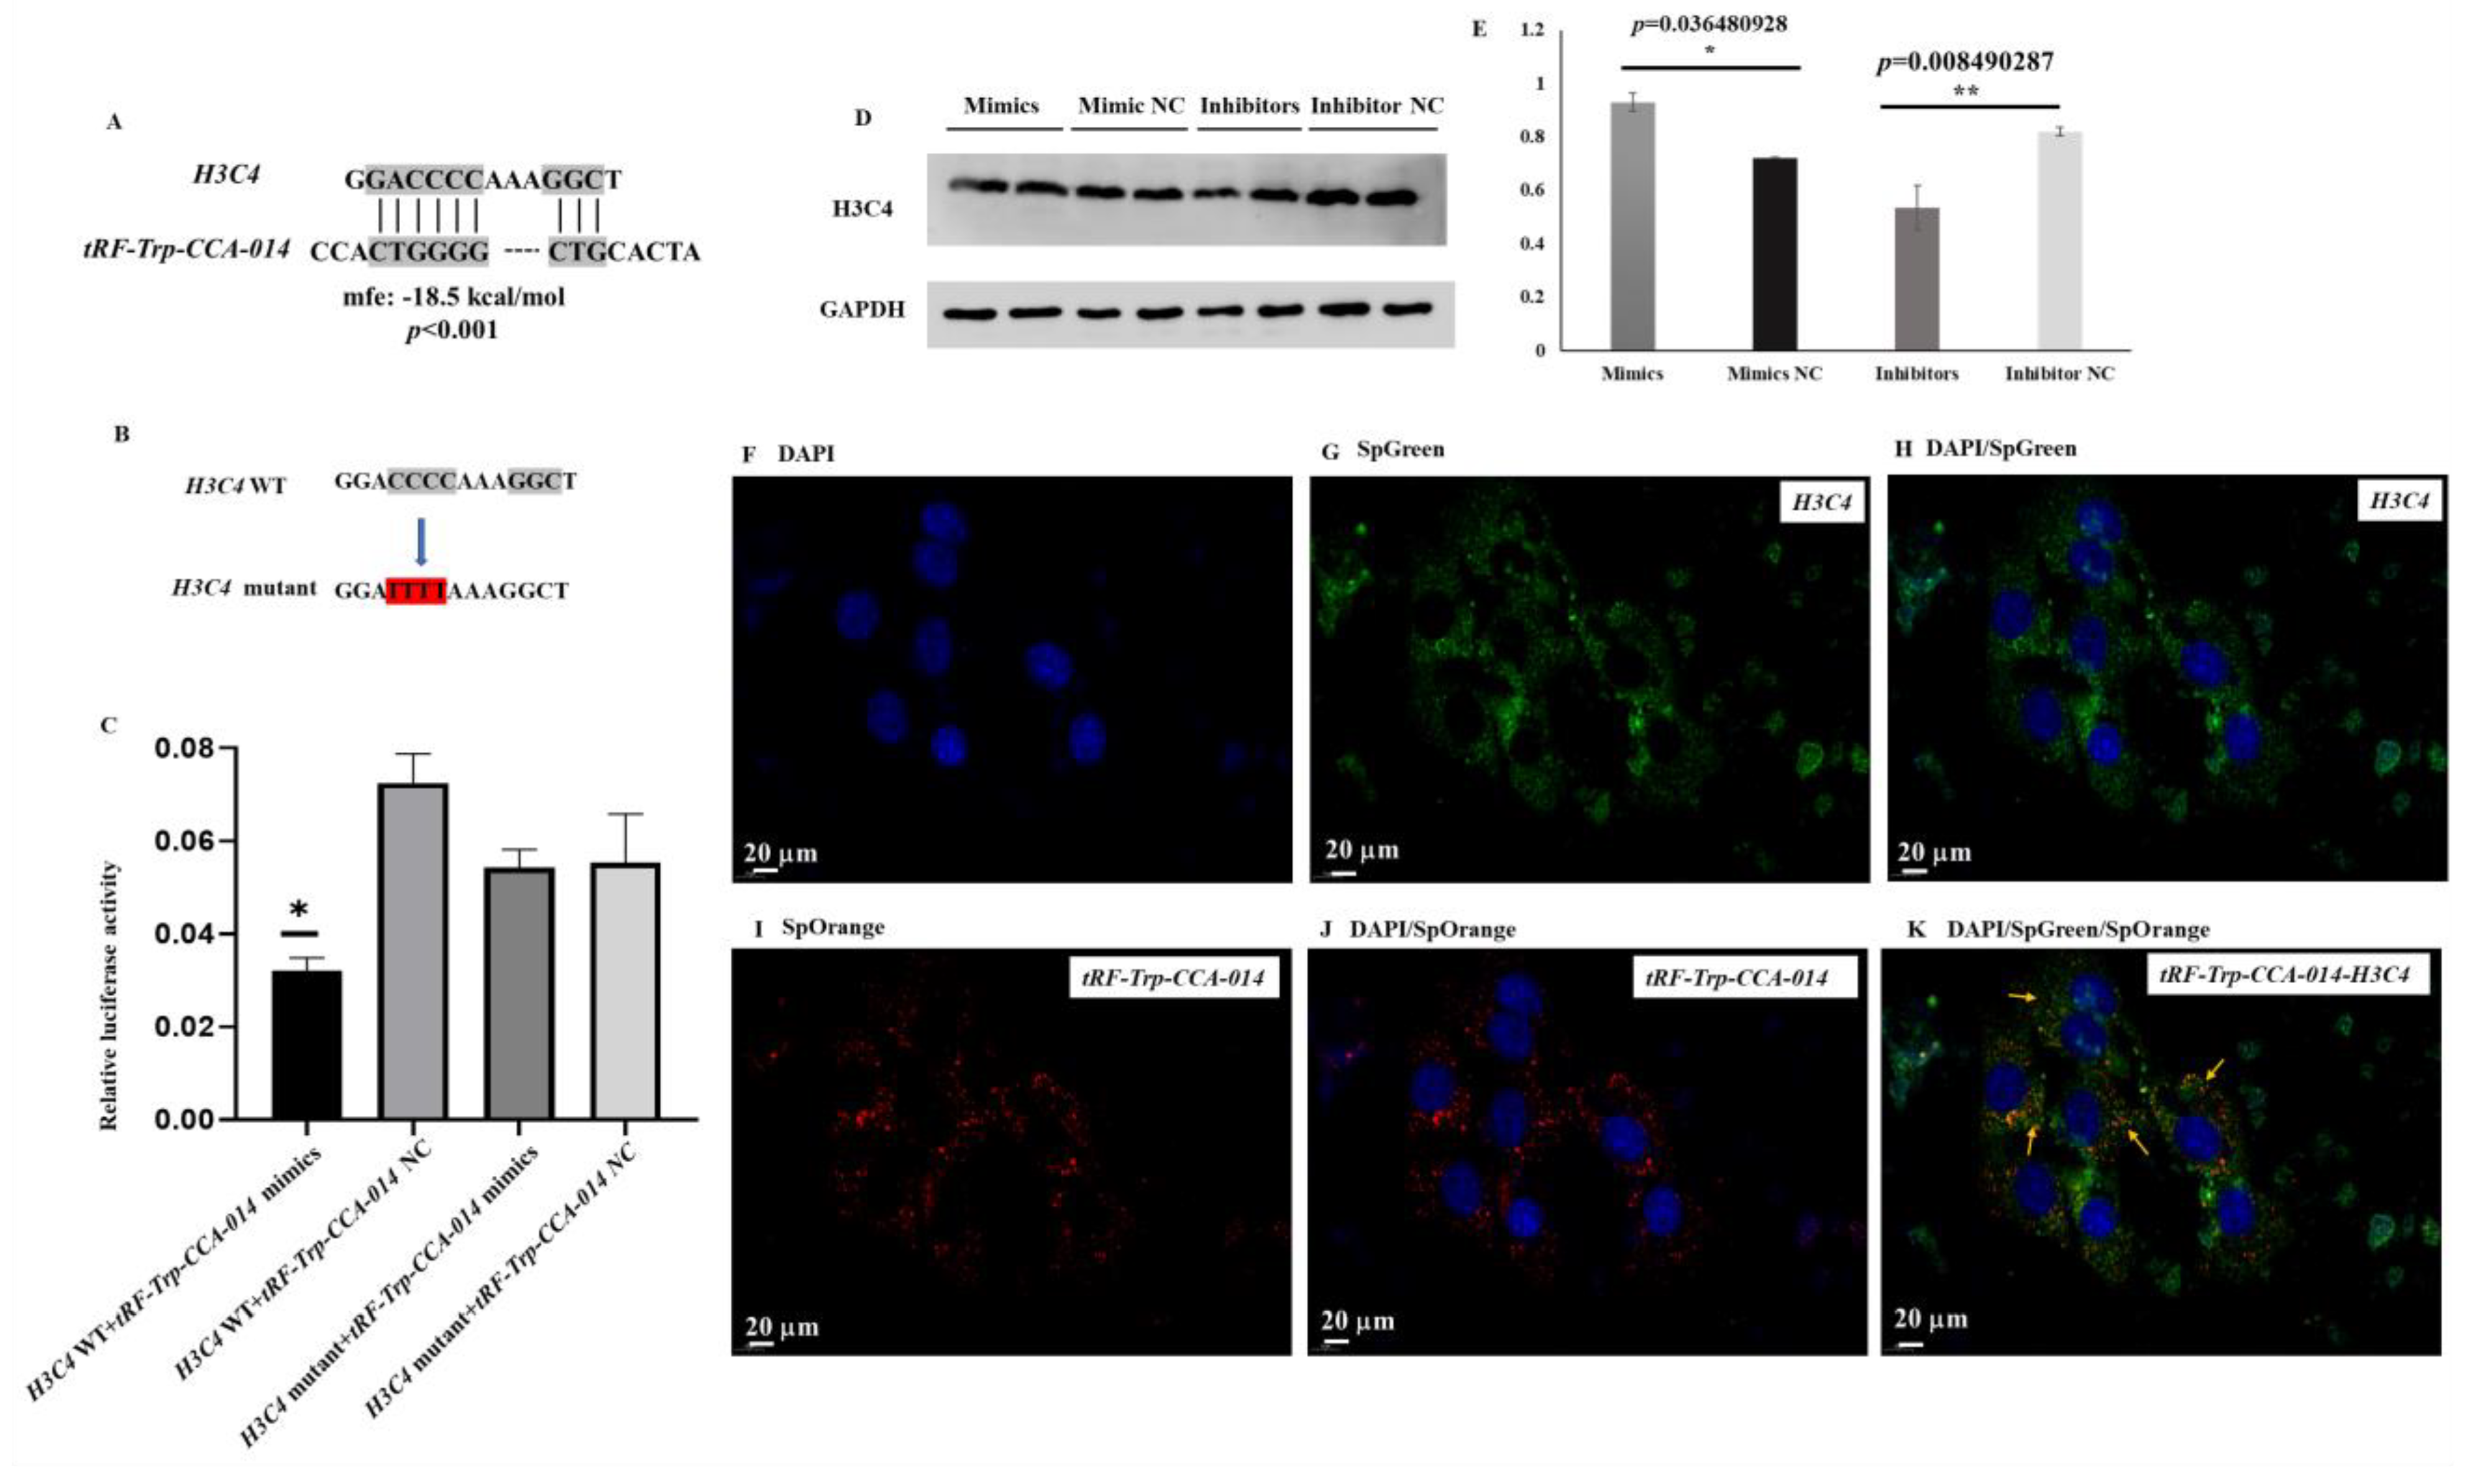
The binding sites between tRF-Trp-CCA-014 and H3C4 of mouse were predicted. The results showed that there were the binding sites between tRF-Trp-CCA-014 and the 3′UTR of H3C4 based on p < 0.001 (Figure 8A). Then, a mutant of H3C4 was designed by mutating CCCC to TTTT (Figure 8B). Furthermore, the binding sites were verified by a double luciferase reporter gene assay in HEK-293T cells. The luciferase activity was significantly decreased after transfection with wild-type (WT) tRF-Trp-CCA-014 mimics. 3′UTR of the H3C4 plasmid was compared to transfection with the negative control of tRF-Trp-CCA-014 and WT of the H3C4 3′UTR plasmid group, the mutants of the H3C4 3′UTR plasmid and the mimics of the tRF-Trp-CCA-014 group, and the mutants of the H3C4 3′UTR plasmid and the negative control of the tRF-Trp-CCA-014 group, separately (Figure 8C). The expression level of H3C4 protein was also determined in mouse NIH3T3 cells. The mimics of tRF-Trp-CCA-014 increased H3C4 protein levels, while the inhibitors of tRF-Trp-CCA-014 decreased H3C4 protein levels (Figure 8D,E). The location of tRF-Trp-CCA-014 and H3C4 was determined by RNA in situ hybridization in aged mouse NIH3T3 cells (Figure 8F–K). The results showed that the fluorescence signals of tRF-Trp-CCA-014 and H3C4 were found in the cytoplasm of aged mouse NIH3T3 cells.

3. Discussion

tsRNAs are found in a wide variety of organisms and tissues with potential utility as biomarkers and therapeutic targets and are involved in various cellular and molecular processes, including cell growth, differentiation, and transcriptional regulation [25]. The expression patterns of tRFs in several organisms have been reported. The expression level of 3’-tRFs increased with age (6 months, 14 months, and 22 months) based on miRNA data from the mouse brain [26,27]. Similar results were observed in C. elegans [8,28]. The tRFs of zebra fish are differentially expressed during development and in differentiated tissues, suggesting that they are likely produced by specific processing [7]. These results suggest that tsRNAs are enriched in aged organisms and it is essential to widely study tsRNAs at different ages in Drosophila.
Studies have shown that tRFs are expressed in Drosophila [11,25]. Karaiskos et al. identified the tRFs of fruit flies into RISC complexes according to Ago1 and Ago2 coimmunoprecipitated libraries [11]. They found that the total levels of Ago-loaded tRFs changed with age and that most age-related tRFs were enriched in Ago2-loaded situations [11]. These results suggest that tRFs have miRNA-like functions in Drosophila. Although Ago-loaded tRFs were identified, they may represent only a subset of the overall expressed tsRNAs because tsRNAs have other mechanisms in addition to miRNA-like patterns, such as acting on functional proteins [29] and transcription factors [30]. In our study, a comprehensive and systematic study of tsRNAs in 7-day- and 42-day-old Drosophila was performed. The number of tsRNAs at 42 days (417) was more than at 7 days (288) and tsRNAs were enriched with age. The most abundant tRF types (tRF-Asp-GTC and tRF-Glu-CTC) are consistent with the results of a previous study [11]. Then, 111 tRNA genes were identified in 0–1 and 7–8 h Drosophila embryos [18]. A similar pattern of the sizes of the most abundant tRFs (tRF-1) was found: 28 bp and 26-27 bp in embryos and adults, respectively. Specifically, the expression levels of tRFs changed temporally following the maternal-to-zygotic transition in embryos [18]. These results suggest that tsRNAs may have a wide range of functions in embryos and adult fruit flies.
Small RNA sequencing datasets extracted from wild-type and mutant ovaries were used to analyse the expression patterns of tRFs and two different highly conserved steps of tRNA biogenesis in Drosophila [25]. Both 5′-tRF and 3′-tRF are generated from a given mature tRNA [31]. A meta-analysis of more than 50 small RNA sequencing libraries demonstrated that the abundance of 5′- and 3′-tRFs from the same tRNA origin was unequal [32]. In the present study, our findings are consistent with the results of previous research [32] that tRFs-1 are the most enriched, followed by 5′-tRFs and 3′-tRFs. This consistency may be due to the method of library preparation or sequencing with standard small RNA-Seq protocols. Because tRFs-1 are poorly post-transcriptionally modified, tRFs-1 are preferential tRFs [25]. In contrast, tRFs, mainly from the 5′ ends of tRNAs in 0–1 and 7–8 h Drosophila embryos, co-sedimented with the non-polysomal fractions [18]. The difference in expression patterns may be related to the degradation orientation of tRNA and tsRNAs at different developmental stages. Thus, the expression patterns of tsRNAs in each developmental stage should be determined in future studies. In a previous study, according to arbitrary thresholds for illustrative purposes, 8 Ago1-associated tRFs were downregulated, 4 Ago1-associated tRFs were upregulated, and 40 Ago2-associated tRFs were upregulated in aged fruit flies [11]. Then, 13 differentially expressed tRFs were screened (p < 0.01 and fold changes ≥ 2) in mice [33]. In our study, 21 differentially expressed tsRNAs were identified based on fold change ≥ 1.5 and p ≤ 0.05. The expression patterns of tsRNAs demonstrate that they may play important roles in Drosophila.
To date, the function and the mechanism of specific tsRNAs present specific challenges and their biofunction is not well understood in Drosophila. In our study, the conserved tRF tRF-Trp-CCA-014 was identified and enriched in aged fruit flies and aged mouse NIH3T3 cells. The gene expression regulation system (UAS/GAL4) is an effective tool to construct transgenic Drosophila to overexpress or knock down targets in Drosophila [34]. Thus, we tried to use the UAS/GAL4 system to overexpress the sequence of tRF-Trp-CCA-014 in Drosophila, however, it failed. This suggests that we should pay more attention to studying their cutting mode and modification, which could help us to overexpress and knock down tRFs in Drosophila. Because tRF-Trp-CCA-014 is conserved in flies, mice, and humans, mouse NIH3T3 cells were used as the model to research the function of tRF-Trp-CCA-014. The fat body of fruit flies is equivalent to the mammalian liver [21]. Thus, tRF-Trp-CCA-014 has a similar expression pattern in tissues, such as higher expression levels in the head and fat body of aged fruit flies at 42 days and in the brain and liver of aged mice. On the other hand, a previous study reported that the intersection of the altered transcriptomes revealed 50 RNAs consistently elevated and 18 RNAs consistently reduced across four senescence models [35]. Thus, not all genes maintain the same expression pattern during the ageing process. In the present study, five tRFs were detected in aged mouse NIH3T3 cells and only tRF-Trp-CCA-014 had the same expression trend as that in aged fruit flies. These results suggest that tRF-Trp-CCA-014 has tissue specificity and stage specificity. Additionally, the mimics and inhibitors of tRF-Trp-CCA-014 did not induce senescence of mouse NIH3T3 cells (Figure S1). Thus, tRF-Trp-CCA-014 may accumulate during the ageing process of mouse NIH3T3 cells and have no effect on cell senescence. Therefore, we speculate that tRF-Trp-CCA-014 may be produced by ADR-stimulated mouse NIH3T3 cells and it may accumulate during the ageing process of mouse NIH3T3 cells and Drosophila and have no effect on senescence.
Based on its expression level and patterns of tRF-Trp-CCA-014, it may be involved in other biological processes. RNA-seq was used to analyse the DEGs when the mimics and inhibitors of tRF-Trp-CCA-014 were transfected into mouse NIH3T3 cells. The number of DEGs was screened and 26 functional DEGs were enriched in three differential signalling pathways (immune system, cancer: overview, and immune disease). Thus, the targets of tRF-Trp-CCA-014 were identified from those DEGs based on the miRNA-like mode [36]. The mimics and inhibitors of tRF-Trp-CCA-014 could affect the H3C4 gene mRNA and protein levels in mouse NIH3T3 cells. tRF-Trp-CCA-014 was shown to bind to the H3C4 3′UTR in a dual-luciferase reporter gene assay. In addition, tRF-Trp-CCA-014 and H3C4 were detected in the cytoplasm of aged NIH3T3 cells. These results suggest that the H3C4 gene is the target of tRF-Trp-CCA-014.
Histones, as basic nuclear proteins, are an important nucleosome structure of the chromosomal fibre in eukaryotes [37]. The H3C4 gene is a member of the histone H3 family and encodes a replication-dependent histone. Previous studies have reported that H3C4 is involved in the epigenetic regulation of gene expression [38], nucleosome assembly [39], and telomere organization [40]. Previous studies found that telomeres can maintain chromosomal stability and are associated with ageing and longevity [41,42]. Although tRF-Trp-CCA-014 did not affect cell senescence, it may regulate the expression level of H3C4 mRNA and protein to function in ageing; otherwise, the H3C4 isoforms of human, mouse, and fruit fly are conserved. Therefore, tRF-Trp-CCA-014 may regulate the expression of the H3C4 gene to affect related functions and signalling pathways, which deserves further study in our future work.

4. Materials and Methods

4.1. tsRNAs Analysis

Our published raw data (NCBI SRA_PRJNA716466) [43] were used to analyse tsRNA expression patterns at 7 days and 42 days. Library preparation and sequencing with standard small RNA-Seq protocols was performed to obtain high-quality data. In the sequencing process, m1A and m3C demethylation for efficient reverse transcription can guarantee maximum enrichment of tsRNAs in Drosophila. Sequencing quality was examined by FastQC (http://www.bioinformatics.babraham.ac.uk/projects/fastqc/ (accessed on 1 January 2018)), and trimmed reads (pass Illumina quality filter, trimmed 5′, 3′-adaptor bases by cutadapt [44]) were aligned, allowing for only 1 mismatch to the mature tRNA sequences. Then, reads that did not map were aligned, allowing for only 1 mismatch to precursor tRNA sequences with bowtie software [45]. The abundance of tsRNAs was evaluated using their sequencing counts and was normalized as counts per million of total aligned reads (CPM). The differentially expressed tsRNAs were screened based on the count value with the R package edgeR [46]. Principal component analysis (PCA), correlation analysis, pie plots, Venn plots, hierarchical clustering, scatter plots, and volcano plots were performed in the R or Perl environment for statistical computing and generation of graphics of the expressed tsRNAs.

4.2. GO and KEGG Enrichment

Gene ontology (GO) enrichment was applied to analyse biological processes (BP), cellular components (CC), and molecular functions (MF) via the GOseq R package [47]. To screen significant signalling pathways, Kyoto Encyclopedia of Genes and Genomes (KEGG) enrichment analysis was performed using the clusterProfiler (version 3.16.0) package (Bioconductor, Guangzhou, China) in the R environment [48]. A corrected p value less than 0.05 was considered to indicate a significantly enriched term for the GO and KEGG analyses.

4.3. qPCR

Total RNA was extracted using TRIzol reagent (Invitrogen, Waltham, MA, USA) and quantified by a NanoDrop-1000 instrument. Then, first-strand cDNA was synthesized by two methods. First, first-strand cDNA was synthesized by RT Easy TM II (with gDNase) (FOREGENE, Chengdu, China), which was utilized to test the expression level of mRNA genes. Second, first-strand cDNA was produced by an MR101-01 miRNA first-strand cDNA synthesis kit (by stem-loop) (Vazyme, Nanjing, China), which was prepared to determine the expression level of tsRNAs. Real-time quantitative PCR (qPCR) was routinely applied to measure relative gene expression levels using the TB Green Fast qPCR mix (Takara, Kyoto, Japan). All operations followed the manufacturer′s instructions for the kits. 2-ΔΔCT [49] was performed to identify the mRNA gene and tRFs expression levels according to the cycle threshold values. The relative levels of mRNA genes and tRFs were normalized to ribosomal protein L32 (RP49) and small nuclear RNA U6, respectively. Differential expression levels were compared by the IBM SPSS Statistics 20 system at a significance level of less than 0.05 [50]. The stem-loop and qPCR primers are summarized in Table 1.

4.4. Cell Culture and Cell Senescence Model

Mouse embryonic fibroblast NIH/3T3 cells were provided by our laboratory and used to build the senescence model. NIH/3T3 cells were cultured in DMEM (Dulbecco’s modified Eagle’s medium) (ATCC, Cambridge, MA, USA) supplemented with 10% foetal bovine serum (ThermoFisher Scientific, Waltham, MA, USA) and 1% penicillin/streptomycin solution (Sangon Biotech, Shanghai, China) in a 37 °C, 5% CO2 incubator. Cell transfection was performed according to the LipoMaxTM transfection reagent (Sudgen, Nanjing, China) instruction manual, and the transfection concentrations of mimics, inhibitors, and negative control were all 20 pmol/μL. NIH/3T3 cells in their exponential growth phase were treated with 0.5 μM adriamycin (ADR) (Merck, Darmstadt, Germany). After 72 h, the cells were collected and used to confirm cellular senescence. The mimics, inhibitors, and negative control of tRF-Trp-CCA-014 were designed and synthesized by Sangon Biotech Co., Ltd. Shanghai, China.

4.5. SA-β-gal Staining

Senescent mouse NIH/3T3 cells were collected and stained blue by β-galactosidase staining agent (Beyotime, Shanghai, China) to determine whether the cells were senescent. The experiment was performed according to the instructions. After staining, the senescent NIH3T3 cells treated with ADR were obviously stained blue and the cells became larger and had an irregular shape.

4.6. Nuclear Cytoplasmic Separation

To confirm the expression location of tRF-Trp-CCA-014 in mouse NIH/3T3 cells, the nucleus and cytoplasm were separated by a cytoplasmic and nuclear RNA purification kit (Norgen Biotek, Mississauga, Canada) and used to extract RNA. Then, qPCR and 2-ΔΔCT [23] were utilized to identify the tRF-Trp-CCA-014 expression level according to the cycle threshold values. The small nuclear RNA U6 and glyceraldehyde 3-phosphate dehydrogenase (GAPDH) were used as the reference genes in the nucleus and cytoplasm of cells, respectively.

4.7. Tissue Expression Specificity of tRF-Trp-CCA-014

The relative expression level of tRF-Trp-CCA-014 was detected in the Drosophila samples of egg, 1st stage larva (L1), 2nd stage larva (L2), 3rd stage larva (L3), and pupa (P) and adults of 7 days (7 d), 14 days (14 d), 21 days (21 d), 28 days (28 d), 30 days (30 d), 35 days (35 d), 42 days (42 d), and 49 days (49 d) of age, and different tissues (head, fat body, gut, and ovary) from 42 d by qPCR method. Furthermore, the relative expression level of tRF-Trp-CCA-014 was also determined in 5-month-old C57 wild-type young mice and 19-month-old C57 wild-type aged mice. All mice were purchased from Nanjing Junke Bioengineering Co., Ltd., China. The tissues included thigh muscle, liver, brain, lung, gut, heart, kidney, spleen, midbrain, and cerebellum. All samples had three biological replicates.

4.8. RNA-seq

RNA-seq technology was used to study the transcriptome of mouse NIH3T3 cells. The cells treated for 48 h contained six groups, including Mimics, Inhibitors, Mimic NC, Inhibitor NC, Aging (ADR), and Control (Normal). Each sample contained three biological replicates. RNA isolation, cDNA library construction, and sequencing were described in a previous study [51]. Hisat2 [52] was utilized to align the clean reads (100 bp paired-end reads) with the reference genome (Mus musculus GRCm39) to obtain the position information on the reference genome or gene, as well as the unique sequence feature information of the sequenced sample. Then, the known reference gene sequences and annotation files from databases were used for sequence similarity alignment to identify the expression abundance of each protein-coding gene in each sample. The htseq-count [53] was utilized to obtain the number of reads aligned to the protein-coding genes in each sample. After the counts were obtained by comparison, protein-coding genes were filtered to remove genes with zero reads.
Cuffdiff (v2.1.1) [54] was used to calculate FPKMs (fragments per kilobase of transcript sequence per millions base pairs sequenced) of coding genes in each sample. The FPKM method can eliminate the influence of differences in protein-coding gene length and sequencing quantity on the calculated protein-coding gene expression. The differentially expressed genes (DEGs) were identified as those with a corrected p value ≤ 0.05 (using BH orthosis) and fold change > 1.5. Furthermore, GO and KEGG functional enrichment analyses of DEGs were performed.

4.9. Target Prediction of tRF-Trp-CCA-014

The target genes of tRF-Trp-CCA-014 were screened in two ways. The first was identification based on DEGs (Aging (ADR) vs. Control (Normal) group, Mimics vs. Inhibitors group) that were enriched in the GO and KEGG analyses. The second was identification based on DEGs (Mimics vs. Inhibitors group) from transcription factor families. Then, RNAhybrid [55] was utilized to predict the binding sites between tRF-Trp-CCA-014 and target genes.

4.10. Dual-Luciferase Reporter Gene Assay

Human 293T/17 cells were plated in 96-well culture plates and transfected with the mimics of tRF-Trp-CCA-014 and target gene plasmid, the negative control and the mimics of the target gene, the mutants of target gene and the mimics of tRF-Trp-CCA-014, and the mutants of target gene and the mimics of the negative control. The Renilla luciferase expression vector pRL-TK (Promega, Madison, WI, USA) and Lipofectamine™ 2000 transfection reagent (Invitrogen, Waltham, MA, USA) were used in this experiment. Next, a dual-luciferase system (Promega) was utilized to assay the cells for both firefly and Renilla luciferase activities according to the manufacturer’s protocol.

4.11. Western Blot

The H3C4 protein expression level was detected by Western blotting. Total proteins were obtained from mouse NIH/3T3 cells using a ProteoPrepÒ sample extraction kit (Merck, Darmstadt, Germany) and a BCA protein assay kit (Merck, Germany) was used to measure the protein concentrations. First, the total protein was blotted onto polyvinylidene fluoride membranes. Then, the membranes were incubated at 4 °C overnight with primary antibodies (Proteintech, Chicago, IL, USA) against H3C4 and GAPDH. Next, the membranes were incubated with HRP-conjugated secondary antibodies. GraphPad Prism 9 was used to analyse the H3C4 level based on the grey value of the protein band.

4.12. RNA in Situ Hybridization

Aged mouse NIH3T3 cells were used to analyse the location of tRF-Trp-CCA-014 and its target genes. First, the probes were designed and synthesized according to the sequences of tRF-Trp-CCA-014 and its target genes. Then, the cells were treated with 4% paraformaldehyde and the cell membranes were permeabilized by Triton-100 (Beyotime, Shanghai, China) for 5 min at 4 °C. Next, the remaining steps were performed according to Xu et al. (2021) [56]. Finally, photographs were taken using a fluorescence microscope.

4.13. Statistical Analysis

GraphPad Prism software was used to statistically analyse the experimental results. The differences in experimental data among groups were compared by single-factor ANOVA. *, **, and *** indicate p < 0.05, p < 0.01, and p < 0.001, respectively.

5. Conclusions

In conclusion, the expression profiles of tsRNAs in Drosophila were analysed at 7 days and 42 days and the conserved tRF tRF-Trp-CCA-014 was identified in our study. Then, the essential function of tRF-Trp-CCA-014 was predicted in mouse NIH3T3 cells and the binding properties of the tRF-Trp-CCA-014-H3C4 network were validated. These results will provide the foundation for the study of tsRNAs in Drosophila and mice. However, unlike lncRNAs and circRNAs, there are no research methods to study the function and mechanism of specific tsRNAs in vivo, such as genetic techniques or biochemical methods. Developing such methods is still greatly challenging because of the short sequences of tsRNAs. Thus, future studies should explore effective methods to identify gain-of-function and loss-of-function mutations of tsRNAs in vivo.

Supplementary Materials

The following supporting information can be downloaded at: https://www.mdpi.com/article/10.3390/ijms24076169/s1.

Author Contributions

Conceptualization: D.Y. and M.Y.; data curation: J.L., Z.H. and S.W.; formal analysis: Y.Y., X.F., Q.N., T.Y. and M.Z.; methodology: Y.Y., T.Y. and F.X.; writing—original draft: D.Y. and Y.Y.; writing—review and editing: Y.L., X.G., F.X. and Z.H. All authors have read and agreed to the published version of the manuscript.

Funding

The study was supported by the National Natural Science Foundation of China (grant numbers 31972777, 2019; 31402286, 2015) and the China Scholarship Council (202106915017).

Institutional Review Board Statement

The animal study protocol was approved by the Animal Research and Ethics Committee of Sichuan Agricultural Universtiy (Approval No. 20190029).

Informed Consent Statement

Not applicable.

Data Availability Statement

The data presented in this study are available on request from the corresponding author without any restrictions.

Conflicts of Interest

The authors declare no conflict of interest.

References

  1. Weng, Q.; Wang, Y.; Xie, Y.; Yu, X.; Zhang, S.; Ge, J.; Li, Z.; Ye, G.; Guo, J. Extracellular vesicles-associated tRNA-derived fragments (tRFs): Biogenesis, biological functions, and their role as potential biomarkers in human diseases. J. Mol. Med. 2022, 100, 679–695. [Google Scholar] [CrossRef]
  2. Yu, X.; Xie, Y.; Zhang, S.; Song, X.; Xiao, B.; Yan, Z. tRNA-derived fragments: Mechanisms underlying their regulation of gene expression and potential applications as therapeutic targets in cancers and virus infections. Theranostics 2021, 11, 461–469. [Google Scholar] [CrossRef] [PubMed]
  3. Goodarzi, H.; Liu, X.; Nguyen, H.C.; Zhang, S.; Fish, L.; Tavazoie, S.F. Endogenous tRNA-Derived Fragments Suppress Breast Cancer Progression via YBX1 Displacement. Cell 2015, 161, 790–802. [Google Scholar] [CrossRef] [PubMed] [Green Version]
  4. Deng, H.; Wang, J.; Ye, D.; Chen, J.; Qiu, S.; Tang, M.; Zhou, C.; Shen, Y.; Fang, S.; Shen, Z.; et al. A 5′-tiRNA fragment that inhibits proliferation and migration of laryngeal squamous cell carcinoma by targeting PIK3CD. Genomics 2022, 114, 110392. [Google Scholar] [CrossRef] [PubMed]
  5. Mesquita-Ribeiro, R.; Fort, R.S.; Rathbone, A.; Farias, J.; Lucci, C.; James, V.; Sotelo-Silveira, J.; Duhagon, M.A.; Dajas-Bailador, F. Distinct small non-coding RNA landscape in the axons and released extracellular vesicles of developing primary cortical neurons and the axoplasm of adult nerves. RNA Biol. 2021, 18, 832–855. [Google Scholar] [CrossRef]
  6. Su, Z.; Monshaugen, I.; Wilson, B.; Wang, F.; Klungland, A.; Ougland, R.; Dutta, A. TRMT6/61A-dependent base methylation of tRNA-derived fragments regulates gene-silencing activity and the unfolded protein response in bladder cancer. Nat. Commun. 2022, 13, 2165. [Google Scholar] [CrossRef]
  7. Soares, A.R.; Fernandes, N.; Reverendo, M.; Araujo, H.R.; Oliveira, J.L.; Moura, G.M.; Santos, M.A. Conserved and highly expressed tRNA derived fragments in zebrafish. BMC Mol. Biol. 2015, 16, 22. [Google Scholar] [CrossRef] [Green Version]
  8. Shin, G.; Koo, H.J.; Seo, M.; Lee, S.V.; Nam, H.G.; Jung, G.Y. Transfer RNA-derived fragments in aging Caenorhabditis elegans originate from abundant homologous gene copies. Sci. Rep. 2021, 11, 12304. [Google Scholar] [CrossRef]
  9. Zhong, F.; Hu, Z.; Jiang, K.; Lei, B.; Wu, Z.; Yuan, G.; Luo, H.; Dong, C.; Tang, B.; Zheng, C.; et al. Complement C3 activation regulates the production of tRNA-derived fragments Gly-tRFs and promotes alcohol-induced liver injury and steatosis. Cell Res. 2019, 29, 548–561. [Google Scholar] [CrossRef] [Green Version]
  10. Mleczko, A.M.; Celichowski, P.; Bakowska-Zywicka, K. Transfer RNA-derived fragments target and regulate ribosome-associated aminoacyl-transfer RNA synthetases. Biochim. Biophys. Acta Gene Regul. Mech. 2018, 1861, 647–656. [Google Scholar] [CrossRef]
  11. Karaiskos, S.; Naqvi, A.S.; Swanson, K.E.; Grigoriev, A. Age-driven modulation of tRNA-derived fragments in Drosophila and their potential targets. Biol. Direct 2015, 10, 51. [Google Scholar] [CrossRef] [PubMed] [Green Version]
  12. Wang, B.G.; Yan, L.R.; Xu, Q.; Zhong, X.P. The role of Transfer RNA-Derived Small RNAs (tsRNAs) in Digestive System Tumors. J. Cancer 2020, 11, 7237–7245. [Google Scholar] [CrossRef] [PubMed]
  13. Kumar, P.; Kuscu, C.; Dutta, A. Biogenesis and Function of Transfer RNA-Related Fragments (tRFs). Trends Biochem. Sci. 2016, 41, 679–689. [Google Scholar] [CrossRef] [PubMed] [Green Version]
  14. Saikia, M.; Krokowski, D.; Guan, B.J.; Ivanov, P.; Parisien, M.; Hu, G.F.; Anderson, P.; Pan, T.; Hatzoglou, M. Genome-wide identification and quantitative analysis of cleaved tRNA fragments induced by cellular stress. J. Biol. Chem. 2012, 287, 42708–42725. [Google Scholar] [CrossRef] [Green Version]
  15. Ding, M.; Li, H.; Zheng, L. Drosophila exercise, an emerging model bridging the fields of exercise and aging in human. Front. Cell Dev. Biol. 2022, 10, 966531. [Google Scholar] [CrossRef] [PubMed]
  16. Zong, T.; Yang, Y.; Lin, X.; Jiang, S.; Zhao, H.; Liu, M.; Meng, Y.; Li, Y.; Zhao, L.; Tang, G.; et al. 5′-tiRNA-Cys-GCA regulates VSMC proliferation and phenotypic transition by targeting STAT4 in aortic dissection. Mol. Ther. Nucleic Acids 2021, 26, 295–306. [Google Scholar] [CrossRef] [PubMed]
  17. Guan, L.; Grigoriev, A. Age-Related Argonaute Loading of Ribosomal RNA Fragments. Microrna 2020, 9, 142–152. [Google Scholar] [CrossRef] [PubMed]
  18. Goktas, C.; Yigit, H.; Cosacak, M.I.; Akgul, B. (Differentially) Expressed tRNA-Derived Small RNAs Co-Sediment Primarily with Non-Polysomal Fractions in Drosophila. Genes 2017, 8, 333. [Google Scholar] [CrossRef] [PubMed] [Green Version]
  19. Cosacak, M.I.; Yigit, H.; Kizil, C.; Akgul, B. Re-Arrangements in the Cytoplasmic Distribution of Small RNAs Following the Maternal-to-Zygotic Transition in Drosophila Embryos. Genes 2018, 9, 82. [Google Scholar] [CrossRef] [Green Version]
  20. Sun, T.Y.; Zhang, L.X.; Feng, J.L.; Bao, L.Y.; Wang, J.Q.; Song, Z.Z.; Mao, Z.F.; Li, J.; Hu, Z. Characterization of cellular senescence in doxorubicin-induced aging mice. Exp. Gerontol. 2022, 163, 111800. [Google Scholar] [CrossRef]
  21. Wiley, C.D.; Velarde, M.C.; Lecot, P.; Liu, S.; Sarnoski, E.A.; Freund, A.; Shirakawa, K.; Lim, H.W.; Davis, S.S.; Ramanathan, A.; et al. Mitochondrial Dysfunction Induces Senescence with a Distinct Secretory Phenotype. Cell Metab. 2016, 23, 303–314. [Google Scholar] [CrossRef] [PubMed] [Green Version]
  22. Ortiz-Montero, P.; Londoño-Vallejo, A.; Vernot, J.P. Senescence-associated IL-6 and IL-8 cytokines induce a self- and cross-reinforced senescence/inflammatory milieu strengthening tumorigenic capabilities in the MCF-7 breast cancer cell line. Cell Commun. Signal. 2017, 15, 17. [Google Scholar] [CrossRef] [PubMed] [Green Version]
  23. Martínez-Zamudio, R.I.; Dewald, H.K.; Vasilopoulos, T.; Gittens-Williams, L.; Fitzgerald-Bocarsly, P.; Herbig, U. Fitzgerald-Bocarsly, and U. Herbig. Senescence-associated β-galactosidase reveals the abundance of senescent CD8+ T cells in aging humans. Aging Cell 2021, 20, e13344. [Google Scholar] [PubMed]
  24. Li, W.S.; Li, Y.L.; Cao, R.; Ha, C.F.; Sun, S.; Yu, L.; Li, J. Differential Expression and Bioinformatics Analysis of tRF/tiRNA in Endometriosis Patients. Biomed. Res. Int. 2022, 2022, 9911472. [Google Scholar] [CrossRef]
  25. Molla-Herman, A.; Angelova, M.T.; Ginestet, M.; Carre, C.; Antoniewski, C.; Huynh, J.R. tRNA Fragments Populations Analysis in Mutants Affecting tRNAs Processing and tRNA Methylation. Front. Genet. 2020, 11, 518949. [Google Scholar] [CrossRef]
  26. Yin, L.; Sun, Y.; Wu, J.; Yan, S.; Deng, Z.; Wang, J.; Liao, S.; Yin, D.; Li, G. Discovering novel microRNAs and age-related nonlinear changes in rat brains using deep sequencing. Neurobiol. Aging 2015, 36, 1037–1044. [Google Scholar] [CrossRef]
  27. Karaiskos, S.; Grigoriev, A. Dynamics of tRNA fragments and their targets in aging mammalian brain. F1000Research 2016, 5, 2758. [Google Scholar] [CrossRef]
  28. Panowski, S.H.; Dillin, A. Signals of youth: Endocrine regulation of aging in Caenorhabditis elegans. Trends Endocrinol. Metab. 2009, 20, 259–264. [Google Scholar] [CrossRef]
  29. Chen, F.; Song, C.; Meng, F.; Zhu, Y.; Chen, X.; Fang, X.; Ma, D.; Wang, Y.; Zhang, C. 5′-tRF-GlyGCC promotes breast cancer metastasis by increasing fat mass and obesity-associated protein demethylase activity. Int. J. Biol. Macromol. 2023, 226, 397–409. [Google Scholar] [CrossRef]
  30. Green, D.; Fraser, W.D.; Dalmay, T. Transfer RNA-derived small RNAs in the cancer transcriptome. Pflugers Arch. 2016, 468, 1041–1047. [Google Scholar] [CrossRef] [Green Version]
  31. Yamasaki, S.; Ivanov, P.; Hu, G.F.; Anderson, P. Angiogenin cleaves tRNA and promotes stress-induced translational repression. J. Cell Biol. 2009, 185, 35–42. [Google Scholar] [CrossRef] [Green Version]
  32. Kumar, P.; Anaya, J.; Mudunuri, S.B.; Dutta, A. Meta-analysis of tRNA derived RNA fragments reveals that they are evolutionarily conserved and associate with AGO proteins to recognize specific RNA targets. BMC Biol. 2014, 12, 78. [Google Scholar] [CrossRef] [PubMed]
  33. Zhang, S.; Li, H.; Zheng, L.; Li, H.; Feng, C.; Zhang, W. Identification of functional tRNA-derived fragments in senescence-accelerated mouse prone 8 brain. Aging 2019, 11, 10485–10498. [Google Scholar] [CrossRef] [PubMed]
  34. Barwell, T.; DeVeale, B.; Poirier, L.; Zheng, J.; Seroude, F.; Seroude, L. Regulating the UAS/GAL4 system in adult Drosophila with Tet-off GAL80 transgenes. PeerJ 2017, 5, e4167. [Google Scholar] [CrossRef] [PubMed] [Green Version]
  35. Casella, G.; Munk, R.; Kim, K.M.; Piao, Y.L.; De, S.; Abdelmohsen, K.; Gorospe, M. Transcriptome signature of cellular senescence. Nucleic Acids Res. 2019, 47, 11476. [Google Scholar] [CrossRef] [PubMed]
  36. Ren, J.; Wu, X.; Shang, F.F.; Qi, Y.; Tang, Z.; Wen, C.; Cao, W.; Cheng, Q.; Tan, L.; Chen, H.; et al. The tRNA-Cys-GCA Derived tsRNAs Suppress Tumor Progression of Gliomas via Regulating VAV2. Dis. Mark. 2022, 2022, 8708312. [Google Scholar] [CrossRef] [PubMed]
  37. Tachiwana, H.; Osakabe, A.; Shiga, T.; Miya, Y.; Kimura, H.; Kagawa, W.; Kurumizaka, H. Structures of human nucleosomes containing major histone H3 variants. Acta Crystallogr. D Biol. Crystallogr. 2011, 67, 578–583. [Google Scholar] [CrossRef]
  38. Hake, S.B.; Garcia, B.A.; Duncan, E.M.; Kauer, M.; Dellaire, G.; Shabanowitz, J.; Bazett-Jones, D.P.; Allis, C.D.; Hunt, D.F. Expression patterns and post-translational modifications associated with mammalian histone H3 variants. J. Biol. Chem. 2006, 281, 559–568. [Google Scholar] [CrossRef] [Green Version]
  39. Tagami, H.; Ray-Gallet, D.; Almouzni, G.; Nakatani, Y. Histone H3.1 and H3.3 complexes mediate nucleosome assembly pathways dependent or independent of DNA synthesis. Cell 2004, 116, 51–61. [Google Scholar]
  40. Fingerman, I.M.; Li, H.C.; Briggs, S.D. A charge-based interaction between histone H4 and Dot1 is required for H3K79 methylation and telomere silencing: Identification of a new trans-histone pathway. Genes Dev. 2007, 21, 2018–2029. [Google Scholar] [CrossRef] [Green Version]
  41. Levy, M.A.; Tian, J.; Gandelman, M.; Cheng, H.; Tsapekos, M.; Crego, S.R.; Maddela, R.; Sinnott, R. A Multivitamin Mixture Protects against Oxidative Stress-Mediated Telomere Shortening. J. Diet. Suppl. 2023, 1–18. [Google Scholar] [CrossRef] [PubMed]
  42. Sha, Z.; Hou, T.; Zhou, T.; Dai, Y.; Bao, Y.; Jin, Q.; Ye, J.; Lu, Y.M.; Wu, L.Q. Causal relationship between atrial fibrillation and leukocyte telomere length: A two sample, bidirectional Mendelian randomization study. Front. Cardiovasc. Med. 2023, 10, 1093255. [Google Scholar] [CrossRef] [PubMed]
  43. Yang, D.Y.; Xiao, F.; Li, J.M.; Wang, S.Q.; Fan, X.L.; Ni, Q.Y.; Li, Y.; Zhang, M.W.; Yan, T.M.; Yang, M.Y.; et al. Age-related ceRNA networks in adult Drosophila ageing. Front. Genet. 2023, 14, 1096902. [Google Scholar] [CrossRef] [PubMed]
  44. Martin, M. Cutadapt Removes Adapter Sequences From High-Throughput Sequencing Reads. EMBnet J. 2006, 17, 10–12. [Google Scholar] [CrossRef]
  45. Langmead, B.; Trapnell, C.; Pop, M.; Salzberg, S.L. Ultrafast and memory-efficient alignment of short DNA sequences to the human genome. Genome Biol. 2009, 10, R25. [Google Scholar] [CrossRef] [PubMed] [Green Version]
  46. McDermaid, A.; Monier, B.; Zhao, J.; Liu, B.; Ma, Q. Interpretation of differential gene expression results of RNA-seq data: Review and integration. Brief. Bioinform. 2019, 20, 2044–2054. [Google Scholar] [CrossRef] [PubMed] [Green Version]
  47. Young, M.D.; Wakefield, M.J.; Smyth, G.K.; Oshlack, A. Gene ontology analysis for RNA-seq: Accounting for selection bias. Genome Biol. 2010, 11, R14. [Google Scholar] [CrossRef] [Green Version]
  48. Yu, G.; Wang, L.G.; Han, Y.; He, Q.Y. ClusterProfiler: An R package for comparing biological themes among gene clusters. Omics J. Integr. Biol. 2012, 16, 284–287. [Google Scholar] [CrossRef]
  49. Livak, K.J.; Schmittgen, T.D. Analysis of relative gene expression data using real-time quantitative PCR and the 2(-Delta Delta C(T)) Method. Methods 2001, 25, 402–408. [Google Scholar] [CrossRef]
  50. Namdar, P.; YekeFallah, L.; Jalalian, F.; Barikani, A.; Razaghpoor, A. Improving Door-to-Balloon Time for Patients With Acute ST-Elevation Myocardial Infarction: A Controlled Clinical Trial. Curr. Probl. Cardiol. 2021, 46, 100674. [Google Scholar] [CrossRef]
  51. McGarvey, P.; Huang, J.; McCoy, M.; Orvis, J.; Katsir, Y.; Lotringer, N.; Nesher, I.; Kavarana, M.; Sun, M.; Peet, R.; et al. De novo assembly and annotation of transcriptomes from two cultivars of Cannabis sativa with different cannabinoid profiles. Gene 2020, 762, 145026. [Google Scholar] [CrossRef] [PubMed]
  52. Kim, D.; Langmead, B.; Salzberg, S.L. HISAT: A fast spliced aligner with low memory requirements. Nat. Methods 2015, 12, 357–360. [Google Scholar] [CrossRef] [PubMed] [Green Version]
  53. Anders, S.; Pyl, P.T.; Huber, W. HTSeq—A Python framework to work with high-throughput sequencing data. Bioinformatics 2015, 31, 166–169. [Google Scholar] [CrossRef] [PubMed] [Green Version]
  54. Ghosh, S.; Chan, C.K. Analysis of RNA-Seq Data Using TopHat and Cufflinks. Methods Mol. Biol. 2016, 1374, 339–361. [Google Scholar]
  55. Li, Y.; Li, Z.; Liu, J.; Liu, Y.; Miao, G. miR-190-5p Alleviates Myocardial Ischemia-Reperfusion Injury by Targeting PHLPP1. Dis. Mark. 2021, 2021, 8709298. [Google Scholar] [CrossRef]
  56. Xu, W.; Zhou, B.; Wang, J.; Tang, L.; Hu, Q.; Wang, J.; Chen, H.; Zheng, J.; Yan, F.; Chen, H. tRNA-Derived Fragment tRF-Glu-TTC-027 Regulates the Progression of Gastric Carcinoma via MAPK Signaling Pathway. Front. Oncol. 2021, 11, 733763. [Google Scholar] [CrossRef]
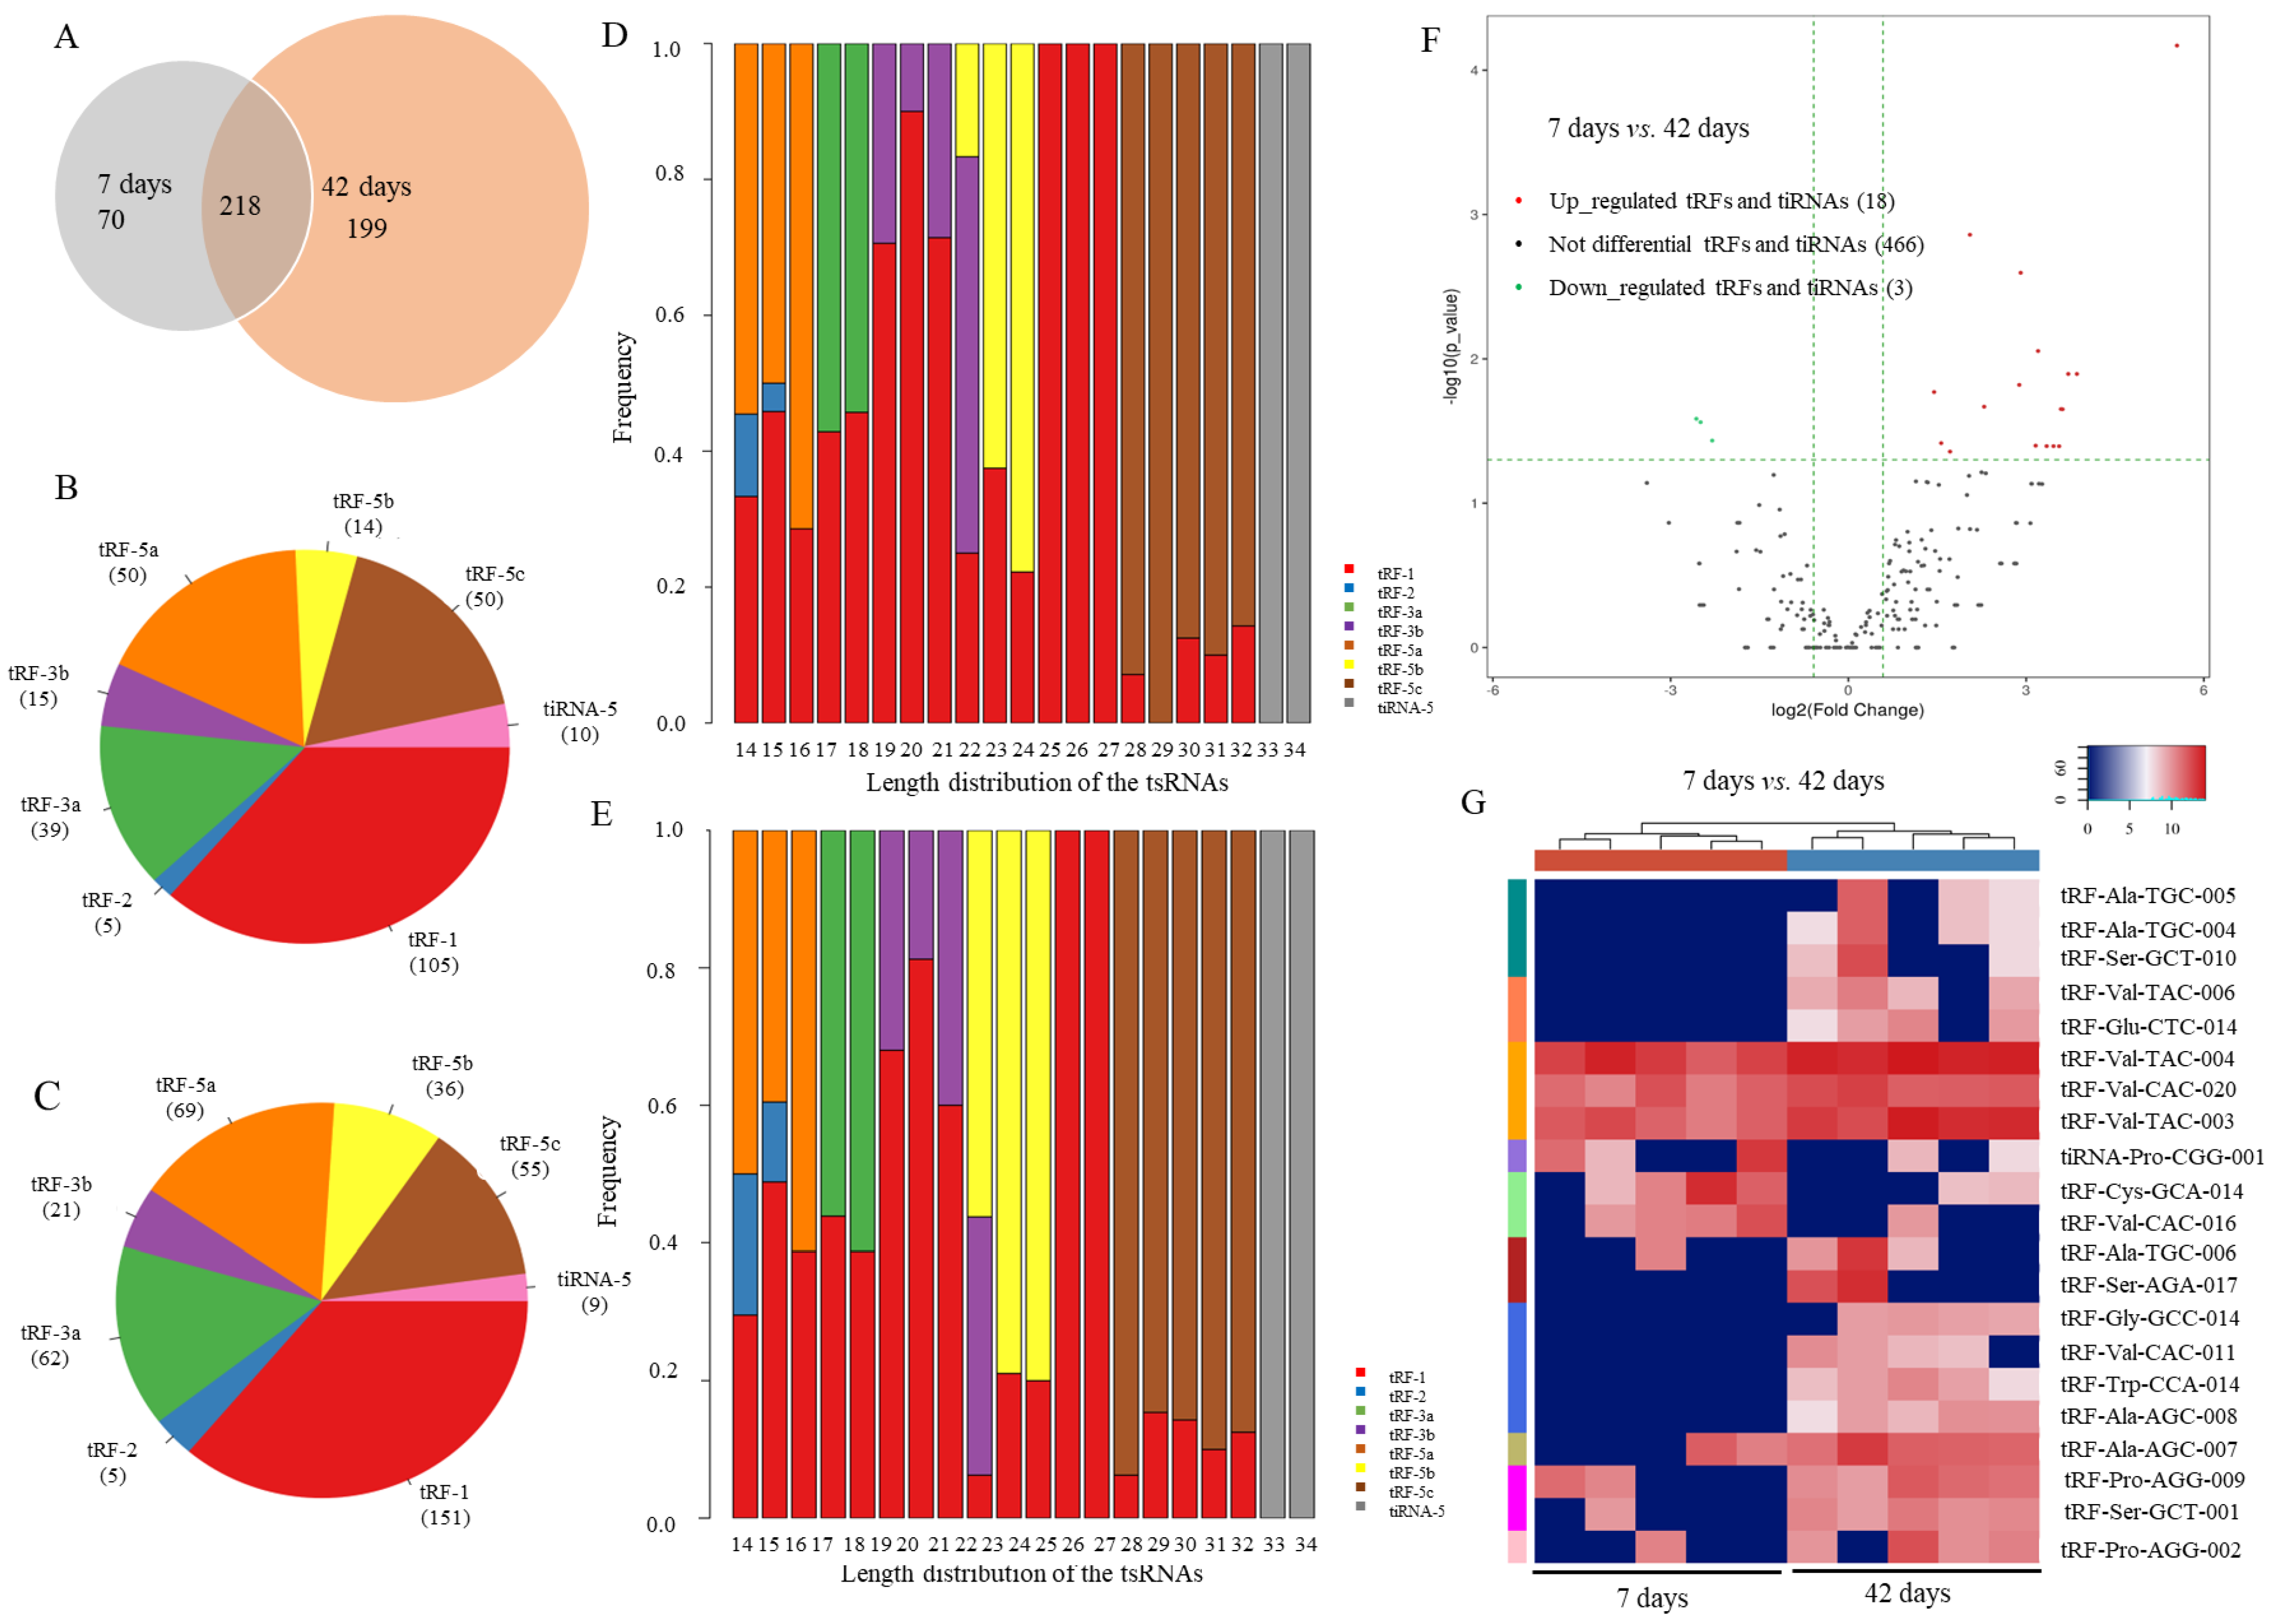
Figure 1. Expression pattern of tsRNAs in Drosophila at 7 days and 42 days. (A) newly discovered and known tsRNAs; (B) classification of tsRNAs at 7 days; (C) classification of tsRNAs at 42 days; (D) subtype length of tsRNAs at 7 days; (E) subtype length of tsRNAs at 42 days; (F) significantly up/downregulated tsRNAs between 7 days and 42 days; (G) heatmap of 21 differentially expressed tsRNAs.
Ijms 24 06169 g001
Figure 2. Verification of 10 differentially expressed tRFs in Drosophila and aged mouse NIH3T3 cells. (A) The sequences of 10 differentially expressed tRFs; (B) the expression levels of 10 differentially expressed tRFs of Drosophila at 7 days and 42 days; (C) β-gal staining of normal mouse NIH3T3 cells without adriamycin (ADR); (D) β-gal staining of aged mouse NIH3T3 cells induced by ADR; (E) the number of β-gal-stained cells in normal and aged mouse NIH3T3 cells. (F) the expression levels of IL-1α, IL-1β, and IL-6; (G) 5 tRFs in normal and aged mouse NIH3T3 cells induced by ADR. ADR—adriamycin; SASP—senescence-associated secretory phenotypes; **, p < 0.01; ***, p < 0.001; ns—no significance.
Ijms 24 06169 g002
Figure 3. Expression features of tRF-Trp-CCA-014 in Drosophila and mice. (A) The sequence alignment of tRF-Trp-CCA-014 in Drosophila, mouse (a relational database of transfer RNA related fragments 3002a, tRFdb 3002a), human (from MINTbase v2.0), zebrafish (tRFdb 3038), and Xenopus tropicalis (tRFdb 3015); (B) the expression level of tRF-Trp-CCA-014 in larvae and adults; (C) the expression level of tRF-Trp-CCA-014 in more adult ages; (D) the expression level of tRF-Trp-CCA-014 in 49-day-old fruit flies; (E) the expression level of tRF-Trp-CCA-014 in the nucleus and cytoplasm of mouse NIH3T3 cells; (F) the expression level of tRF-Trp-CCA-014 in different tissues of mice. E—egg; L1—the first instar larva; L2—the second instar larva; L3—the third instar larva; P—pupa; d—days. *, p < 0.05; **, p < 0.01; ***, p < 0.001; ns—no significance.
Ijms 24 06169 g003
Figure 4. Differentially expressed genes (DEGs) identified by RNA-seq after transfection of tRF-Trp-CCA-014 in mouse NIH3T3 cells. (A) The expression level of tRF-Trp-CCA-014 in Mimics, Mimic NC, Inhibitors, Inhibitor NC, Aging (adriamycin (ADR)), and Control (Normal) groups; (B) boxplot for FPKM values in different groups; (CE) the significantly up/downregulated DEGs among Mimics vs. Mimic NC groups, Inhibitors vs. Inhibitor NC groups, and Mimics vs. Inhibitors groups. In (A), different small letters indicate significant differences at p < 0.05 level.
Ijms 24 06169 g004
Figure 5. KEGG enrichment analyses of differentially expressed genes (DEGs) identified by RNA-seq in mouse NIH3T3 cells transfected with tRF-Trp-CCA-014 (p < 0.05). (AC) KEGG signalling pathways of Mimics vs. Inhibitors groups, Mimics vs. Mimic NC groups, and Inhibitors vs. Inhibitor NC groups, respectively. NC—negative control.
Ijms 24 06169 g005
Figure 6. GO enrichment analyses of differentially expressed genes (DEGs) identified by RNA-seq in mouse NIH3T3 cells transfected with tRF-Trp-CCA-014 (p < 0.05). (AC) GO terms of Mimics vs. Inhibitors groups, Inhibitors vs. Inhibitor NC groups, and Mimics vs. Mimic NC groups, respectively. NC—negative control.
Ijms 24 06169 g006
Figure 7. Target screening of tRF-Trp-CCA-014 in mouse NIH3T3 cells. (A) the overlapping DEGs between Mimics vs. Inhibitors groups and Aging (adriamycin ageing (adriamycin (ADR)) vs. Control (Normal) groups; (B) the overlapping DEGs in the immune system, cancer: overview, and immune disease; (C) the overlapping DEGs in (A,B); (D) the differentially expressed transcription factors between the Mimics vs. Inhibitors groups, including two upregulated genes and nine downregulated genes in the Inhibitors group when compared with the Mimics group; (E) the relative expression level of DEGs by qPCR; (F) sequence alignment of the H3C4 gene in mouse, human, and Drosophila. In (C): M—mimics; I—inhibitors; Aging—with ADR treatment; C—control (without ADR treatment); ∩—intersection in mathematics. UTR—untranslated region; CDS—coding sequence; *, p < 0.05; **, p < 0.01; ***, p < 0.001; ns—no significance.
Ijms 24 06169 g007
Figure 8. Analysis of the tRF-Trp-CCA-014-H3C4 network in mouse NIH3T3 cells. (A) Binding sites between tRF-Trp-CCA-014 and H3C4; (B) mutant sites of the H3C4 3′UTR; (C) binding properties of tRF-Trp-CCA-014-H3C4 by dual luciferase reporter gene assay in 293T cells. (D) H3C4 protein expression level after transfection with tRF-Trp-CCA-014 mimics, negative control of tRF-Trp-CCA-014 mimics, tRF-Trp-CCA-014 inhibitors, and negative control of tRF-Trp-CCA-014 inhibitors in mouse NIH3T3 cells by Western blot. (E) quantification of protein bands in Figure 7D; (F) DAPI; (G) SpGreen for H3C4; (H) merged fluorescent images of (F,H); (I) SpOrange for Trp-CCA-014; (J) merged fluorescent images of (F,I); (K) merged fluorescent images of (F,G,I). NC—negative control; UTR—untranslated region; *, p < 0.05; **, p < 0.01.
Ijms 24 06169 g008
Table 1. Primer sequences for real-time quantitative PCR (qPCR).
Gene NameForwards PrimersReverse Primers
tRF-Trp-CCA-014GGCGGTCACGTCGGGGAGTGCAGGGTCCGAGGTATT
tRF-Val-CAC-020GCGCGCGGTTTTCGTAGAGTGCAGGGTCCGAGGTATT
tRF-Val-TAC-003GCGCGCGGAGGAAGTAAGTGCAGGGTCCGAGGTATT
tRF-Val-TAC-004GCGCGCGGAGGAAGTAAAGTGCAGGGTCCGAGGTATT
tRF-Ala-AGC-007GCGGGGGATGTAGCTCAGAAGTGCAGGGTCCGAGGTATT
tRF-Ala-AGC-008GCGGGGGATGTAGCTCAGATAGTGCAGGGTCCGAGGTATT
tRF-Val-CAC-011GCGCGCGGTTTCCGTAAGTGCAGGGTCCGAGGTATT
tRF-Ala-TGC-004GCGGGGGATGTAGCTCAGTAGTGCAGGGTCCGAGGTATT
tRF-Ala-TGC-005CGGGGGATGTAGCTCAGTGAGTGCAGGGTCCGAGGTATT
tRF-Ala-TGC-006CGGGGGATGTAGCTCAGTGGAGTGCAGGGTCCGAGGTATT
U6TCTTGCTTCGGCAGAACATAGATTTTGCGTGTCATCCTTG
RP49GCCCAAGGGTATCGACAACACTTGCGCTTCTTGGAGGAGA
GAPDHTCTTCCAGGCGAACCACTTCAAGACGTCCACGAAGCGAAT
H3C11GTGAAGAAGCCTCACCGCTATACGTGCCAGTGTAGAAGGC
H4C11TGCTCCATAGCCATGTCTGGTTGGTGATGCCCTGGATGTT
H4C18ATCTCCGGCCTCATCTACGATAATTAGCCGCCGAATCCGT
DbpGCAGAGTCCTGTTCCTTGCTATTGTGTTGATGGAGGCGGT
Klf10CACCAGTGTCATCCGTCACAGGCTCAGGCTTGGATCTGTT
Nr1d1GAAGTGTCTCTCCGTTGGCAGAAGTGTCTCTCCGTTGGCA
H4C1ACTGGCTAGTGAGCTTCCTTTCGTAGATGAGGCCGGAGAT
H4C8ATCTCCGGCCTCATCTACGAAAGGGCCTTTTGTAGCAGAAAT
H2bC18ATCACTTCCCGGGAGATCCAAGCCTTTTGGGTAAAGCCGA
H3C4GCCTACCTTGTGGGTCTGTTAAGAGCCTTTGGTTAATTCCGT
H2bC4TACAACAAGCGCTCGACCATGGAATTCGCTACGGAGGCTT
H4c12GTGAACGACATCTTCGAGCGGGTGCTAGACGTCAACCCT
Pdx1AGCGTTCCAATACGGACCAGTGCTCAGCCGTTCTGTTTCT
H3c2GTTGCTTGTTTCTACCATGCCCTCGAGCGCTTGTTGTAATGC
Id3CTGAAGAGCTAGCACACGCTCTCTCGACACCCCATTCTCG
Zfp97TCCGGAATCCTTTTCGCTGGTGCCTGAGCTTCCTTCACAG
IL-1αTCTCAGATTCACAACTGTTCGTGAGAAAATGAGGTCGGTCTCACTA
IL-1βGAAATGCCACCTTTTGACAGTGTGGATGCTCTCATCAGGACAG
IL-6ATCCAGTTGCCTTCTTGGGACTGATAAGCCTCCGACTTGTGAAGTGGT
Disclaimer/Publisher’s Note: The statements, opinions and data contained in all publications are solely those of the individual author(s) and contributor(s) and not of MDPI and/or the editor(s). MDPI and/or the editor(s) disclaim responsibility for any injury to people or property resulting from any ideas, methods, instructions or products referred to in the content.