Article

MYB Transcription Factor OsC1PLSr Involves the Regulation of Purple Leaf Sheath in Rice

Guangdong Provincial Key Laboratory of Plant Molecular Breeding, South China Agricultural University, Guangzhou 510642, China
*
Author to whom correspondence should be addressed.
These authors contributed equally to this work.
Int. J. Mol. Sci. 2023, 24(7), 6655; https://doi.org/10.3390/ijms24076655
Submission received: 16 January 2023 / Revised: 31 March 2023 / Accepted: 31 March 2023 / Published: 3 April 2023
(This article belongs to the Section Molecular Genetics and Genomics)

Abstract

:
Although several regulators associated with purple traits in rice have been identified, the genetic basis of the purple sheath remains unclear. In the present study, F2-1 and F2-2 populations were constructed using purple sheath (H93S) and green sheath (R1173 and YHSM), respectively. In order to identify QTL loci in purple sheaths, BSA analyses were performed on the two F2 populations. A crucial QTL for purple sheath was identified, tentatively named qPLSr6, and was located in the 4.61 Mb to 6.03 Mb region of chromosome 6. Combined with expression pattern analysis of candidate genes, LOC_Os06g10350 (OsC1PLSr) was suggested as a candidate gene. The homozygous mutant KO-1 and KO-2 created through CRISPR/Cas9 editing, lost their purple leaf sheath. The RT-PCR revealed that OsC1PLSr, anthocyanin synthase (ANS), diflavonol-4-reductase (DFR), flavanone-3-hydroxylase (F3H), and flavanone-3′-hydroxylase (F3′H) expression levels were dramatically down-regulated in the mutants. The yeast report system indicated that the 145–272 aa region at the C-terminal of OsC1PLSr is a positive transcriptional activation domain. The results indicated that OsC1PLSr synthesized anthocyanins by regulating the expression of ANS, DFR, F3H, and F3′H. This study provides new insights into the genetic basis of the purple sheath.

1. Introduction

The general kinds of anthocyanin are geranium pigment, cornflower pigment, anthocyanin, morning glory pigment, mallow pigment, and paeoniflorin, and they are unevenly distributed in plants [1,2]. Anthocyanins belong to secondary metabolites, which stability is affected by the self-chemical structure and environmental factors. Structural genes mainly encode crucial enzymes in the anthocyanin biosynthesis pathway, such as phenylalanine ammonialyase (PAL) [3], cinnamic acid hydroxylase [4], chalcone synthase (CHS) [5], chalcone isomerase (CHI) [6], diflavonol-4-reductase (DFR) [7], anthocyanin synthase (ANS) [8]. Additionally, regulatory genes mainly encode transcription factors to regulate the spatio-temporal expression of structural genes in the anthocyanin biosynthesis pathway. At present, the critical transcription factors, including MYB, bHLH, and WD40 proteins, form a complex to modulate anthocyanin synthesis gene transcription for plant cell pigmentation [9,10,11].
The anthocyanin accumulation induced the purple trait in distinct rice organs. OsPL6 locates on the short arm of chromosome 6, and upregulate-expression of OsPL6 led to purple accumulation in the leaf [12]. OsB2 is related to regulating anthocyanin accumulation. Ectopic expression of OsB2 generates the production of purple or black pericarp in rice [13]. The genome-wide association study and transcriptome analysis showed that OsC1, OsRb, and DFR were identified as the determinants of anthocyanin biosynthesis in rice leaves [14]. Through bulked segregant analysis with next-generation sequencing (BSA-Seq) and transcriptome sequencing (RNA-Seq) strategies, identifying a recessive gene plr4, which was regulating purple leaf in rice and was located near the 27.9–31.1 Mb interval of chromosome 4 [15]. The C-S-A gene system controls hull pigmentation in rice. C1 is a color-producing gene that produces brown when acted alone but purple when combined with A1. In addition, S1 interacts with C1 to activate the expression of the gene A1, then producing purple and brown hulls [16].
Despite multiple regulators responsible for the purple trait have been characterized, molecular detail of purple leaf sheath genes remains unclear. Previous research reports that the purple leaf sheath of rice was controlled by one or two pairs of genes through genetic analysis. Recently, researchers found Ra/Rb and OsC1, located on chromosomes 1 and 6 [17,18], which regulate anthocyanin accumulation in rice leaf sheaths. Through yeast two-hybrid analysis, OsC1 was shown to interact with Rb1/Rb2 [17]. Although OsC1 was mapped to produce rice purple leaf sheath, there has been little functional analysis of OsC1 due to a lack of genetic transformation validation.
Therefore, this study performed BSA-Seq analysis using two F2 populations; the qPLSr6 QTL was identified, and the candidate gene encoding MYB protein (OsC1PLSr) was functionally validated. Knockout homozygous mutants had a purple leaf sheath loss phenotype. We found that the OsC1PLSr regulates anthocyanin synthesis through structural genes ANS, DFR, F3H, and F3′H. The results provided a theoretical basis for revealing the regulatory role of OsC1 in the purple leaf sheath.

2. Results

2.1. Observation of Leaf Sheath Phenotype

According to phenotypic analysis, H93S, R1173, and YHSM have purple, green, and green leaf sheaths, respectively (Figure 1a). Observation with a digital microscope showed that a large number of anthocyanins were distributed in the leaf sheaths of H93S, while the distribution of anthocyanins was rarely screened in R1173 and YHSM (Figure 1b). Consistently, anthocyanin accumulation in the leaf sheaths of H93S was significantly higher than R1173 (Figure 1c). In the two F2 segregating populations, the color of the leaf sheath could be categorized into purple and green, and the expected Mendelian segregation ratios were both 3:1 (Table 1). These results indicated that the anthocyanin content is positively correlated with the leaf sheath color, implying a complete dominant gene controls the purple leaf sheath trait.

2.2. Identification of Candidate Regions for Controlling Leaf Sheath Color by BSA-Seq

A total of 60.72 + 60.42 Gbp of raw data were obtained and filtered into 58.47 Gbp and 57.67 Gbp of clean data from the F2-1, and F2-2 populations, respectively. Through the analysis of the data quantity and quality of seven samples (two PLSBs, two GLSBs, and three parents), it found that Q30s were all above 90.00%, and the GC content of the seven samples’ clean data ranged from 44.33% to 44.77% (Table 2). The average reading depth of seven samples ranged from 25× to 40×. According to sequencing data, 97.96–98.58% of the sequences can be successfully aligned to the reference genome R498. These results illustrated that all samples were of good sequencing quality and could be used for subsequent variation analysis. After filtering low-quality SNPs and InDels, finally, 675,512 SNPs and 140,374 InDels with credible and high quality were obtained from the F2-1 population, 466,796 SNPs and 96,738 InDels with credible and high quality from the F2-2 population (Table 3).
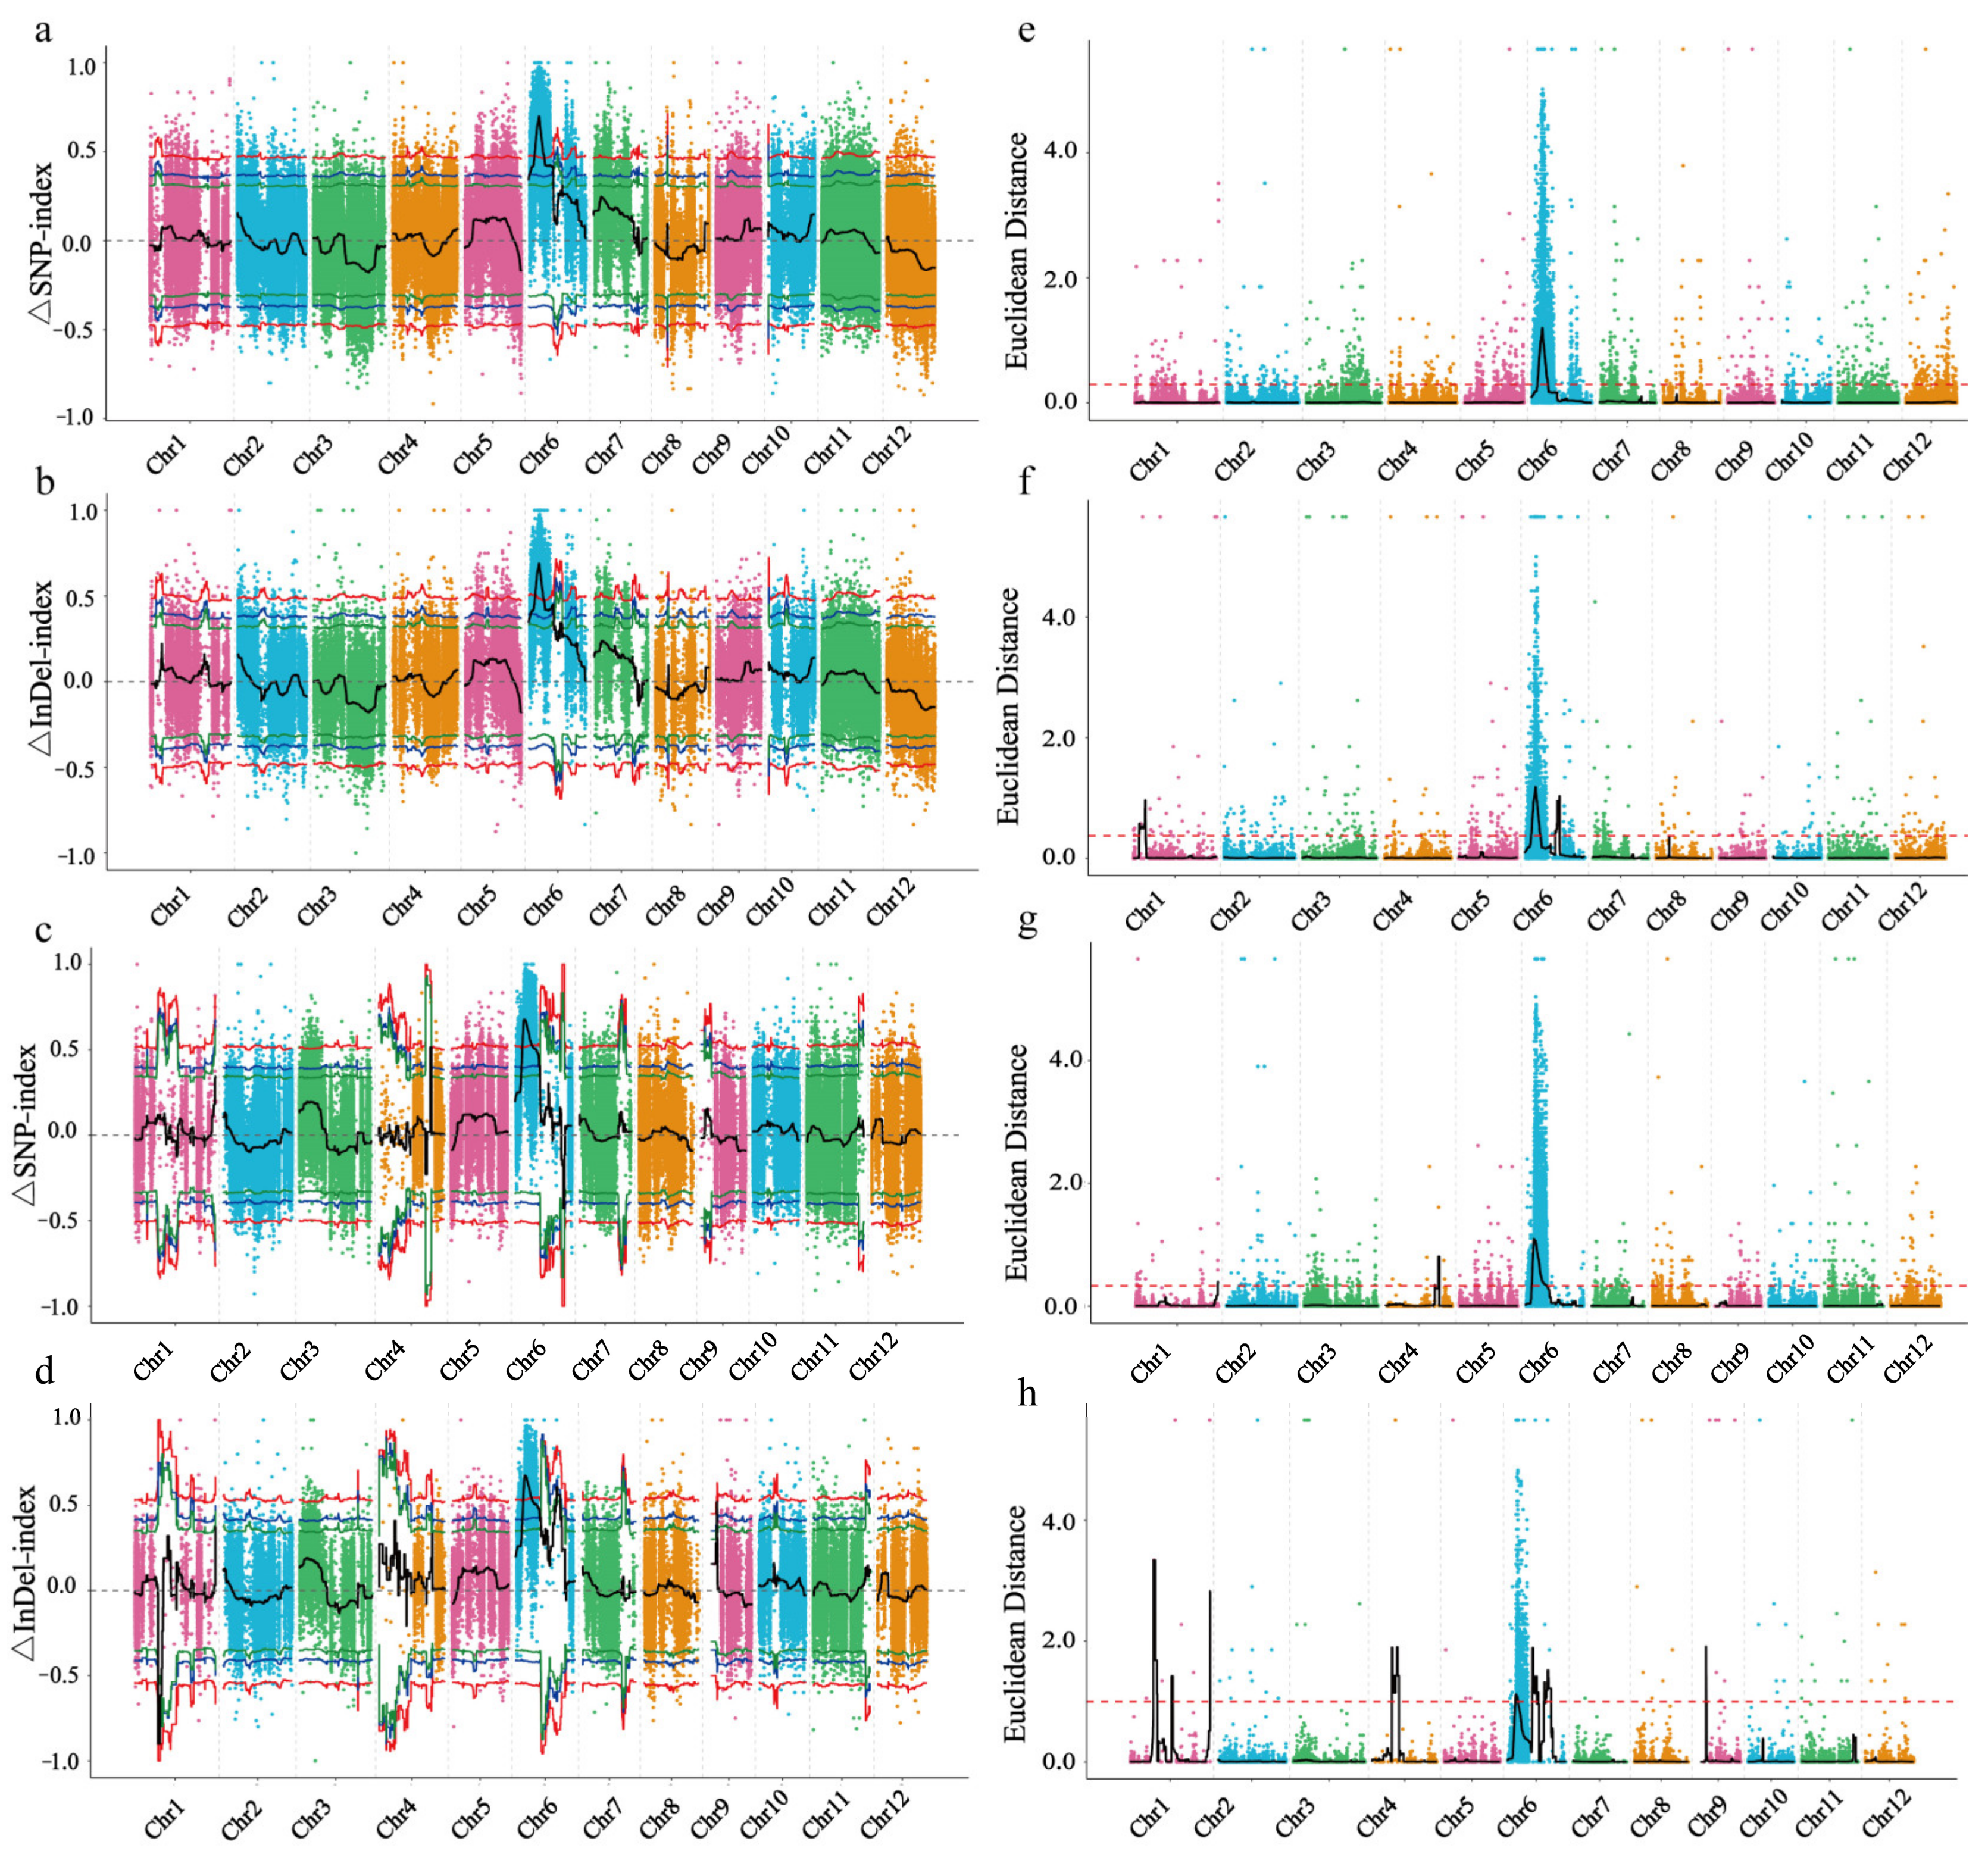
The ∆All-index (∆SNP-index and ∆Indel-index) and ED (Euclidean Distance) were calculated for variation analysis. The charts were plotted from the ∆All-index and ED (Figure 2). In the F2-1 population, the interval for the candidate genes exceeding the threshold value was identified on the 3.33–8.72 Mb of chromosome 6 covering 1415 genes by SNP association analysis, while it was identified on the 3.37–8.55 Mb of chromosome 6 covering 1274 genes by InDel association analysis (Figure 2a,b,e,f; Table 4). Thus, the interval of the F2-1 population was identified on the 3.37–8.55 Mb of chromosome 6 and had 1274 genes. In the F2-2 population, the interval for the candidate gene exceeding the threshold value was identified on the 4.03–9.06 Mb of chromosome 6 and had 1257 genes by the SNP association analysis, and on the 4.61–6.03 Mb of chromosome 6 and had 415 genes by the InDel association analysis (Figure 2c,d,g,h; Table 4). Thus, the interval of the F2-2 population was identified on the 4.61–6.03 Mb of chromosome 6 and had 415 genes. Both the populations were located on the 4.61–6.03 Mb of chromosome 6. These results suggested that the candidate genes of the purple leaf sheath of H93S were located in the 1.42 Mb region of chromosome 6 from 4.61 Mb to 6.03 Mb.

2.3. Analysis of Candidate Genes

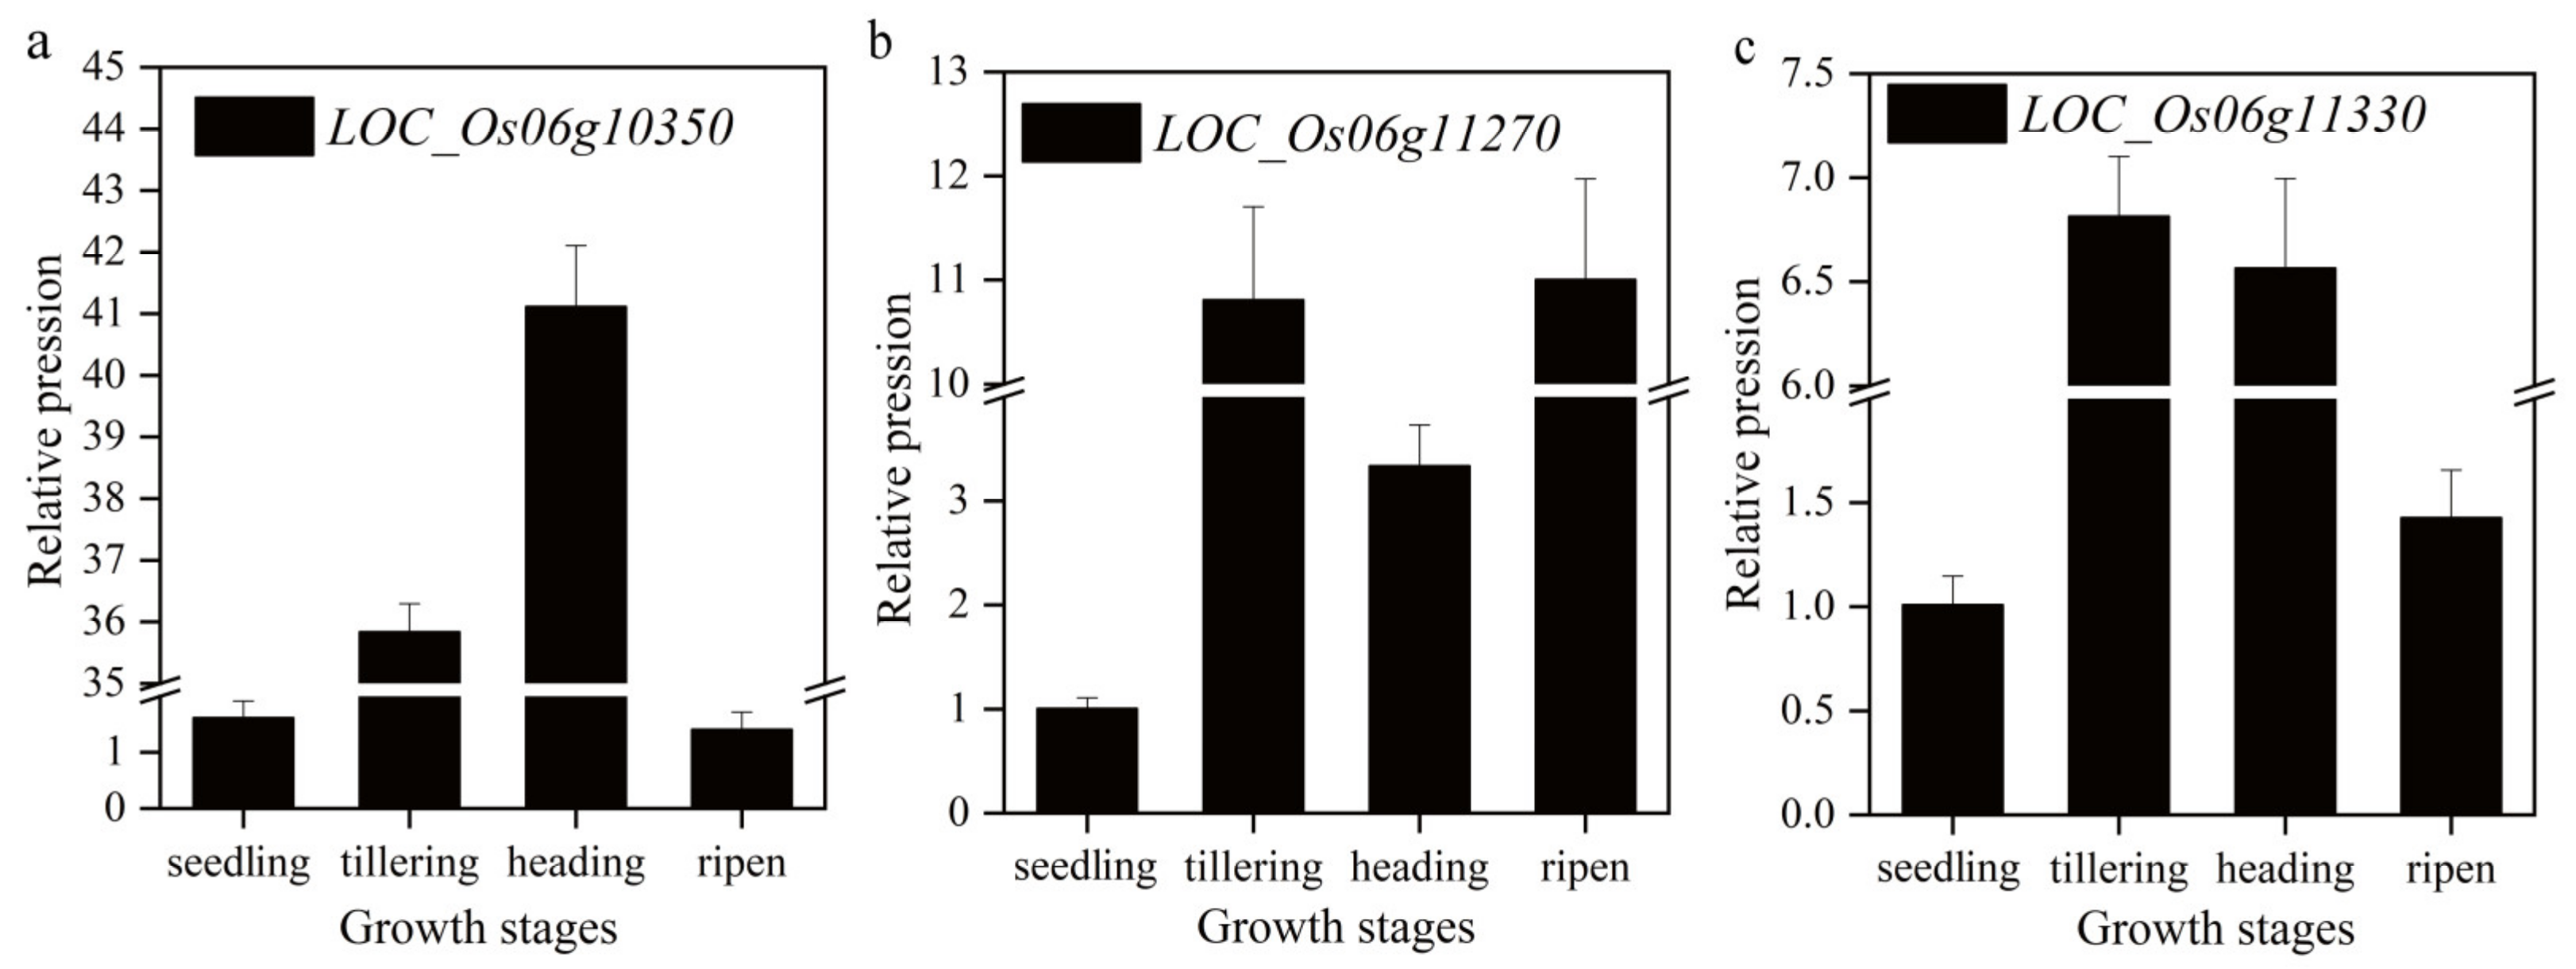
There were 415 genes with the 1.42 Mb region of chromosome 6. Among the 415 genes, 27 were expressed in rice leaf sheath by the public date expression spectrum CREP analysis (Table 5). Then, annotated by Rice Genome Annotation Project, three genes (LOC_Os06g10350, LOC_Os06g11270, and LOC_Os06g11330) were involved in the anthocyanin synthesis pathway and were considered as candidate genes (Table 5). qRTPCR results showed that the expression pattern of LOC_Os06g10350 in rice leaf sheath was “up-up-up-down” (Figure 3a) at four growth stages, which was consistent with the change of anthocyanin content in the four growth periods of H93S, and the expression level reached the peak at heading stage. While the expression patterns of LOC_Os06g11270 and LOC_Os06g11330 were “up-up-down-up” and “upup-down-down”, respectively (Figure 3b,c). SO, LOC _Os06g10350 was considered to be a strong candidate for the OsC1PLSr locus, which is co-located with OsC1 [18].

2.4. Knockout of OsC1PLSr Results in No Purple Leaf Sheath Phenotype

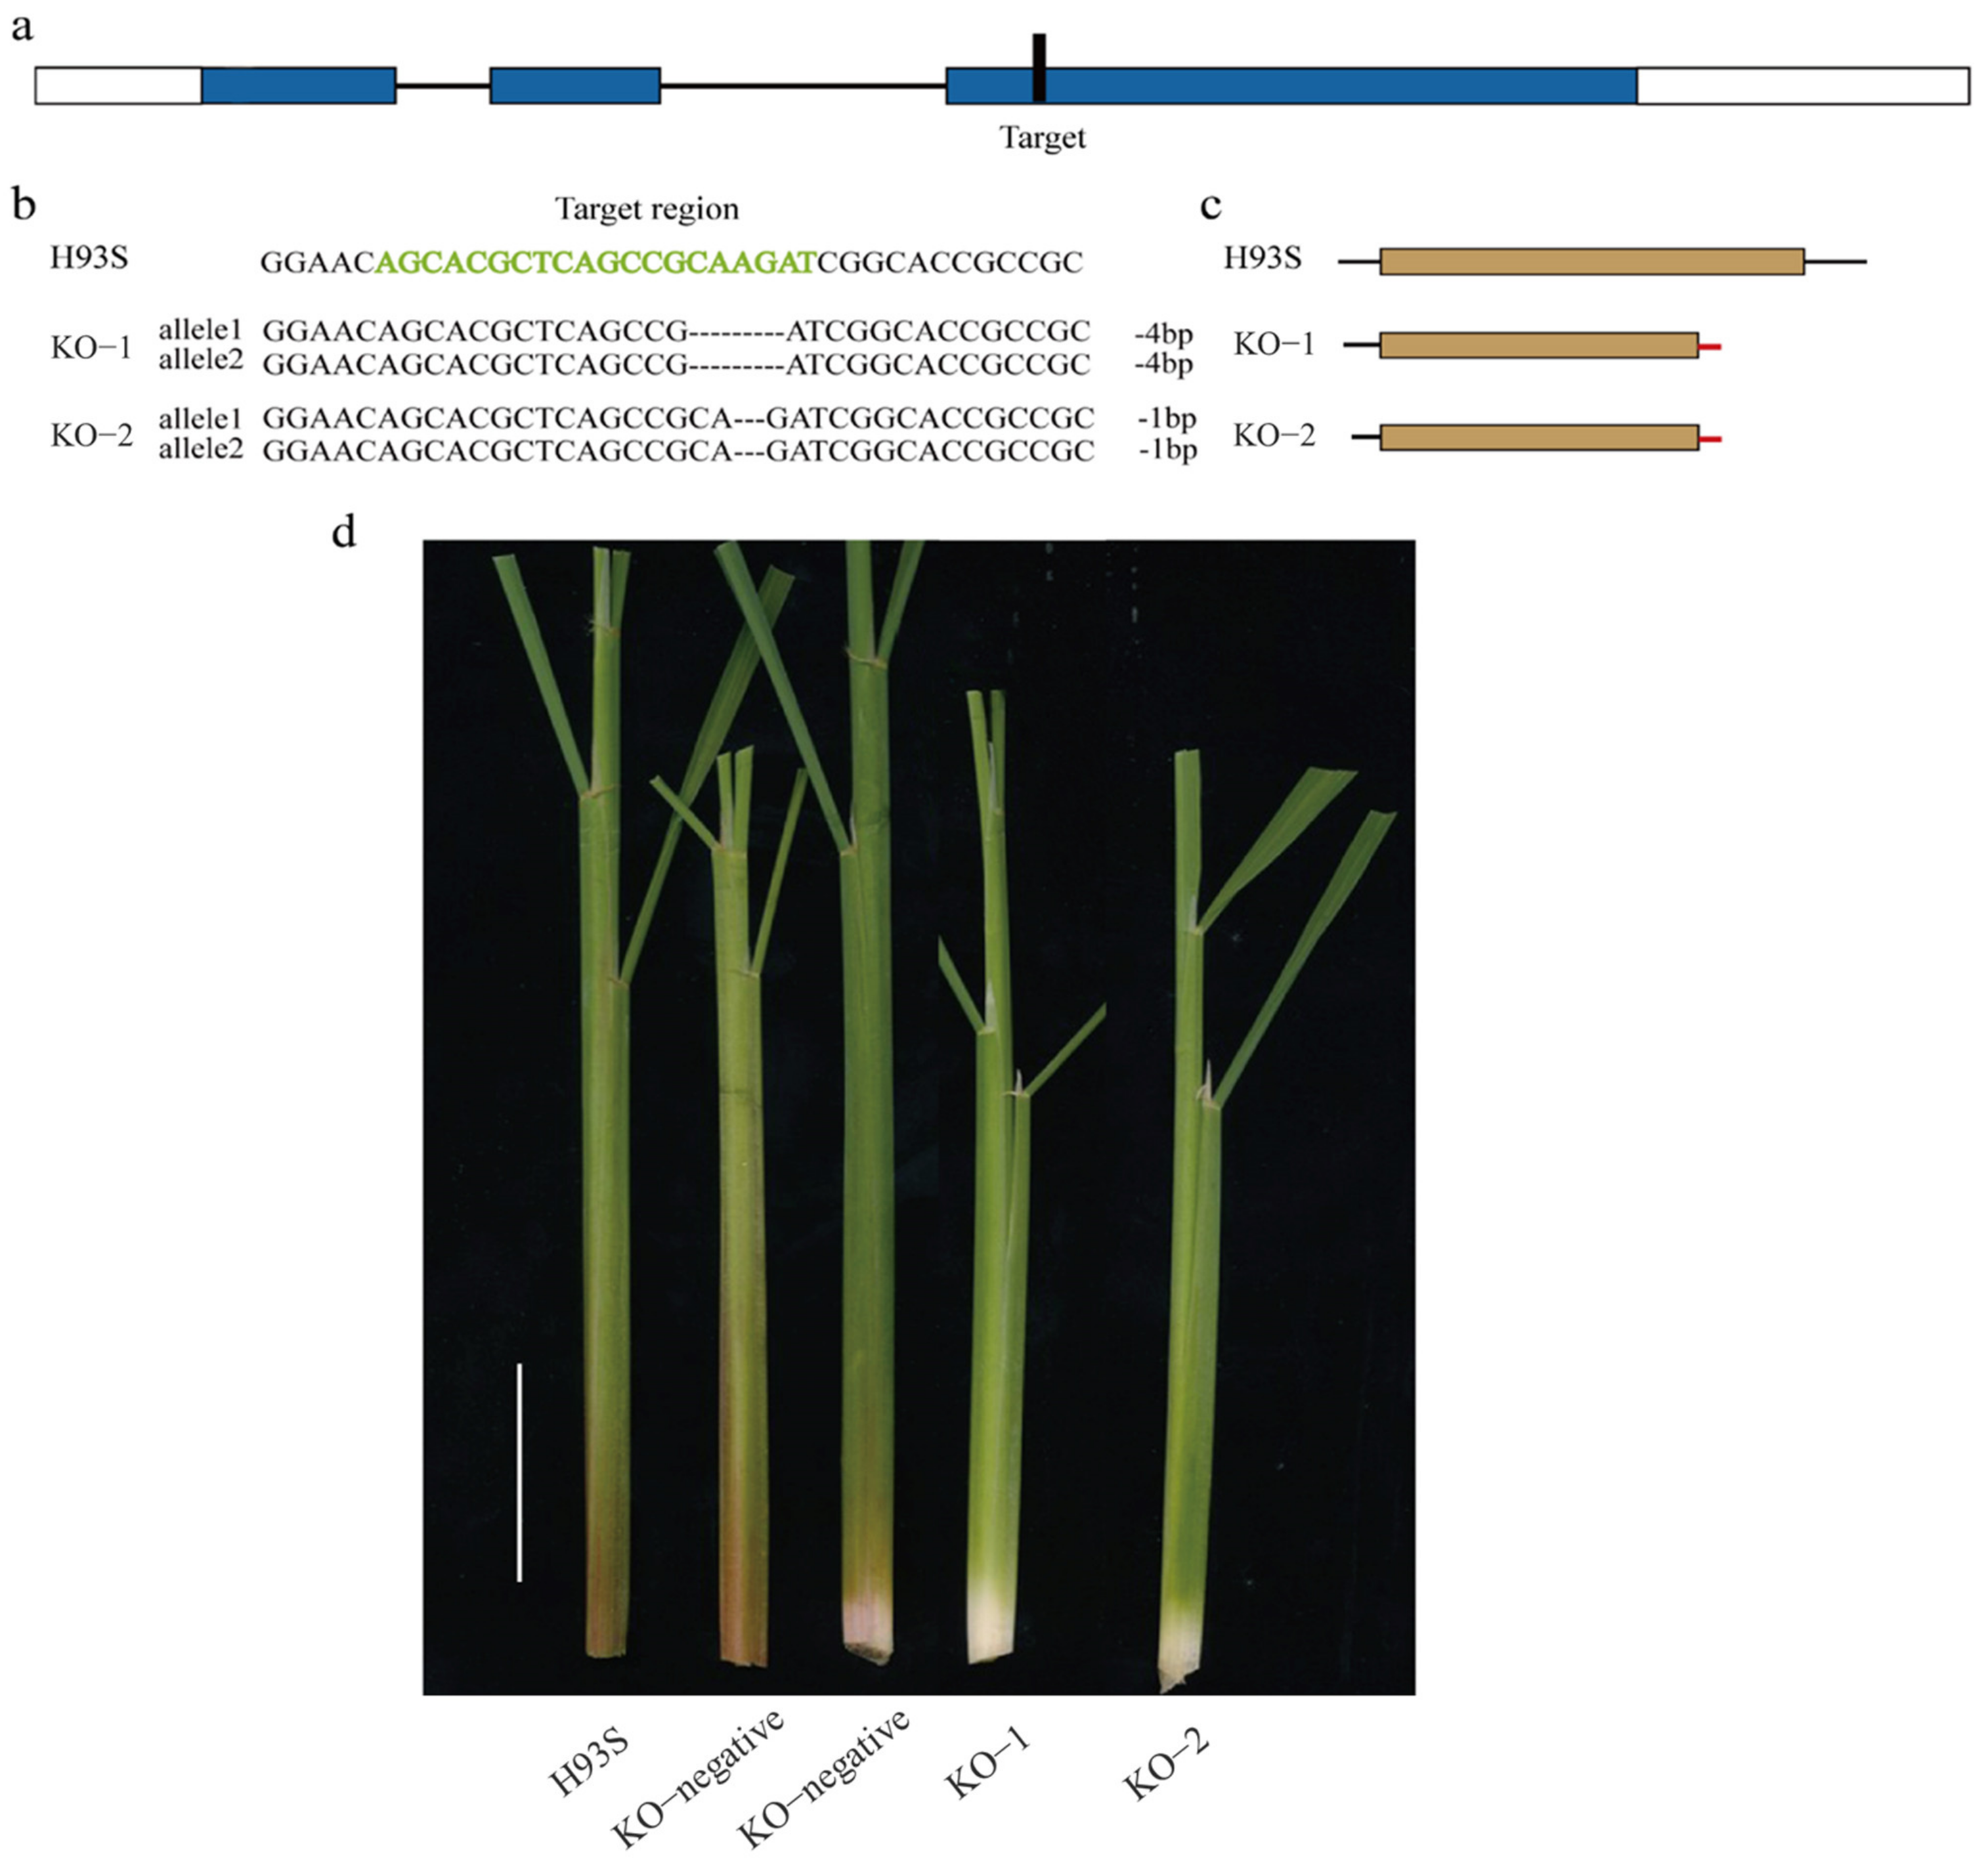
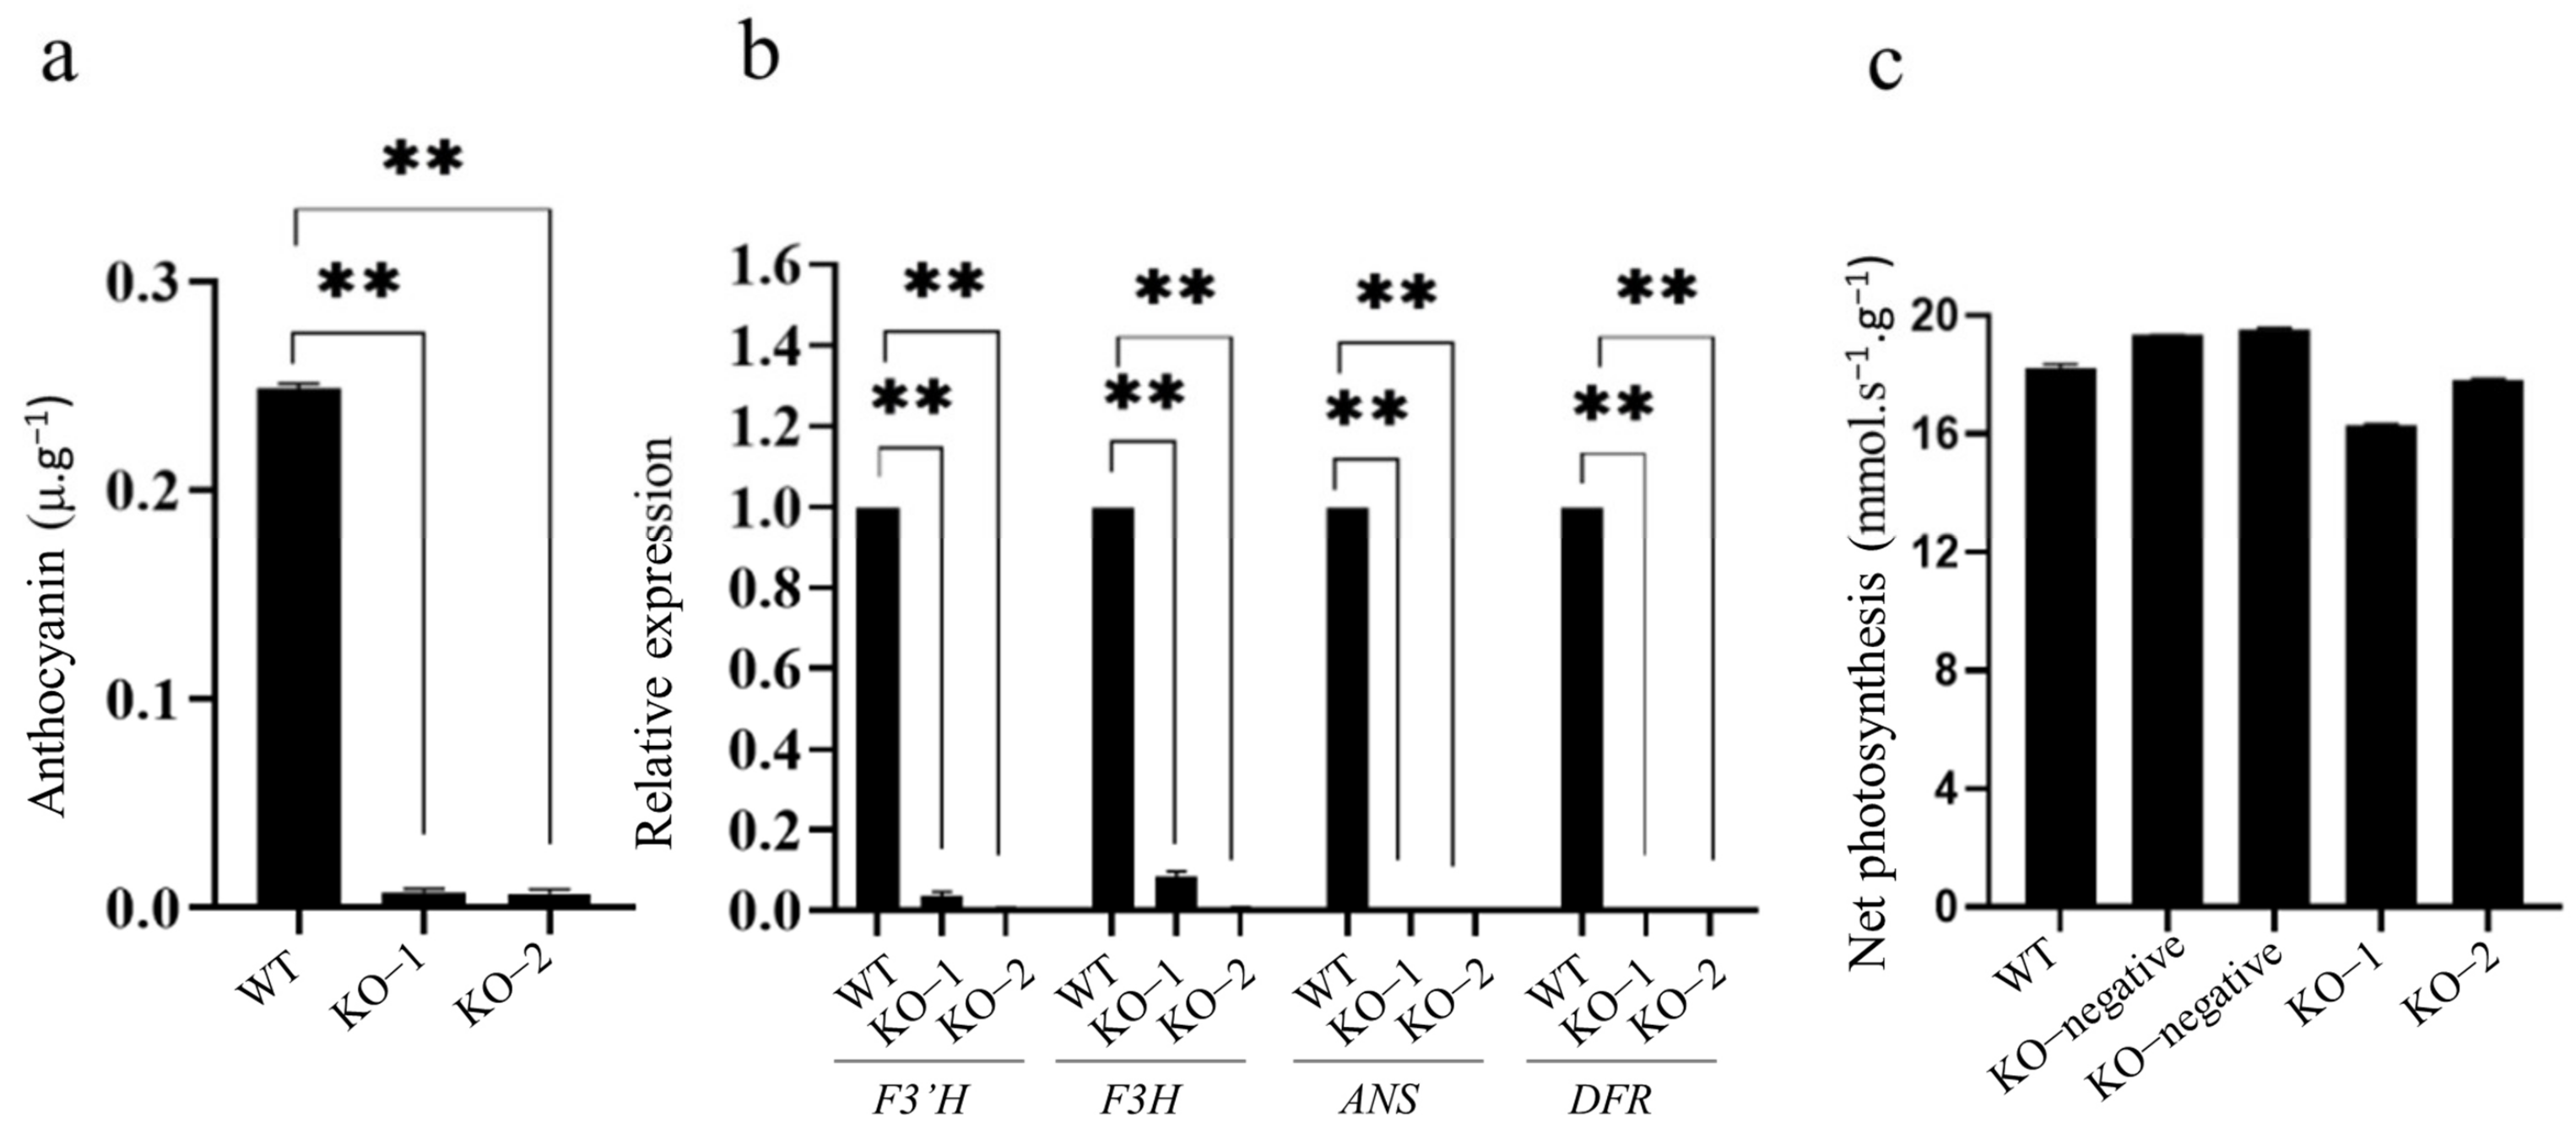
To verify the function of OsC1PLSr in H93S, we used the CRISPR/Cas9 genomic editing system to knockout OsC1PLSr in H93S to obtain homozygous lines KO-1 and KO-2 (Figure 4a). The KO-1 and KO-2 harbored allelic homozygous insertions or deletions of base pairs, which caused premature termination of the OsC1PLSr protein (Figure 4b,c). Anthocyanin contents were measured in transgenic plants at tillering stage. The anthocyanin contents in the leaf sheath of mutant lines were significantly lower than H93S (Figure 5a). Besides, the relative expression of structural genes DFR, ANS, F3H, and F3′H in mutant lines was down-regulated (Figure 5b). Further phenotypic identification showed that the leaf sheath color was green of all these mutants (Figure 4d). In addition, the photosynthesis of mutant lines and H93S was not significantly different (Figure 5c). These results demonstrated that the two domains of OsC1PLSr play a critical role in inducing anthocyanin biosynthesis. In addition, the anthocyanin biosynthetic genes, DFR, ANS, F3H, and F3′H, were up−regulated by the activation of Myb transcription factor gene OsC1PLSr, guided to the accumulation of anthocyanin in H93S.

2.5. Structure Analysis, Transcription Activity Analysis, and Toxicity Detection

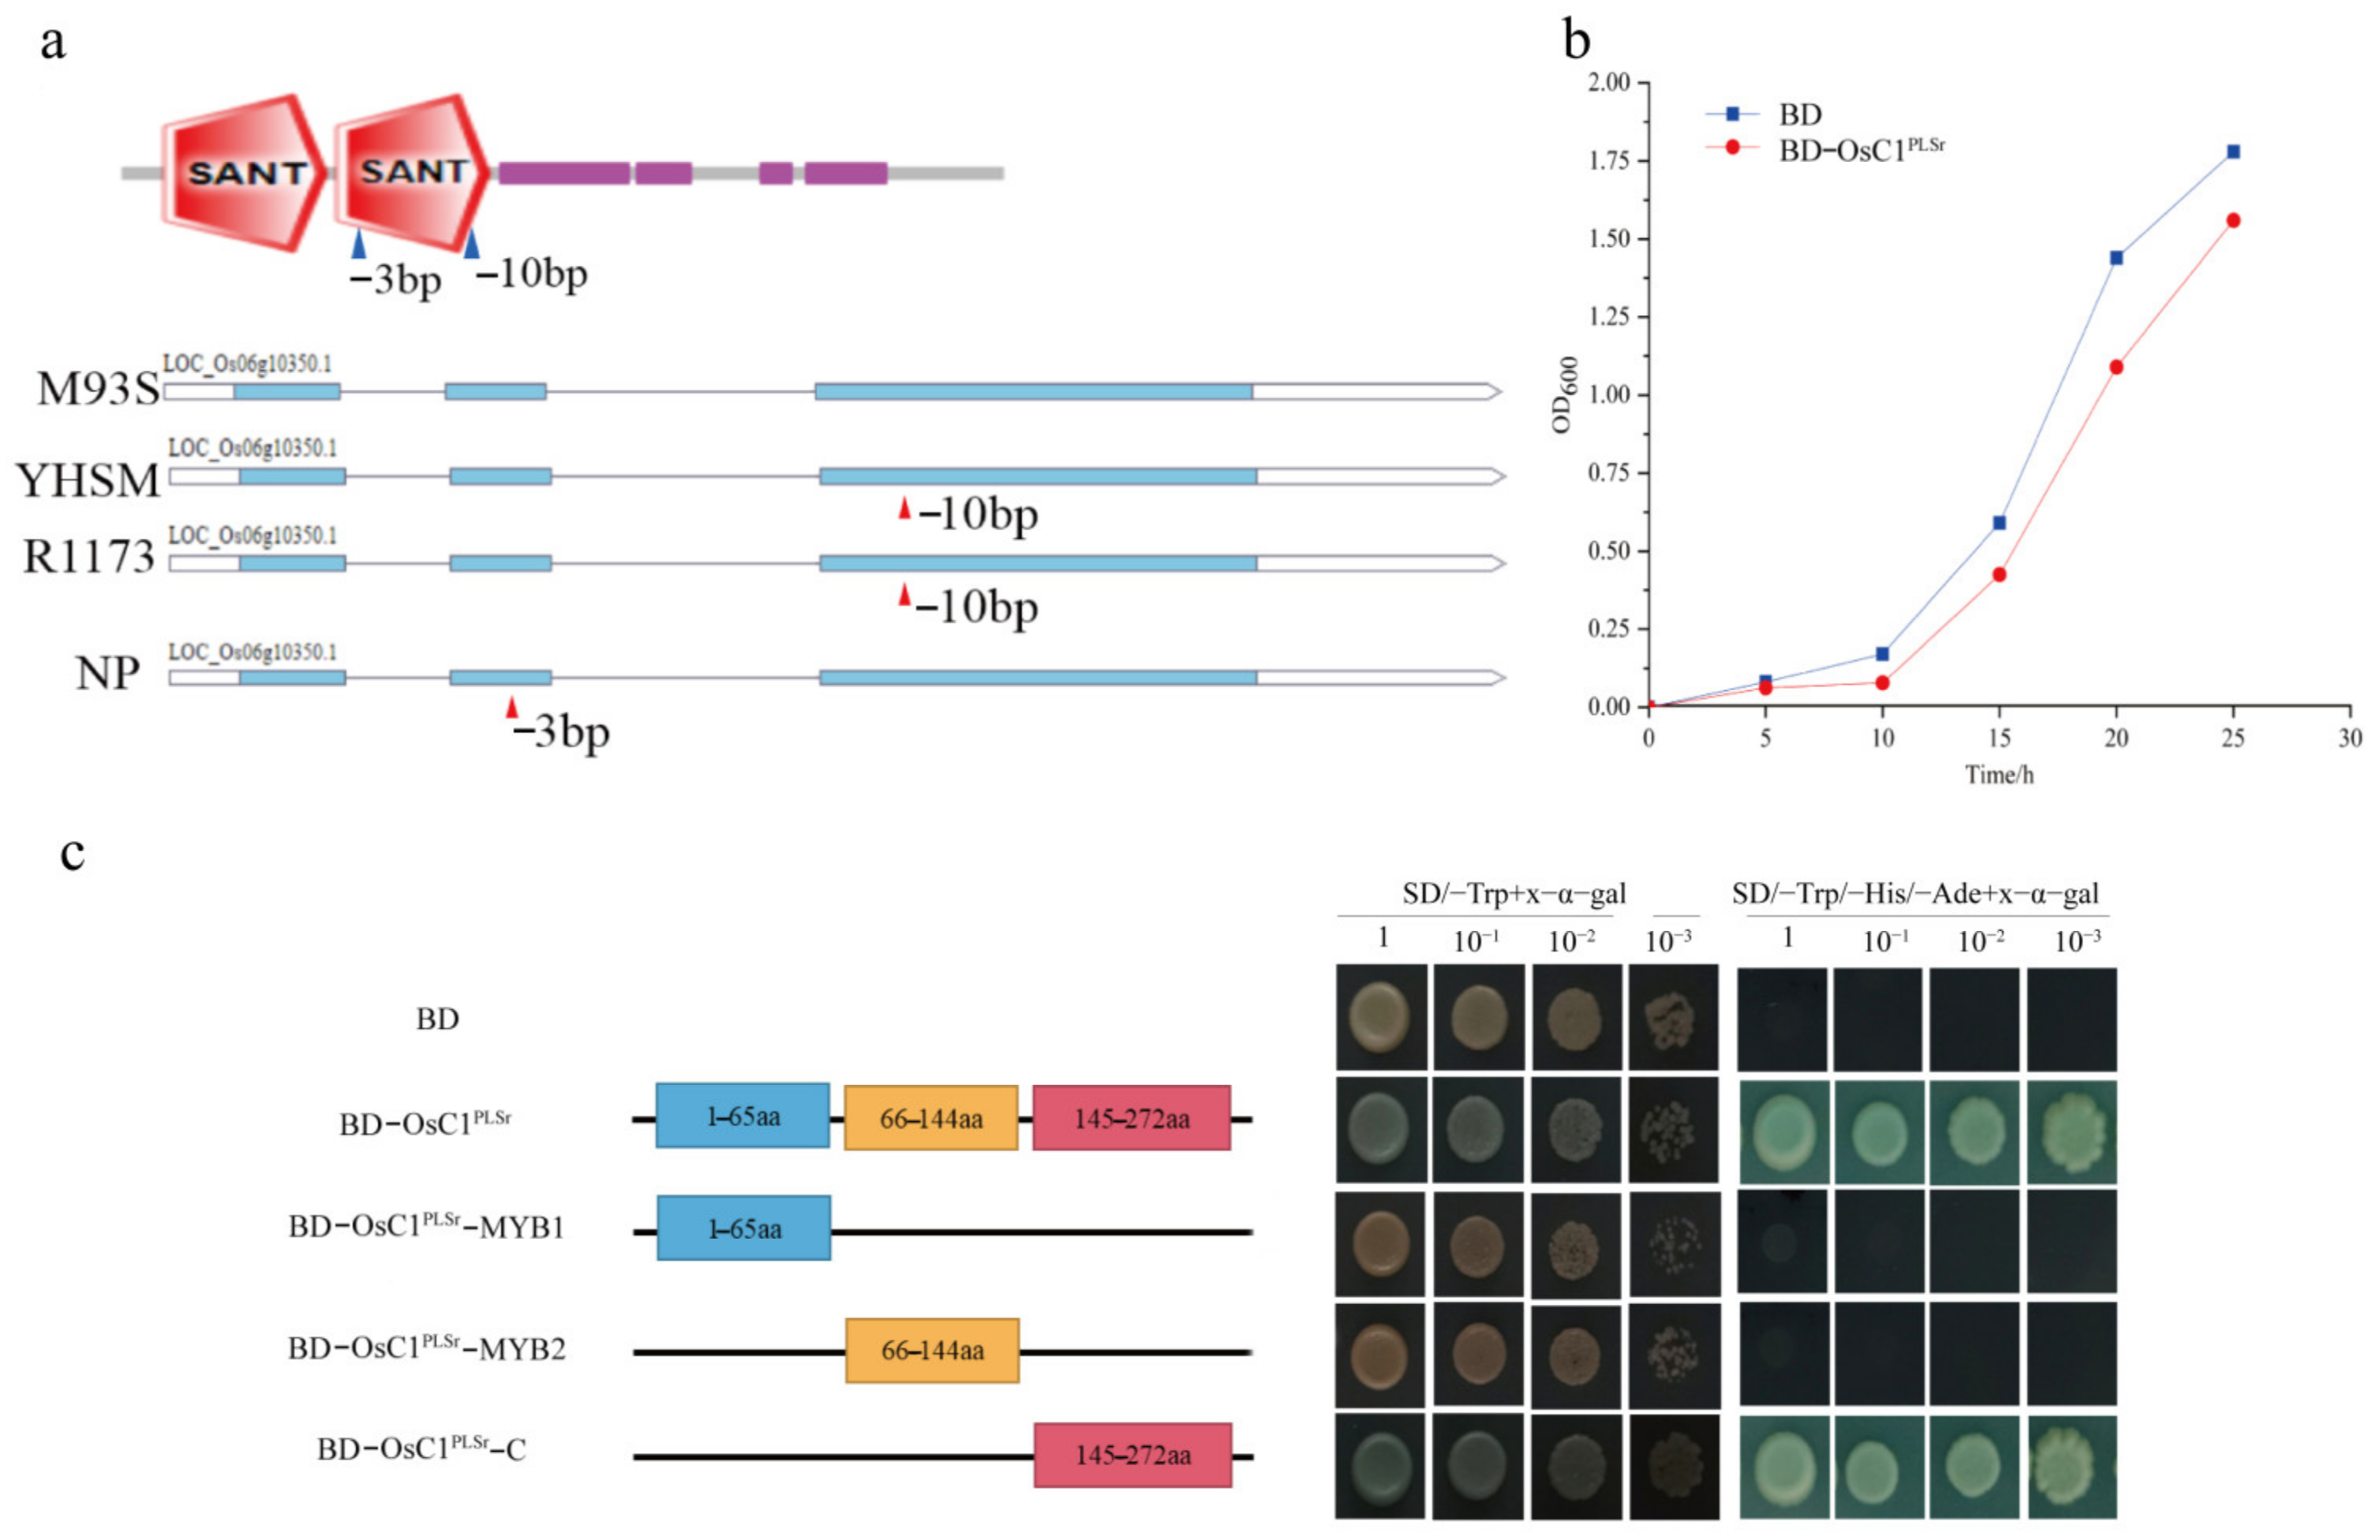
H93S with purple leaf sheath possessed a full-length DNA sequence of OsC1PLSr encoding 273 amino acids. Whereas R1173 and YHSM with green leaf sheath had a 10-bp deletion in exon 3 and only 207 amino acids. There was a 3-bp deletion in exon 2 in the green leaf sheath of Nipponbare (Figure 6a). OsC1PLSr contains two conserved domains (R2-MYB and R3-MYB), and the two deletion sites were located in the R3-MYB domain (Figure 6a). The results revealed that an aberrant R3 MYB domain of OsC1PLSr failed to induce anthocyanin synthesis in R1173, YHSM, and Nipponbare.
To further study the function of OsC1PLSr, by the toxicity detection assay, we found the growth curve of the yeast cells containing the negative control pGBKT7 (BD) was higher than pGBKT7-OsC1PLSr (BD-OsC1PLSr). This result demonstrated that the protein encoded by OsC1PLSr had a slightly toxic effect on the growth of yeast cells (Figure 6b). In addition, we constructed various regions of the OsC1PLSr protein by using the yeast report system. These regions included the MYB1 domain, MYB2 domain, C-terminal region, and the full-length OsC1PLSr. The regions were fused to the GAL4 DNA-binding domain in the pGBKT7 vector, respectively. Then, they were all transformed into AH109 yeast cells. These results indicated that the amino acids 145–272 region of the C-terminal in OsC1PLSr were responsible for transcriptional activation activity; the MYB domain did not perform transcriptional activation function (Figure 6c).

3. Discussion

Anthocyanins are flavonoids, which are secondary metabolites produced by plants that generally increase with the stimulation of biotic or abiotic stress [19]. Target QTL can be located rapidly and precisely using BSA in conjunction with high-throughput genotyping technologies from next-generation sequencing. In this study, we first constructed two F2 populations and then used BSA-seq technology for preliminary mapping. Both F2 populations were used to map the purple leaf sheath gene. It is possible to swiftly and precisely identify the candidate interval by association analysis of the two populations. To accurately screen potential genes. There was no extensive population mapping done. As a result, labor is saved.
R2R3-MYB transcription factors have been clarified to participate in the determination of anthocyanin synthesis and regulation in plants. The gene TT2 of Arabidopsis encoding R2R3-MYB protein regulates proanthocyanidin biosynthesis by activating the expression of ANR, while the closely related MYB PAP4 protein (AtMYB114) specifically activates UFGT expression and regulates the anthocyanin biosynthesis [20]. However, few studies have reported how MYB domains regulated the synthesis of anthocyanin in the leaf sheath of rice. In this study, we found that two MYB domains of OsC1PLSr were essential for anthocyanin synthesis in the leaf sheath. We found that only the amino acids 145–272 region of the C-terminal in OsC1PLSr were responsible for transcriptional activation activity, while the MYB domain has no transcriptional activation effect, which indicated that MYB domain was only responsible for directly binding DNA sequence with target gene, but not for its own transcriptional activation effect. Therefore, it is speculated that the R2R3-MYB transcription factor OsC1PLSr in H93S may also bind to the promoters of DFR, ANS, F3H, and F3′H genes to activate the expression of these four structural genes. However, through the analysis of 2 Kb promoters upstream of DFR and F3′H genes by the Plant CARE of promoter prediction analysis website, the results showed that the promoters of DFR and F3′H genes contained light responsive MYB binding site (AACCTAA). Therefore, OsC1PLSr may directly regulate the expression of DFR and F3′H. The regulatory effect of OsC1PLSr on DFR and F3′H gene expression needs to be further studied.
In addition, the purple leaf sheath is the most stable, early, and visible trait for rice tissues, which is an excellent visual marker-trait [21]. There was coupled CRISPR/Cas9 unit with the OsC1PLSr unit, and the high-level expression of Cas9 was a good indication of anthocyanin accumulation of edited plants [22]. Thus, if the purple leaf sheath OsC1PLSr was applied to rice breeding, the efficiency of rice hybrid breeding would be greatly improved, and the yield of hybrid rice would be increased. These results provided a basis for further understanding the genetic mechanism of leaf sheath color as well as its potential utilization in a two-line hybrid rice breeding system.

4. Materials and Methods

4.1. Plant Materials and Genetic Population Construction

A purple leaf sheath two-line male sterile line Hang93S (H93S) was used as the female parent, and two green leaf sheath conventional lines (R1173, YHSM) were used as male parental lines. H93S hybrid with R1173 and YHSM to produce the F1 generations, and two F1s self-pollinated to produce F2-1, and F2-2 populations, respectively. Both F2 populations, each of which consists of 1000 plants with no replication, were used to map the purple leaf sheath gene (OsC1PLSr). H93S and R1173 were used for leaf sheath histology analysis, anthocyanin content analysis, and UV-C irradiation treatment. All the plant materials were cultivated in the experimental field at South China Agricultural University (Guangzhou, China), followed by routine field management.

4.2. BSA Sequencing and Association Analysis

At the tillering stage, purple leaf sheath bulks (PLSBs) and green leaf sheath bulks (GLSBs) selected from the F2 population were constructed by pooling equivalent amounts of DNA from 50 purple and 50 green individuals. The healthy leaf sheaths of three parents (H93S, R1173, and YHSM) were collected to construct parental pools. The genomic DNA was extracted by CTAB for BSA sequencing. All DNA of two PLSBs, two GLSBs, and three parental pools were constructed into a library according to the manufacturer’s recommended protocol. BSA sequencing was performed using whole genome sequencing on HiSeq 2000 platform (Illumina) by Biomarker Technologies Co., Ltd. (Beijing, China). Since all the parents (H93S, YHSM, and R1173) are indica lines, R498 was therefore selected as the reference genome (http://mbkbase.org/R498/, accessed on 10 June 2021). Sequencing data were subjected to quality control and mapped to R498. The raw reads of the fast format were first processed through a series of quality control procedures to remove low-quality paired reads. Before association analysis, SNPs and InDels must be filtered. Firstly, SNPs (InDels) with multiple genotypes were screened; Secondly, SNPs (InDels) with read support of less than 4 were filtered out. Thirdly, mixing pool genotype SNPs (InDels) were screened from the recessive mixing pool genotype SNPs (InDels) of non-recessive parents. Finally, high-quality and credible SNPs and InDels were obtained for subsequent analysis. Using △All-index (△SNP-index and △Indel-index) and ED (Euclidean Distance), the region linked to the target gene was mapped by comprehensive analysis.

4.3. Screening of Candidate Genes

The association regions obtained from two F2 populations were comprehensively analyzed, and the intersection of the association regions located by both populations was selected as the candidate region of the purple leaf sheath gene. The expression profile of the public database CREP (http://crep.ncpgr.cn/, accessed on 5 December 2022) was used to screen candidate genes. The Rice Genome Annotation Project database (RGAP) annotates the putative functions of candidate genes. In order to confirm the final candidate genes, qRT-PCR analysis was used to verify their expression at the heading stage.

4.4. Histological, Anthocyanin Content, and Genetic Analysis

At the heading stage, longitudinal sections of rice leaf sheath were obtained by freehand sectioning, and the distribution of anthocyanins in leaf sheath cells was observed by using a digital microscope (OLYMPUS CX31). Anthocyanins were extracted from 0.5 g of finely ground leaf sheath tissue as described by Nakatskaa et al. [23]. Anthocyanin content (u.g−1) = OD/w, wherein “w” is the fresh weight of the leaf sheath. The leaf sheath color separation ratio in two F2 populations was investigated and calculated by the Chi-square test.

4.5. Sequence Analysis and Structure Analysis of OsC1PLSr

Specific primers linked to the OsC1PLSr gene were used to amplify gene sequences separately from the three parental lines (H93S, R1173, and YHSM) via using Phanta® Max Super-Fidelity DNA Polymerase. Sequence alignment was performed with SnapGene. The CDS of OsC1PLSr from the purple and green leaf sheath parental lines were cloned and subjected to alignment by SnapGene. Structure analysis of the OsC1PLSr protein was performed by using the SMART database (www.smart.embl-heidelberg.de, accessed on 5 December 2022).

4.6. CRISPR/Cas9 Generated the OsC1PLSr Mutant Plants

Based on the conversed structure of OsC1PLSr protein, an independent site in the exon 3 was designed as CRISPR/Cas9 spliced sites by CRISPR–P [2]. The fragment containing the target was recombined with the pRGEB32 vector, which was digested by BsaI. Through the use of Agrobacterium tumefaciens, the constructs were transformed into H93S [24].

4.7. Transcription Activity Assay and Toxicity Detection in Yeast Report System

In order to determine the OsC1PLSr transcriptional activity domain, various regions of the OsC1PLSr protein coding sequence, including the R2-MYB domain (MYB1, 1-65aa), R3-MYB domain (MYB2, 66-144aa), C-terminal region (C,145-272aa) and the full-length OsC1PLSr were amplified and inserted into EcoRI/BamHI-digested pGBKT7 vector. The recombination vectors and the negative control pGBKT7 (empty vector) were transformed into yeast strain AH109. The positive transformants were grown on SD/-Trp solid medium and SD/-Trp-His-Ade solid medium for three days at 30 °C. χ-α-gal was used to determine the transcription activation activity of the OsC1PLSr protein regions in the yeast expression system. Besides, in order to determine whether the OsC1PLSr protein produced a toxic effect on yeast growth, the yeast strains transformed with the recombination vectors pGBKT7-OsC1PLSr (BD-OsC1PLSr) and others with the negative control pGBKT7 (empty vector, BD) were cultured with SD/-Trp liquid medium, respectively, which were shaken by shaker incubator (TENSUC). The OD600 values were measured at five-time points (5 h, 10 h, 15 h, 20 h, and 25 h), and the growth curve was drawn.

4.8. RNA Extraction and Quantitative qRT-PCR

Total RNA was extracted from the leaf sheath of H93S across the entire growth period; first, cDNA was synthesized by using the GoScript™ (Fisher Scientific, Waltham, MA, USA) Reverse Transcription System (Promega). The qRT-PCR verification was performed with three techniques repeated. The AceQ® qPCR SYBR® Green Master Mix was used for the reaction on a StepOnePlus® Real-Time PCR System 272007300 (applied biosystems® life technologiesTM, Carlsbad, CA, USA). Differences in gene expression were calculated using the 2−ΔΔCt method. The actin gene was used as an internal reference control. The expression level of eight structural genes (ANS, DFR, F3H, F3′H, F3′5′H, PAL, CHS, and CHI) and candidate genes of the leaf sheath of H93S were analyzed by qRT-PCR.

5. Conclusions

The purple leaf sheath is a quality trait that can be recognized by the naked eye at the seedling stage. The application of purple leaf sheaths in breeding is of great significance. In this study, two F2 populations from the crossing of purple leaf sheath with green leaf sheath were constructed, BSA sequencing was performed, and candidate region qPLSr6 was located. OsC1PLSr was found to be a potential candidate gene. The constructed knockout mutant showed a purple sheath deletion phenotype, indicating that OsC1PLSr is closely related to the purple sheath phenotype. The results of the yeast report system showed that OsC1PLSr had a transcriptional activation function. The discovery of this result laid the foundation for revealing the molecular regulation mechanism of the purple leaf sheath.

Author Contributions

Conceptualization, M.H. and H.W.; Methodology, T.G. and J.W.; Validation, X.W., T.S. and J.D.; Writing—original draft, T.Z. and H.R.; Writing—review & editing, L.W. All authors have read and agreed to the published version of the manuscript.

Funding

This research was funded by Guangzhou key research and development project, grant number 202206010015.

Institutional Review Board Statement

Not applicable.

Informed Consent Statement

Not applicable.

Data Availability Statement

The data presented in this study are available upon request from the corresponding authors.

Acknowledgments

The authors thank Biomarker Biotechnology Co., Ltd. (Beijing, China) for assistance with the bioinformatics analysis and thank Hao Liu from Guangdong Academy of Agricultural Science (GAAS) for revising the manuscript.

Conflicts of Interest

The authors declare no conflict of interest.

References

  1. Khoo, H.E.; Azlan, A.; Tang, S.T.; Lim, S.M. Anthocyanidins and anthocyanins: Colored pigments as food, pharmaceutical ingredients, and the potential health benefits. Food Nutr. Res. 2017, 61, 1361779. [Google Scholar] [CrossRef] [PubMed] [Green Version]
  2. Ma, X.; Zhu, Q.; Chen, Y.; Liu, Y.-G.J.M.P. CRISPR/Cas9 platforms for genome editing in plants: Developments and applications. Mol. Plant 2016, 9, 961–974. [Google Scholar] [CrossRef] [PubMed] [Green Version]
  3. Guo, J.; Wang, M.H. Ultraviolet A-specific induction of anthocyanin biosynthesis and PAL expression in tomato (Solanum lycopersicum L.). Plant Growth Regul. 2010, 62, 1–8. [Google Scholar] [CrossRef]
  4. Wang, Z.; Jian, X.; Zhao, Y.; Li, S.; Sui, Z.; Li, L.; Kong, L.; Luo, J. Functional characterization of cinnamate 4-hydroxylase from Helianthus annuus Linn using a fusion protein method. Gene 2020, 758, 144950. [Google Scholar] [CrossRef]
  5. Hemleben, V.; Dressel, A.; Epping, B.; Lukacin, R.; Martens, S.; Austin, M. Characterization and structural features of a chalcone synthase mutation in a white-flowering line of Matthiola incana R. Br. (Brassicaceae). Plant Mol. Biol. 2004, 55, 455–465. [Google Scholar] [CrossRef]
  6. Yin, Y.C.; Zhang, X.D.; Gao, Z.Q.; Hu, T.; Liu, Y. The research progress of chalcone isomerase (CHI) in plants. Mol. Biotechnol. 2019, 61, 32–52. [Google Scholar] [CrossRef]
  7. Lim, S.H.; Park, B.; Kim, D.H.; Park, S.; Yang, J.H.; Jung, J.A.; Lee, J.M.; Lee, J.Y. Cloning and functional characterization of dihydroflavonol 4-reductase gene involved in anthocyanin biosynthesis of chrysanthemum. Int. J. Mol. Sci. 2020, 21, 7960. [Google Scholar] [CrossRef]
  8. Kim, E.Y.; Kim, C.W.; Kim, S. Identification of two novel mutant ANS alleles responsible for inactivation of anthocyanidin synthase and failure of anthocyanin production in onion (Allium cepa L.). Euphytica 2016, 212, 427–437. [Google Scholar] [CrossRef]
  9. Gonzalez, A.; Zhao, M.; Leavitt, J.M.; Lloyd, A.M. Regulation of the anthocyanin biosynthetic pathway by the TTG1/bHLH/Myb transcriptional complex in arabidopsis seedlings. Plant J. 2008, 53, 814–827. [Google Scholar] [CrossRef]
  10. Feller, A.C. Role of the Maize Transcription Factor R in the Regulation of Anthocyanin Biosynthesis. Ph.D. Thesis, Ohio State University, Columbus, OH, USA, 2010. [Google Scholar]
  11. Li, S. Transcriptional control of flavonoid biosynthesis: Fine-tuning of the MYB-bHLH-WD40 (MBW) complex. Plant Signal. Behav. 2014, 9, e27522. [Google Scholar] [CrossRef]
  12. Khan, A.; Jalil, S.; Cao, H.; Chare, Y.; Hamdaoui, M.; Ziyan, C.; Shi, C.; Jin, X. The purple leaf (pl6) mutation regulates leaf color by altering the anthocyanin and chlorophyll contents in rice. Plants 2020, 9, 1477. [Google Scholar] [CrossRef] [PubMed]
  13. Oikawa, T.; Maeda, H.; Oguchi, T.; Yamaguchi, T.; Tanabe, N.; Ebana, K.; Yano, M.; Ebitani, T.; Izawa, T. The birth of a black rice gene and its local spread by introgression. Plant Cell 2015, 27, 2401–2414. [Google Scholar] [CrossRef] [PubMed] [Green Version]
  14. Zheng, J.; Wu, H.; Zhu, H.; Huang, C.; Liu, C.; Chang, Y.; Kong, Z.; Zhou, Z.; Wang, G.; Lin, Y.; et al. Determining factors, regulation system, and domestication of anthocyanin biosynthesis in rice leaves. New Phytol. 2019, 223, 705–721. [Google Scholar] [CrossRef]
  15. Gao, J.; Dai, G.; Zhou, W.; Liang, H.; Huang, J.; Qing, D.; Chen, W.; Wu, H.; Yang, X.; Li, D.; et al. Mapping and identifying a candidate gene Plr4, a recessive gene regulating purple leaf in rice, by using bulked segregant and transcriptome analysis with next-generation sequencing. Int. J. Mol. Sci. 2019, 20, 4335. [Google Scholar] [CrossRef] [Green Version]
  16. Sun, X.; Zhang, Z.; Chen, C.; Wu, W.; Ren, N.; Jiang, C.; Yu, J.; Zhao, Y.; Zheng, X.; Yang, Q.; et al. The C–S–A gene system regulates hull pigmentation and reveals evolution of anthocyanin biosynthesis pathway in rice. J. Exp. Bot. 2018, 69, 1485–1498. [Google Scholar] [CrossRef] [PubMed] [Green Version]
  17. Hu, W.; Zhou, T.; Han, Z.; Tan, C.; Xing, Y. Dominant complementary interaction between OsC1 and two tightly linked genes, Rb1 and Rb2, controls the purple leaf sheath in rice. Theor. Appl. Genet. 2020, 133, 2555–2566. [Google Scholar] [CrossRef]
  18. Chin, H.S.; Wu, Y.P.; Hour, A.L.; Hong, C.Y.; Lin, Y.R. Genetic and evolutionary analysis of purple leaf sheath in rice. Rice 2016, 9, 8. [Google Scholar] [CrossRef] [Green Version]
  19. Crupi, P.; Pichierri, A.; Basile, T.; Antonacci, D. Postharvest stilbenes and flavonoids enrichment of table grape cv redglobe (Vitis vinifera L.) as affected by interactive UV-C exposure and storage conditions. Food Chem. 2013, 141, 802–808. [Google Scholar] [CrossRef]
  20. Heppel, S.C.; Jaffé, F.W.; Takos, A.M.; Schellmann, S.; Rausch, T.; Walker, A.R.; Bogs, J. Identification of key amino acids for the evolution of promoter target specificity of anthocyanin and proanthocyanidin regulating MYB factors. Plant Mol. Biol. 2013, 82, 457–471. [Google Scholar] [CrossRef]
  21. Oshima, M.; Taniguchi, Y.; Akasaka, M.; Abe, K.; Ichikawa, H.; Tabei, Y.; Tanaka, J. Development of a visible marker trait based on leaf sheath–specific anthocyanin pigmentation applicable to various genotypes in rice. Breed. Sci. 2019, 69, 244–254. [Google Scholar] [CrossRef] [Green Version]
  22. Leon, R.; Lightbourn, L.; Lopez-Meyer, M.; Amarillas, L.; Heredia, J.; Martínez-Bastidas, T.; Villicaña, C.; León-Félix, J. Differential gene expression of anthocyanin biosynthetic genes under low temperature and ultraviolet-B radiation in bell pepper (Capsicum annuum). Int. J. Agric. Biol. 2020, 23, 531–538. [Google Scholar] [CrossRef]
  23. Nakatsuka, A.; Mizuta, D.; Kii, Y.; Miyajima, I.; Kobayashi, N. Isolation and expression analysis of flavonoid biosynthesis genes in evergreen azalea. Sci. Hortic. 2008, 118, 314–320. [Google Scholar] [CrossRef]
  24. Hiei, Y.; Ohta, S.; Komari, T.; Kumashiro, T.J.T.P.J. Efficient transformation of rice (Oryza sativa L.) mediated by Agrobacterium and sequence analysis of the boundaries of the T-DNA. Plant J. 1994, 6, 271–282. [Google Scholar] [CrossRef] [PubMed] [Green Version]
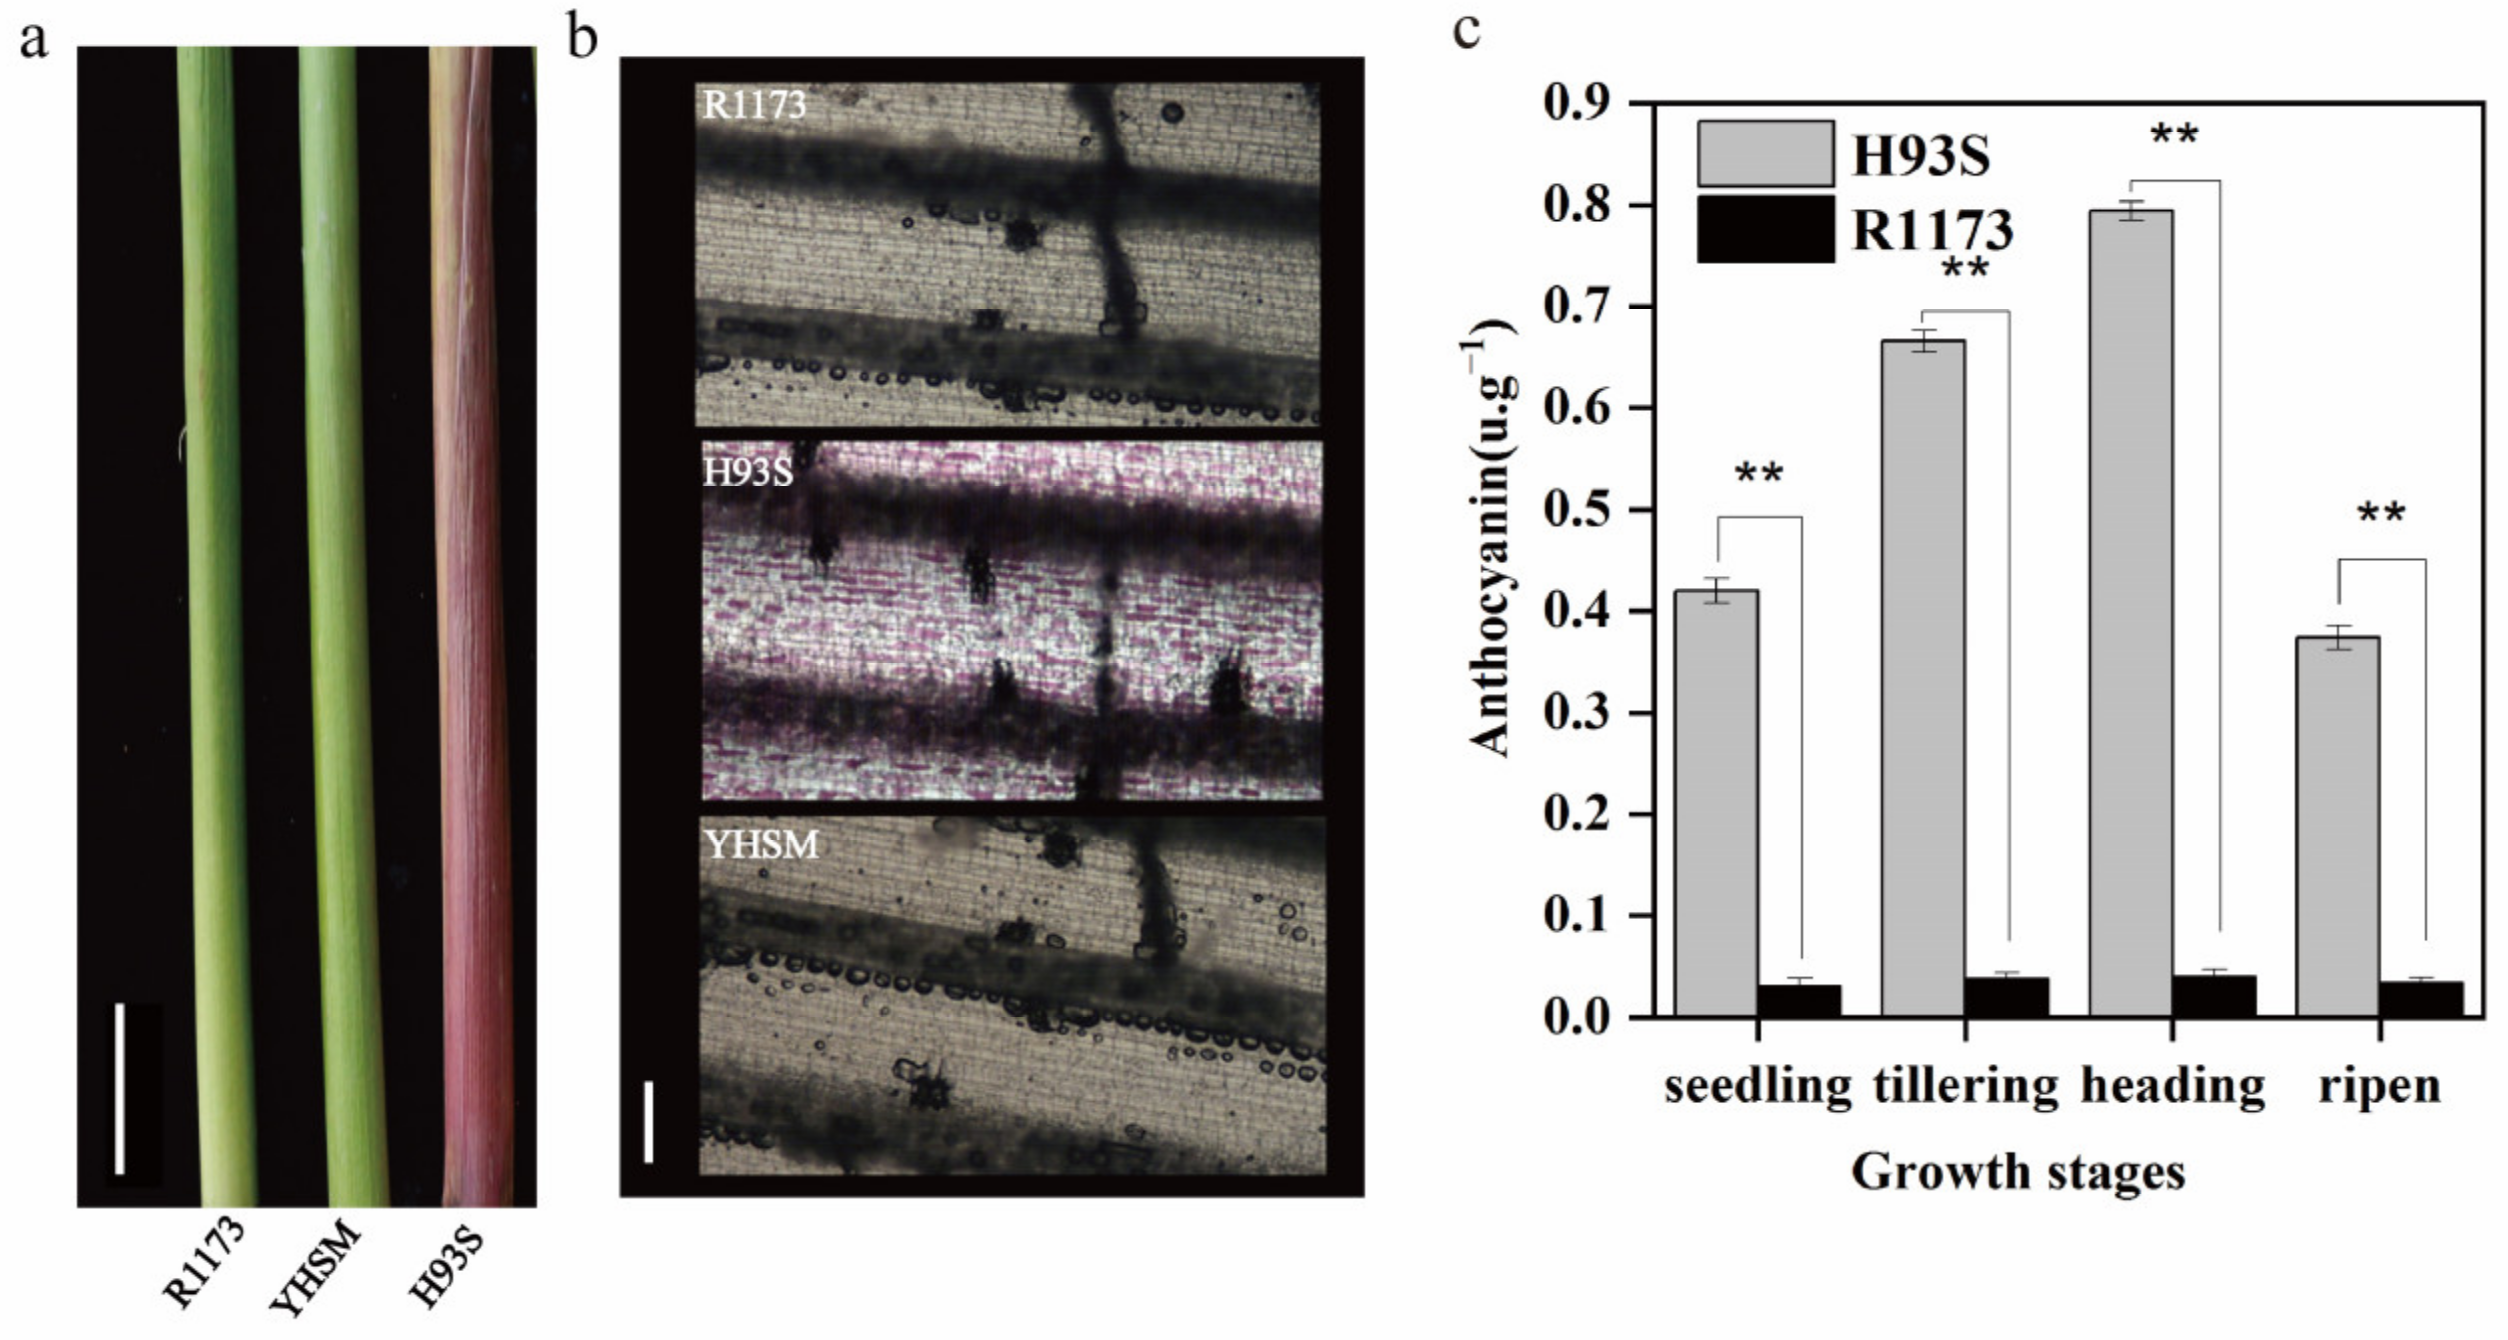
Figure 1. Phenotypes and total anthocyanin contents of purple and green leaf sheath in rice. (a), Leaf-sheath phenotypes of parental lines, the scale bar is 7.5 cm. (b), The leaf sheath longitudinal sections of parental lines, the scale bar is 100 μm. (c), Total anthocyanin contents in leaf sheath of H93S and R1173 at all growth periods. Values shown are means ± SD, ** indicates a significant difference according to the t-test (p < 0.01) between H93S and R1173.
Ijms 24 06655 g001
Figure 2. The ΔAll-index and ED are distributed on chromosomes of two populations. (a), Distribution of ΔSNP-index values of F2-1. (b), Distribution of ΔInDel-index values of F2-1. (c), Distribution of ΔSNP-index values of F2-2. (d), Distribution of ΔInDel-index values of F2-2. (e), Distribution of ED-associated values of F2-1 by SNPs. (f), Distribution of ED-associated values of F2-1 by InDels. (g), Distribution of ED-associated values of F2-2 by SNPs. (h), Distribution of ED-associated values of F2-2 by InDels. (ad), The colored dots represent the calculated ΔAll-index value, and the black lines represent the fitted ΔAll-index value; the red lines represent the threshold line with a confidence of 0.99, the blue lines represent the threshold line with a confidence of 0.95, and the green lines represent the threshold line with confidence of 0.90. (eh), The colored points represent the ED value of each SNP or InDel, the black lines represent the fitted ED value, and the red dashed lines represent the significant correlation threshold. The higher the ED value, the better the correlation effect of this point.
Ijms 24 06655 g002
Figure 3. The transcript levels of the three candidate genes at the four growth stages of H93S. (a), LOC_Os06g10350. (b), LOC_Os06g1035011270. (c), LOC_Os06g11330.
Ijms 24 06655 g003
Figure 4. Knocking–out (KO) of OsC1PLSr in H93S by CRISPR/Cas9 genomic editing system. (a), The schematic representation of the target site position. (b), Sequencing analysis of target regions of mutant lines. (c), Amino acid changes in mutant lines. (d), The whole plant of H93S and the KO plants. The KO–negative failed to Knocking–out the OsC1PLSr gene in H93S by CRISPR/Cas9 genomic editing system. The scale bar is 5 cm.
Ijms 24 06655 g004
Figure 5. Analysis of transgenic plants. (a), The anthocyanin content of mutant lines and H93S. (b), shows the different expression levels of the genes F3′H, F3H, ANS and DFR, respectively. (c), The photosynthesis in mutant lines, H93S, and negative transgenic plants. Values shown are means ± SD, ** indicates a significant difference according to the t-test (p < 0.01) between WT and the KOs.
Ijms 24 06655 g005
Figure 6. Structure analysis, transcriptional activation characteristics, and toxicity detection assay. (a), Structure deletion site analysis of OsC1PLSr. (b), Toxicity detection of OsC1PLSr protein. (c), The full-length ORF of OsC1PLSr and three truncated mutants (OsC1PLSr-MYB1, OsC1PLSr-MYB2, OsC1PLSr-C) were fused with pGBKT7, and the transformed AH109 yeasts were selected from SD/-Trp + x-α-gal medium and SD/-Trp/-His/-Ade + x-α-gal medium, respectively. The empty BD vector was used as a negative control. “SANT” means “SANT SWI3, ADA2, N-CoR, and TFIIIB’’ DNA-binding domains.
Ijms 24 06655 g006
Table 1. Genetic analysis of the purple leaf sheath plants in two F2 segregating populations.
Population NameTested PlantsPurple PlantsGreen PlantsMendelian Expectationsχ2χ2(0.05, 1)
F2-1
(H93S/R1173)
5003901103:12.403.84
F2-2
(H93S/YHSM)
5003881123:11.803.84
Note: χ2 <  χ2(0.05, 1) is considered as significant.
Table 2. The data quantity and quality in BAS-seq.
SamplesFiltered DatesQ30GC MappedAve_DepthCoverage
R117342,356,10790.60%44.45%98.01%28×94.95%
F2-1 (P)55,322,04190.32%44.40%97.96%37×97.25%
F2-1 (G)60,695,93090.94%44.77%98.49%40×97.23%
H93S36,790,41591.30%44.33%98.56%25×94.85%
F2-2 (P)55,367,27491.27%44.54%98.58%37×97.33%
F2-2 (G)56,536,08091.08%44.40%98.50%38×96.76%
YHSM43,800,41791.33%44.36%98.56%30×95.09%
Note: P, purple leaf sheath plants in the F2 population; G, green leaf sheath plants in the F2 population; Q30, the bases of quality value greater than or equal to 30 in the total base number; GC, the GC content of the samples; Mapped, the percentage of clean reads mapped to the reference genome R498 in the total clean reads; Ave depth, average coverage depth of samples; coverage, the ratio of the bases above given depth to the total bases in the reference genome.
Table 3. Credible and high-quality SNPs/InDels in BSA-seq.
PopulationFTTLMGRSL4CGMPRPNPCHQS/I
F2-1SNPs1,432,222196121,971443,822288,956675,512
InDels312,912887510,21797,23956,207140,374
F2-2SNPs1,251,158136225,629478,438278,933466,796
InDels274,708686310,764105,40154,94296,738
Note: FT, filtered type; TL, total loci; MG, multiple genotypes; RSL4, read support less than 4; CGMP, consistent genotypes among mixed pools; RPNP, recessive mixed pool genes not from recessive parents; CHQS/I, credible and high-quality SNPs/InDels.
Table 4. Statistics information of candidate association region in BSA-seq.
PopulationCRATChr.Start PositionEnd PositionSize (Mb)Genes
F2-1SNP AA63,330,0008,720,0005.391415
InDel AA63,730,0008,550,0004.821274
F2-2SNP AA64,030,0009,060,0005.031275
InDel AA64,610,0006,030,0001.42415
Note: CRAT, candidate region analysis type; SNP AA, SNP association analysis; InDel AA, InDel association analysis.
Table 5. Gene annotation of the 27 candidate genes by using Rice Genome Annotation Project.
GenesMSU_LocusAnnotation
OsR498G0611776200.01LOC_Os06g09540SAC domain containing protein, putative, expressed
OsR498G0611780600.01LOC_Os06g09620expressed protein
OsR498G0611782900.01LOC_Os06g09679chaperonin, putative, expressed
OsR498G0611789000.01LOC_Os06g0985025.3 kDa vesicle transport protein, putative, expressed
OsR498G0611790200.01LOC_Os06g09890smr domain containing protein, expressed
OsR498G0611790800.01LOC_Os06g09900expressed protein
OsR498G0611792500.01LOC_Os06g09930G protein coupled receptor, putative, expressed
OsR498G0611812900.01LOC_Os06g10340autophagy-related protein 12, putative, expressed
OsR498G0611814100.01LOC_Os06g10350MYB family transcription factor, putative, expressed
OsR498G0611822700.01LOC_Os06g10520pantothenate kinase, putative, expressed
OsR498G0611830400.01LOC_Os06g10620transcription elongation factor SPT5 homolog 1, putative, expressed
OsR498G0611870100.01LOC_Os06g11620RNA recognition motif containing protein, putative, expressed
OsR498G0611870800.01LOC_Os06g11640serine/threonine-protein phosphatase 2A activator 2, putative, expressed
OsR498G0611835200.01LOC_Os06g10690PHD-finger domain containing protein, putative, expressed
OsR498G0611836500.01LOC_Os06g10750integral membrane protein DUF6 containing protein, expressed
OsR498G0611837500.01LOC_Os06g10790lectin-like receptor kinase, putative, expressed
OsR498G0611842100.01LOC_Os06g10900DELLA protein RGL3, putative, expressed
OsR498G0611842900.01LOC_Os06g10910xyloglucan fucosyltransferase, putative, expressed
OsR498G0611843200.01LOC_Os06g10920xyloglucan fucosyltransferase, putative, expressed
OsR498G0611848000.01LOC_Os06g11020tic22-like family domain containing protein, expressed
OsR498G0611849000.01LOC_Os06g11040expressed protein
OsR498G0611856800.01LOC_Os06g11270Anthocyanidin 3-O-glucosyltransferase, putative, expressed
OsR498G0611859800.01LOC_Os06g11330OsMADS55—MADS-box family gene with MIKCc type-box, expressed
OsR498G0611860600.01LOC_Os06g11370mediator of RNA polymerase II transcription subunit 6, putative, expressed
OsR498G0611862900.01LOC_Os06g11410cyclin, putative, expressed
OsR498G0611871200.01LOC_Os06g11660phosphate-induced protein 1 conserved region domain containing protein, expressed
OsR498G0611864700.01LOC_Os06g11430GRAM domain containing protein, expressed
Disclaimer/Publisher’s Note: The statements, opinions and data contained in all publications are solely those of the individual author(s) and contributor(s) and not of MDPI and/or the editor(s). MDPI and/or the editor(s) disclaim responsibility for any injury to people or property resulting from any ideas, methods, instructions or products referred to in the content.