Article

Resveratrol Protects against Skin Inflammation through Inhibition of Mast Cell, Sphingosine Kinase-1, Stat3 and NF-κB p65 Signaling Activation in Mice

by
Christopher D. Carlucci
1,
Yvonne Hui
1,
Alena P. Chumanevich
1,
Piper A. Robida
1,†,
John W. Fuseler
1,
Mathew Sajish
2,
Prakash Nagarkatti
1,
Mitzi Nagarkatti
1 and
Carole A. Oskeritzian
1,*
1
Department of Pathology, Microbiology and Immunology, University of South Carolina School of Medicine, Columbia, SC 29209, USA
2
Department of Drug Discovery and Biomedical Sciences, College of Pharmacy, University of South Carolina, Columbia, SC 29208, USA
*
Author to whom correspondence should be addressed.
Current Address: Department of Natural Science, Northwestern Oklahoma State University, Alva, OK 73717, USA.
Int. J. Mol. Sci. 2023, 24(7), 6707; https://doi.org/10.3390/ijms24076707
Submission received: 28 February 2023 / Revised: 30 March 2023 / Accepted: 1 April 2023 / Published: 4 April 2023
(This article belongs to the Special Issue Mast Cells in Human Health and Diseases 2.0)

Abstract

:
Inflammation is pathogenic to skin diseases, including atopic dermatitis (AD) and eczema. Treatment for AD remains mostly symptomatic with newer but costly options, tainted with adverse side effects. There is an unmet need for safe therapeutic and preventative strategies for AD. Resveratrol (R) is a natural compound known for its anti-inflammatory properties. However, animal and human R studies have yielded contrasting results. Mast cells (MCs) are innate immune skin-resident cells that initiate the development of inflammation and progression to overt disease. R’s effects on MCs are also controversial. Using a human-like mouse model of AD development consisting of a single topical application of antigen ovalbumin (O) for 7 days, we previously established that the activation of MCs by a bioactive sphingolipid metabolite sphingosine-1-phosphate (S1P) initiated substantial skin remodeling compared to controls. Here, we show that daily R application normalized O-mediated epidermal thickening, ameliorated cell infiltration, and inhibited skin MC activation and chemokine expression. We unraveled R’s multiple mechanisms of action, including decreased activation of the S1P-producing enzyme, sphingosine kinase 1 (SphK1), and of transcription factors Signal Transducer and Activator of Transcription 3 (Stat3) and NF-κBp65, involved in chemokine production. Thus, R may be poised for protection against MC-driven pathogenic skin inflammation.

1. Introduction

Inflammation constitutes a critical component of skin pathologies and allergic skin responses, such as atopic dermatitis (AD) or eczema [1]. AD is a chronic inflammatory skin disease with complex pathogenesis, featuring severe itch and skin lesions. While treatment options are expanding, they remain costly and may cause severe adverse effects [1]. Thus, there is an unmet medical need to develop safe therapies aiming to prevent the spreading of skin lesions and progression to chronic disease.
Resveratrol (trans-3-4′,5-trihydroxystilbene, R) is an extensively studied natural polyphenolic phytoalexin enriched in red grapes that has gained attention for its overall anti-inflammatory effects [2,3,4,5,6,7]. However, animal studies and human clinical trials have yielded contrasting results with beneficial, lack of beneficial, or even adverse effects on health, owing to differences in experimental models, R bioavailability and pharmacokinetics [8], dosing [9,10], formulation, and circadian variation [2]. Additionally, R exerts contrasted effects depending on the prevalent stereoisomer present in solution [2,9].
Mast cells are skin-resident innate immune cells that initiate many aspects of inflammatory responses due to strategic tissue residence in close proximity to blood vessels and have a unique ability to synthesize and store an arsenal of bioactive substances [11,12,13]. Released upon activation, a process also named degranulation, MC mediators regulate inflammation by recruiting cells from the circulation, as well as acting on neighboring cells to orchestrate tissue remodeling [14,15,16,17,18,19,20]. We have previously reported inflammation-enabling functions of bioactive sphingolipid sphingosine-1-phosphate (S1P)-activated MCs in early-phase AD in mice, suggesting that controlling MC reactivity may prevent the development of AD [16,18]. It has been reported that R could inhibit MC inflammatory functions by reducing the expression of the high-affinity receptor for immunoglobulin (Ig)E, FcεRI, on human Laboratory of Allergic Diseases (LAD)2 MC line [21], preventing an increase in MC numbers in allergic enteritis, colitis [22], passive cutaneous anaphylaxis [23], and signal transducer and activator of transcription 3 (Stat3) activation [24]. Intriguingly, R was reported to not only stimulate S1P signaling [25] but also to inhibit S1P-producing sphingosine kinase 1 (SphK1) activity [26]. Moreover, R was shown to differentially impact human MC activation by targeting the arachidonic acid pathway and subsequent prostaglandin D2 synthesis but also by enhancing TNF release [27], whereas others reported an overall reduction in MC activation [28].
In this study, we hypothesized that R may attenuate the early inflammatory skin changes at the inception of AD by maintaining homeostasis and preventing the activation of MCs and signaling pathways. To this end, the inflammation-triggering antigen ovalbumin (O), the most abundant protein in egg white widely used in allergy models because of its strong allergenicity [29], was applied topically on mouse skin in the presence or absence of R, as previously described [16,18], and histopathological, cellular, and molecular evaluation of treated skin samples was conducted to measure inflammatory responses and signaling pathways.

2. Results

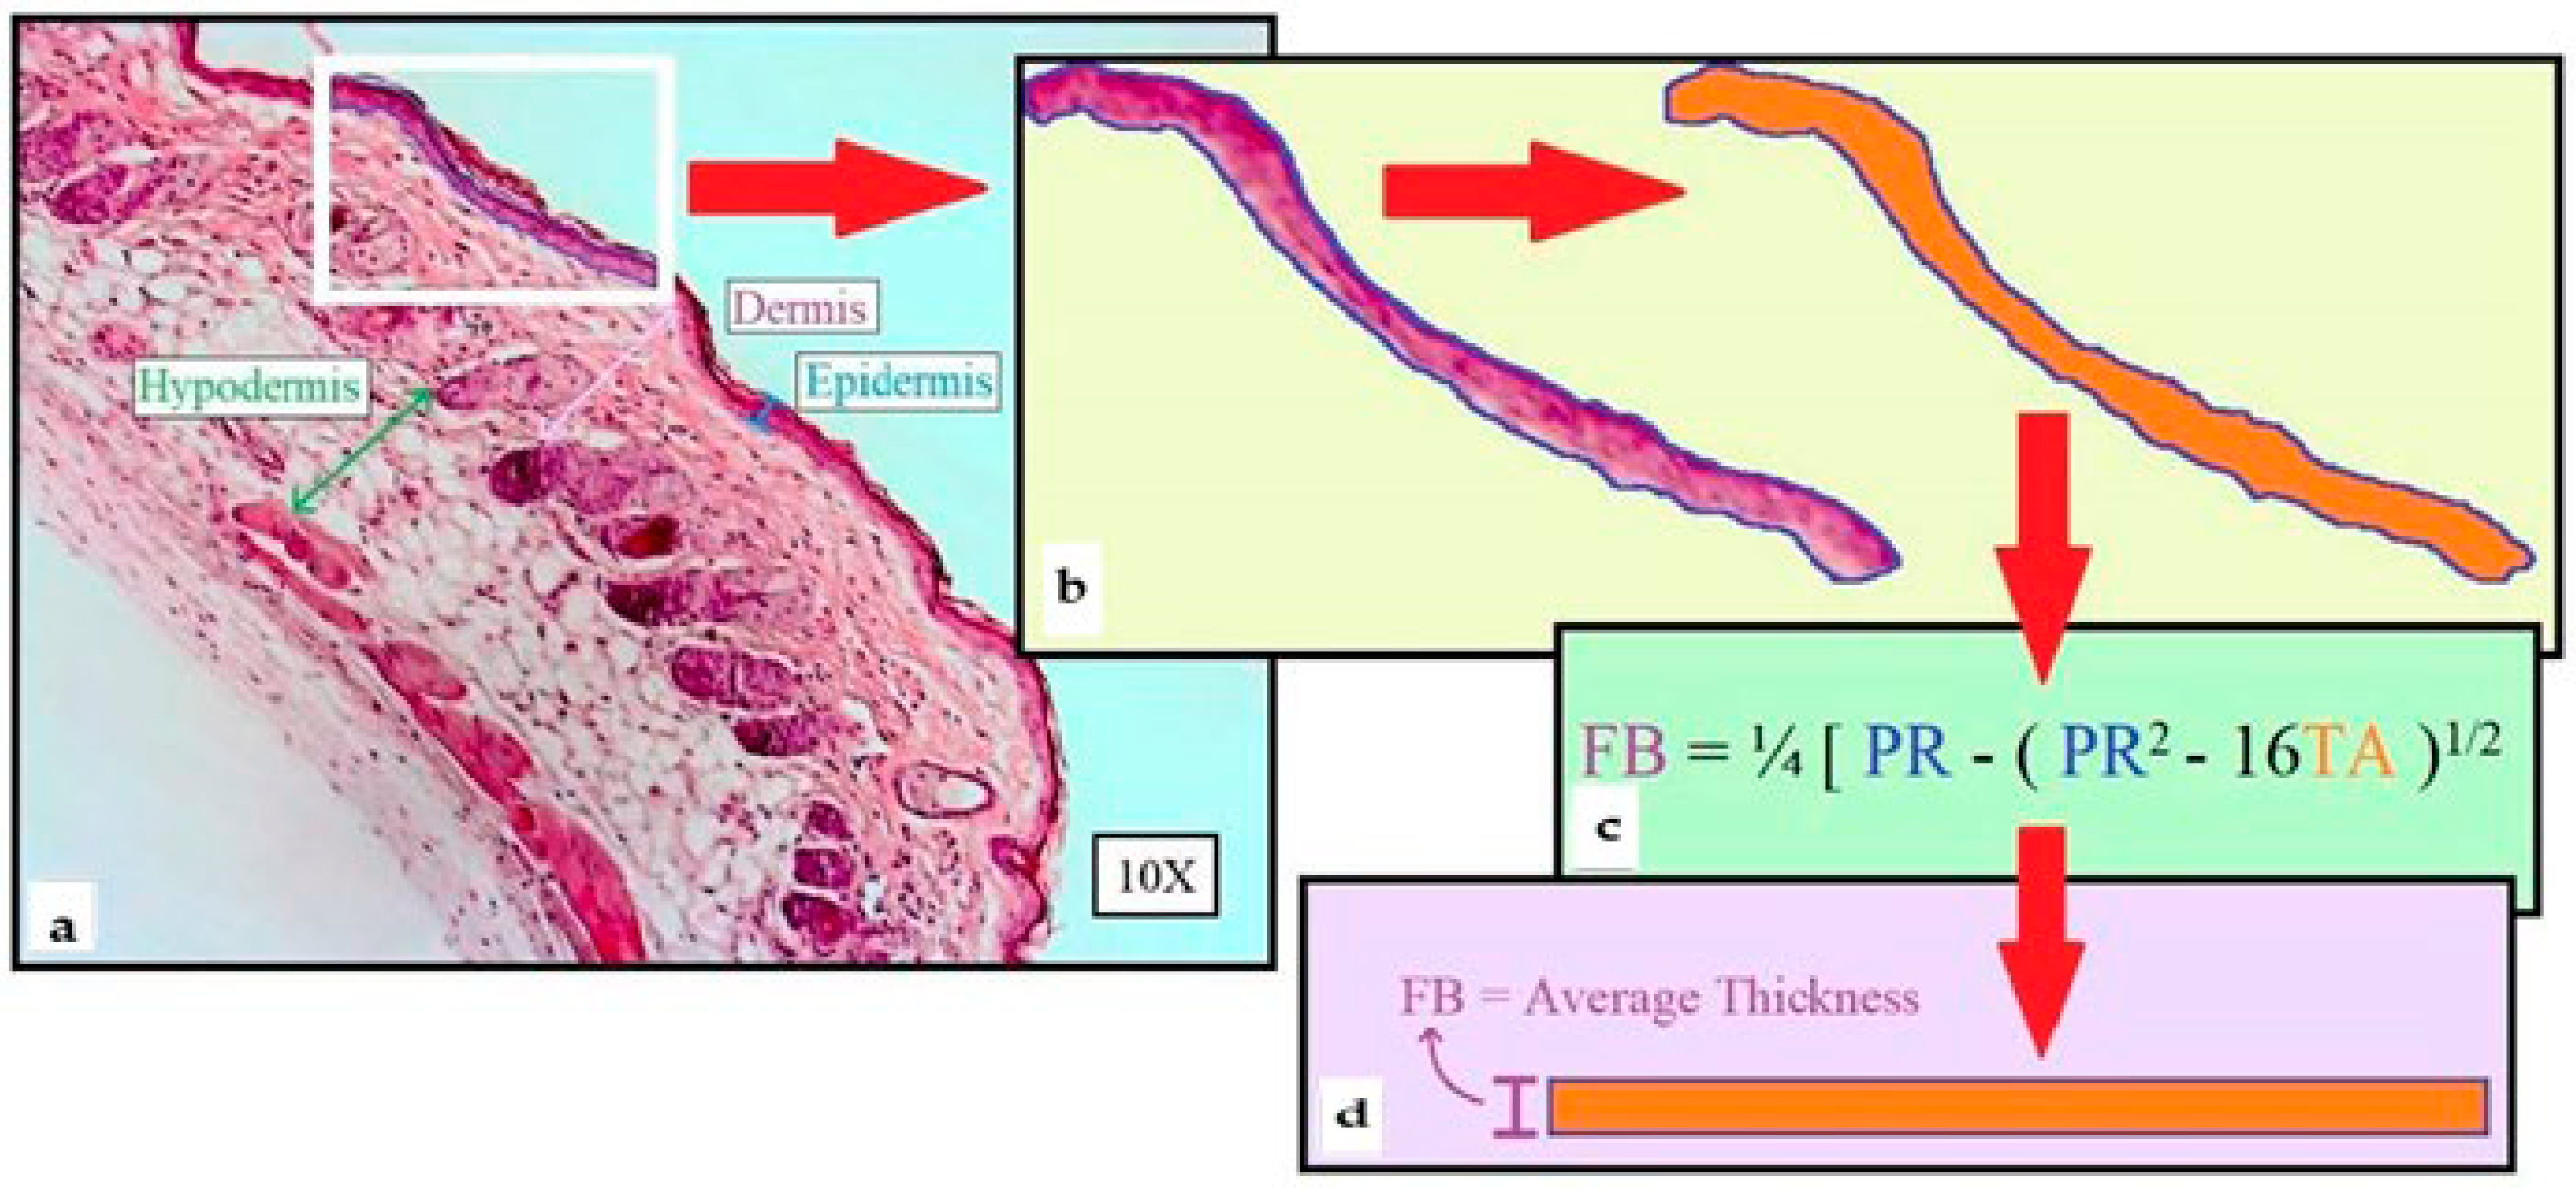
2.1. Morphometric Method of Skin Layer Thickness

Using our expertise in quantitative imaging, we developed a new computer-aided analysis of H&E-stained whole skin sections mounted on microscopy slides imaged at 10× magnification, allowing the thickness of the different skin layers in variously treated samples to be accurately and objectively measured (see Section 2.2). Our morphometric method was based on isolating each layer (epidermis, dermis, and hypodermis) within a region of interest (ROI, e.g., white rectangular frame in Figure 1a for epidermis thickness measurement), then surveying each full-length layer and collect measurements. Figure 1b shows the isolation of the epidermis within the ROI, converted into an irregular fiber, and depicted in orange by the MetaMorph® 601 Microscopy Automation and Image Analysis software (Molecular Devices, Sunnydale, CA, USA). The insert in Figure 1a was enlarged for clarity. Figure 1c demonstrates the equation employed to calculate the actual layer thickness (Fiber Breadth, FB) through software-generated Traced Area (TA depicted in orange in Figure 1b, expressed in μm2) and Perimeter (PR, delineated in blue in Figure 1b, expressed in μm) quantifications, converting the irregular fiber imaged in Figure 1b into a rectangle (Figure 1d) while preserving the original length-to-width ratio (i.e., average thickness data).

2.2. Resveratrol Prevents Epidermal Thickening Triggered by Exposure to Ovalbumin

We previously reported that a single epicutaneous exposure to O for 7 days yielded thickening of the epidermis and the dermis layers in the dorsal skin, compared to saline (S) controls, using a well-established mouse model of AD [16]. In the current study, we applied the method newly described in Section 2.1 (Figure 1) to measure the thickness of each skin layer upon exposure to O in the presence and absence of resveratrol (R) (Figure 2). O supplemented with the ethanol vehicle (V) for resveratrol (R) induced the thickening of the epidermis (Figure 2a) and the dermis (Figure 2b), compared to controls (SV). However, R prevented O-induced epidermal (Figure 2a) without altering dermal thickening (Figure 2b).
The thickness of the hypodermis layer was unaltered upon O exposure, as previously observed [16], including in the presence of R (Figure 2c).

2.3. Resveratrol Treatment Precludes Ovalbumin-Induced Cell Infiltration in the Hypodermis

We previously reported that one week of exposure to O triggered significant infiltration of cells in the hypodermis, compared to saline controls, in a mouse model of AD, including around blood vessels (BV) [16,17]. We applied the computer-assisted cell quantification method described previously [16,17] to measure cell infiltration in the entire hypodermis, as well as around BV (Figure 3).
Representative images of H&E-stained skin samples focusing on the hypodermis illustrated the ameliorative effects of R on O-induced infiltration (Figure 3a). The integration of nuclei numbers enumerated in each ROI was significantly decreased upon resveratrol treated-, O-exposed mouse skins, compared to O alone in the entire hypodermal area (Figure 3b) or around the hypodermal BV (Figure 3c). However, resveratrol application did not restore cellularity to the level observed in saline-treated skin samples.

2.4. Resveratrol Treatment Significantly Reduces Mast Cell Activation and Responsiveness in the Hypodermis of Ovalbumin-Treated Mouse Skins

We previously established a new morphometric imaging method to quantify mammal mast cells (MCs) and MC activation status in microscopy slides [16,17]. In situ quantifications were conducted in differentially treated mouse skins using our computer-aided method to identify MCs (Figure 4a) and distinguish resting from activated (degranulated) MCs (Figure 4b). These results showed that R or its vehicle did not alter the average number of skin MCs per mm2, as previously reported. Whereas O treatment did not significantly increase tissue MC numbers (Figure 4a), it significantly augmented MC activation (Figure 4b).
Notably, O treatment significantly increased FcεRIα mRNA levels, the sub-unit of the receptor binding IgE with high affinity that is mostly expressed on mast cells in the skin, suggesting a potential functional priming for enhanced reactivity (Figure 4c). Figure 4b,c demonstrated that R normalized MC activation status to a steady state as well as significantly decreased FcεRIα mRNA expression.

2.5. Resveratrol Treatment Averts Chemokine mRNA Expression Level Increase in the Skin of Ovalbumin-Treated Mouse Skins

Previously published studies demonstrated that one-week exposure to O induces increased chemokines CCL2, CCL3, and CCL5 skin mRNA levels in female [16] but not in male mice [17]. In the current study, mRNA expression levels featured a similar elevation upon O application and were normalized in skin samples exposed to O and resveratrol for 7 days (Figure 5a,c), except for CCL3 chemokine (Figure 5b).

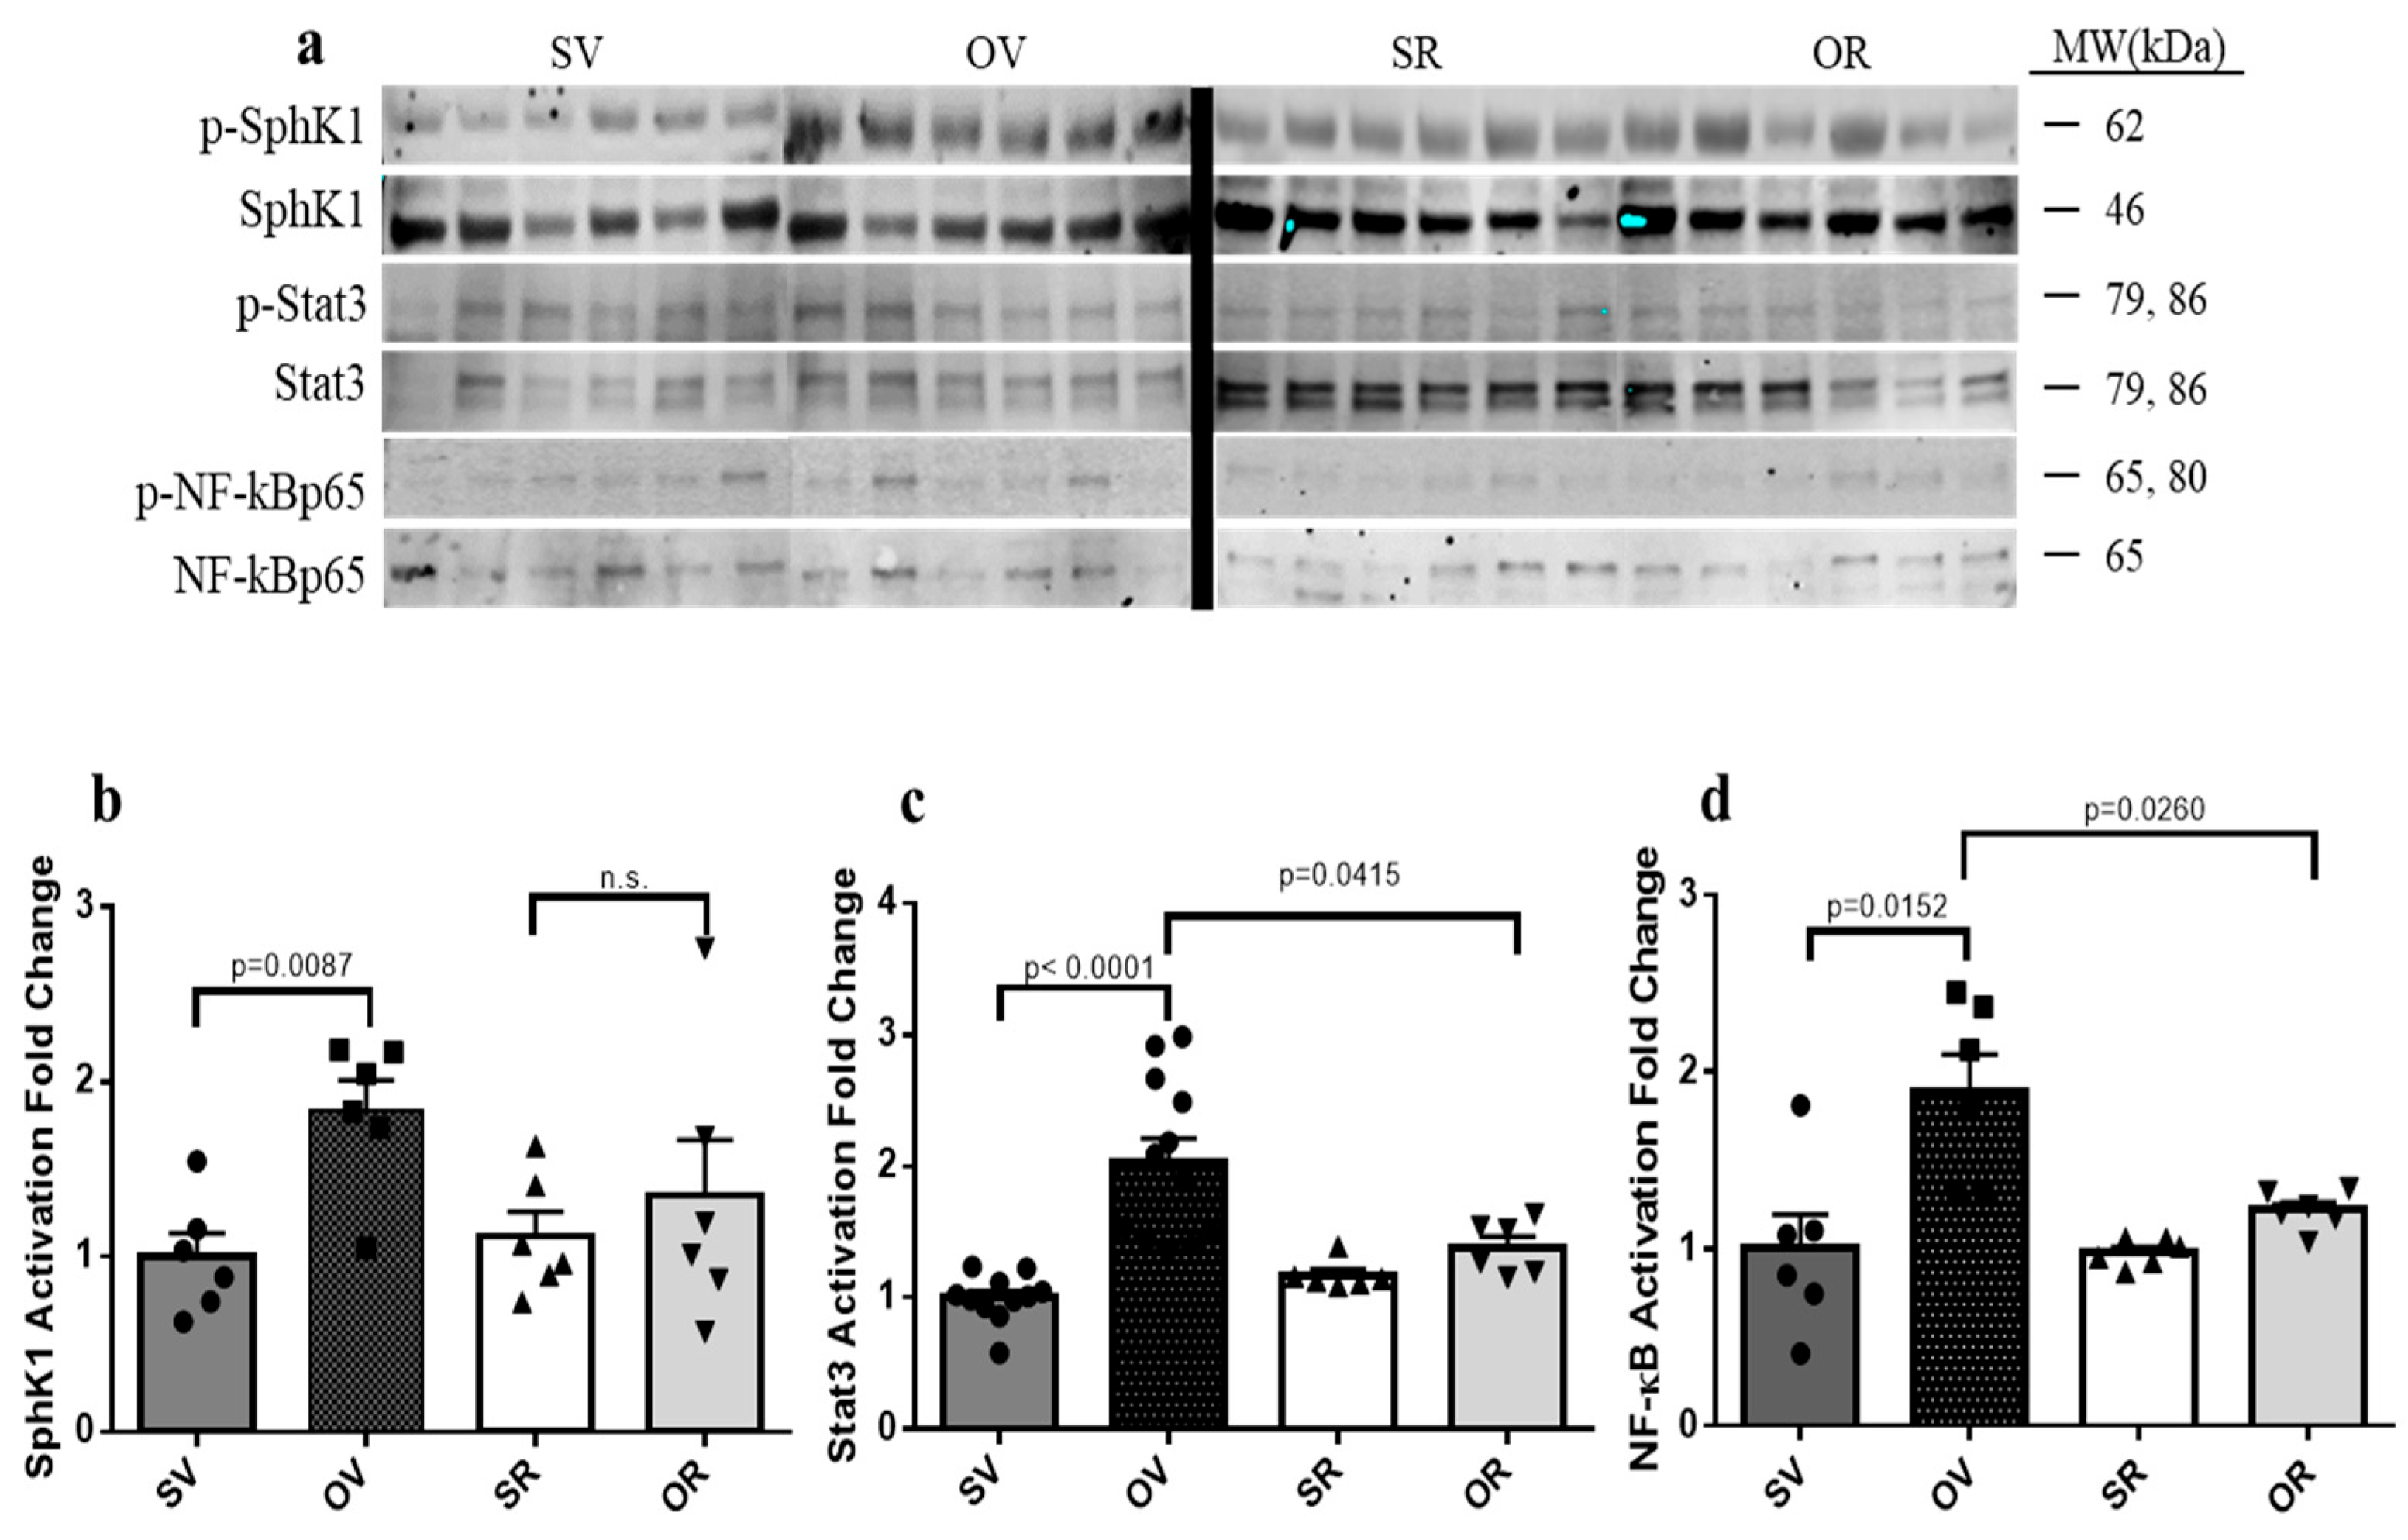
2.6. Resveratrol Treatment Mitigates Ovalbumin-Induced Skin Inflammation through Inhibition of Sphingosine Kinase 1, Stat3, and NFκB/p65 Activation

We and others previously identified the importance of MC activation by S1P in vivo in mouse models of anaphylaxis [14,15,30,31] and eczema [16]. Importantly, S1P-mediated MC activation was linked to Stat3 activation resulting in cell-recruiting CCL2, CCL3, and CCL5 chemokine release [15,16]. Of note, O treatment significantly increased the phosphorylation of SphK1, a mark of enzymatic activation, which was normalized upon exposure to R (Figure 6a,b).
Similarly, Stat3 activation/phosphorylation that was significantly augmented upon O application was reduced to control levels in R-treated skin samples (Figure 6a,c). The transcription factor NF-κB is another critical regulator of inflammatory responses, and its canonical activation occurs through its p65 sub-unit phosphorylation and translocation to the nucleus to exert transcriptional activity on inflammatory genes, including chemokines [32]. Our results substantiated that O-induced activation/phosphorylation of p65 was significantly abated in the presence of R (Figure 6a,d).

3. Discussion

We show that resveratrol potently inhibits multiple features of the patho-mechanistic events occurring at the onset of AD. Thus, epidermal thickening that was observed in early-phase AD was prevented by R treatment in a well-established human-like mouse model utilizing the epicutaneous application of antigen O on the dorsal skin [16,17,33,34]. Importantly, we used our established expertise in quantitative imaging [16,17,18,35] to develop a new computer-assisted method extensively described herein, to measure skin layer thickness. Other early inflammatory features, including hypodermal infiltration and MC activation but not local MC numbers, were substantially mitigated upon R treatment. We have previously established that early infiltration of cells in inflamed lungs and skin resulted from the MC-dependent production of CCL2, CCL3, and CCL5 chemokines [14,15,16,17,36,37,38,39,40,41,42,43]. In the current study, attenuated O-induced cell infiltration by R was accompanied by the normalization of skin mRNA expression levels of chemokines. Mechanistically, we had previously reported that MC-derived chemokine production was linked to the activation/phosphorylation of Stat3. Ovalbumin-induced Stat3 activation was significantly decreased upon O and R application on mouse skins. In support of this, recent studies established the inhibition of phosphorylation of Stat3 by R in human MCs, also diminishing MC activation and chemokine production [24]. Composed of multiple sub-units that include p65, the transcription factor NF-κB is another critical regulator of inflammatory responses implicated in the upregulated transcription of inflammatory gene-encoding chemokines [32]. We found that R treatment counteracted O-induced p65 activation/phosphorylation, thus strongly suggesting that the ameliorative effects of R may also involve the dampening of NF-κB signaling. In agreement, blocking the transcriptional activity of NF-κB through decreased activation/phosphorylation of the p65 sub-unit by R has been previously reported [44,45]. Finally, sphingosine kinase 1 (SphK1), the most prevalent S1P-producing enzyme, is a known signaling target of R [4,20,46,47]. Our results demonstrate that R precluded activation of SphK1. Supporting the relevance of these results, we have previously established that the early skin changes associated with the onset of AD were negated in SphK1 knockout mice [16]. Perhaps also relevant to the current study, R has been identified as inhibiting SphK1-mediated NF-κB activation [48] and interfering with SphK1 activation through the prevention of its translocation to the plasma membrane [47]. Indeed, SphK1 is prevalently cytosolic [49] and, upon activation/phosphorylation, migrates to the plasma membrane to generate S1P from its substrate sphingosine [50]. We and others have demonstrated that S1P regulates MC responses in multiple ways: differentiation, proliferation, and protease repertoire [38,51] and activation [14,15,16,17,36,37,38,39,40,41,42,43]. Thus, R may thwart MC activation by preventing the activation of SphK1 in this mouse model of AD. Furthermore, our results support the poly-mechanistically beneficial effects of R in developing AD, shedding light on the multiple inflammatory pathways that are impacted and ameliorated through skin treatment with R.
We and others previously established the importance of lipopolysaccharide (LPS) and its receptor Toll-like receptor 4 (TLR4) signaling in the initiation of allergic skin inflammation, strongly suggesting that the early inflammatory steps preceding a diseased state are independent of the antigen [16,17,52]. Notably, R was shown to prevent TLR4 activation [53] and expression [45]. Of note, TLR4 downstream signaling encompasses NF-κB and, similar to Gong et al. [26], we observed a significant inhibition of NF-κB p65 activation as well as noted a significant decrease in Stat3 phosphorylation; an event that we had previously linked to chemokine production in MCs, downstream of MC S1P receptor 2 (S1PR2) [15]. In agreement, Gong et al. reported the inhibition of LPS-induced inflammation by R through the SphK1/S1PR2/NF-κB pathway [26].
This study presents several limitations: We and others have previously reported that AD has a more severe presentation and is more prevalent in female than male mice and human adults [17,54,55,56,57,58,59,60,61,62,63,64]. Therefore, only female mice were utilized in our study. Reactive oxygen species (ROS) also act as signaling molecules in inflammatory disorders [65]. We have not investigated their functions in our model, nor the effects of R on ROS levels. R metabolites were discounted; although, it is known that R rapidly metabolizes in vivo in the liver [66,67,68]. To circumvent this, we opted to apply R daily without disturbing the gauze patch from the treated area of mouse dorsal skin. The R concentration of 2.5 μg/mL was selected based on previous studies [2,9]. This concentration of R is considered moderate and physiologically relevant for in vivo studies as well [69]. A recent study uncovered differences in the inhibitory effects of R in mouse bone marrow-derived MCs and the human Laboratory of Allergic Diseases (LAD)2 MC line [21]. Studies are currently ongoing in our lab aiming to compare the effects of R in mouse and human primary MCs.
Given the broad spectrum of mediators they produce, MCs are recognized as key players, not only in the maintenance of homeostasis [19,20] but also in the initiation of many pathological conditions beyond allergy and anaphylaxis, asthma, and AD, thus also including autoimmunity and cancer onsets [38,61,62,63,64,65,66,67,68,69,70,71,72]. Our results strongly support local MC stabilization, accompanied by decreased levels of chemokines and infiltration by R in otherwise inflamed skin. Therefore, the identification of R as a natural modulator of MCs may pave the way for the development of novel prophylactic strategies for the development of inflammatory and carcinogenic processes.

4. Materials and Methods

4.1. Atopic Dermatitis Model

AD was initiated in 8 to 12 weeks of age female C57Bl/6J mice exactly as previously described [16,17,18,33]. Mice were purchased from The Jackson Laboratory (Bar Harbor, ME, USA). Mice were randomly assigned as previously described [16,17] to either experimental groups, saline (S)/R vehicle (V), ovalbumin (O)/V; S/R or OVA/R. In the AD model, 100 μL of OVA solution (100 μg OVA (Millipore Sigma, Burlington, MA, USA) in V (0.05% ethanol in saline) (OV group), SV (0.05% ethanol), saline/R (SR, i.e., 2.5 μg R (TCI America/Fisher Scientific, Waltham, MA, USA) in 0.05% ethanol), or OVA/R (OR group, i.e., 100 μg OVA and 2.5 μg R in saline with 0.05% ethanol) was pipetted as a final volume of 100 μL on 1 cm × 1 cm gauze pads (patches) that were applied on the shaved and tape-stripped upper-back areas of mice. A half cm flexible tube (plastic hematocrit capillary tubes, Fisher Scientific, Pittsburgh, PA, USA) was then placed over the patch, with one end over the center of the patch and the other extending slightly past its caudal border. Next, the tube and patch were secured in place with a Tegaderm® transparent dressing (3M HealthCare, St. Paul, MN, USA) covering the patch, ensuring that the caudal end of tubing was flush with the edge of the dressing. An adhesive bandage was then applied over the dressing to keep the patch, dressing, and tube firmly positioned for 7 days [16,17]. Next, mice received the same treatments as above in a final volume of 100 μL onto the patch (i.e., either saline with 0.05% ethanol for the SV and OV groups or 2.5 μg R in saline with 0.05% ethanol for the SR and OR groups) without O daily via a 1 mL syringe and needle inserted into the capillary tube so as not to move the patch from the treated area. The patches were removed after 7 days, and skin samples were harvested from euthanized mice. All animal procedures were performed in accordance with the University of South Carolina Institutional Animal Care and Use Committee (IACUC) approval (IACUC Protocol Number: 2403-101303-010818 approved on 1 August 2018), and all methods used adhered to relevant guidelines and regulations.

4.2. R Preparation

R was dissolved in 100% ethanol to its maximum soluble concentration of 50 mg/mL as well as maximum stability [73]. This stock solution was further diluted in 0.9% saline (S) to a concentration of 2.5 mg/mL of S containing 5% ethanol. The final working solution of R of 2.5 μg/mL, a physiologically relevant concentration [9,74], was obtained by additional dilution using either 0.9% S or combined with OVA 100 μg/mL in 0.9% S. Vehicle control groups with 5% ethanol were further diluted in 0.9% S or combined with OVA, as above. Ethanol was used as V for R as physiologically relevant concentrations of R are not attainable in S because of R’s insolubility in nonorganic solvents [69].

4.3. Histology, Microscopy, and Morphometric Measurements

Skin samples were fixed in freshly prepared 4% paraformaldehyde, paraffin-embedded, sectioned, and mounted on microscopy slides. Image analyses and quantifications were performed in a single-blinded manner. One slide of each skin sample was stained with hematoxylin and eosin (H&E) for measurement of skin layer thickness and cell infiltration.
Tagged image file format (TIFF) images of the H&E slides were taken with a Nikon E-600 microscope, a Micropublisher camera, and software at 10× magnification. Thickness was measured using the MetaMorph® 6.1 Microscopy Automation and Image Analysis software (Molecular Devices, Sunnyvale, CA, USA) and a morphometric imaging technique recently developed by our lab [35], as explained in Figure 1. Three regions of interest (ROI) were randomly selected for each skin layer per image (3–6 images per animal) [16,17,35]. The MetaMorph software was used to trace the perimeter of each skin layer in each ROI. Next, the software provided measurements for the traced area (TA) and its perimeter (PR). The TA was defined as an irregular two-dimensional fiber and the equation below was used to calculate the average thickness or breadth of each fiber [75].
Fiber Breadth (FB) = ¼ [PR − (PR2 − 16TA)1/2]
FB measurements were collected to calculate the average thickness of the epidermis, dermis, and hypodermis for each harvested skin sample.
The computer-assisted quantification of cell infiltration was conducted exactly as previously described [16,17,35]. Briefly, a minimum of 10 images per mouse were collected from H&E-stained microscopy slides and analyzed with the MetaMorph 6.1. software. The distinct purple/blue color of hematoxylin-stained nuclei in skin sections was defined using the hue, saturation, and intensity (HSI) color model through a thresholding process [35]. Analyses were performed only of areas satisfying thresholding to eliminate background and nonspecific staining. Nuclei were defined using previously validated morphometric parameters uniquely identifying size and shape restricted to nuclei [16,17,35]. The hypodermis layer was surveyed using a circular ROI of fixed diameter (75 μm) imaging the entire layer, as our previous studies revealed that early cell infiltration occurred in this innermost and most vascularized layer of the skin [16,17,35]. Next, the software quantified the number of nuclei present in each ROI, and the average number of nuclei per ROI was calculated for each experimental cohort [16,17,35].
Local MC activation/degranulation was quantified using previously validated morphometric parameters associated with MCs, which describe MC cytoplasm and distinguish resting from activated MCs [16,17,35]. To this end, 15 adjacent images of the dermis and hypodermis at 40× magnification were recorded as TIFF files from each methylene blue (MB)-stained microscopy slide, a staining that not only specifically identifies MCs [16,17,76] but also their activation status [16,17]. Next, each MC was identified as an individual ROI using the HSI color model thresholding routine of the MetaMorph 6.1 software [35]. HSI values were set to isolate the distinct blue/purple color of MC cytoplasm stained with MB [16,17,76]. The integrated morphometry routine of the MetaMorph 6.1 software was employed to measure the area (A) and the integrated optical density (IOD) of each thresholded ROI [16,17,76]. IOD values represent the total amount of material present in the ROI (i.e., the MCs). The IOD of each ROI was then divided by its area and the resulting calculated values were used to define resting and activated MCs, as previously reported [16,17,35]. Next, the average number of total, resting/intact, and activated/degranulated MCs was calculated, exactly as previously described [16,17,35].

4.4. RNA Preparation and Quantitative Reverse Transcription Polymerase Chain Reaction Assay

One strip of skin was snap-frozen in liquid nitrogen immediately after harvesting and stored at −80 °C until use. Total RNA was isolated and purified from each sample with the miRNeasy kit (Qiagen, Valencia, CA, USA), following the manufacturer’s instructions. The cDNA synthesis kit (Bioline/Meridian Bioscience, Memphis, TN, USA) was used according to the manufacturer’s protocol to reverse transcribe cDNA from the isolated RNA. qRTPCR was conducted using the SensiFAST™ SYBR No-ROX kit (Bioline) and the CFX Connect instrument (Bio-Rad, Hercules, CA, USA). Samples were analyzed for the presence of mRNA coding for chemokines CCL2, CCL3, and CCL5, FcεRIα and SphK1, normalized to the β2-microglobulin (β2M) and β-actin (βA) reference genes. Primer sequences are listed in Table 1 (Thermo Fisher Scientific, Waltham, MA, USA).
The qRTPCR conditions were as follows: an initial step at 95 °C for 5 min and each of the 40 cycles consisting of 10 s at 95 °C then 1 min annealing at 55 °C followed by an extension at 72 °C. Each sample was assayed in duplicate determinations. Data analysis was performed with the CFX Manager™ software with normalization to control saline/R vehicle-treated samples, which was directly proportional to the amount of mRNA of the gene of interest relative to the amount of mRNA of the reference genes, i.e., β2-microglobulin and β-actin.

4.5. Western Blot Analysis

Proteins of skin samples were extracted from snap-frozen tissues, and protein concentrations were measured using a Pierce™ BCA Protein Assay Kit (Thermo Fisher). Equal amounts of proteins were electrophoretically separated on 4–20% Mini-PROTEAN® TGX™ gels (Bio-Rad, Hercules, CA, USA) and then transferred to nitrocellulose membranes. Membranes were immunoblotted with primary Ab against phosphorylated (P-) SphK1 (Exalpha X1849P), SphK1 (Bioss bs-2652R), P-Stat3 (Santa Cruz SC-81523), Stat3 (Cell Signaling Technology, Danvers, MA, USA, 4904S), P-p65 (Cell Signaling Technology 3033S), p65 (Cell Signaling Technology 8242S), followed by species-appropriate DyLight™-conjugated anti-IgG (LI-COR Biosciences, Lincoln, NE, USA). Sizes of target proteins were determined by using molecular weight standards (Bio-Rad). Protein band quantitation was carried out with a LI-COR Odyssey CLX imaging system measuring near-infrared fluorescence present in digitized images of membranes and the Image Studio® v4.1 software (LI-COR).

4.6. Statistics

Data are expressed as mean ± standard error of the mean (SEM) and analyzed using two-way analysis of variance for multiple comparisons with Bonferroni correction and the Prism 6 (GraphPad Software, La Jolla, CA, USA). The significance for statistical test is shown in the figures, and the differences were deemed significant for probability values (p) less than 0.05. The experiments were repeated at least twice, with duplicate or triplicate determinations and consistent results.

Author Contributions

Conceptualization and Data Analysis, C.D.C., Y.H., A.P.C., P.A.R., J.W.F., M.S. and C.A.O.; Writing—Original Draft Preparation, C.D.C. and C.A.O.; Methodology, C.D.C., A.P.C., P.A.R., J.W.F. and C.A.O.; Formal Analysis, C.D.C., A.P.C., J.W.F. and Y.H.; Resources, M.S.; Writing—Review and Editing, C.A.O., C.D.C., P.N., M.N., M.S. and all co-authors; Supervision, C.A.O.; Project Administration: C.A.O.; Funding acquisition, P.N., M.N. and C.A.O. All authors have read and agreed to the published version of the manuscript.

Funding

This research was funded in part by the National Institutes of Health (NIH)/National Institute of Arthritis and Musculoskeletal and Skin Diseases R21AR067996 and the NIH/National Institute of General Medical Sciences (NIGMS) Pilot Project and Target Faculty Project P20GM103499 to C.A.O., as well as by the NIH/NIGMS P20GM103499 for P.N. and M.N.

Institutional Review Board Statement

The animal study protocol was approved by the Institutional Animal Care and Use Committee of the University of South Carolina (protocol number 2403-101303-010818 approved on 1 August 2018).

Informed Consent Statement

Not applicable.

Data Availability Statement

Not applicable.

Conflicts of Interest

The authors declare no conflict of interest.

References

  1. Ständer, S. Atopic dermatitis. N. Engl. J. Med. 2021, 384, 1136–1143. [Google Scholar] [CrossRef]
  2. Jhanji, M.; Rao, C.N.; Massey, J.C.; Hope, M.C., 3rd; Zhou, X.; Keene, C.D.; Ma, T.; Wyatt, M.D.; Stewart, J.A.; Sajish, M. Cis- and trans-resveratrol have opposite effects on histone serine-ADP ribosylation and tyrosine induced neurodegeneration. Nat. Commun. 2022, 13, 3244. [Google Scholar] [CrossRef] [PubMed]
  3. Alghetaa, H.; Mohammed, A.; Sultan, M.; Busbee, P.; Murphy, A.; Chatterjee, S.; Nagarkatti, M.; Nagarkatti, P. Resveratrol protects mice against SEB-induced acute lung injury and mortality by miR-193a modulation that targets TGF-β signaling. J. Cell. Mol. Med. 2018, 22, 2644–2655. [Google Scholar] [CrossRef] [PubMed] [Green Version]
  4. Gandy, K.A.O.; Zhang, J.; Nagarkatti, P.; Nagarkatti, M. Resveratrol (3, 5, 4′-trihydroxy-trans-stilbene) attenuates a mouse model of multiple sclerosis by altering the miR-124/sphingosine kinase 1 axis in encephalitogenic T cells in the brain. J. Neuroimmune Pharmacol. 2019, 14, 462–477. [Google Scholar] [CrossRef] [PubMed]
  5. Alharris, E.; Mohammed, A.; Alghetaa, H.; Zhou, J.; Nagarkatti, M.; Nagarkatti, P. The ability of resveratrol to attenuate ovalbumin-mediated allergic asthma is associated with changes in microbiota involving the gut-lung axis, enhanced barrier function and decreased inflammation in the lungs. Front. Immunol. 2022, 13, 805770. [Google Scholar] [CrossRef]
  6. Alharris, E.; Alghetaa, H.; Seth, R.; Chatterjee, S.; Singh, N.P.; Nagarkatti, M.; Nagarkatti, P. Resveratrol attenuates allergic asthma and associated inflammation in the lungs through regulation of miRNA-24a that targets Foxp3 in mice. Front. Immunol. 2018, 9, 2992. [Google Scholar] [CrossRef] [Green Version]
  7. Ramirez-Garza, S.L.; Laveriano-Santos, E.P.; Marhuenda-Munoz, M.; Storniolo, C.E.; Tresserra-Rimbau, A.; Vallverdu-Queralt, A.; Lamuela-Raventos, R.M. Health effects of resveratrol: Results from human intervention trials. Nutrients 2018, 10, 1892. [Google Scholar] [CrossRef] [Green Version]
  8. Walle, T. Bioavailability of resveratrol. Ann. N. Y. Acad. Sci. 2011, 1215, 9–15. [Google Scholar] [CrossRef]
  9. Sajish, M.; Schimmel, P.A. human tRNA synthetase is a potent PARP1-activating effector target for resveratrol. Nature 2015, 519, 370–373. [Google Scholar] [CrossRef] [Green Version]
  10. Sergides, C.; Chirila, M.; Silvestro, L.; Pitta, D.; Pittas, A. Bioavailability and safety study of resveratrol 500 mg tablets in healthy male and female volunteers. Exp. Ther. Med. 2016, 11, 164–170. [Google Scholar] [CrossRef] [Green Version]
  11. Galli, S.J.; Tsai, M. IgE and mast cells in allergic disease. Nat. Med. 2012, 18, 693–704. [Google Scholar] [CrossRef] [PubMed] [Green Version]
  12. St John, A.L.; Rathore, A.P.S.; Ginhoux, F. New perspectives on the origins and heterogeneity of mast cells. Nat. Rev. Immunol. 2023, 23, 55–68. [Google Scholar] [CrossRef] [PubMed]
  13. Kawakami, T.; Ando, T.; Kimura, M.; Wilson, B.S.; Kawakami, Y. Mast cells in atopic dermatitis. Curr. Opin. Immunol. 2009, 21, 666–678. [Google Scholar] [CrossRef] [Green Version]
  14. Oskeritzian, C.A.; Price, M.M.; Hait, N.C.; Kapitonov, D.; Falanga, Y.T.; Morales, J.K.; Ryan, J.J.; Milstien, S.; Spiegel, S. Essential roles of sphingosine-1-phosphate receptor 2 in human mast cell activation, anaphylaxis, and pulmonary edema. J. Exp. Med. 2010, 207, 465–474. [Google Scholar] [CrossRef]
  15. Oskeritzian, C.A.; Hait, N.C.; Wedman, P.; Chumanevich, A.; Kolawole, E.M.; Price, M.M.; Falanga, Y.T.; Harikumar, K.B.; Ryan, J.J.; Milstien, S.; et al. The sphingosine-1-phosphate/sphingosine-1-phosphate receptor 2 axis regulates early airway T0cell infiltration in murine mast cell-dependent acute allergic responses. J. Allergy Clin. Immunol. 2015, 135, 1008–1018.e1. [Google Scholar] [CrossRef] [PubMed] [Green Version]
  16. Wedman, P.A.; Aladhami, A.; Chumanevich, A.P.; Fuseler, J.W.; Oskeritzian, C.A. Mast cells and sphingosine-1-phosphate underlie prelesional remodeling in a mouse model of eczema. Allergy 2018, 73, 405–415. [Google Scholar] [CrossRef] [PubMed]
  17. Tanis, R.M.; Wedman-Robida, P.A.; Chumanevich, A.P.; Fuseler, J.W.; Oskeritzian, C.A. The mast cell/S1P axis is not linked to pre-lesional male skin remodeling in a mouse model of eczema. AIMS Allergy Immunol. 2021, 5, 160–174. [Google Scholar] [CrossRef]
  18. Robida, P.A.; Chumanevich, A.P.; Gandy, A.O.; Fuseler, J.W.; Nagarkatti, P.; Nagarkatti, M.; Oskeritzian, C.A. Skin mast cell-driven ceramides drive early apoptosis in pre-symptomatic eczema in mice. Int. J. Mol. Sci. 2021, 22, 7851. [Google Scholar] [CrossRef]
  19. Galli, S.J.; Metz, M.; Starkl, P.; Marichal, T.; Tsai, M. Mast cells and IgE in defense against lethality of venoms: Possible “benefit” of allergy. Allergo J. Int. 2020, 29, 46–62. [Google Scholar] [CrossRef]
  20. Galli, S.J.; Gaudenzio, N.; Tsai, M. Mast cells in inflammation and disease: Recent progress and ongoing concerns. Annu. Rev. Immunol. 2020, 38, 49–77. [Google Scholar] [CrossRef]
  21. Alam, S.B.; Wagner, A.; Willows, S.; Kulka, M. Quercetin and resveratrol differentially decrease expression of the high-affinity IgE receptor (FcεRI) by human and mouse mast cells. Molecules 2022, 27, 6704. [Google Scholar] [CrossRef] [PubMed]
  22. Bilotta, S.; Arbogast, J.; Schart, N.; Frei, M.; Lorentz, A. Resveratrol treatment prevents increase of mast cells in both murine OVA enteritis and IL-10−/− colitis. Int. J. Mol. Sci. 2022, 21, 1213. [Google Scholar] [CrossRef] [PubMed]
  23. Han, S.-Y.; Bae, J.-Y.; Park, S.-H.; Kim, Y.-H.; Han Yoon Park, J.; Kang, Y.-H. Resveratrol inhibits IgE-mediated basophilic mast cell degranulation and passive cutaneous anaphylaxis in mice. J. Nutr. 2013, 143, 632–639. [Google Scholar] [CrossRef] [PubMed] [Green Version]
  24. Bilotta, S.; Paruchuru, L.B.; Feilhauer, K.; Köninger, J.; Lorentz, A. Resveratrol is a natural inhibitor of human intestinal mast cell activation and phosphorylation of mitochondrial ERK1/2 and Stat3. Int. J. Mol. Sci. 2021, 22, 7640. [Google Scholar] [CrossRef]
  25. Park, K.; Elias, P.M.; Hupe, M.; Borkowski, A.W.; Gallo, R.L.; Shin, K.-O.; Lee, Y.-M.; Holleran, W.M.; Uchida, Y. Resveratrol stimulates sphingosine-1-phosphate signaling of cathelicidin production. J. Investig. Dermatol. 2013, 133, 1942–1949. [Google Scholar] [CrossRef] [Green Version]
  26. Gong, W.; Li, J.; Chen, W.; Feng, F.; Deng, Y. Resveratrol inhibits lipopolysaccharide-induced extracellular matrix accumulation and inflammation in rat glomerular mesangial cells by SphK1/S1P2/NF-κB pathway. Diabetes Metab. Syndr. Obes. 2020, 13, 4495–4505. [Google Scholar] [CrossRef]
  27. Shirley, D.; McHale, C.; Gomez, G. Resveratrol preferentially inhibits IgE-dependent PGD2 biosynthesis but enhances TNF production from human skin mast cells. Biochim. Biophys. Acta 2016, 1860, 678–685. [Google Scholar] [CrossRef] [PubMed] [Green Version]
  28. Zhao, W.; Huang, X.; Han, X.; Hu, D.; Hu, X.; Li, Y.; Huang, P.; Yao, W. Resveratrol suppresses gut derived NLRP3 inflammasome partly through stabilizing mast cells in a rat model. Mediat. Inflamm. 2018, 2018, 6158671. [Google Scholar] [CrossRef]
  29. Chen, Q.; Dong, L.; Li, Y.; Liu, Y.; Xia, Q.; Sang, S.; Wu, Z.; Xiao, J.; Liu, L.; Liu, L. Research advance of non-thermal processing technologies on ovalbumin properties: The gelation, foaming, emulsification, allergenicity, immunoregulation and its delivery system application. Crit. Rev. Food Sci. Nutr. 2023, 2023, 1–22. [Google Scholar] [CrossRef]
  30. Kulinski, J.M.; Proia, R.L.; Larson, E.M.; Metcalfe, D.D.; Olivera, A. S1P4 regulates passive systemic anaphylaxis in mice but is dispensable for canonical IgE-mediated responses in mast cells. Int. J. Mol. Sci. 2018, 19, 1279. [Google Scholar] [CrossRef] [Green Version]
  31. Olivera, A.; Mizugishi, K.; Tikhonova, A.; Ciaccia, L.; Odom, S.; Proia, R.L.; Rivera, J. The sphingosine kinase-sphingosine-1-phosphate axis is a determinant of mast cell function and anaphylaxis. Immunity 2007, 26, 287–297. [Google Scholar] [CrossRef] [PubMed] [Green Version]
  32. Vallabhapurapu, S.; Karin, M. Regulation and function of NF-kappaB transcription factors in the immune system. Annu. Rev. Immunol. 2009, 27, 693–733. [Google Scholar] [CrossRef] [PubMed]
  33. Spergel, J.M.; Mizoguchi, E.; Brewer, J.P.; Martin, T.R.; Bhan, A.K.; Geha, R.S. Epicutaneous sensitization with protein antigen induces localized allergic dermatitis and hyperresponsiveness to methacholine after single exposure to aerosolized antigen in mice. J. Clin. Investig. 1998, 101, 1614–1622. [Google Scholar] [CrossRef] [PubMed]
  34. Leyva-Castillo, J.M.; Sun, L.; Wu, S.-Y.; Rockowitz, S.; Sliz, P.; Geha, R.S. Single-cell transcriptome profile of mouse skin undergoing antigen-driven allergic inflammation recapitulates findings in atopic dermatitis skin lesions. J. Allergy Clin. Immunol. 2022, 150, 373–384. [Google Scholar] [CrossRef]
  35. Wedman, P.; Aladhami, A.; Beste, M.; Edwards, M.K.; Chumanevich, A.; Fuseler, J.W.; Oskeritzian, C.A. A new image analysis method based on morphometric and fractal parameters for rapid evaluation of in situ mammalian mast cell status. Microsc. Microanal. 2015, 21, 1573–1581. [Google Scholar] [CrossRef]
  36. Oskeritzian, C.A.; Milstien, S.; Spiegel, S. Sphingosine-1-phosphate in allergic responses, asthma and anaphylaxis. Pharmacol. Ther. 2007, 115, 390–399. [Google Scholar] [CrossRef] [Green Version]
  37. Hait, N.C.; Oskeritzian, C.A.; Paugh, S.W.; Milstien, S.; Spiegel, S. Sphingosine kinases, sphingosine-1-phosphate, apoptosis and diseases. Biochim. Biophys. Acta 2006, 1758, 2016–2026. [Google Scholar] [CrossRef] [Green Version]
  38. Oskeritzian, C.A. Mast cell plasticity and sphingosine-1-phosphate in immunity, inflammation and cancer. Mol. Immunol. 2015, 63, 104–112. [Google Scholar] [CrossRef] [Green Version]
  39. Price, M.M.; Oskeritzian, C.A.; Milstien, S.; Spiegel, S. Sphingosine-1-phosphate synthesis and functions in mast cells. Future Lipidol. 2008, 3, 665–674. [Google Scholar] [CrossRef] [Green Version]
  40. Mitra, P.; Oskeritzian, C.A.; Payne, S.G.; Beaven, M.A.; Milstien, S.; Spiegel, S. Role of ABCC1 in export of sphingosine-1-phosphate from mast cells. Proc. Natl. Acad. Sci. USA 2006, 103, 16394–16399. [Google Scholar] [CrossRef] [Green Version]
  41. Chumanevich, A.; Wedman, P.; Oskeritzian, C.A. Sphingosine-1-phosphate/sphingosine-1-phosphate receptor 2 axis can promote mouse and human primary mast cell angiogenic potential through upregulation of vascular endothelial growth factor-A and matrix metalloproteinase-2. Mediat. Inflamm. 2016, 2016, 1503206. [Google Scholar] [CrossRef] [Green Version]
  42. Oskeritzian, C.A.; Alvarez, S.E.; Hait, N.C.; Price, M.M.; Milstien, S.; Spiegel, S. Distinct roles of sphingosine kinases 1 and 2 in human mast-cell functions. Blood 2008, 111, 4193–4200. [Google Scholar] [CrossRef]
  43. Price, M.M.; Oskeritzian, C.A.; Falanga, Y.T.; Harikumar, K.B.; Allegood, J.C.; Alvarez, S.E.; Conrad, D.; Ryan, J.J.; Milstien, S.; Spiegel, S. A specific sphingosine kinase 1 inhibitor attenuates airway hyperresponsiveness and inflammation in a mast cell-dependent murine model of allergic asthma. J. Allergy Clin. Immunol. 2013, 131, 501–511.e1. [Google Scholar] [CrossRef] [PubMed] [Green Version]
  44. Bhardwaj, A.; Sethi, G.; Vadhan-Raj, S.; Bueso-Ramos, C.; Takada, Y.; Gaur, U.; Nair, A.S.; Shishodia, S.; Aggarwal, B.B. Resveratrol inhibits proliferation, induces apoptosis, amd overcomes chemoresistance through down-regulation of Stat3 and nuclear factor-kappaB-regulated antiapoptotic and cell survival gene products in human multiple myeloma cells. Blood 2007, 109, 2293–2302. [Google Scholar] [CrossRef] [PubMed] [Green Version]
  45. Wang, G.; Hu, Z.; Fu, Q.; Song, X.; Cui, Q.; Jia, R.; Zou, Y.; He, C.; Li, L.; Yin, Z. Resveratrol mitigates lipopolysaccharide-mediated acute inflammation in rats by inhibiting the TLR4/NF-κBp65/MAPKs signaling cascade. Sci. Rep. 2017, 7, 45006. [Google Scholar] [CrossRef]
  46. Brizuela, L.; Dayon, A.; Doumerc, N.; Ader, I.; Golzio, M.; Izard, J.-C.; Hara, Y.; Malavaud, B.; Cuvillier, O. The sphingosine kinase-1 survival pathway is a molecular target for the tumor-suppressive tea and wine polyphenols in prostate cancer. FASEB J. 2010, 24, 3882–3894. [Google Scholar] [CrossRef] [PubMed] [Green Version]
  47. Tian, T.; Yu, Z. Resveratrol induces apoptosis of leukemia cell line K562 by modulation of sphingosine kinase-1 pathway. Int. J. Clin. Exp. Pathol. 2015, 8, 2755–2762. [Google Scholar]
  48. Shi, W.; Zhai, C.; Feng, W.; Wang, J.; Zhu, Y.; Li, S.; Wang, Q.; Zhang, Q.; Yan, X.; Chai, L.; et al. Resveratrol inhibits monocrotaline-induced pulmonary arterial remodeling by suppression of SphK1-mediated NF-κB activation. Life Sci. 2018, 210, 140–149. [Google Scholar] [CrossRef]
  49. Kobayashi, N.; Nishi, T.; Hirata, T.; Kihara, A.; Sano, T.; Igarashi, Y.; Yamaguchi, A. Sphingosine-1-phosphate is released from the cytosol of rat platelets in a carrier-mediated manner. J. Lipid. Res. 2006, 47, 614–621. [Google Scholar] [CrossRef] [Green Version]
  50. Pitson, S.M.; Moretti, P.A.B.; Zebol, J.R.; Lynn, H.E.; Xia, P.; Vadas, M.A.; Wattenberg, B.W. Activation of sphingosine kinase 1 by ERK1/2-mediated phosphorylation. EMBO J. 2003, 22, 5491–5500. [Google Scholar] [CrossRef] [Green Version]
  51. Price, M.M.; Kapitonov, D.; Allegood, J.; Milstien, S.; Oskeritzian, C.A.; Spiegel, S. Sphingosine-1-phosphate induces development of functionally mature chymase-expressing human mast cells from hematopoietic progenitors. FASEB J. 2009, 23, 3506–3515. [Google Scholar] [CrossRef] [PubMed] [Green Version]
  52. Yoon, J.; Leyva-Castillo, J.M.; Wang, G.; Galand, C.; Oyoshi, M.K.; Kumar, L.; Hoff, S.; He, R.; Chervonsky, A.; Oppenheim, J.J.; et al. IL-23 induced in keratinocytes by endogenous TLR4 ligands polarizes dendritic cells to drive IL-22 responses to skin immunization. J. Exp. Med. 2016, 213, 2147–2166. [Google Scholar] [CrossRef] [PubMed] [Green Version]
  53. Sun, J.; Zhang, M.; Chen, K.; Chen, B.; Zhao, Y.; Gong, H.; Zhao, X.; Qi, R. Suppression of TLR4 activation by resveratrol is associated with Stat3 and Akt inhibition in oxidized low-density lipoprotein-activated platelets. Eur. J. Pharmacol. 2018, 836, 1–10. [Google Scholar] [CrossRef] [PubMed]
  54. Mackey, E.; Moeser, A.J. Sex differences in mast cell-associated disorders: A life span perspective. Cold Spring Harb. Perspect. Biol. 2022, 14, a039172. [Google Scholar] [CrossRef]
  55. Thyssen, J.P.; Johansen, J.D.; Linneberg, A.; Menné, T. The epidemiology of hand eczema in the general population—Prevalence and main findings. Contact. Derm. 2010, 62, 75–87. [Google Scholar] [CrossRef]
  56. Harrop, J.; Chinn, S.; Verlato, G.; Olivieri, M.; Norbäck, D.; Wjst, M.; Janson, C.; Zock, J.-P.; Leynaert, B.; Gislason, D.; et al. Eczema, atopy and allergen exposure in adults: A population-based study. Clin. Exp. Allergy 2007, 37, 526–535. [Google Scholar] [CrossRef]
  57. Chen, W.; Mempel, M.; Schober, W.; Behrendt, H.; Ring, J. Gender difference, sex hormones, and immediate type hypersensitivity reactions. Allergy 2008, 63, 418–427. [Google Scholar] [CrossRef]
  58. Lee, J.H.; Haselkorn, T.; Chipps, B.E.; Miller, D.P.; Wenzel, S.E.; Tenor Study Group. Gender differences in IgE-mediated allergic asthma in the epidemiology and natural history of asthma: Outcomes and treatment regimens (TENOR) study. J. Asthma 2006, 43, 179–184. [Google Scholar] [CrossRef]
  59. Simpson, C.R.; Newton, J.; Hippisley-Cox, J.; Sheikh, A. Trends in the epidemiology and prescribing of medication for Eczema in England. J. Roy. Soc. Med. 2009, 102, 108–117. [Google Scholar] [CrossRef] [Green Version]
  60. Osman, M.; Hansell, A.L.; Simpson, C.R.; Hollowell, J.; Helms, P.J. Gender-specific presentations for asthma, allergic rhinitis and eczema in primary care. Prim. Care Respir. J. 2007, 16, 28–35. [Google Scholar] [CrossRef]
  61. Silverberg, J.I.; Hanifin, J.M. Adult eczema prevalence and associations with asthma and other health and demographic factors: A US population-based study. J. Allergy Clin. Immun. 2013, 132, 1132–1138. [Google Scholar] [CrossRef] [PubMed]
  62. Ridolo, E.; Incorvaia, C.; Martignago, I.; Caminati, M.; Canonica, G.W.; Senna, G. Sex in respiratory and skin allergies. Clin. Rev. Allergy Immunol. 2019, 56, 322–332. [Google Scholar] [CrossRef] [PubMed]
  63. Fuxench, Z.C.C.; Block, J.K.; Boguniewicz, M.; Boyle, J.; Fonacier, L.; Gelfand, J.M.; Grayson, M.H.; Margolis, D.J.; Mitchell, L.; Silverberg, J.I.; et al. Atopic dermatitis in America study: A cross-sectional study examining the prevalence and disease burden of atopic dermatitis in the US adult population. J. Investig. Dermatol. 2019, 139, 583–590. [Google Scholar] [CrossRef] [PubMed] [Green Version]
  64. Sacotte, R.; Silverberg, J.I. Epidemiology of adult atopic dermatitis. Clin. Dermatol. 2018, 36, 595–605. [Google Scholar] [CrossRef]
  65. Liu, L.; Jin, R.; Hao, J.; Zeng, J.; Yin, D.; Yi, Y.; Zhu, M.; Mandal, A.; Hua, Y.; Ng, C.K.; et al. Consumption of the fish oil high fat uncouples obesity and mammary tumor growth through induction of reactive oxygen species in protumor macrophages. Cancer Res. 2020, 80, 2564–2574. [Google Scholar] [CrossRef] [Green Version]
  66. Gadag, S.; Narayan, R.; Nayak, Y.; Yogendra Nayak, U. Bioanalytical RP-HPLC method validation for resveratrol and its application to pharmacokinetic and drug distribution studies. J. Appl. Pharm. Sci. 2022, 12, 158–164. [Google Scholar]
  67. Chen, H.; Zheng, S.; Wang, Y.; Zhu, H.; Liu, Q.; Xue, Y.; Qiu, J.; Zou, H.; Zhu, X. The effect of resveratrol on the recurrent attacks of gouty arthritis. Clin. Rheumatol. 2016, 35, 1189–1195. [Google Scholar] [CrossRef]
  68. Wenzel, E.; Somoza, V. Metabolism and bioavailability of trans-resveratrol. Mol. Nutr. Food Res. 2005, 49, 472–481. [Google Scholar] [CrossRef]
  69. Jang, M.; Cai, L.; Udeani, G.O.; Slowing, K.V.; Thomas, C.F.; Beecher, C.W.; Fong, H.H.; Farnsworth, N.R.; Kinghorn, A.D.; Mehta, R.G.; et al. Cancer chemopreventive activity of resveratrol, a natural product derived from grapes. Science 1997, 275, 218–220. [Google Scholar] [CrossRef] [Green Version]
  70. Numata, K.; Harada, K.; Nakae, S. Roles of mast cells in cutaneous diseases. Front. Immunol. 2022, 13, 923495. [Google Scholar] [CrossRef]
  71. Shi, S.; Ye, L.; Yu, X.; Jin, K.; Wu, W. Focus on mast cells in the tumor microenvironment: Current knowledge and future directions. Biochim. Biophys. Acta Rev. Cancer 2022, 1878, 188845. [Google Scholar] [CrossRef] [PubMed]
  72. Noto, C.N.; Hoft, S.G.; DiPaolo, R.J. Mast cells as important regulators in autoimmunity and cancer development. Front. Cell. Dev. Biol. 2021, 9, 752350. [Google Scholar] [CrossRef]
  73. Robinson, K.; Mock, C.; Liang, D. Pre-formulation studies of resveratrol. Drug Dev. Ind. Pharm. 2015, 41, 1464–1469. [Google Scholar] [CrossRef] [PubMed]
  74. Smoliga, J.M.; Blanchard, O. Enhancing the delivery of resveratrol in humans: If low bioavailability is the problem, what is the solution? Molecules 2014, 19, 17154–17172. [Google Scholar] [CrossRef] [Green Version]
  75. Russ, J.C. The Image Processing Handbook, 6th ed.; Taylor & Francis Group, Ed.; CRC Press: Boca Raton, FL, USA, 2011; pp. 1–972. [Google Scholar]
  76. Wolters, P.J.; Mallen-St Clair, J.; Lewis, C.C.; Villalta, S.A.; Baluk, P.; Erle, D.J.; Caughey, G.H. Tissue-specific mast cell reconstitution and differential lung gene expression in mast cell-deficient Kit (W-sh)/Kit(W-sh) sash mice. Clin. Exp. Allergy 2005, 35, 82–88. [Google Scholar] [CrossRef] [PubMed] [Green Version]
Figure 1. Flow chart for computer-assisted measurements of skin layer thickness: (a) H&E-stained whole skin section, showing individual layer thickness: epidermis (blue), dermis (purple), hypodermis (green), and Region of Interest (ROI, white rectangle) used to survey each full-length layer. (b) Epidermis isolation within the ROI converted into a Traced Area (TA, orange). (c) Equation used to calculate layer thickness (FB, Fiber Breadth) using measured perimeter of the isolated layer (PR, μm) and TA (μm2). (d) Resulting conversion of the irregular fiber (b) into a rectangle measuring the average thickness of the layer while preserving its original length-to-width ratio.
Ijms 24 06707 g001
Figure 2. Resveratrol prevents ovalbumin-induced epidermal but not dermal layer thickening: (a) Thickness measurements of the epidermis, (b) dermis, and (c) hypodermis of mouse dorsal skin after 7 days of epicutaneous exposure to saline (S) and vehicle for resveratrol (V) (dark grey filled bars), ovalbumin (O) and V (black filled bars), S with resveratrol (R) (empty bars), or O with R (light grey bars). N = 3 mice, 3–6 images per mouse, 3 ROI per image for each experimental group. n.s., not significant.
Ijms 24 06707 g002
Figure 3. Decreased cellular infiltration in the hypodermis of mouse dorsal skins after a 7-day treatment with ovalbumin and resveratrol: (a) Hematoxylin and eosin (H&E) staining of skin tissues, focusing on the hypodermis after 7 days of epicutaneous exposure to saline (S) and vehicle for resveratrol (V), ovalbumin (O) and V, S with resveratrol (R), or O with R (scale bar = 50 mm). (b) Quantification of whole hypodermal cell infiltration after 7 days of epicutaneous exposure to S and V (dark grey filled bars), O and V (black filled bars), S with R (empty bars), or O with R (light grey bars). N = 6 mice per experimental group, 10 images per mouse, 10 ROI per image. (c) Quantification of hypodermal cell infiltration around blood vessels (BV) after 7 days of epicutaneous exposure to S and V (dark grey filled bars), O and V (black filled bars), S with R (empty bars), or O with R (light grey bars). #, number of, n = 6 mice, 10 images per mouse, 225–255 BV-containing ROI per experimental group.
Ijms 24 06707 g003
Figure 4. Resveratrol attenuates skin mast cell activation and reactivity without affecting mast cell numbers: (a) Mean total mast cell numbers, (b) activation (degranulation), and (c) FcεRIα mRNA expression levels after 7 days of epicutaneous exposure to saline (S) and vehicle for resveratrol (V) (dark grey filled bars), ovalbumin (O) and V (black filled bars), S with resveratrol (R) (empty bars), or O with R (light grey bars). N = 3–9 mice per experimental group and 15 images per mouse (a,b), n.s., not significant.
Ijms 24 06707 g004
Figure 5. Resveratrol alleviates ovalbumin-induced skin chemokine mRNA elevation without altering SphK1 mRNA levels: (a) skin CCL2, (b) CCL3, and (c) CCL5 mRNA expression levels after 7 days of epicutaneous exposure to saline (S) and vehicle for resveratrol (V) (dark grey filled bars), ovalbumin (O) and V (black filled bars), S with resveratrol (R) (empty bars), or O with R (light grey bars). N = 6 mice per experimental group and two independent trials, n.s., not significant.
Ijms 24 06707 g005
Figure 6. Resveratrol suppresses ovalbumin-induced activation of SphK1, Stat3, and NF-κB: (a,b) skin SphK1, (a,c) Stat3, and (a,d) NF-κB/p65 activation levels after 7 days of epicutaneous exposure to saline (S) and vehicle for resveratrol (V) (dark grey filled bars), ovalbumin (O) and V (black filled bars), S with resveratrol (R) (empty bars), or O with R (light grey bars). N = 6 mice per experimental group, n.s., not significant.
Ijms 24 06707 g006
Table 1. qRTPCR primer sequences.
GeneForward (F)
Reverse (R)
5′   Primer Sequence   3′
B2MF
R
CCGAACATACTGAACTGCTACGTAA
CCCGTTCTTCAGCATTTGGA
βAF
R
GACGGCCAGGTCATCACTATTG
AGGAAGGCTGGAAAAGAGCC
CCL2F
R
CACTCACCTGCTGCTACTCA
GCTTGGTGACAAAAACTACAGC
CCL3F
R
GCCATATGGAGCTGACACCC
TAGTCAGGAAAATGACACCTGGC
CCL5F
R
TGCCCTCACCATCATCCTCACT
GGCGGTTCCTTCGAGTGACA
FcεRIαF
R
ATTGTGAGTGCCACCGTTCA
GCAGCCAATCTTGCGTTACA
SphK1F
R
CGTGGACCTCGAGAGTGAGAA
AGGCTTGCTAGGCGAAAGAAG
Disclaimer/Publisher’s Note: The statements, opinions and data contained in all publications are solely those of the individual author(s) and contributor(s) and not of MDPI and/or the editor(s). MDPI and/or the editor(s) disclaim responsibility for any injury to people or property resulting from any ideas, methods, instructions or products referred to in the content.

