1. Introduction
Green foxtail (
Setaria viridis (L.) P. Beauv. (Poales: Poaceae)) is a diploid and self-pollinating grass weed. Its fecundity is high, and a single plant can produce more than 80,000 seeds; furthermore,
S. viridis infests corn, millet, watermelon, and soybeans, leading to considerable yield losses [
1].
Setaria. viridis is the second-largest weed in maize fields in Northeast China [
2]. The control of
S. viridis in maize fields has relied on the extensive use of the acetolactate synthase (ALS) inhibitor nicosulfuron during the last 20 years. Nicosulfuron belongs to the sulfonylurea group of ALS inhibitors that reduce branched-chain amino acid synthesis, which inhibits ALS enzyme activity in sensitive plants [
3]. However, with the extensive use of nicosulfuron, some
S. viridis populations have developed different levels of resistance in China [
4,
5].
Mechanisms of herbicide resistance include the following two types: target-site resistance (TSR) and non-target-site resistance (NTSR). To date, most cases of herbicide resistance reported have occurred through TSR, by which the herbicide binding site is mutated or the herbicide target gene is overexpressed [
6]. For ALS-inhibiting herbicide resistance, various amino acid substitutions conferring resistance were identified at the eight main sites of Ala122, Pro197, Ala205, Asp376, Arg377, Trp574, Ser653, and Gly654 in the ALS isozymes of weeds. Mutations in the
ALS gene confer resistance to many weeds, such as
Solanum ptychanthum Dunal (Solanales: Solanaceae) [
7],
Amaranthus palmeri S.Watson (Caryophyllales: Amaranthaceae) [
8],
Erigeron sumatrensis Retz. (Asterales: Asteraceae) [
9],
Glebionis coronaria (Linnaeus) Cassini ex Spach (Asterales: Asteraceae) [
10], etc.
Compared with TSR, NTSR is more complex, involving multiple genes. The NTSR may result from reduced herbicide penetration into the plant, herbicide translocation, reduced sequestration, or increased metabolic rate [
6]. Enhancing the metabolism of herbicides in weeds is a current research hotspot. It involves cytochrome P450 monooxygenases (P450s), glucosyltransferases (GTs), ATP-binding cassette (ABC) transporters, and glutathione S-transferases (GSTs) [
11]. The RNA sequencing (RNA-Seq) technology efficiently quantifies gene expression through short-read sequencing on the Illumina platform. Genes conferring NTSR resistance in weeds were identified by this technique [
12]. For example,
CYP72A31 confers tolerance to ALS-inhibiting herbicides in rice and
Arabidopsis thaliana (L.) Heynh. (Capparales: Brassicaceae) [
13]. In addition,
CYP749A16,
CYP71C6v1, and the P450 genes belonging to the
CYP81A subfamily are related to the metabolism of ALS-inhibiting herbicides [
13,
14,
15].
The TSR and NTSR mechanisms of weeds can be superimposed in the same population or the same plant [
16,
17], such as
Lolium rigidum Gaudich. (Poales: Poaceae) [
18,
19],
Amaranthus tuberculatus (Moq.) J. D. Sauer (Caryophyllales, Amaranthaceae) [
20], and
S. viridis [
5]. The mechanisms that confer herbicide resistance might have effects on the weed growth. For example, the
S. viridis mutants resistant to acetyl-CoA carboxylase (ACCase) herbicides showed better growth and a higher number of grains than the wild type [
21]. Additionally, the
S. viridis resistant to dinitroaniline were smaller and had a lower thousand-grain weight compared with the wild type [
22].
S. viridis is the wild ancestor of
Setaria italica (L.) Beauv. (Poales: Poaceae) and exhibits an evolutionary relationship with maize, sorghum, and sugarcane [
23,
24]. Therefore, studying the resistance mechanism in
S. viridis is of great significance for weed control and crop breeding. In recent years, maize growers from Northeast China have complained about unsatisfactory control of this weed after nicosulfuron treatment. The objectives of this study are to (1) identify the target-site basis of the possible presence of a point mutation in the
ALS gene and (2) determine the NTSR and identify candidate genes in
S. viridis.
3. Discussion
Setaria viridis is one of the most common gramineous weeds in spring maize fields in northern China that seriously endangers maize yield and is the focus of control [
2]. Nicosulfuron has been used in maize fields in China for more than 20 years. Due to its high activity, strong selectivity, low residue, and small impact on subsequent crops, it has gradually developed into an extensively used herbicide for controlling gramineous weeds in maize fields in China. The consecutive use of nicosulfuron has resulted in the evolution of resistance in
S. viridis. In this study, the GR
50 of the R376 population was 4.48-fold higher than the recommended field dose and 35.8-fold higher than that of the S population, which indicated that a high dose of nicosulfuron could not control
S. viridis and that the R376 population was resistant to nicosulfuron.
The TSR is the main cause of resistance to herbicides. Analysis of the
ALS sequences of R376 plants indicated the presence of the Asp-376-Glu substitution. The Asp376 substitution results in high levels of resistance to sulfonylurea (SU) herbicides in
Schoenoplectiella juncoides (Roxb.) Lye (Poales: Cyperaceae)
, Lolium perenne L. (Poales: Poaceae)
, Limnocharis flava (L.) Buchenau (Alismatales: Alismataceae)
, etc. [
25,
26,
27]. This result indicated that targeted mutation was an important reason for the resistance of the R376 population to nicosulfuron.
All types of resistance mechanisms, including TSR and NTSR, can be superimposed in resistant plants. In a previous study,
S. viridis populations with high resistance to nicosulfuron were shown to possess both target-site mutations (Asp-376-Glu and Pro-197-Ala) and P450-mediated enhanced metabolism [
5]. Metabolic resistance in weeds first became evident in the 1980s in Australia (in
L. rigidum) and the United Kingdom (in
Alopecurus myosuroides Huds. (Poales: Poaceae)), and this type of resistance is now increasing in weeds [
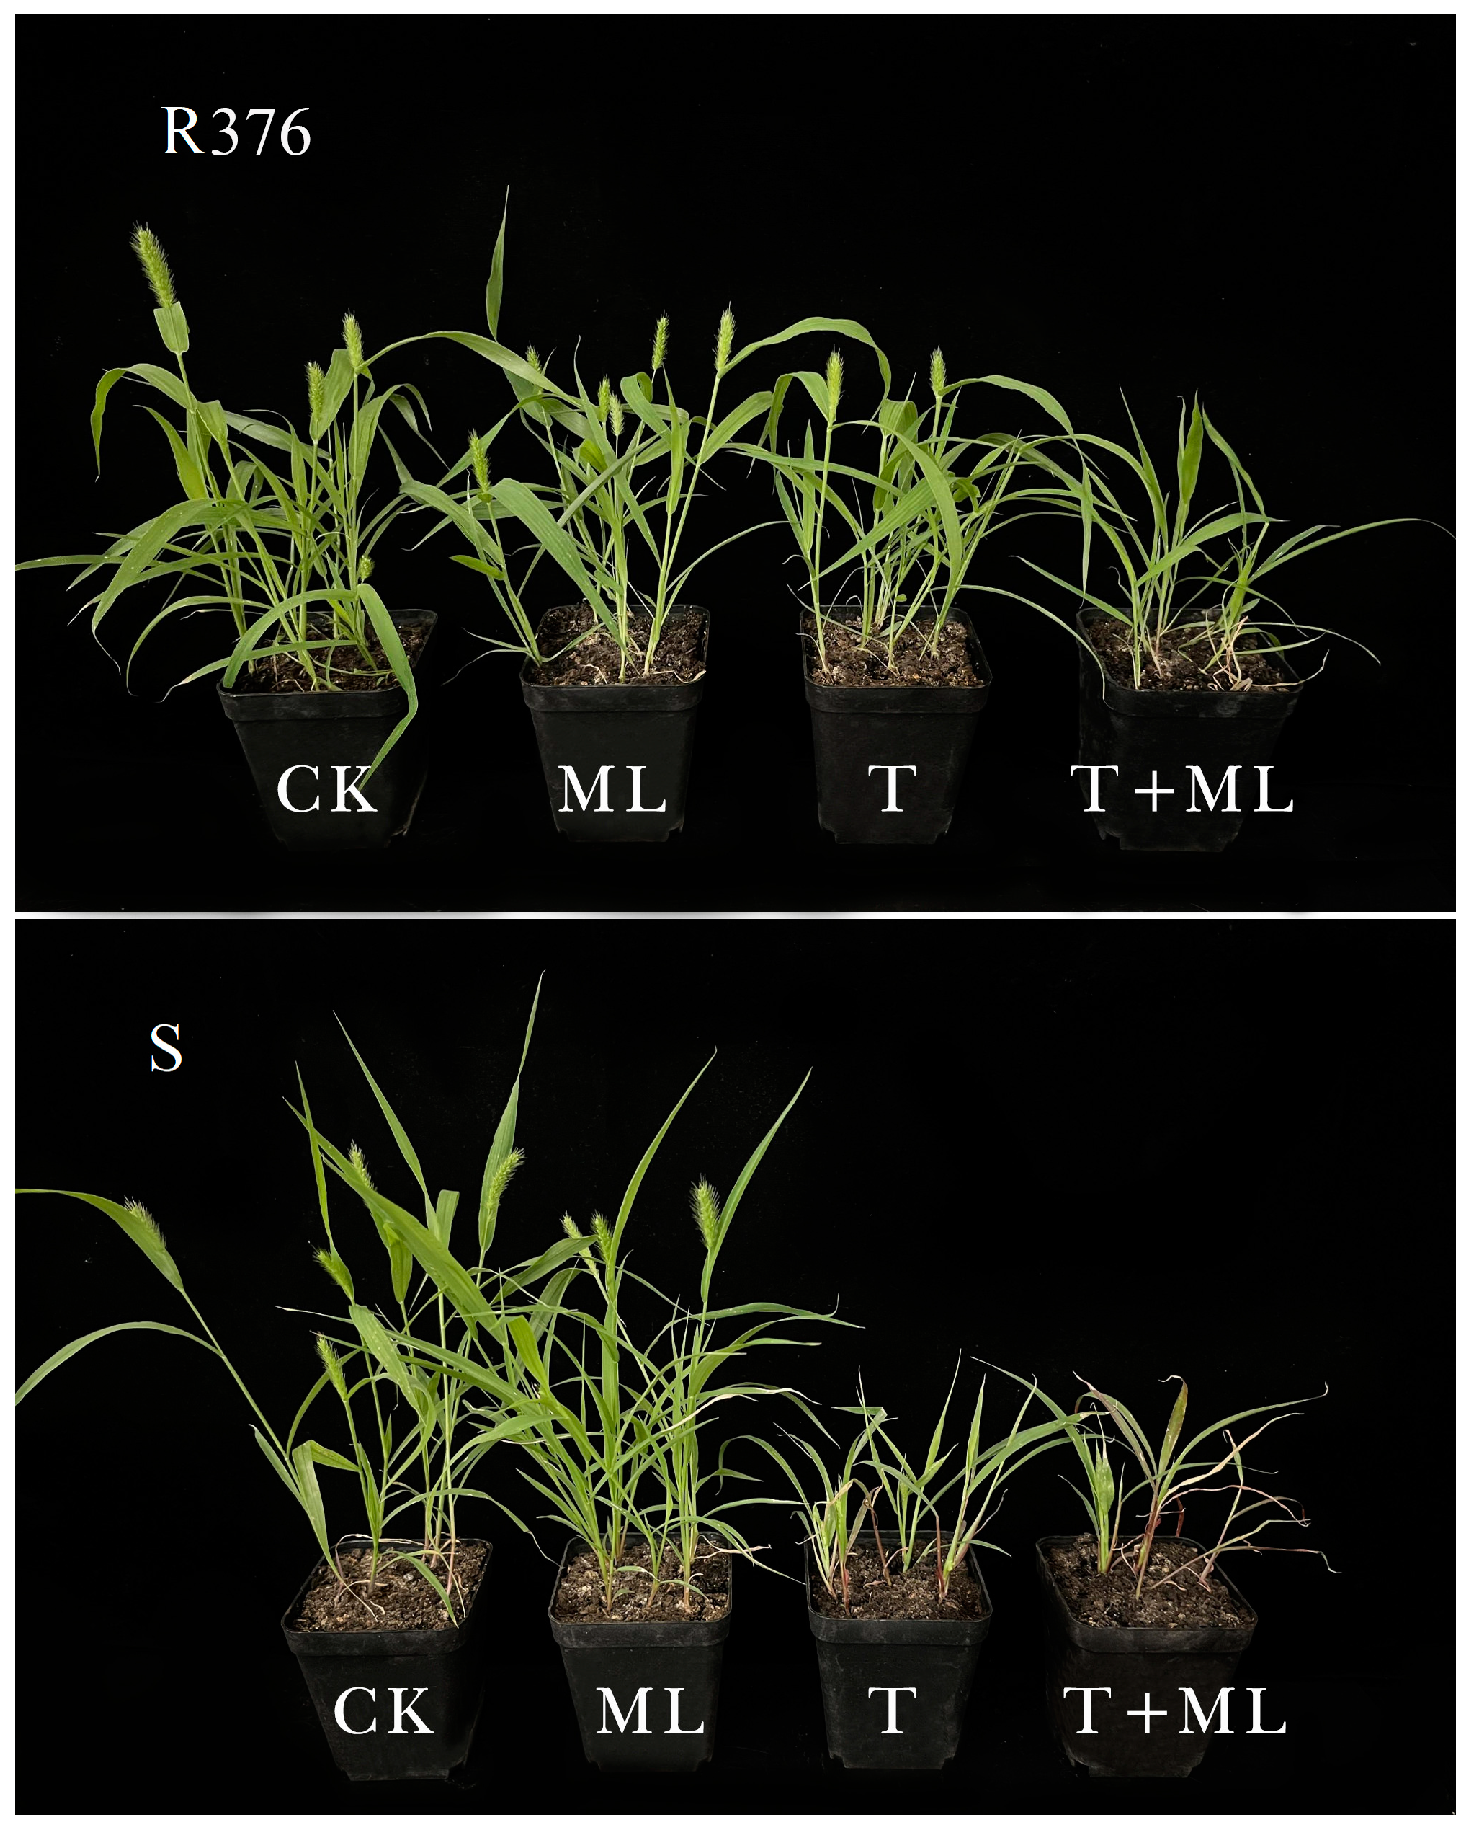
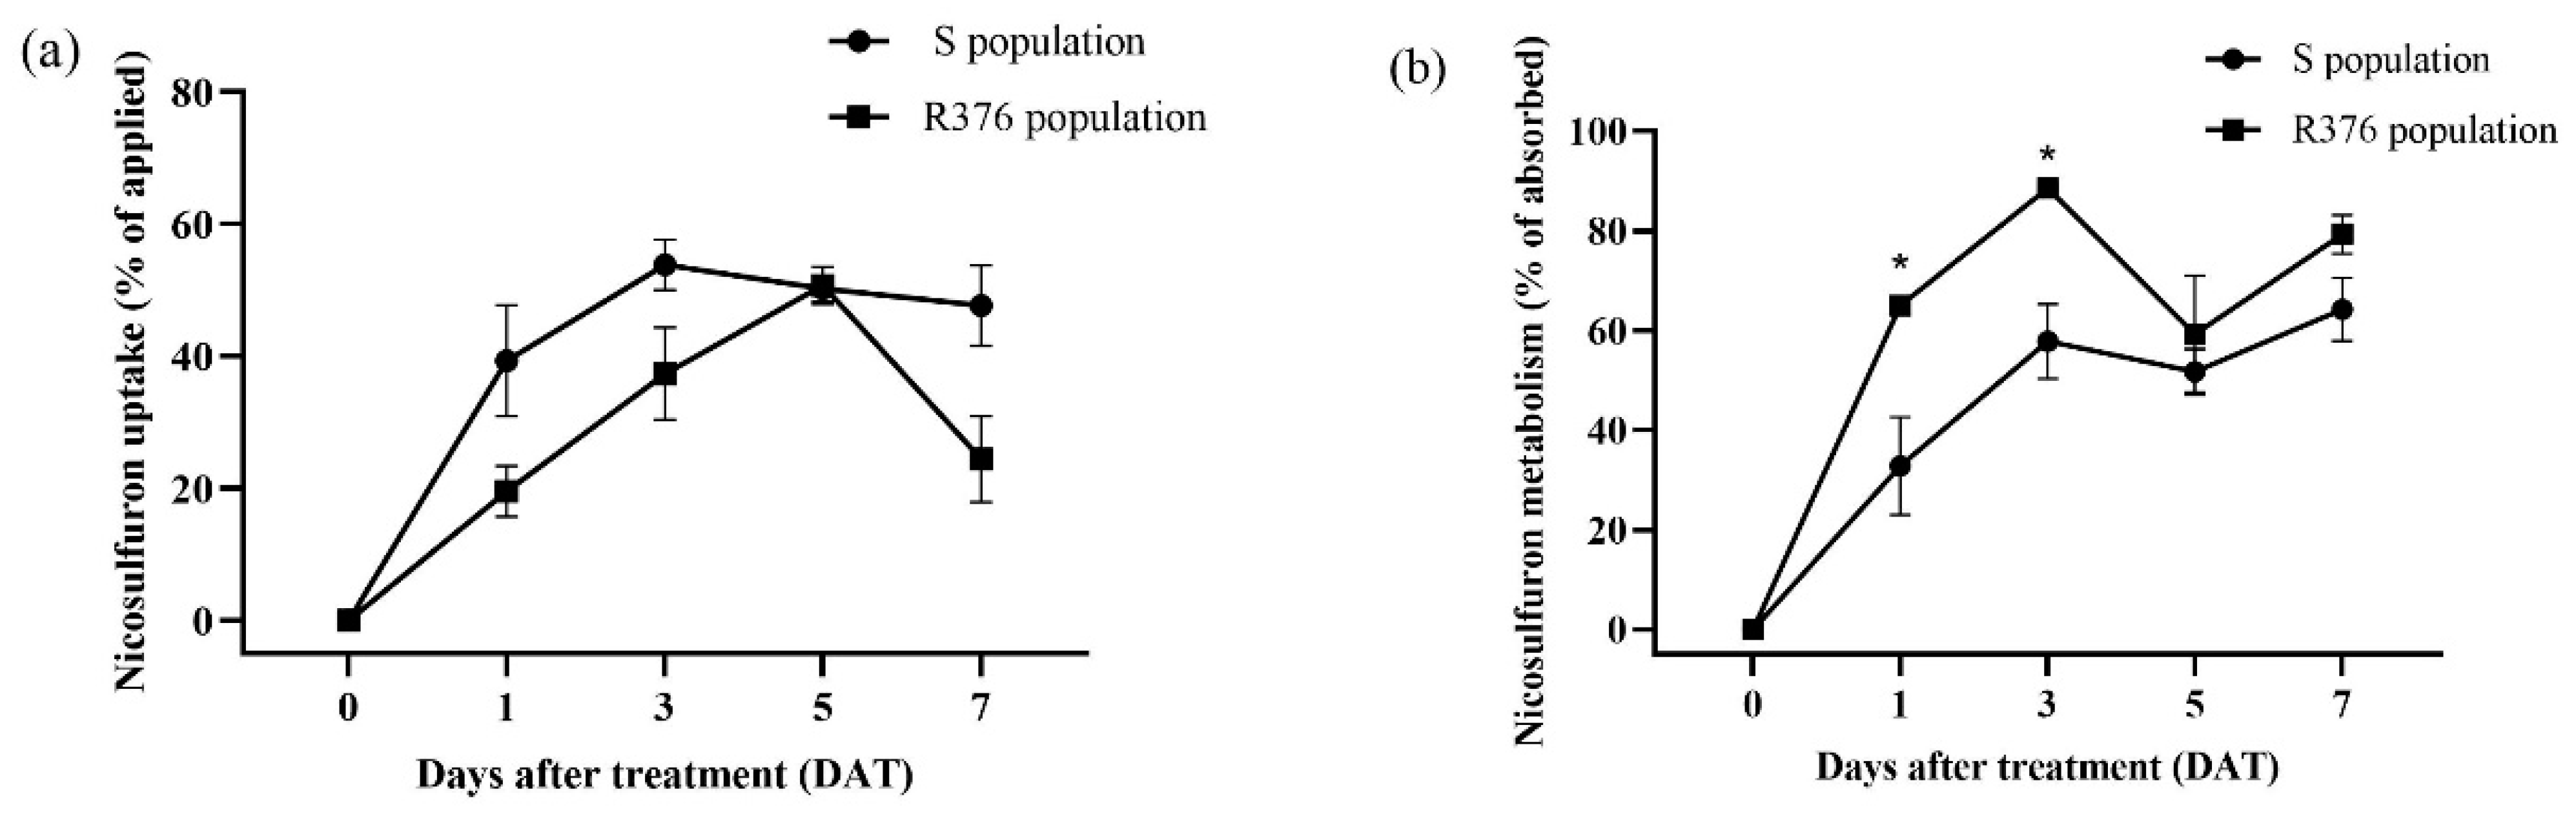
17]. In our study, the increased susceptibility to nicosulfuron in the R376 population after malathion pre-treatment suggested possible metabolism-based resistance in R376. To obtain more direct evidence of metabolic resistance to nicosulfuron in R376, differences in the metabolism of nicosulfuron in the S and R376 populations were analysed by HPLC-MS, and the results showed that the R376 population metabolized nicosulfuron more strongly than the S population. These results support the hypothesis that metabolic resistance played a crucial role in nicosulfuron resistance in the R376 population.
The RNA-Seq transcriptome analysis has been used to study metabolic herbicide resistance in weeds for gene discovery. Increased activity of endogenous P450s, GTs, GSTs, and/or other enzyme systems confers the ability to metabolize herbicides [
28]. In our study, a total of four P450 genes, two GST genes, three ABC transferases, and two UGT were significantly upregulated in the R376 population compared with the S population.
The P450 genes can metabolize herbicides through alkyl-hydroxylation, N-demethylation, O-demethylation, and aryl-hydroxylation. More than 30 P450 genes have been reported to metabolize herbicides, 11 of which can metabolize ALS-inhibiting herbicides. Among plant families, Poaceae has the largest number of herbicide metabolism-related genes reported [
29]. The CYP81A12 and CYP81A21 proteins metabolize bensulfuron-methyl through O-demethylation and confer resistance to two classes of ALS-inhibiting herbicides in
Echinochloa phyllopogon (Stapf) Koss (Poaceae: Panicaceae) [
15]. Upregulation of
CYP709C56 in
Alopecurus equalis Sobol. (Poales: Poaceae) detoxifies metsulfuron-methyl to an O-demethylated metabolite, thereby conferring resistance [
30]. In the present study,
C76C2,
C81Q32,
CYOS, and
C78A5 were identified, but their specific role in metabolic resistance to nicosulfuron requires further investigation. The GSTs are multifunctional enzymes involved in the normal metabolism of endogenous substrates and phase II metabolic detoxification of exogenous substances, which play an important role in defending against pathogens [
31,
32]. In our study,
GST3 and
GSTU6 were identified as candidate genes. It has been shown that high-level expression of
GSTT3 and
GSTU6 can confer resistance to fenoxaprop-P-ethyl and mesosulfuron-methyl in
Beckmannia sizigachne (Steud.) Fernald (Poales: Poaceae) [
33].
By compartmentalizing herbicides and their metabolites, ABC transporters give herbicide resistance in contrast to the P450 and GST gene families; this procedure is comparable to phase III detoxification [
11]. Glyphosate resistance may be conferred when tonoplast or PM ABC transporters can transfer the herbicide out of the cytoplasm [
34]. The expression of
AB2E,
ABC15, and
ABC15-2 was increased in the R376 population compared with the S population. In addition to being involved in the detoxification process, the ABC transporters also play an important role in the growth and development of the plant, for example, in chlorophyll biosynthesis, the formation of Fe/S clusters, stomatal movement, and probably ion flux [
35,
36]. Further research is required to fully describe the functional characterization of the candidate genes identified in this study.
In plants, UGT can glycosylate phytohormones, secondary metabolites involved in stress and defense responses, and xenobiotics such as herbicides, altering their properties [
37]. A lower
UGT13248 expression was detected in the S population before and after nicosulfuron treatment in contrast with the R376 population. In the control group, the expression level of
UGT73C3 was significantly higher in R376 than in the S population. Further experiments are needed to investigate whether
UGT13248 and
UGT73C3 can glycosylate nicosulfuron.
4. Materials and Methods
4.1. Plant Materials and Growth Conditions
The putative-resistant S. viridis population was collected randomly from maize fields in Jilin Province in China, where nicosulfuron had been continuously applied for more than 10 years. The susceptible S. viridis population (S) was obtained from non-cultivated areas (Tongyu, China). The seeds of each population were harvested from more than thirty plants.
After cleansing with water, S. viridis seeds were submerged in an 800 mg L−1 solution of gibberellin (GA3) for 24 h. The germinated seeds, twenty seeds per pot, were evenly planted in plastic pots with an 11-cm diameter, and they were nurtured in a greenhouse (day and night, 30/22 °C, 14 h/10 h photoperiod). The seedlings were thinned to 10 plants per pot at the 2-leaf stage, watered every two days, and fertilized weekly. The S. viridis seedlings can be used for experiments at the 3–4 leaf stage.
4.2. Sequencing of the ALS Gene
Leaves from the R376 population that survived nicosulfuron (60 g a.i. ha
−1) treatment and S population that untreated were harvested. Leaves of ten plants were collected from each population of the untreated S and R376, and genomic DNA was extracted by the DANsecure Plant Kit
® (Tiangen Biotechnology Co., Ltd., Beijing, China). Then a partial
ALS gene containing all eight known site mutations was amplified according to Huang et al. [
5]. The PCR products were confirmed on a 1% agarose gel and sequenced by the Beijing Genome Institute (BGI, Beijing, China). Sequence data were aligned and analyzed using Vector NTI 12.5 (Invitrogen Corporation, Carlsbad, CA, USA).
4.3. Effect of Malathion on Nicosulfuron Resistance
When S. viridis seedlings were at the 3–4 leaf stage, a whole-plant dose−response assay was conducted to determine resistance to nicosulfuron (40 g L−1 OD, Beijing Green Agricultural Science and Technology Group Co., Ltd., Beijing, China) with or without malathion (70% EC, Dezhou Luba Fine Chemical Co., Ltd., Dezhou, China). Nicosulfuron and malathion were applied using a research track sprayer (3 WP-2000) (Nanjing Institute of Agricultural Mechanization, Ministry of Agriculture and Rural Affairs, China) delivering 450 L ha−1 spray solution. Malathion, a common P450 indicator for metabolic resistance, was applied at 2000 g a.i. ha−1 one hour before nicosulfuron application. Preliminary assays showed that there was a large difference in the sensitivity to nicosulfuron between S and R376 populations, so nicosulfuron was applied at 0, 3.75, 7.5, 15, 30, 60, and 120 g a.i. ha−1 for the S population and at 0, 30, 60, 120, 240, 480, and 960 g a.i. ha−1 for the R376 population. Three weeks after treatment, the aboveground parts of the plants were harvested and the fresh weight was recorded. The experiment was designed as a randomized complete block with three pots in each replicate, and the experiment was repeated twice.
The mean fresh weight for each treatment was expressed as a percentage of the untreated control. The data were subjected to non-linear regression analysis using the following formula to obtain dose–response curves (SigmaPlot, San Jose, CA, USA).
where C is the lower limit, D is the upper limit, and b is the relative slope around the herbicide dose causing a 50% growth reduction (GR
50).
4.4. HPLC-MS/MS Analysis of Nicosulfuron
When S. viridis seedlings were at the 3–4 leaf stage, nicosulfuron (5 μL of 1 mg L−1 nicosulfuron per plant) was added dropwise on leaves using micropipettes. The plants from both the R376 and S populations were randomly selected at 1, 3, 5, and 7 DAT. Plants were washed with 10 mL of acetonitrile and stored at −20 °C. The solution (1 mL) was placed in a vial for absorption analysis.
Samples were ground in liquid nitrogen and placed in 50 mL centrifuge tubes containing 10 mL of 0.1% formic acid in acetonitrile. Then they were vortexed for 5 min and sonicated for 10 min. After centrifugation at 6000 rpm for 10 min, 1.5 mL of the supernatant sample was transferred to a 5 mL centrifuge tube containing 20 mg Graphitized carbon black (GCB) (Agela Technologies, Tianjin, China), 100 mg MgSO4 (Sinopharm Chemical Reagent Co., Ltd., Shanghai, China), and 20 mg ethylenediamine-N-propylsilane (PSA) (Agela Technologies). The 5 mL centrifuge tubes were then vortexed for 1 min and centrifuged at 12,000 rpm for 5 min. An amount of 1 mL of the supernatant passed through a 0.22 µm filter and transferred to a 2 mL autosampler vial for detection. Nicosulfuron was analysed using AB SCIEX QTRAP 5500 HPLC-MS/MS (AB Sciex, Concord, ON, Canada) and the chromatographic column was ACQUITY UPLC C18 column (2.1 mm × 100 mm, 1.7 µm) (Waters Corporation, Milford, MA, USA). The injection volume was 5 μL, and the whole HPLC run used 0.1% formic acid water (A) and acetonitrile (B) as the mobile phase at a flow rate of 0.3 mL/min. The mobile phase gradient decreased from 80% A to 40% A (0–1 min), then decreased to 20% A (1–2.5 min) and returned to 80% A (2.5–3 min). The scanning mode was positive ionization mode, and a mass-to-charge ratio of 182.2 as the quantifying ion. The absorption of nicosulfuron was measured as the total application minus the amount eluted from the plant surface; the metabolism was measured as the absorption minus the residue in the plant. The experiment was performed twice with three replicates for each treatment.
4.5. RNA Extraction, Library Construction, and Sequencing
An RNA-Seq experiment was conducted using the S and R376 populations. The samples included untreated S and R376 plants and S and R376 plants 24 h after treatment with nicosulfuron (the recommended field rate 60 g a.i. ha−1), with three biological replicates. The twelve samples were frozen immediately in liquid nitrogen, and total RNA was extracted using the RNAprep pure Plant Kit (Tiangen Biotech Co., Ltd., Beijing, China). Then, the high-quality RNA samples were transcribed into first-strand cDNA by random hexamer primers and M-MuLV reverse transcriptase. Second-strand cDNA synthesis was performed using DNA Polymerase I and RNase H. The quality of the cDNA library was assessed on the Agilent Bioanalyzer 2100 system and then sequenced on the Illumina HiseqTM 4000 platform (Illumina Inc., San Diego, CA, USA).
4.6. De Novo Transcriptome Assembly and Gene Function Annotation
In the experiment, sequencing data were analysed using the bioinformatics analysis process provided by BMKCloud (
www.biocloud.net (accessed on 20 May 2021)) (BIOMARKER, Beijing, China). Firstly, the raw data were filtered to obtain high-quality clean data. These clean data were then further mapped to a reference genome to generate mapped data. After the quality assessment was qualified, analyses such as gene expression quantification, alternative splicing analysis, new gene prediction, and gene structure optimization were carried out. Quantification of gene expression levels was estimated by fragments per kilobase of transcript per million fragments mapped (FPKM).
4.7. Identification and Analysis of Differentially Expressed Genes
The DESeq2 was used to conduct a differential expression analysis of the two conditions/groups. The DEGs were defined as genes having a DESeq2 adjusted p-value < 0.01. The 12 samples were divided into the following four groups: treated S (ST), treated R376 (RT), untreated S (SC), and untreated R376 (RC). DEGs between RT and ST, RC and SC, RT and RC, and ST and SC were compared. Two points had to be satisfied when selecting candidate NTSR genes. Firstly, there had to be significant differential expressions (|log2(fold change)| > 1 and q (adjusted p-value) ≤ 0.05) between RT vs. ST, RC vs. SC. Secondly, the DEGs had to be involved in herbicide metabolism, such as the P450, GST, GT, and ABC transporters.
4.8. The qPCR Validation
The untreated S and R376 plants and the S and R376 plants 24 h after treatment with nicosulfuron (60 g a.i. ha
−1) were collected for qPCR. Three biological replicates and three technical replicates were performed for each sample. The primers were designed in Primer Premier v.5.0 (Premier Biosoft International, Palo Alto, CA, USA) (
Table 6). The qPCRs were performed at a final volume of 20 µL with the following reagents: 10 μL of 2× PerfectStart
® Green qPCR SuperMix (+DyeI/+DyeΠ) (TransGen Biotech company, Beijing, China), 0.4 μL of forwards primer, 0.4 μL of reverse primer, 1 μL of cDNA, and 8.2 μL of RNase-free ddH
2O. All qPCR amplifications were performed using the following conditions: (1) 30 s at 94 °C for pre-denaturation; (2) 40 cycles of amplification (5 s at 94 °C for denaturation, 35 s at 60 °C for annealing and extension). Three technical replicates were performed for each experiment. All samples were normalized with the reference gene
serine/threonine protein phosphatase 2A (
PP2A) and calculated using the 2
−ΔΔCt method [
38]. Statistical analysis of the qPCR data was conducted using the Student’s
t-test (
p < 0.05) by IBM SPSS Statistics version 24.0 (IBM Company, Chicago, IL, USA) software. The genes that have correlation with transcriptome and have significant differences (
p < 0.05) are the target genes.

 ,
, 

