Article

Defective Mitochondrial Dynamics and Protein Degradation Pathways Underlie Cadmium-Induced Neurotoxicity and Cell Death in Huntington’s Disease Striatal Cells

Neuroscience Department, Oberlin College, 119 Woodland Street, Oberlin, OH 44074, USA
*
Author to whom correspondence should be addressed.
These authors contributed equally to this work.
Int. J. Mol. Sci. 2023, 24(8), 7178; https://doi.org/10.3390/ijms24087178
Submission received: 18 March 2023 / Revised: 31 March 2023 / Accepted: 31 March 2023 / Published: 13 April 2023
(This article belongs to the Section Molecular Toxicology)

Abstract

:
Exposure to heavy metals, including cadmium (Cd), can induce neurotoxicity and cell death. Cd is abundant in the environment and accumulates in the striatum, the primary brain region selectively affected by Huntington’s disease (HD). We have previously reported that mutant huntingtin protein (mHTT) combined with chronic Cd exposure induces oxidative stress and promotes metal dyshomeostasis, resulting in cell death in a striatal cell model of HD. To understand the effect of acute Cd exposure on mitochondrial health and protein degradation pathways, we hypothesized that expression of mHTT coupled with acute Cd exposure would cooperatively alter mitochondrial bioenergetics and protein degradation mechanisms in striatal STHdh cells to reveal novel pathways that augment Cd cytotoxicity and HD pathogenicity. We report that mHTT cells are significantly more susceptible to acute Cd-induced cell death as early as 6 h after 40 µM CdCl2 exposure compared with wild-type (WT). Confocal microscopy, biochemical assays, and immunoblotting analysis revealed that mHTT and acute Cd exposure synergistically impair mitochondrial bioenergetics by reducing mitochondrial potential and cellular ATP levels and down-regulating the essential pro-fusion proteins MFN1 and MFN2. These pathogenic effects triggered cell death. Furthermore, Cd exposure increases the expression of autophagic markers, such as p62, LC3, and ATG5, and reduces the activity of the ubiquitin–proteasome system to promote neurodegeneration in HD striatal cells. Overall, these results reveal a novel mechanism to further establish Cd as a pathogenic neuromodulator in striatal HD cells via Cd-triggered neurotoxicity and cell death mediated by an impairment in mitochondrial bioenergetics and autophagy with subsequent alteration in protein degradation pathways.

1. Introduction

Huntington’s disease (HD) is a fatal neurodegenerative disorder characterized by neuropsychiatric dysfunction, cognitive impairment, and motor incoordination [1]. HD is caused by an expansion in the CAG trinucleotide repeat encoding glutamine within exon 1 of the Huntingtin (HTT) gene [2,3]. Wild-type HTT is required for embryonic development [4], transcriptional regulation [5], axonal trafficking [6], metal transport and function [7], synaptic transmission [8], and cellular metabolism [9]. Healthy individuals express six to thirty-six CAG repeats; however, HD patients present with greater than thirty-six polyglutamine repeats [10]. Expanded mHTT induces protein misfolding and aggregation resulting in the selective loss of GABAergic medium spiny neurons (MSNs) within the striatum. The striatum is involved in voluntary movement and decision [11]. Although the pathogenic mechanisms underlying HD remain to be fully elucidated, metal dyshomeostasis, transcriptional dysregulation, and mitochondrial dysfunction are central to HD pathogenesis [12,13,14,15,16,17]
Under non-pathogenic conditions, mitochondria maintain a dynamic balance between fission and fusion events to create tubular networks for efficient energy production and distribution [18,19]. mHTT can also promote oxidative stress that disrupts the mitochondrial balance by over-expressing the pro-fission dynamin-related protein 1 (DRP1) and down-regulating pro-fusion proteins, such as mitofusin 1/2 (MFN1/2) and optic atrophy-1 (OPA1) [20]. Increasing expression of fission proteins leads to a shift toward mitochondrial fission resulting in the fragmentation of the mitochondrial networks needed to provide the metabolic requirements of neurons [21,22]. Eukaryotic cells employ two major degradation routes for clearing misfolded proteins and damaged organelles: (1) the ubiquitin–proteasome system (UPS) or (2) the autophagy–lysosome pathway [23,24]. The UPS functions in the cytoplasm and nucleus to facilitate the recycling and degradation of short-lived and misfolded soluble proteins [25]. In contrast, the autophagy–lysosome pathway degrades long-lived proteins and organelles by the formation of double-membrane-bound autophagosomes in the cytoplasm [26,27]. Alteration in either or both pathways contribute to HD pathogenesis [28,29,30,31]. Importantly, mHTT impedes the cellular response to mitochondrial damage by inhibiting the autophagy–lysosome pathways [32], thereby contributing to the accumulation of dysfunctional mitochondrial fragments and the activation of cell death pathways [33].
Despite the genetic etiology of HD, there is accumulating evidence to indicate that environmental factors heavily influence the rate and severity of HD pathogenesis [12,15,34,35,36,37]. A previous study reported that approximately 60% of the variability in the age of onset in the Venezuelan-kindred population was influenced by unknown environmental factors [38]. Additionally, twin studies have reinforced the critical role of an individual’s environment on the severity and progression of HD [39,40,41]. Among the factors influencing HD pathogenesis, metal dyshomeostasis exacerbates HD pathology within in vitro and in vivo models as well as in HD patients [13,42,43,44]. Although metals, such as manganese (Mn), zinc (Zn), iron (Fe), and copper (Cu), are essential to biological function as co-factors [45], their imbalance may induce oxidative stress, cytotoxicity, and neurodegeneration [46]. For example, overexposure to Mn results in Manganism, a Parkinson’s disease (PD)-like neurological disorder [47]. Expression of mHTT alters Mn, Fe, and Cu homeostasis, resulting in its accumulation in the basal ganglia, transcriptional deregulation, oxidative stress, protein aggregation, and neurotoxicity [14,15,48,49]. One heavy metal of increasing concern due to its environmental abundance is cadmium (Cd) [50].
Cd is a ubiquitous heavy metal found in sewage, phosphate fertilizers, nickel–cadmium (NiCd) batteries, plated metal, plastics, and pigments [51]. It is enriched in the tobacco plant [52], and, upon overexposure, Cd can accumulate within the blood, kidneys, liver, reproductive organs, and motor control centers of the brain, specifically the parietal cortex, striatum, and cerebellum [53,54,55]. The long biological half-life of Cd (15–20 years) allows Cd to accumulate and induce metal dyshomeostasis, oxidative stress, mitochondrial dysfunction, and perturb protein degradation pathways, resulting in neurodegeneration [55,56]. Although Cd exposure primarily occurs occupationally, the tobacco plant has been shown to enrich Cd in its leaves. Tobacco smokers have four to five times higher Cd levels compared with non-smokers [57]. Interestingly, the HD population has a higher rate of tobacco smoking than age-matched non-smoker controls [58]. Given the overlap in pathogenic mechanisms between Cd and mHTT, overexposure to Cd may negatively impact the rate of HD pathogenesis. We have previously demonstrated that striatal cells expressing mHTT exhibit greater sensitivity to chronic Cd-induced neurotoxicity compared with healthy wild type (WT) cells, ultimately leading to caspase-mediated cell death via inhibition of extracellular-regulated kinase (ERK), down-regulation of antioxidants, and NADPH oxidase (NOX)-mediated oxidative stress [13].
Recognizing the vital role of mitochondrial function in health and early in HD pathogenesis [59] and the accumulation of Cd in the basal ganglia region [54,60], we examined the effects of acute Cd exposure on mitochondrial bioenergetics, turnover, function and its connection with protein degradation pathways using an established striatal murine cell line STHdh model of HD. We hypothesize that acute exposure to Cd will aggravate mHTT-induced mitochondrial dysfunction by impairing its respiratory ability and dynamics and disrupting protein degradation machinery.

2. Results

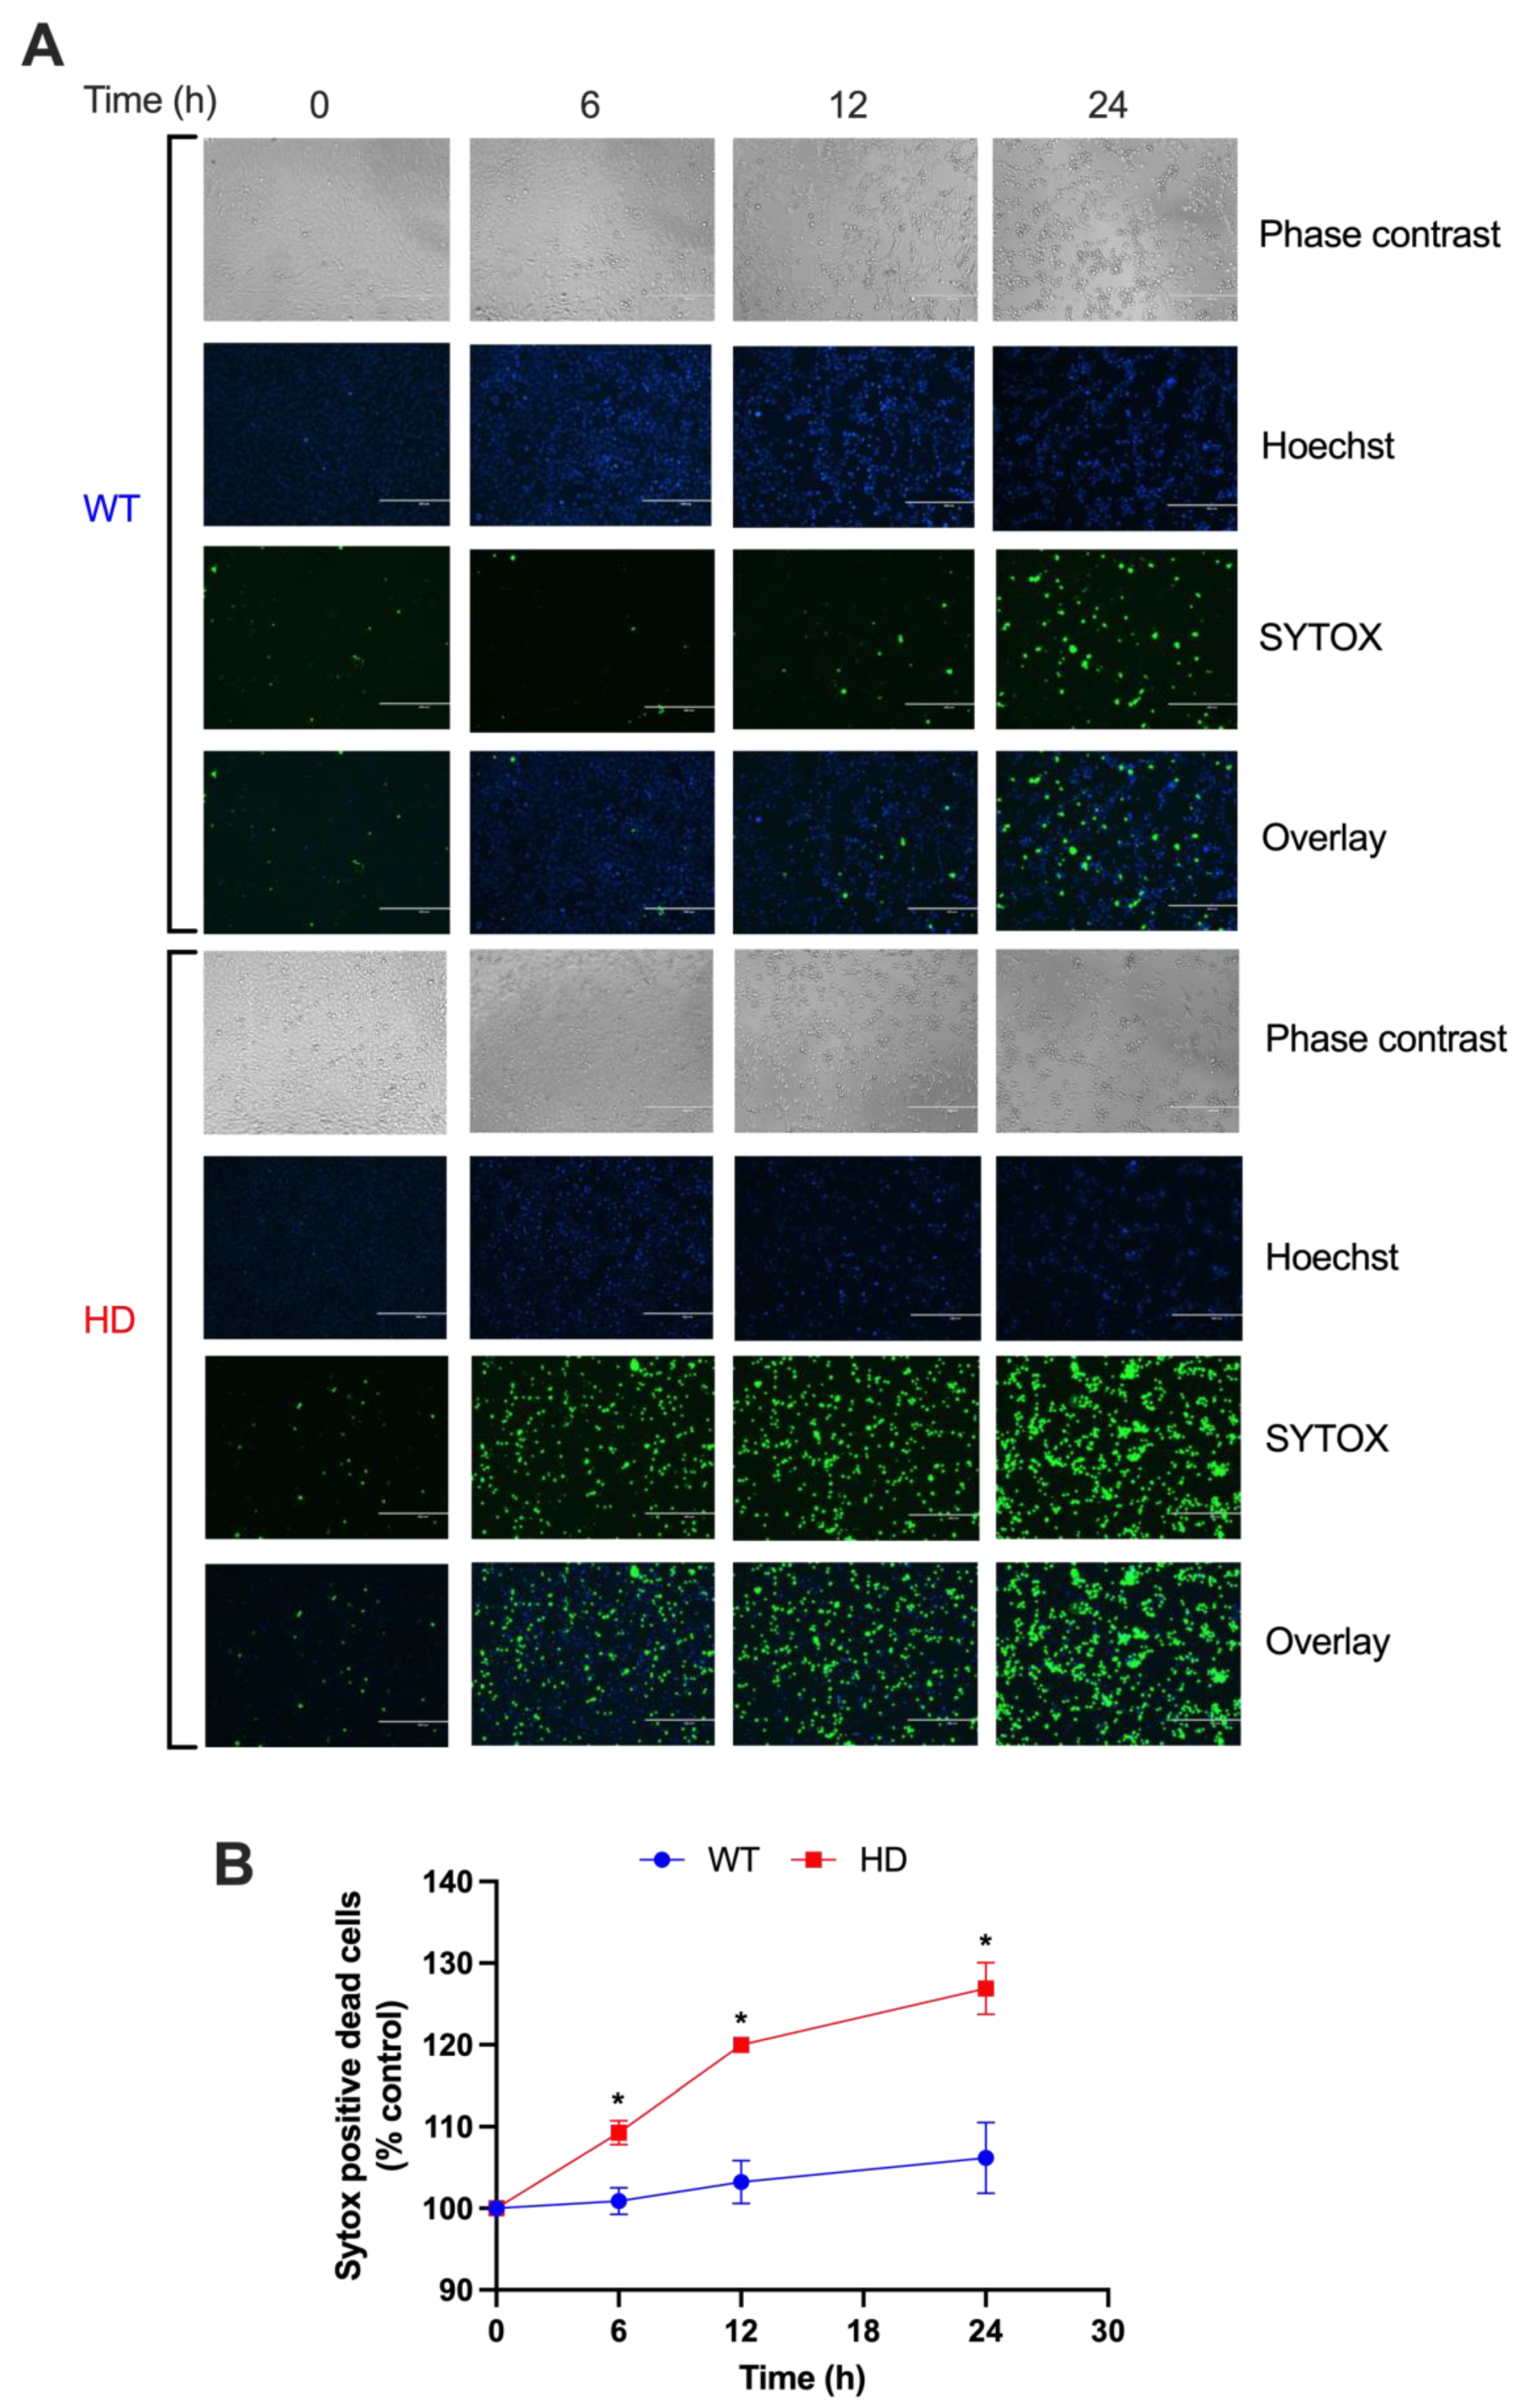
2.1. HD Cells Are More Sensitive to Early Cd-Induced Neurotoxicity and Exhibit Greater Cell Death

We have previously reported that exposure to low concentrations of CdCl2 (5, 10, 20, and 40 µM) for 48 h significantly increases cytotoxicity in HD striatal cells compared with WT [13]. Given this long duration of exposure, which mimics chronic Cd exposure, we aimed to examine the effects of acute Cd exposure at earlier time points. We chose 40 µM CdCl2 and the exposure times between 6 and 24 h to better understand the non-pathogenic and pathogenic effects of Cd in HD. A SYTOX Green cell death assay shows that HD cells exhibit a significant increase in cell death as early as 6 h exposure when compared with their respective vehicle controls or WT cells at the indicated time points, with minimal to no significant increase in cell death within WT cells when compared to its respective vehicle control (Figure 1A,B). A two-way ANOVA reveals a significant effect of exposure time (h) (F(3, 18) = 22.92, p < 0.001), genotype (F(1, 6) = 39.81, p < 0.001), and exposure time by genotype interaction (F(3, 18) = 9.23, p < 0.001), suggesting that each genotype has a unique response to Cd exposure that is dependent on the duration of exposure. Importantly, we observe a significant increase in cell death in the HD cells at 12 h and 24 h above the respective vehicle control.

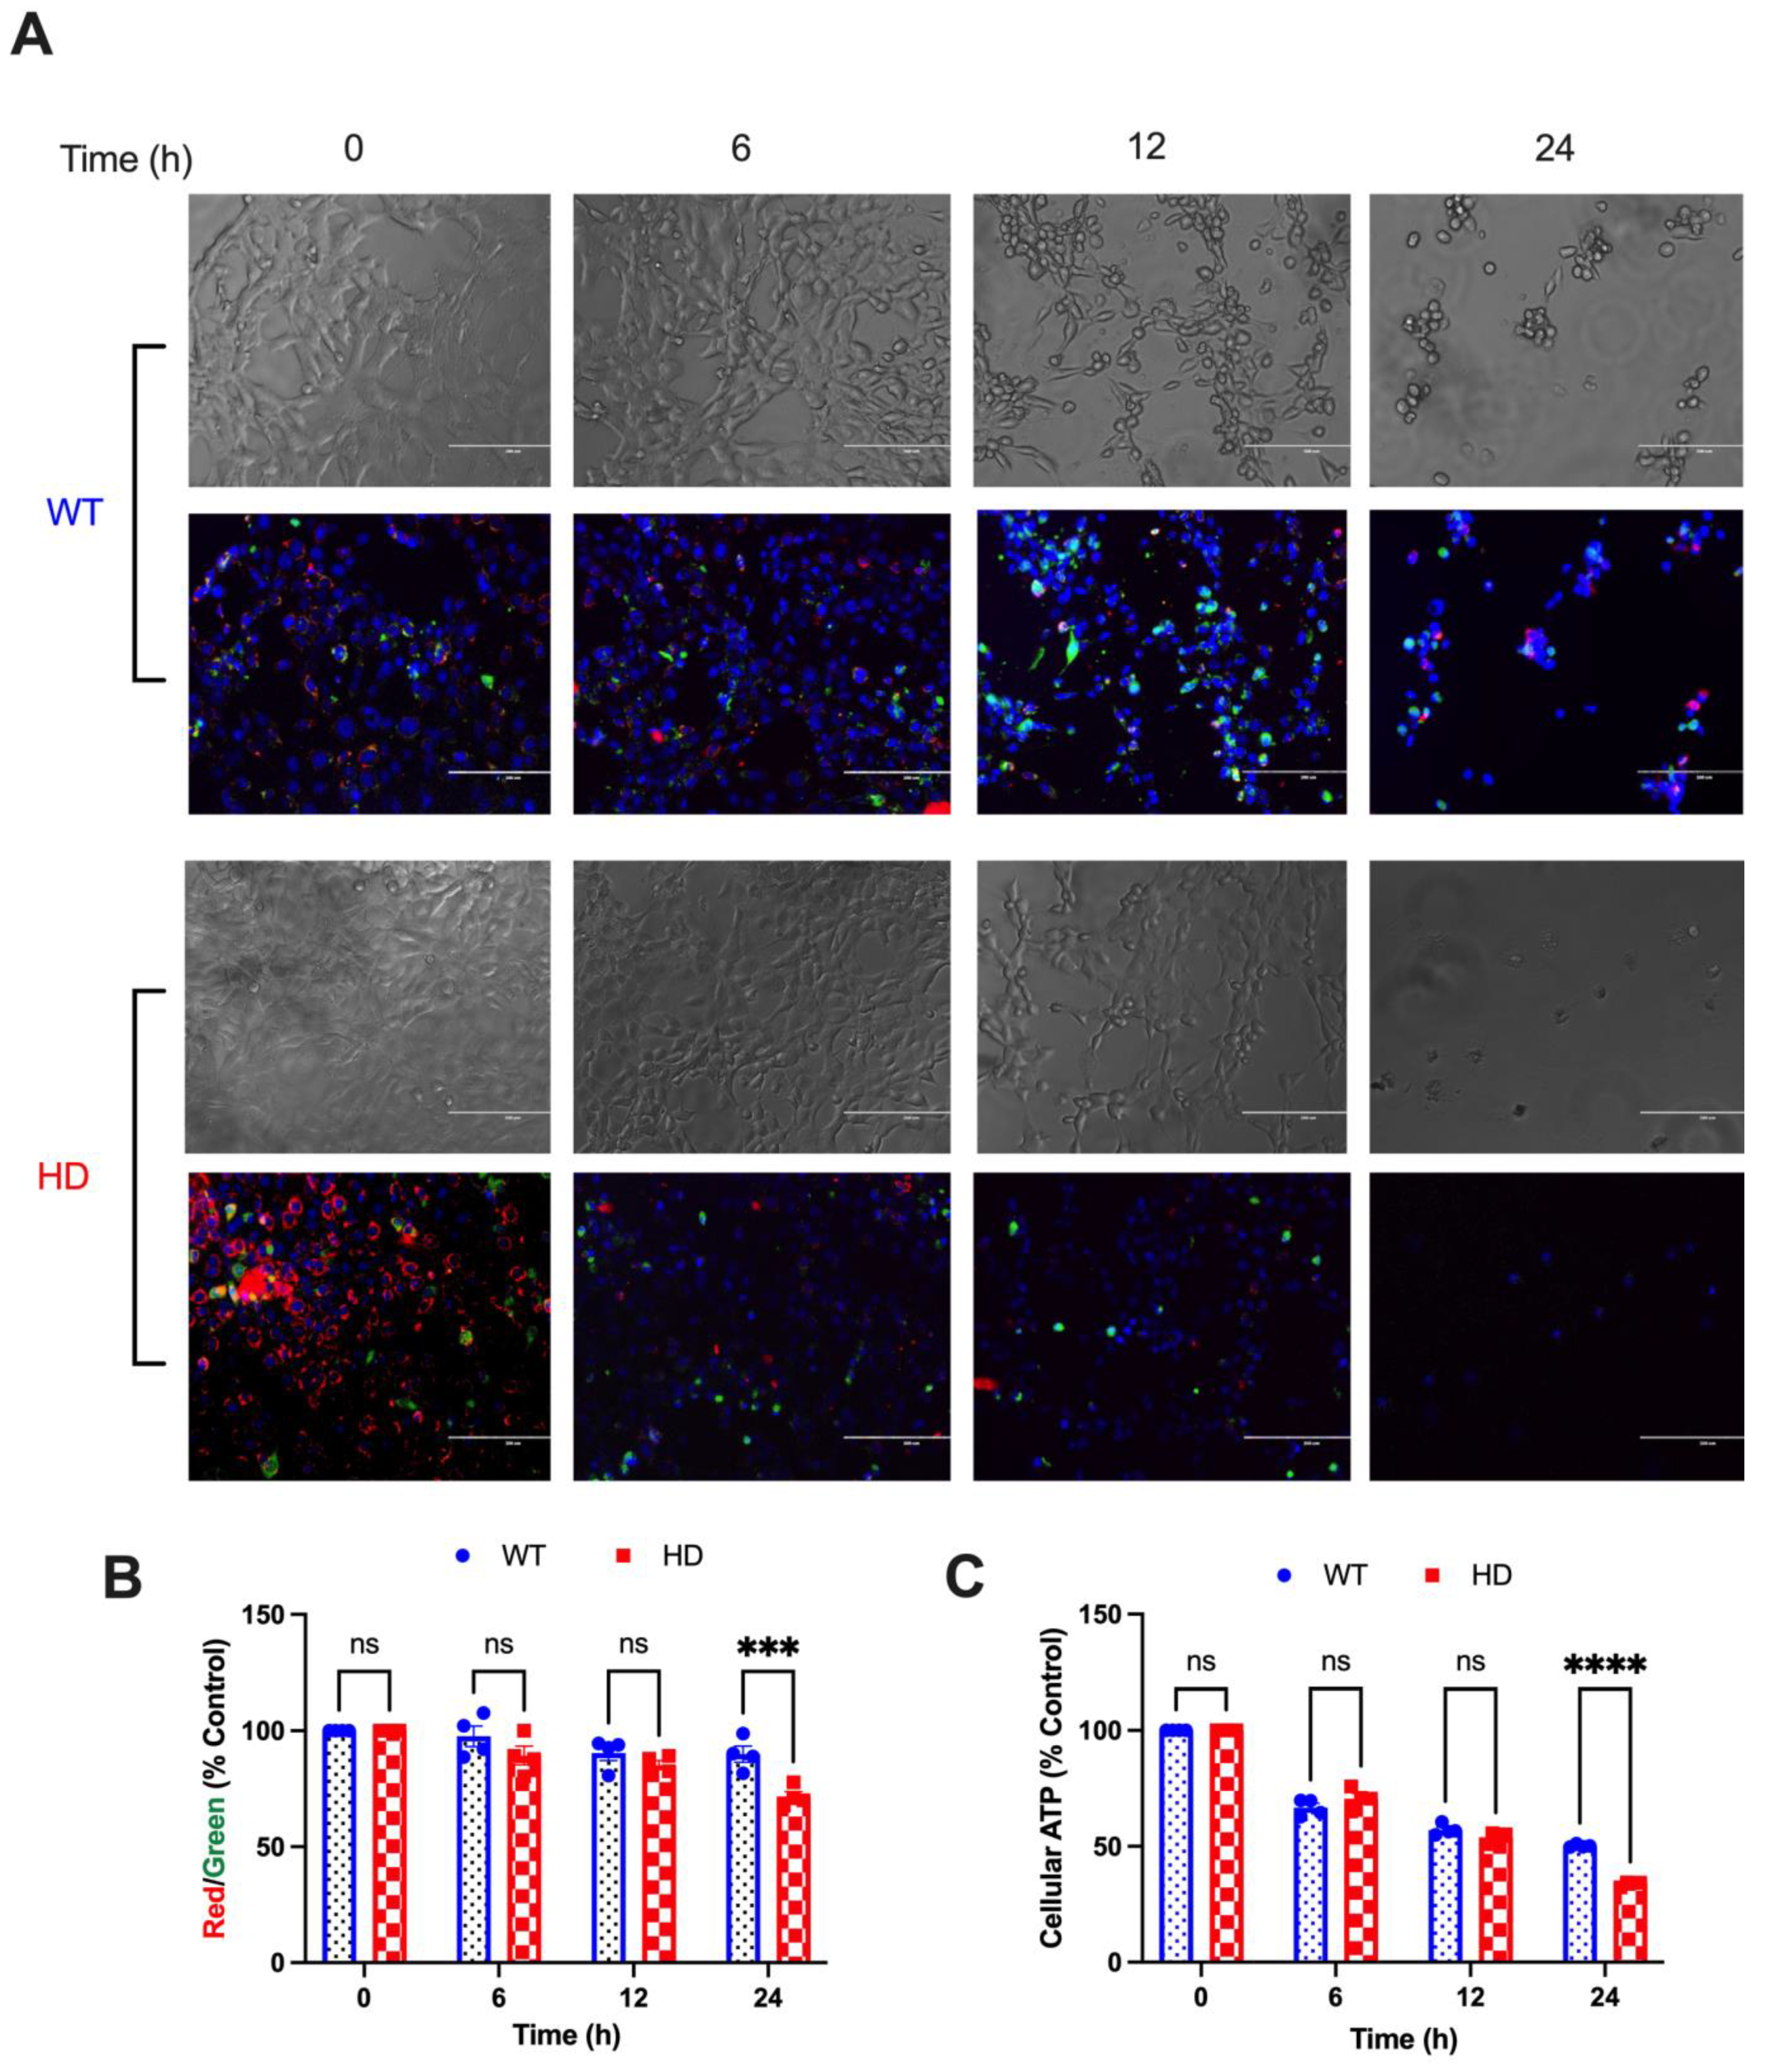
2.2. HD Cells Are More Susceptible to Cd-Induced Mitochondrial Dysfunction Compared with WT

The JC-1 assay was used to evaluate changes in MMP in WT and HD cells after 40 µM CdCl2 exposure. The ratio of red J-aggregates to green monomers is a measure of mitochondrial membrane potential (MMP). Qualitative analysis reveals an early non-significant reduction in MMP at 6 h in HD cells compared with WT, as depicted by a reduction in red aggregates compared with green monomers (Figure 2A). Quantitative analysis of the ratio of red J-aggregates to green monomers shows a gradual trend in MMP reduction in both WT and HD cells upon Cd exposure. Importantly, 24 h Cd exposure causes a significant decrease in MMP in HD cells compared with WT (Figure 2B). Quantitative analysis of MMP supports the time and genotype effect of Cd on MMP. A two-way ANOVA confirms this effect by revealing a significant effect of genotype (F(3, 18) = 22.57, p < 0.001), exposure time (F(1, 6) = 7.908, p = 0.0307), and exposure time by genotype interaction (F(3, 18) = 4.975, p = 0.0109).

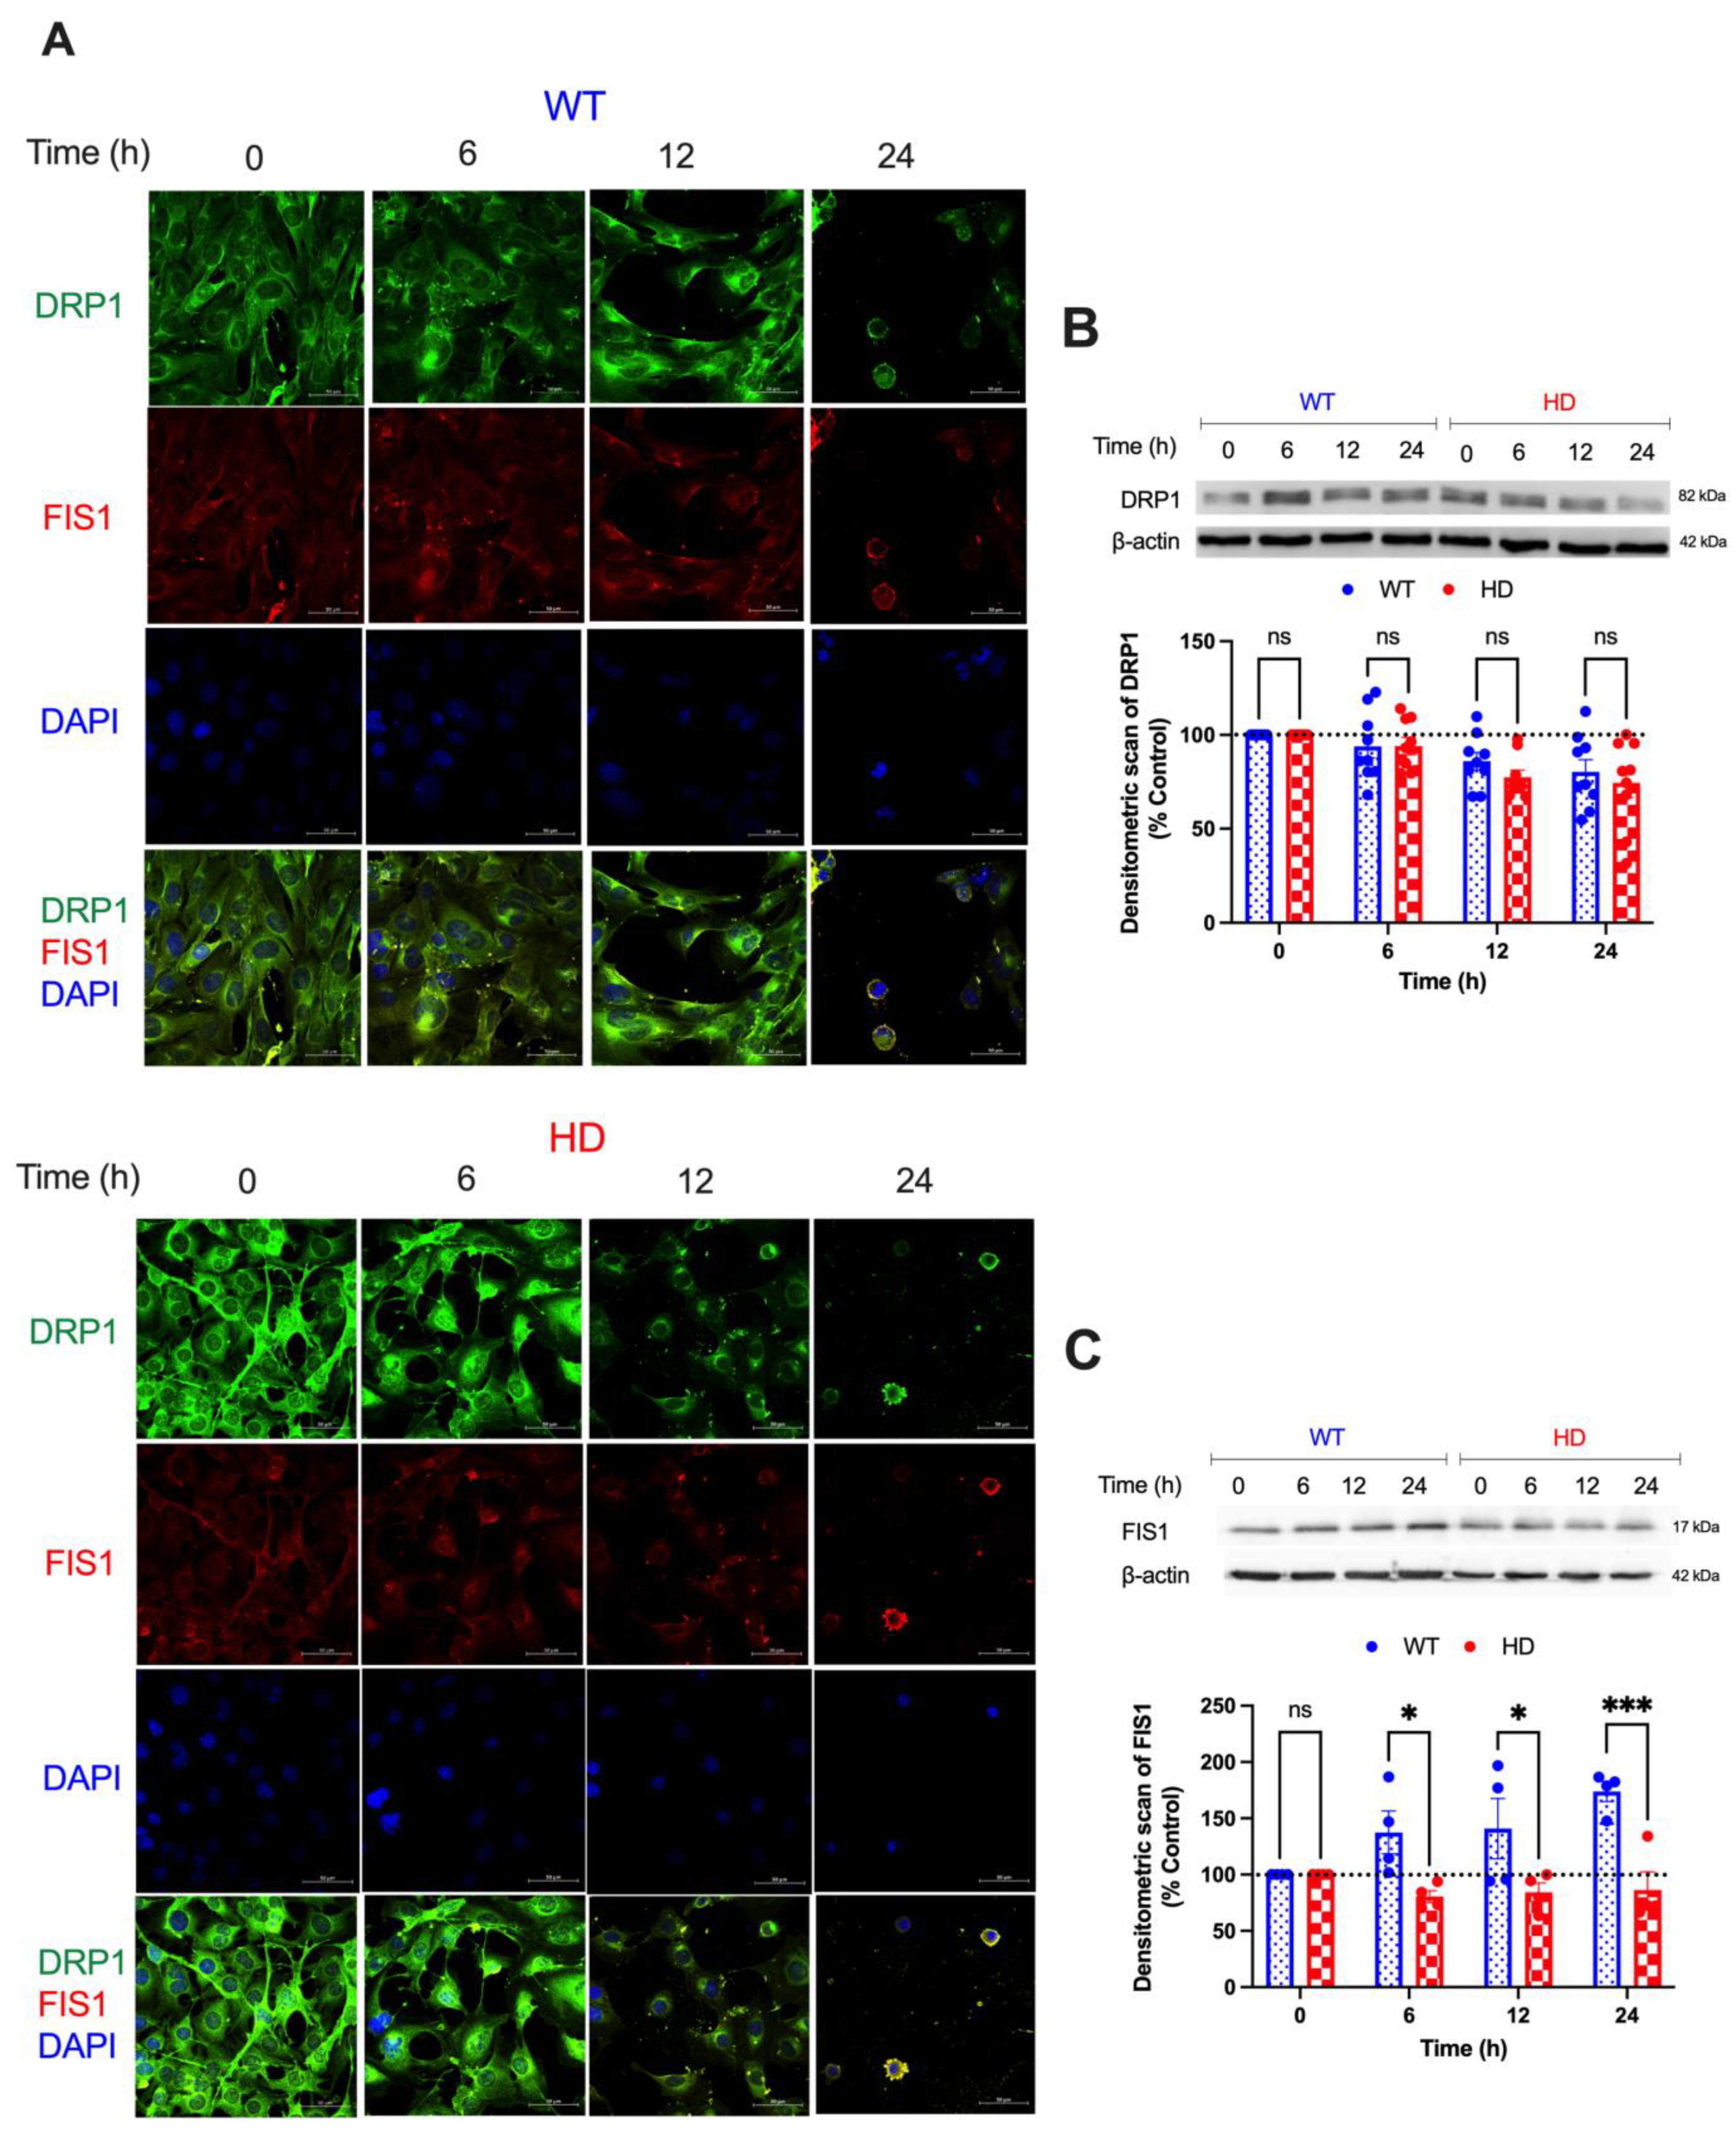
2.3. HD Promotes Cd-Induced Alterations in Mitochondrial Fission Proteins

To better understand the overall changes in mitochondrial dynamics and function following Cd exposure, we examined the expression of key endogenous proteins that facilitate mitochondrial fission (DRP1 and FIS1) and fusion (MFN1 and MFN2) after 0, 6, 12, and 24 h of Cd exposure. A two-way ANOVA of DRP1 expression reveals a significant effect of exposure time (h) (F(3, 48) = 9.387, p < 0.001) and no effect of genotype or genotype by time interaction (Figure 3A,B). Subsequently, we examined the effects of Cd on FIS1 expression, given the role of FIS1 as the adaptor protein of DRP1. As early as 6 h, we observed a significant increase in FIS1 protein expression in WT cells compared with HD following Cd exposure (Figure 3A,C). A two-way ANOVA shows a significant effect of genotype (F(1, 6) = 12.45, p = 0.0124) and an exposure time by genotype interaction (F(3, 18) = 5.723, p = 0.0062) in FIS1 protein expression.

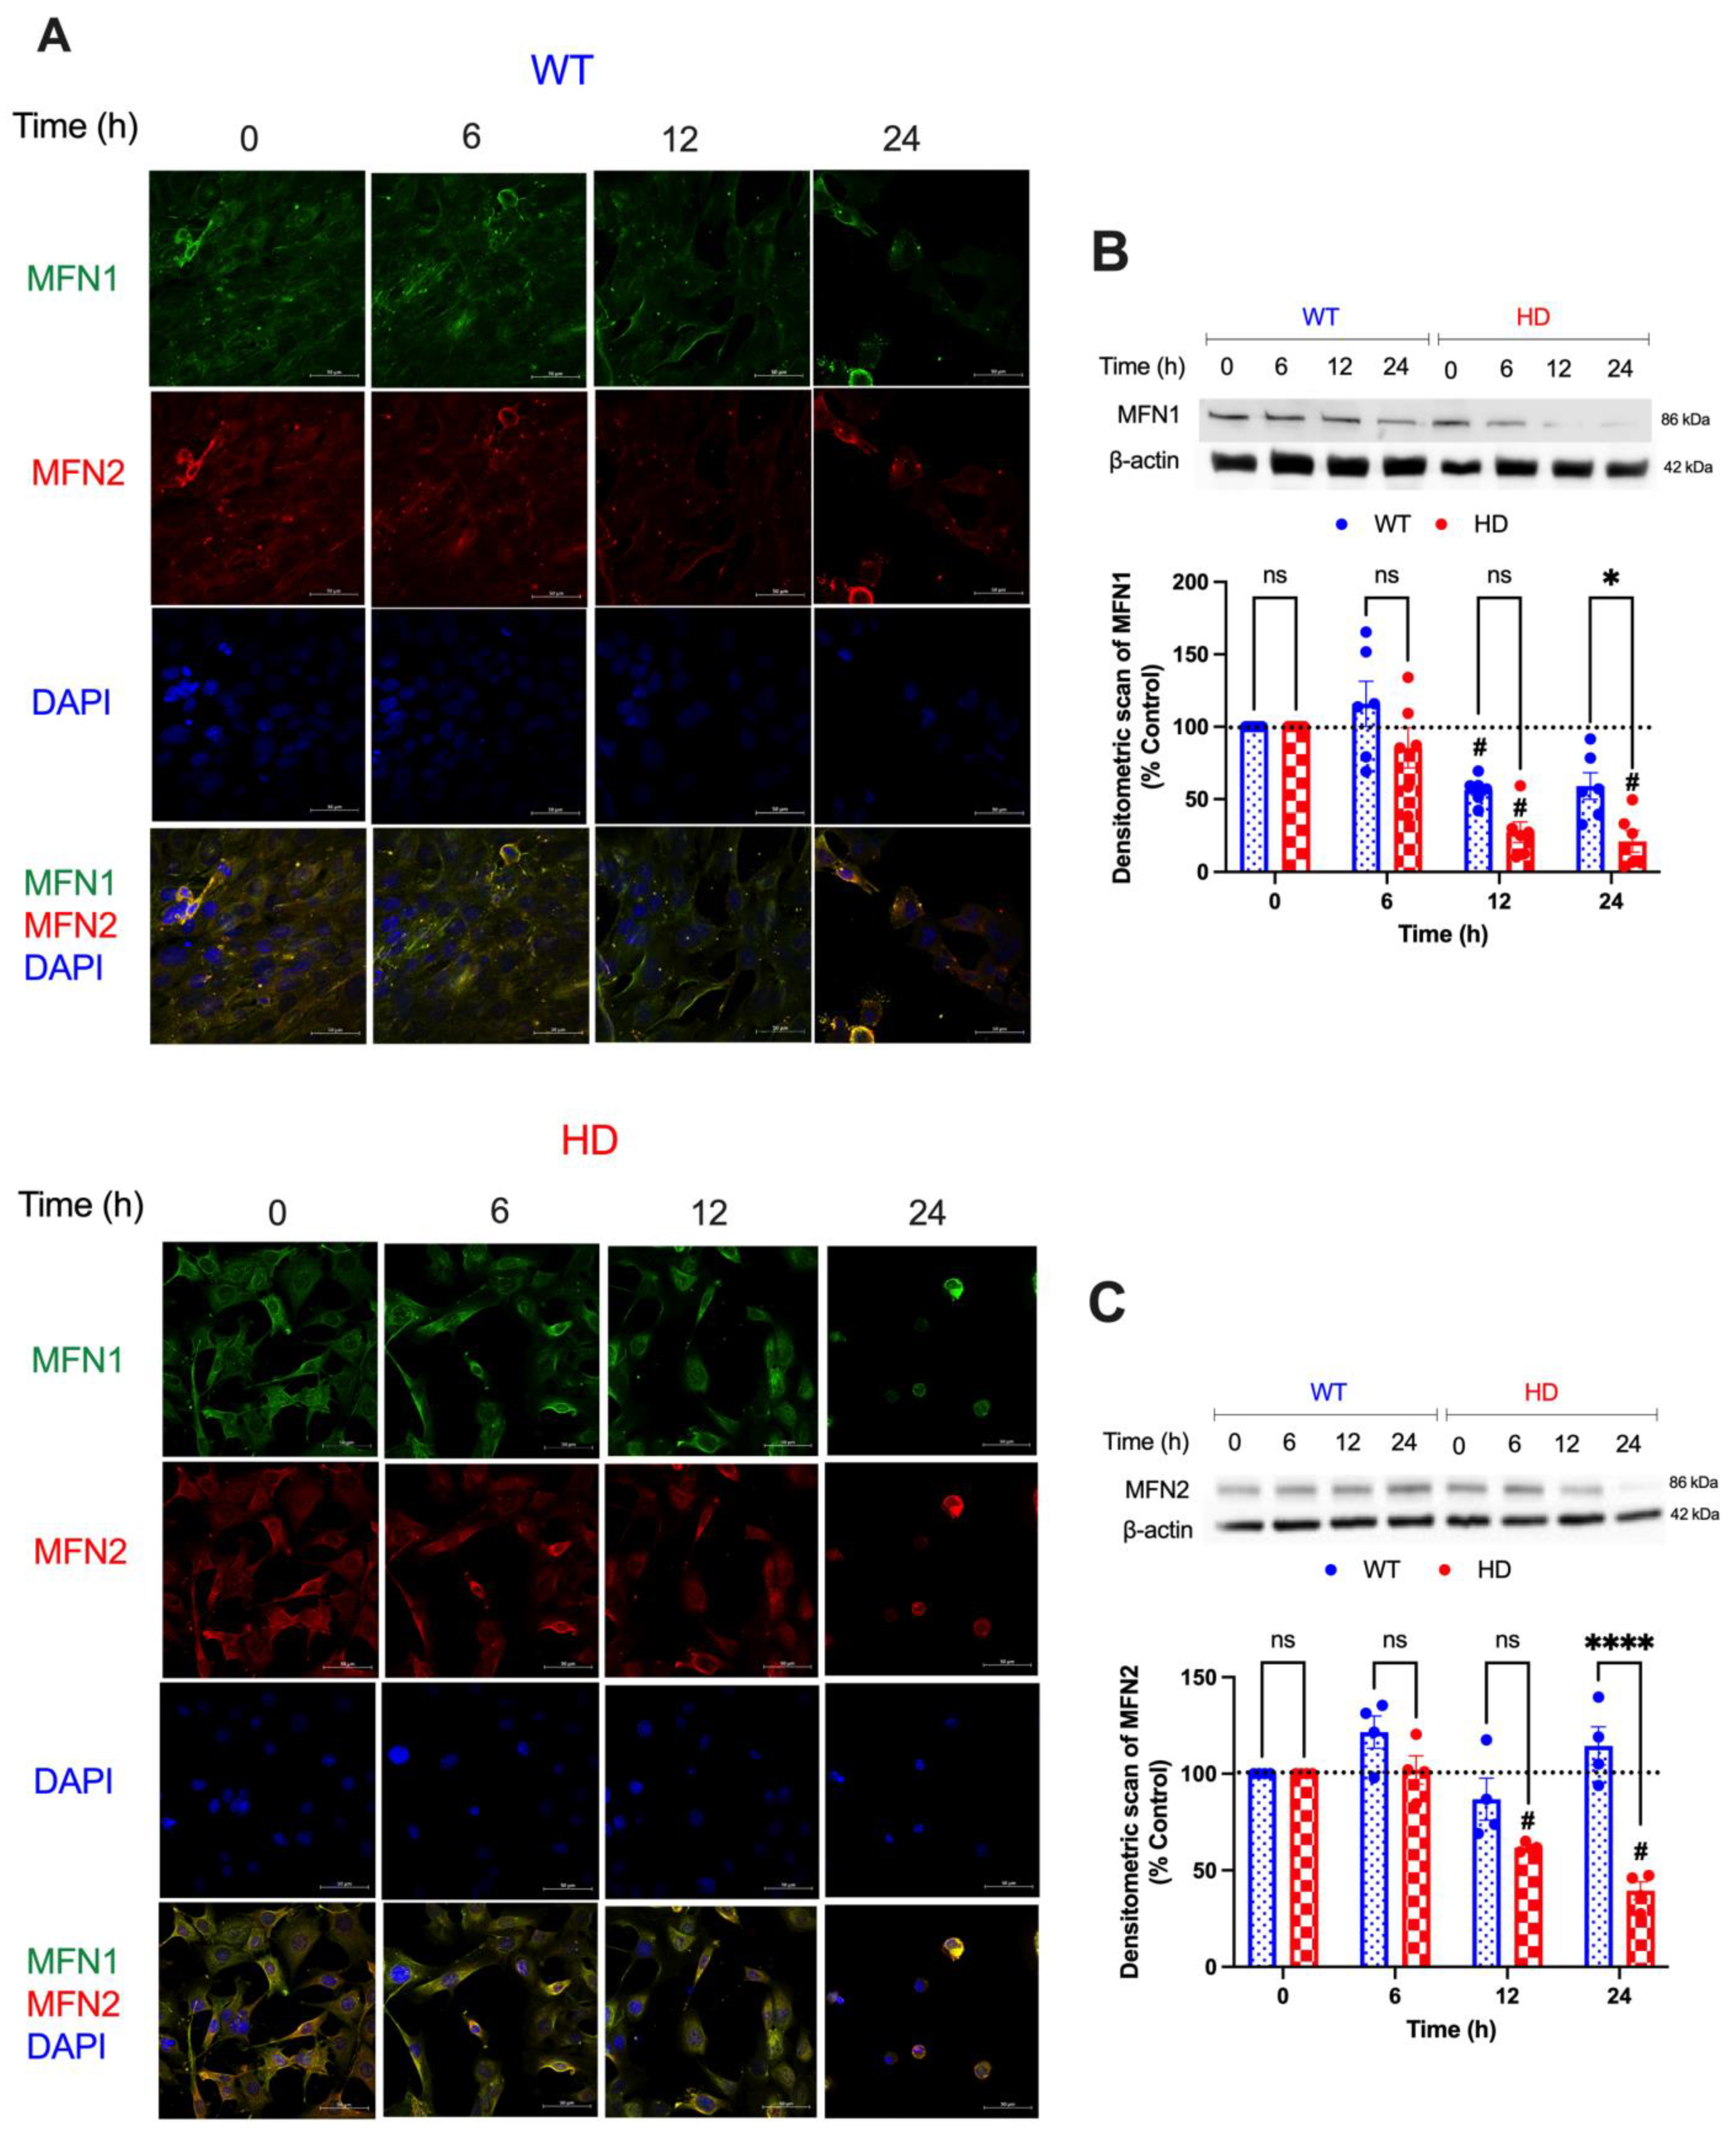
2.4. Mitochondrial Fusion Proteins Are Modulated by Acute Cd Exposure

To complement this change in pro-fission protein expression, we examined the expression of pro-fusion proteins (MFN1, MFN2). A two-way ANOVA reveals a significant effect of genotype (F(1, 10) = 12.68, p = 0.0052), exposure time (F(3, 30) = 10.12, p < 0.0001), and a time by genotype interaction (F(3, 30) = 3.464, p = 0.0284) on MFN1 expression, indicating that HD cells exhibit a progressive and significant reduction in MFN1 expression that is directly related to the duration of Cd exposure. Furthermore, a post hoc analysis with the Student’s t-test shows a significant reduction from baseline MFN1 expression in HD cells compared with WT (p < 0.05) as early as 6 h (Figure 4A,B). Similarly, we observed a significant reduction in MFN2 expression in HD cells compared with WT by 24 h. A two-way ANOVA highlighted a significant effect of exposure time (F(3, 18) = 20.68, p < 0.0001), genotype (F(1, 6) = 19.34, p = 0.0046), and time by genotype interaction (F(3, 18) = 16.63, p < 0.0001). Post hoc analysis with the Student’s t-test revealed a significant decrease (p < 0.0005) in MFN2 expression in HD cells compared with baseline at 12 and 24 h. These findings suggest that Cd down-regulates MFN1 and MFN2 expression in a genotype- and time-dependent manner, likely contributing to the perturbation of mitochondrial dynamics and bioenergetics (Figure 4A,C).

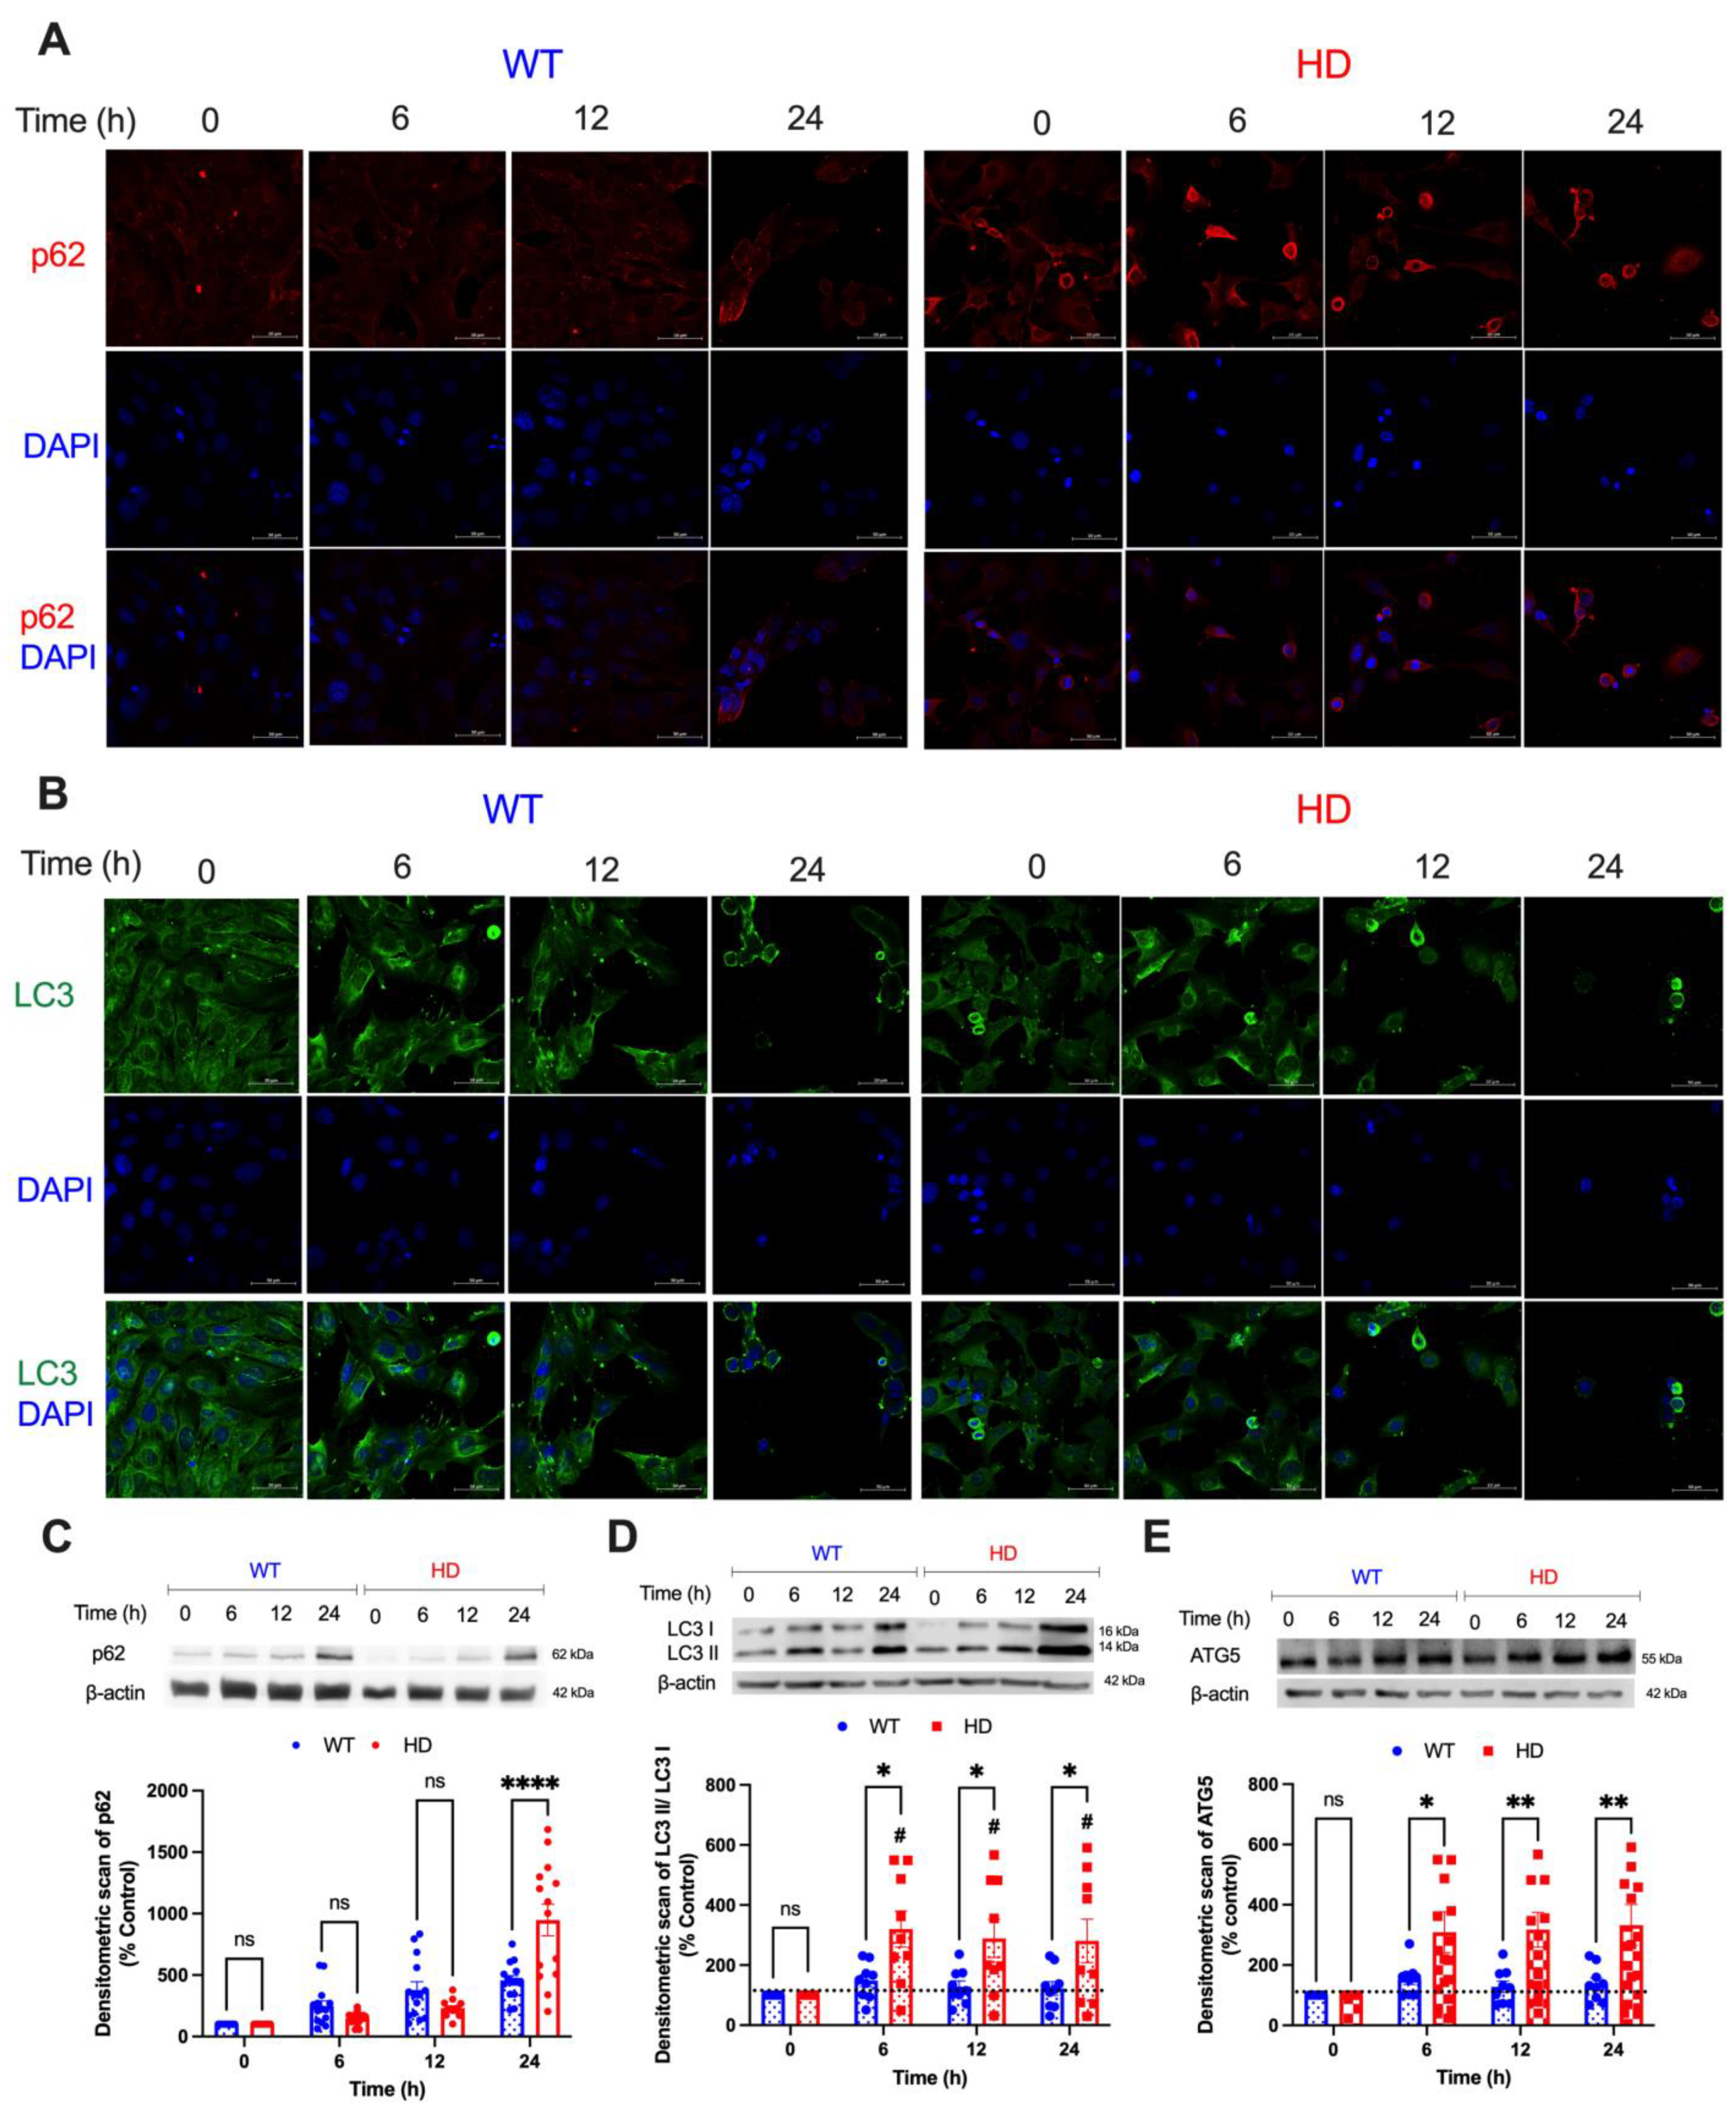
2.5. Key Autophagic Markers Are Upregulated in HD Cells upon Cd Exposure

To better understand the impact of acute Cd exposure on autophagy, we examined the protein expression of autophagic markers p62, microtubule-associated 1A/1B-light chain 3 (LC3), and autophagy-related protein 5 (ATG5) after Cd exposure at the indicated times with confocal microscopy and immunoblotting. Statistical analysis of p62 expression in both genotypes using a two-way ANOVA reveals no genotype effect (F(1, 26) = 1.809, p = 0.1902) and a significant time effect (F(3, 78) = 49.75, p < 0.0001) and exposure time (h) by genotype interaction (F(3, 78) = 15.32, p < 0.0001). Post hoc analysis with the Student’s t-test reveals a significant increase (p = 0.0384) in p62 expression in HD cells compared with WT only at 24 h (Figure 5C). LC3-II, a standard marker for autophagosomes, is the activated and lipidated form of LC3 and migrates faster on SDS-PAGE [61]. Cd exposure caused a significant increase in the LC3-II/I ratio in HD cells starting at baseline when compared with WT-exposed cells (Figure 5B,D). A two-way ANOVA reveals a significant effect of genotype (F(1, 16) = 6.172, p = 0.0244), exposure time (h) (F(3, 48) = 9.649, p < 0.0001), and an exposure time (h) by genotype interaction (F(3, 48) = 4.652, p = 0.0062). Lastly, we examined the expression of ATG5, which is important for autophagosome formation and fusion of the autophagosome with the lysosome [62]. Statistical analysis of ATG5 expression using two-way ANOVA highlights a significant effect of genotype (F(1, 16) = 9.045, p = 0.0083), exposure time (h) (F(3, 48) = 9.006, p < 0.0001), and an exposure time (h) by genotype interaction (F(3, 48) = 4.472, p = 0.0076), suggesting that ATG5 expression increases in proportion with the duration of Cd exposure (Figure 5E).

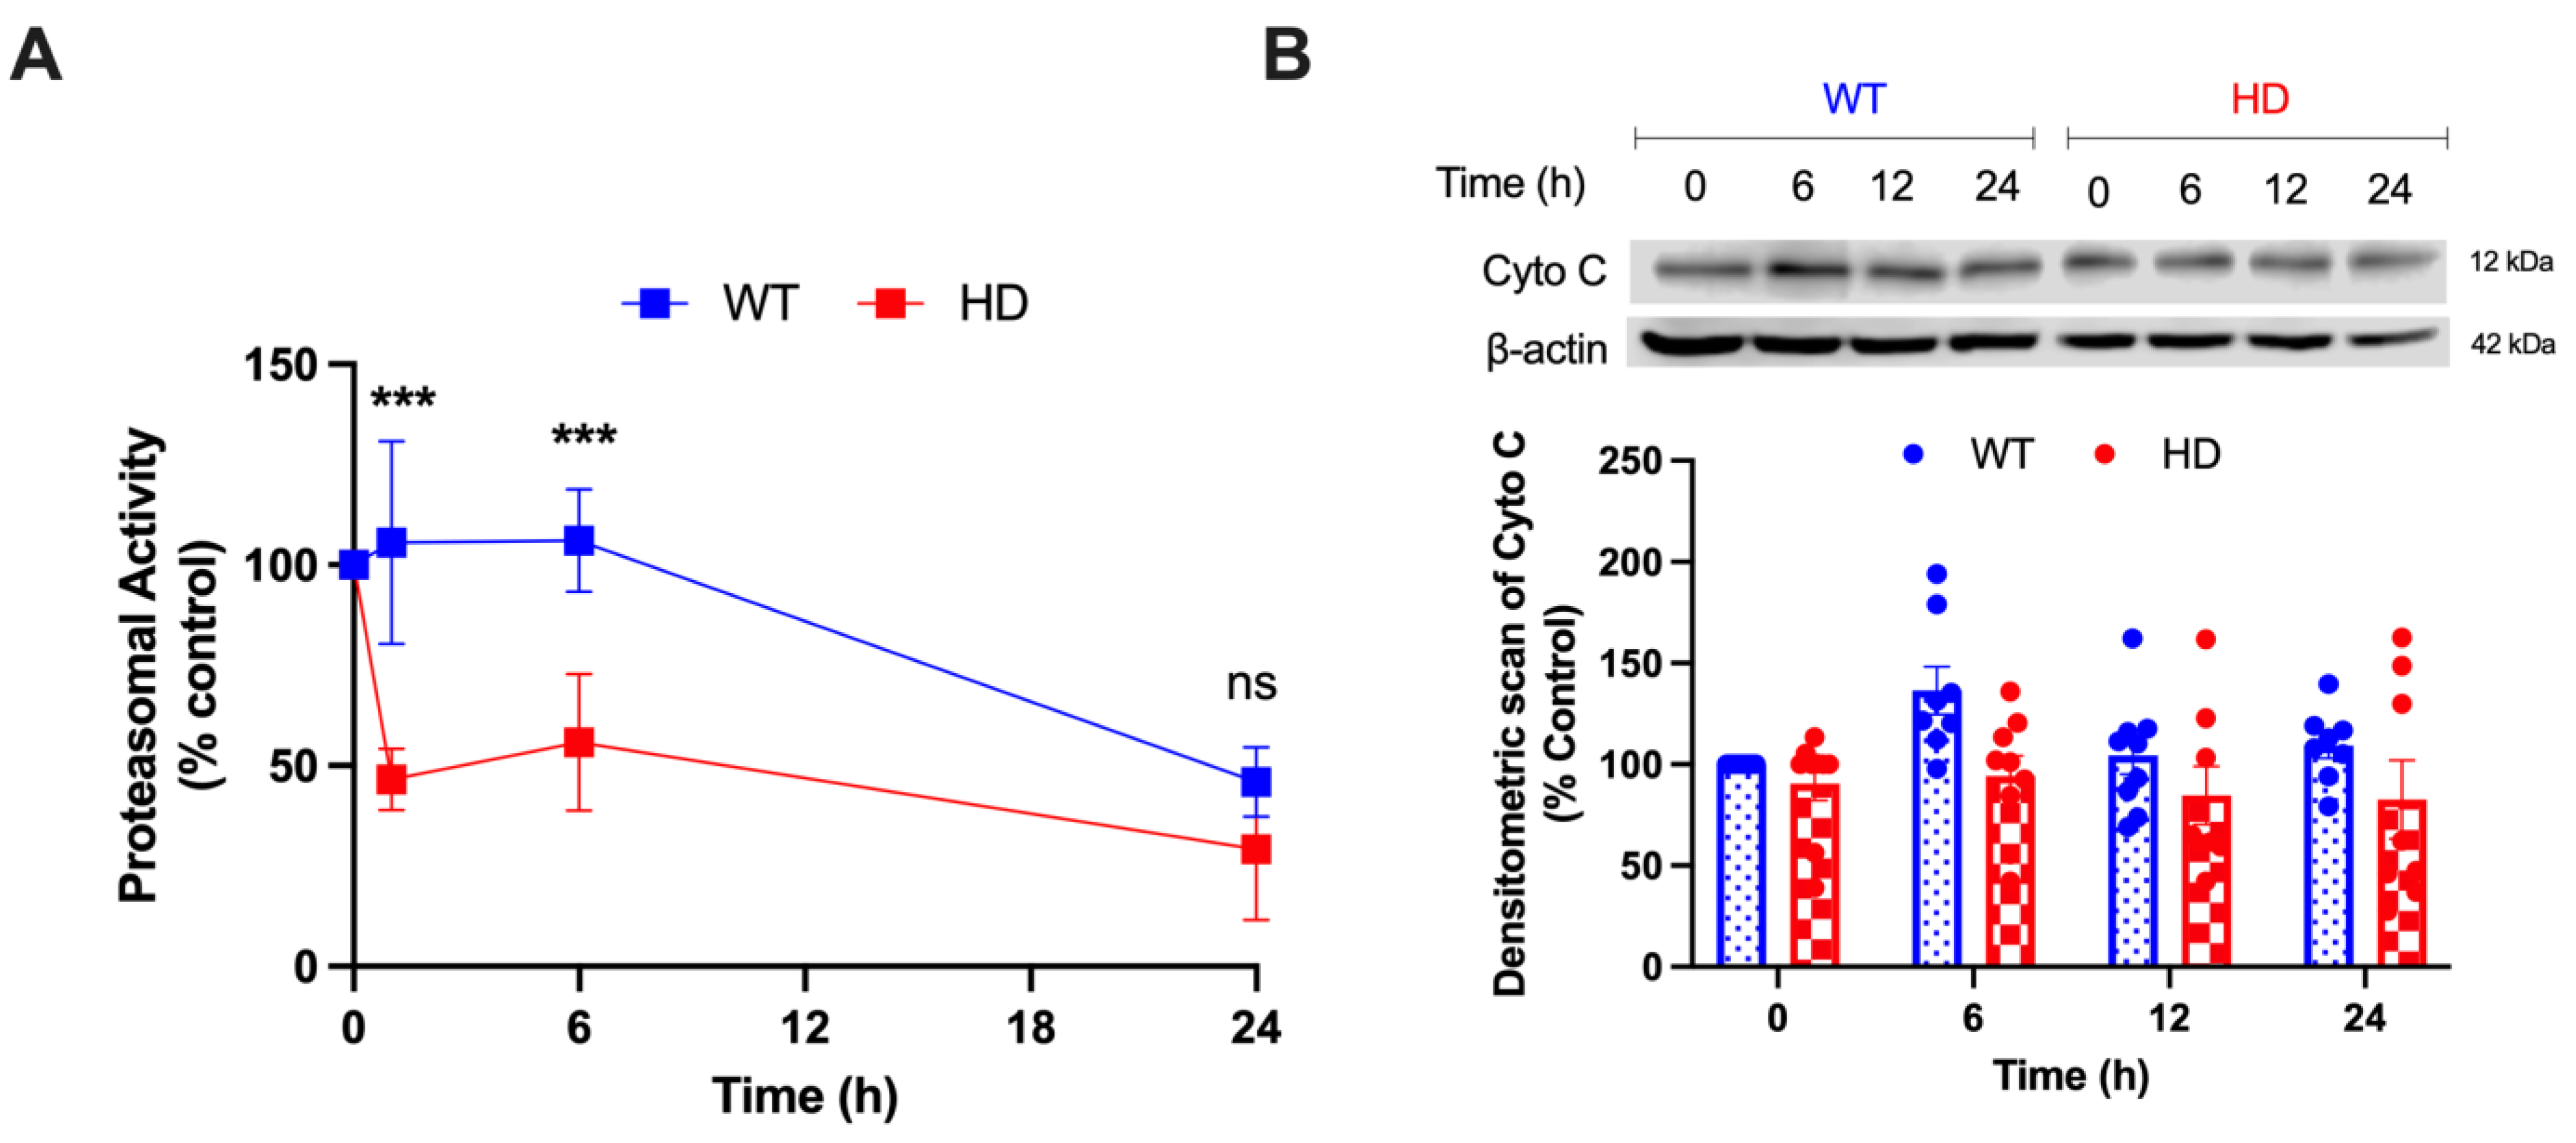
2.6. HD and Cd Cooperatively Reduce Proteasomal Activity and Augments Mitochondrial Mediated Cell Death

Impairment of the UPS is a common pathogenic mechanism of neurodegenerative diseases, including HD [63,64,65]. A reduction in the proteolytic activity of the UPS has been reported in the brains and other tissues of HD patients and animal models of HD [30]. To understand the synergistic effect of HD and Cd on UPS function, we assessed the enzymatic activity of the 20S/26S proteasome using the specific fluorogenic substrate Suc-LLVY-AMC in WT and HD cells. Figure 6A shows a rapid decrease in the proteasomal activity within 1 h of 40 µM Cd exposure in HD cells. A two-way ANOVA reveals a significant effect of exposure time (h) (F(2, 14) = 75.70, p < 0.0001), genotype (F(1, 7) = 97.12, p < 0.0001), and exposure time (h) by genotype interaction (F(2, 14) = 7.595, p = 0.0058). Less than 50% of proteasomal activity remained after the 1 h exposure (p < 0.0001), indicating that Cd induces proteasomal inhibition that precedes cell death. Based on the observed Cd-induced changes in mitochondrial dynamics and function in HD striatal cells (Figure 1, Figure 2, Figure 3 and Figure 4), we examined whether Cd exposure promotes the release of cytochrome C from the mitochondria to mediate intrinsic cell death in the HD cells. Figure 6B demonstrates that 40 µM Cd exposure has no significant effect on cytochrome C protein levels.

3. Discussion

The present study provides evidence that acute Cd exposure reduces mitochondrial potential and perturbs mitochondrial bioenergetics and function, leading to cell death in striatal HD cells. Although Cd exposure upregulated the expression of autophagic markers, it was likely insufficient to counterbalance the reduced proteasomal activity of HD. We have previously demonstrated that chronic Cd exposure potentiates reactive oxygen species (ROS) production and caspase-mediated apoptosis in an HD cell model [13]. The current study revealed that Cd triggers cytotoxicity in a time-dependent manner, with HD cells exhibiting a significant increase in cell death compared with WT (Figure 1). HD cells have been shown to have greater Cd accumulation by 48 h of exposure compared with WT [13] which might be due to the mHTT protein increasing influx of Cd [66]. We demonstrated a significant reduction in MMP in both WT and HD cells upon Cd exposure, with HD cells having ~20% greater reduction in MMP compared with WT after 24 h exposure (Figure 2A,B). This effect may be mediated by alterations in membrane phospholipid integrity [67], leading to excessive ROS generation, lower ATP production, and permeabilization of the mitochondrial membrane [68,69]. We found that Cd exposure led to a significant increase in ROS generation and activation of caspase 9 and caspase 3, leading to the initiation of the intrinsic mitochondrial-mediated cell death pathway [13]. This progressive pathogenic cascade further confirms the time-dependent effect of Cd in HD striatal cells.
mHTT impairs mitochondrial structure and function by disrupting the balance of mitochondrial dynamics [70]. mHTT directly interacts with DRP1 to enhance its activity and drive an imbalance in mitochondrial dynamics towards fission in HD models both in vivo and in vitro [71,72]. Given the overlap in cellular mechanisms between Cd exposure and mHTT-induced mitochondrial dysfunction, we hypothesized that Cd and mHTT would cooperatively accelerate alteration in overall mitochondrial bioenergetics and health in HD cells as an early mediator of neurotoxicity and cell death. In accordance with our hypothesis, Cd exposure decreased mitochondrial membrane potential in the HD cells compared with WT at 24 h (Figure 2A,B). Further, as early as 6 h Cd exposure resulted in reduced cellular ATP levels in both WT and HD cells, with an accompanying significant genotype effect observed at 24 h exposure (Figure 2C). These findings support the literature indicating that mitochondrial electron transport chain (ETC), membrane permeability, and cellular ATP production are significantly impaired by Cd exposure [73] and in STHdh cells expressing mHTT [74]. Thus, a synergistic interaction between acute Cd exposure and mHTT will substantially reduce mitochondrial bioenergetics and health to cause neurotoxicity and neurodegeneration.
mHTT and Cd independently interact with DRP1 to increase mitochondrial fission rates [70]. We observed no significant changes in DRP1 expression following Cd exposure in HD (Figure 3A,B), suggesting the combination of mHTT and Cd does not drive DRP1-dependent mitochondria fragmentation and changes in overall mitochondrial health in striatal HD cells. Although we observed a non-statistical trend of reducing DRP1 protein levels in the striatal cells at 12 h and 24 h following Cd exposure, the absence of a genotype- or time-dependent effect of Cd on DRP1 protein expression may suggest changes in overall Cd transport dynamics in the HD cells [66] that could influence DRP1 dynamics. Thus, we suspect that longer durations of Cd exposure might induce changes in DRP1 protein expression in the HD striatal cells. We observed a significant increase in FIS1 expression in wild-type cells and a non-significant trend towards a reduced expression of FIS1 in HD cells upon Cd exposure (Figure 3B,C). Cd exposure has been shown to have inconsistent effects on FIS1 expression and function in different cell types. For example, Xu et al. (2013) showed that 12 µM CdCl2 for 24 h has no effect on FIS1 protein expression in L02 liver cells [75]. Conversely, Ge et al. (2019) reported that exposure to high concentrations of CdCl2 (70 mg/kg) increases FIS1 mRNA expression in chicken kidney tissue [76]. It is likely that the Cd-mediated regulation of FIS1 protein expression in the striatal cells is cell type-specific and attributed to the relatively acute concentration of Cd exposure.
Mitochondrial fusion proteins play an important role in balancing mitochondrial dynamics, but there exists contradicting evidence regarding the effect of Cd exposure on pro-fusion proteins. Previous work by Ge et al. (2019) showed that exposure to higher concentrations of CdCl2 (70 mg/kg) caused a decrease in MFN1, MFN2, and OPA1 expression in kidney cells, while Xu et al. (2013) showed that 2 mg/kg CdCl2 exposure decreases MFN1, but not MFN2 or OPA1 levels in liver cells [75,76]. Due to the altered mitochondrial bioenergetics in striatal HD cells following Cd exposure (Figure 2), we hypothesized that pro-fusion proteins would experience a dramatic decrease following Cd exposure. We observed a significant decrease in MFN1 protein levels between WT and HD cells, with HD cells experiencing substantially lower levels at 6, 12, and 24 h exposure (Figure 4A,B). Additionally, we observed reduced MFN2 protein levels in HD cells than WT at 12 and 24 h Cd exposure (Figure 4A,C). These results come in agreement with Shirendeb et al.’s (2011) findings that demonstrated that expression of mHTT drives the reduction of MFN1 and MFN2 protein levels [77]. Altogether, we demonstrate that Cd, in tandem with mHTT, enhances mitochondrial fission and fragmentation by down-regulating pro-fusion proteins.
To further understand the process of mitochondrial and protein degradation and recycling, we examined proteasomal activity and autophagic flux. Although proteasomal dysfunction in polyglutamine disorders remains not fully understood, there is sufficient evidence that mHTT sequesters components of the UPS to impair its normal function [78,79]. Recognizing the reduced proteasomal function in HD models and postmortem tissues and the negative impact of Cd-triggered oxidative damage on proteasome function [17,80,81], we hypothesized that Cd exposure and mHTT would synergistically reduce the activity and function of the UPS. Our results depict that HD cells exhibit a significantly lower activity of UPS than WT cells as early as 1 h after Cd exposure (Figure 6A). By 24 h, WT and HD cells exhibited a comparable reduction in proteasome activity, which might be due to the active inhibition of UPS caused by prolonged Cd exposure.
p62 is a key mediator of crosstalk between UPS and autophagy [82]. Given the important role autophagy plays in regulating mitochondrial homeostasis through mitophagy [83], we hypothesized that p62 would be significantly upregulated, leading to the activation of autophagy as a result of impaired mitochondrial health and UPS function. We found that Cd triggered a time-dependent increase in p62 levels in WT and HD cells, with HD cells exhibiting a significant increase at 24 h (Figure 5A–C). To further evaluate autophagy, we measured the expression of the lipidated form of LC3-II to LC3-I and found a significant increase in LC3-II/I level in HD cells over time (Figure 5A,B,D). High LC3 levels are associated with severe HD symptomatology and increased levels of downstream abnormal protein accumulation due to inefficient cargo trafficking [84]. This suggests that Cd, in tandem with HD, spurs protein misfolding and accumulation. Cd triggered a significant increase in ATG5 protein levels in HD cells as early as 6 h (Figure 5E), which is consistent with the observed increased autophagy (Figure 5A–D). Given the enhanced cell death in HD cells over time despite the activation of the autophagic pathway, it is likely that increased autophagy upon Cd exposure in striatal HD cells is insufficient to compensate for the reduced UPS function (Figure 6A), resulting in mitochondrial-mediated neurotoxicity and cell death in the striatal HD cells.
Cytochrome C release from the mitochondria activates the formation of the apoptosome complex by recruiting apoptotic peptidase activating factor 1 (Apaf1) and caspase-9 and further activating a caspase cascade resulting in cell death [85]. The lack of genotypic and time-dependent changes in Cd-triggered release of mitochondrial release of cytochrome C is likely due to a masking effect of cytoplasmic and mitochondrial cytochrome C levels in the striatal cells (Figure 6B). Future studies will examine cytoplasmic vs. mitochondrial cytochrome C levels in the HD striatal cells following acute exposure. We propose a sequential model of Cd-triggered neurotoxicity in HD striatal cells wherein Cd (i) selectively altered mitochondrial bioenergetics and function, decreased UPS dysfunction leading to (ii) increased ROS production, (iii) activation of apoptotic and autophagic pathways, and eventually (iv) neurotoxicity and cell death (Figure 7). This study supports and complements our previous chronic Cd and HD cytotoxicity and cell death in the STHdh neuronal model of HD [13] by elucidating the impact of acute Cd and mHTT on mitochondrial bioenergetics, dynamics, and function, as well as protein degradation pathways and cell repair pathways. Altogether, our findings will enhance the current understanding of gene–environment interactions in HD and may provide insights into practices to overcome the effects of environmental toxicants amongst at-risk populations where such chemicals and neurodegenerative diseases are prevalent.

4. Materials and Methods

4.1. Chemicals and Reagents

Cadmium (II) chloride (CdCl2) used in the indicated assays was purchased from Alfa Aesar (Ward Hill, MA, USA). SYTOX Green, Triton X-100, paraformaldehyde (PFA), and JC-1 probe and Hoechst dyes were purchased from Life Technologies (Grand Island, NY, USA). Hypotonic buffer (10 mM HEPES, 5 mM MgCl2, 10 mM KCl, 1% sucrose, and 0.1% CHAPS) components were purchased from Sigma-Aldrich (St. Louis, MO, USA). Running buffer (10X ris/Glycine/SDS Buffer), transfer buffer (10X Tris/Glycine), and nitrocellulose membrane were purchased from Bio-Rad (Hercules, CA, USA). Bovine serum albumin was purchased from ThermoFisher Scientific (Waltham, MA, USA).

4.2. Cell Culture

STHdhQ7/Q7 (WT) and STHdhQ111/Q111 (HD) immortalized-murine striatal-derived cells (STHdh) originally generated by Dr. Marcy MacDonald [86] were obtained from the Coriell Cell Repository (Camden, NJ, USA). Cells were cultured in Dulbecco’s modified Eagle’s medium (DMEM) (high-glucose, Sigma; D6546) supplemented with 4.5 g/L glucose and 10% fetal bovine serum (FBS) (Atlanta Biologicals; Flowery Branch, GA, USA), 2 mM GlutaMAX (Life Technologies, Inc., Carlsbad, CA, USA), 1% penicillin/streptomycin (15140-122; Life Technologies, Inc.), 0.4 mg/mL G418 sulfate (Life Technologies, Inc.), 1X nonessential amino acid solution (Life Technologies, Inc.), and 14 mM HEPES (Life Technologies, Inc.) for 16–24 h (h) prior to the assay. HD and WT cells were cultured using the above specifications and allowed to proliferate until a cell density of 85–95% was reached in a 10 cm2 poly-lysine-treated plate. Upon reaching 85–95% confluence, HD and WT cells were plated at 15,000 and 20,000 cells per well, respectively, in a 96-well poly-lysine-treated plate and allowed to incubate for 16–24 h before exposure to Cd. Media was replaced every three days during the incubation period. Cells were dissociated using a 0.05% trypsin/EDTA solution (Life Technologies, Inc.). Cell cultures were maintained in a humidified atmosphere of 5% CO2 at 33 °C, as previously described [37]. We and others have extensively used the STHdh cells as a model to study the neurotoxic mechanisms pertaining to HD [15,87,88,89,90,91]

4.3. Cell Death Assay

Cd-induced cytotoxicity was measured using an SYTOX Green assay, a membrane-impermeable dye that only permeates the compromised plasma membranes of dead cells and binds to nucleic acids, as described previously [92]. The fluorescence intensity is directly proportional to the number of dead cells. WT and HD striatal cells were seeded overnight and loaded with 1 µM SYTOX Green dye and allowed to incubate with 40 µM CdCl2 for 24 h. Cells were co-stained with Hoechst staining solution prepared by diluting a Hoechst stock solution (1:2000) in PBS, followed by 10 min incubation at room temperature, and protected from light. Changes in SYTOX Green dye and Hoechst fluorescence in the cells were visualized at 10× magnification using an EVOS microscope (Thermo Fisher Scientific, Waltham, MA, USA) and quantified at Ex/Em 549/575 and Ex/Em 350/461 nm, respectively, with a Synergy HT multimode microplate reader (BioTek Instruments, Inc., Charlotte, VT, USA).

4.4. Mitochondrial Membrane Potential

Mitochondrial membrane potential (MMP) was determined using a fluorescent ratiometric JC-1 dye, a lipophilic cationic probe that can selectively enter the mitochondria. Double staining of JC-1 fluorescence (red J-aggregates and green monomers) was used to assess MMP. Following seeding overnight, followed by exposure to 40 µM CdCl2 for the indicated times, cells were washed using 1X PBS and incubated with 5 μg/mL JC-1 for 15 min at 33 °C in the dark, then washed with 1X PBS. Cells were co-stained with Hoechst staining solution prepared by diluting a Hoechst stock solution (1:2000), as previously described. Qualitative fluorescence images of Hoechst stain (Ex/Em 350/461 nm) and red J-aggregates (Ex/Em 585/590 nm)/green monomers (Ex/Em 510/527 nm) were captured at 20× using an EVOS microscope (Thermo Fisher Scientific) and a Synergy HT Microplate.

4.5. ATP Assay

Cellular ATP was measured using a CellTiter-Glo. 2.0 assay (Promgea, Madison WI, USA) that provides a homogeneous method to quantify the amount of ATP present in metabolically active cells. WT and HD cells were seeded from 20,000 and 30,000 cells per well, respectively, in a solid white 96-well microplate for 16–24 h at 33 °C and 5% CO2. Background control wells contained medium only. Cells and controls were quadruplicated at 100 μL per well. Cells were exposed to 40 µM CdCl2 for 0, 6, 12, and 24 h. After Cd exposure, the microplate was equilibrated to room temperature for 30 min, and 100 μL of CellTiter-Glo 2.0 reagent was added to each well. The microplate was rocked on a plate shaker for 5 min to induce lysis and allowed to incubate at room temperature for 10 min to stabilize the luminescent signal before the Synergy HT Microplate was used to measure changes in luminescence in the cells, which is directly proportional to cellular ATP.

4.6. Immunocytochemistry (ICC)

Sequential immunocytochemistry was performed to evaluate the effect of Cd exposure on protein expression and cellular localization of specific proteins. WT and HD cells were seeded at 40,000 and 50,000 cells, respectively, and incubated overnight at 33 °C in 8-well-chambered slides. Following exposure to 40 µM CdCl2 for the indicated time points, cells were fixed with 4% PFA for 30 min, washed with 1X PBS for 5 min three times, permeabilized with 0.01% Triton X-100 for 10 min, washed three times with 1X PBS for 5 min each, and blocked with 3% BSA for 30 min. Following blocking, cells were incubated with the first primary antibody in 3% BSA overnight at 4 °C and shaken at 2.5 rpm. Primary antibodies (ABclonal rabbit monoclonal anti-dynamin related protein (DRP1, A2586), mitochondrial fission protein 1 (FIS1, A19666), mitofusin 1 (MFN1, A9880), mitofusin 2 (MFN2, A12771), light chain 3-I/II (LC3-I/II, A5618), p62 (A19700), autophagy-related 5 (ATG5, A0203), and cytochrome C (Cyto. C, A13430)) were used at 1:100. The cells were then washed with 1X PBS for 5 min three times and incubated with Alexa Fluor 594- or 488-conjugated secondary antibodies for 1 h. For the second round of staining, cells were washed with 1X PBS for 5 min three times and re-blocked in 3% BSA for 30 min and subjected to the above staining procedure for the second round of antibodies. The cells were mounted in an antifade mounting medium (Aqua-Poly/Mount, Polysciences, Warrington, PA, USA, 18606-20) containing DAPI (VWR, IC15757410; 1:1000). Fluorescent images were acquired using a Leica DM4000B fluorescent microscope or a Zeiss LSM 880 confocal microscope at 63× magnification. Each fluorescent channel was captured in a Z-series of 6 slices to eliminate the detection of bleed-through and other artifactual fluorescence.

4.7. Immunoblotting

Equal numbers of WT and HD striatal cells were seeded and treated with 40 µM CdCl2 for the indicated times. Whole-cell lysates were prepared using RIPA buffer, 1x protease, and phosphatase inhibitor cocktails (PIA32959, Thermo Fisher Scientific) and loaded by equal protein for SDS-PAGE. The DC protein assay reagent was used to measure protein concentration in the samples. Cell lysates containing equal amounts of protein were separated on a 4–25% SDS-polyacrylamide gel. After separation, proteins were transferred to a nitrocellulose membrane, and non-specific binding sites were blocked with 3% BSA for 1 h. The membranes were incubated overnight at 4 °C with primary antibodies obtained from Abclonal and directed against DRP1 (A2586), FIS1 (A19666), MFN1 (A9880), MFN2 (A12771), LC3 (A5618), p62 (A19700), ATG5 (A0203), cytochrome C (A13430), and β-Actin (AC026) at 1:1000. Appropriate secondary antibodies from Vector Laboratories (West Grove, PA, USA) at 1:10,000 were used accordingly. Blots were visualized with Thermo Scientific Pierce Supersignal West Dura Extended Duration Chemiluminescent Substrate (Waltham, MA, USA) on the ChemiDoc Touch imager (BioRad, Hercules, CA, USA). Measurements of the integrated density of protein bands were performed using ImageStudioLite software, version 5.2.5 (LI-COR, Lincoln, NE, USA).

4.8. Proteasomal Activity Assay

The proteasomal peptidase assay was performed as described before [93]. After seeding WT and HD cells at 0.8 × 10⁶ and 1 × 10⁶ cells/cm2 per plate, respectively, overnight followed by 40 µM CdCl2 exposure for the indicated times, cells were harvested, washed once in 1X PBS, and lysed in hypotonic buffer (10 mM HEPES, 5 mM MgCl2, 10 mM KCl, 1% sucrose, and 0.1% CHAPS). Lysates were incubated with a fluorogenic substrate Suc-LLVY-AMC (75 μM) in a proteasomal assay buffer (50 mM Tris-HCl, 20 mM KCl, 5 mM MgOAc, and 10 mM dithiothreitol, pH 7.6) at 37 °C for 30 min. The cleaved fluorescent products (AMC) were examined at 380 (excitation) and 460 nm (emission) wavelengths using a fluorescence multimode plate reader (Bio-Rad). Lysate concentration in the samples was determined by the Bradford method and used to normalize proteasomal enzymatic activity. Change in proteasomal activity was expressed as fold change above baseline.

4.9. Statistical Analysis

All analyses were performed using Prism 9.4.1 software (GraphPad Holdings, LLC, San Diego, CA, USA) using two-way analysis of variants (ANOVA) and post hoc Dunnett’s multiple comparisons or Sidak’s multiple comparisons test unless otherwise stated. Error bars are expressed as standard errors of the mean (SEM). The significance level for all the analyses is p ≤ 0.05.

Author Contributions

Conceptualization, G.F.K.; data curation, G.F.K.; performed the experiments, G.F.K., P.J.K., M.M.G., S.E.M., R.Z. and M.G.T., formal analysis, G.F.K.; writing—original draft preparation, G.F.K., P.J.K. and M.M.G.; writing—review and editing, G.F.K., P.J.K., S.E.M. and R.Z.; supervision, G.F.K.; project administration, G.F.K.; funding acquisition, G.F.K. All authors have read and agreed to the published version of the manuscript.

Funding

This research was supported in part by the Arts and Sciences Dean’s Office and the Office of Foundation, Government, and Corporate Grants at Oberlin College (G.F.K.).

Institutional Review Board Statement

Not applicable.

Informed Consent Statement

Not applicable.

Data Availability Statement

Not applicable.

Acknowledgments

We are deeply grateful to Wenna Chen (Oberlin College) for their technical assistance.

Conflicts of Interest

The authors declare that they have no conflict of interest with the contents of this article.

References

  1. Ghosh, R.; Tabrizi, S.J. Clinical features of huntington’s disease. Adv. Exp. Med. Biol. 2018, 1049, 1–28. [Google Scholar]
  2. Gusella, J.F.; MacDonald, M.E. Molecular genetics: Unmasking polyglutamine triggers in neurodegenerative disease. Nat. Rev. Neurosci. 2000, 1, 109–115. [Google Scholar] [CrossRef]
  3. Wanker, E.E. Protein aggregation and pathogenesis of Huntington’s disease: Mechanisms and correlations. Biol. Chem. 2000, 381, 937–942. [Google Scholar] [CrossRef]
  4. Henshall, T.L.; Tucker, B.; Lumsden, A.L.; Nornes, S.; Lardelli, M.T.; Richards, R.I. Selective Neuronal Requirement for Huntingtin in the Developing Zebrafish. Hum. Mol. Genet. 2009, 18, 4830–4842. [Google Scholar] [CrossRef] [PubMed] [Green Version]
  5. Benn, C.L.; Sun, T.; Sadri-Vakili, G.; McFarland, K.N.; DiRocco, D.P.; Yohrling, G.J.; Clark, T.W.; Bouzou, B.; Cha, J.H.J. Huntingtin modulates transcription, occupies gene promoters in vivo, and binds directly to DNA in a polyglutamine-dependent manner. J. Neurosci. 2008, 28, 10720–10733. [Google Scholar] [CrossRef] [PubMed] [Green Version]
  6. Trushina, E.; Dyer, R.B.; Badger, J.D.; Ure, D.; Eide, L.; Tran, D.D.; Vrieze, B.T.; Legendre-Guillemin, V.; McPherson, P.S.; Mandavilli, B.S.; et al. Mutant Huntingtin Impairs Axonal Trafficking in Mammalian Neurons In Vivo and In Vitro. Mol. Cell. Biol. 2004, 24, 8195–8209. [Google Scholar] [CrossRef] [PubMed] [Green Version]
  7. Bowman, A.B.; Kwakye, G.F.; Herrero Hernández, E.; Aschner, M. Role of manganese in neurodegenerative diseases. J. Trace Elem. Med. Biol. 2011, 25, 191–203. [Google Scholar] [CrossRef] [PubMed] [Green Version]
  8. Barron, J.C.; Hurley, E.P.; Parsons, M.P. Huntingtin and the synapse. Front. Cell. Neurosci. 2021, 15, 689332. [Google Scholar] [CrossRef] [PubMed]
  9. Schulte, J.; Littleton, J.T. The biological function of the Huntingtin protein and its relevance to Huntington’s Disease pathology. Curr. Trends Neurol. 2011, 5, 65–78. [Google Scholar]
  10. Möncke-Buchner, E.; Reich, S.; Mücke, M.; Reuter, M.; Messer, W.; Wanker, E.E.; Krüger, D.H. Counting CAG repeats in the Huntington’s disease gene by restriction endonuclease EcoP15I cleavage. Nucleic Acids Res. 2002, 30, e83. [Google Scholar] [CrossRef] [Green Version]
  11. Zala, D.; Benchoua, A.; Brouillet, E.; Perrin, V.; Gaillard, M.C.; Zurn, A.D.; Aebischer, P.; Déglon, N. Progressive and selective striatal degeneration in primary neuronal cultures using lentiviral vector coding for a mutant huntingtin fragment. Neurobiol. Dis. 2005, 20, 785–798. [Google Scholar] [CrossRef] [PubMed]
  12. Wegrzynowicz, M.; Holt, H.K.; Friedman, D.B.; Bowman, A.B. Changes in the striatal proteome of YAC128Q mice exhibit gene-environment interactions between mutant huntingtin and manganese. J. Proteome Res. 2012, 11, 1118–1132. [Google Scholar] [CrossRef] [PubMed] [Green Version]
  13. Kwakye, G.F.; Jiménez, J.A.; Thomas, M.G.; Kingsley, B.A.; McIIvin, M.; Saito, M.A.; Korley, E.M. Heterozygous huntingtin promotes cadmium neurotoxicity and neurodegeneration in striatal cells via altered metal transport and protein kinase C delta dependent oxidative stress and apoptosis signaling mechanisms. Neurotoxicology 2019, 70, 48–61. [Google Scholar] [CrossRef] [PubMed]
  14. Fox, J.H.; Kama, J.A.; Lieberman, G.; Chopra, R.; Dorsey, K.; Chopra, V.; Volitakis, I.; Cherny, R.A.; Bush, A.I.; Hersch, S. Mechanisms of Copper Ion Mediated Huntington’s Disease Progression. PLoS ONE 2007, 2, e334. [Google Scholar] [CrossRef] [PubMed]
  15. Williams, B.B.; Li, D.; Wegrzynowicz, M.; Vadodaria, B.K.; Anderson, J.G.; Kwakye, G.F.; Aschner, M.; Erikson, K.M.; Bowman, A.B. Disease-toxicant screen reveals a neuroprotective interaction between Huntington’s disease and manganese exposure. J. Neurochem. 2010, 112, 227–237. [Google Scholar] [CrossRef] [Green Version]
  16. Gruber, A.; Hornburg, D.; Antonin, M.; Krahmer, N.; Collado, J.; Schaffer, M.; Zubaite, G.; Lüchtenborg, C.; Sachsenheimer, T.; Brügger, B.; et al. Molecular and structural architecture of polyQ aggregates in yeast. Proc. Natl. Acad. Sci. USA 2018, 115, E3446–E3453. [Google Scholar] [CrossRef] [Green Version]
  17. Ross, C.A.; Tabrizi, S.J. Huntington’s disease: From molecular pathogenesis to clinical treatment. Lancet Neurol. 2011, 10, 83–98. [Google Scholar] [CrossRef]
  18. Tilokani, L.; Nagashima, S.; Paupe, V.; Prudent, J. Mitochondrial dynamics: Overview of molecular mechanisms. Essays Biochem. 2018, 62, 341–360. [Google Scholar]
  19. Twig, G.; Hyde, B.; Shirihai, O.S. Mitochondrial fusion, fission and autophagy as a quality control axis: The bioenergetic view. Biochim. Biophys. Acta 2008, 1777, 1092–1097. [Google Scholar] [CrossRef] [Green Version]
  20. Sheridan, C.; Martin, S.J. Mitochondrial Fission/Fusion Dynamics and Apoptosis. Mitochondrion 2010, 10, 640–648. [Google Scholar] [CrossRef]
  21. Guedes-Dias, P.; Pinho, B.R.; Soares, T.R.; de Proença, J.; Duchen, M.R.; Oliveira, J.M.A. Mitochondrial dynamics and quality control in Huntington’s disease. Neurobiol. Dis. 2016, 90, 51–57. [Google Scholar] [CrossRef] [PubMed] [Green Version]
  22. Glancy, B.; Kim, Y.; Katti, P.; Willingham, T.B. The functional impact of mitochondrial structure across subcellular scales. Front. Physiol. 2020, 11, 541040. [Google Scholar] [CrossRef] [PubMed]
  23. Ploumi, C.; Daskalaki, I.; Tavernarakis, N. Mitochondrial biogenesis and clearance: A balancing act. FEBS J. 2017, 284, 183–195. [Google Scholar] [CrossRef]
  24. Glick, D.; Barth, S.; Macleod, K.F. Autophagy: Cellular and molecular mechanisms. J. Pathol. 2010, 221, 3–12. [Google Scholar] [CrossRef] [Green Version]
  25. Hershko, A.; Ciechanover, A. The ubiquitin system. Annu. Rev. Biochem. 1998, 67, 425–479. [Google Scholar] [CrossRef]
  26. Klionsky, D.J.; Elazar, Z.; Seglen, P.O.; Rubinsztein, D.C. Does bafilomycin A1block the fusion of autophagosomes with lysosomes? Autophagy 2008, 4, 849–850. [Google Scholar] [CrossRef] [PubMed] [Green Version]
  27. Suzuki, K.; Ohsumi, Y. Molecular machinery of autophagosome formation in yeast, Saccharomyces cerevisiae. FEBS Lett. 2007, 581, 2156–2161. [Google Scholar] [CrossRef] [Green Version]
  28. Rubinsztein, D.C. The roles of intracellular protein-degradation pathways in neurodegeneration. Nature 2006, 443, 780–786. [Google Scholar] [CrossRef] [PubMed]
  29. Thompson, J.C.; Poliakoff, E.; Sollom, A.C.; Howard, E.; Craufurd, D.; Snowden, J.S. Automaticity and attention in Huntington’s disease: When two hands are not better than one. Neuropsychologia 2010, 48, 171–178. [Google Scholar] [CrossRef]
  30. Venkatraman, P.; Wetzel, R.; Tanaka, M.; Nukina, N.; Goldberg, A.L. Eukaryotic Proteasomes Cannot Digest Polyglutamine Sequences and Release Them during Degradation of Polyglutamine-Containing Proteins. Mol. Cell 2004, 14, 95–104. [Google Scholar] [CrossRef]
  31. Zheng, Q.; Huang, T.; Zhang, L.; Zhou, Y.; Luo, H.; Xu, H.; Wang, X. Dysregulation of Ubiquitin-Proteasome System in Neurodegenerative Diseases. Front. Aging Neurosci. 2016, 8, 303. [Google Scholar] [CrossRef] [PubMed] [Green Version]
  32. Chen, G.; Kroemer, G.; Kepp, O. Mitophagy: An Emerging Role in Aging and Age-Associated Diseases. Front. Cell Dev. Biol. 2020, 8, 200. [Google Scholar] [CrossRef] [PubMed] [Green Version]
  33. Wang, C.; Youle, R.J. The role of mitochondria in apoptosis. Annu. Rev. Genet. 2009, 43, 95–118. [Google Scholar] [CrossRef] [Green Version]
  34. Van Dellen, A.; Grote, H.E.; Hannan, A.J. Gene-Environment Interactions, Neuronal Dysfunction and Pathological Plasticity in Huntington’s Disease. Clin. Exp. Pharmacol. Physiol. 2005, 32, 1007–1019. [Google Scholar] [CrossRef]
  35. Mo, C.; Hannan, A.J.; Renoir, T. Environmental factors as modulators of neurodegeneration: Insights from gene-environment interactions in Huntington’s disease. Neurosci. Biobehav. Rev. 2015, 52, 178–192. [Google Scholar] [CrossRef] [PubMed]
  36. Van Dellen, A.; Hannan, A.J. Genetic and Environmental Factors in the Pathogenesis of Huntington’s Disease. Neurogenetics 2004, 5, 9–17. [Google Scholar] [CrossRef]
  37. Dominah, G.A.; McMinimy, R.A.; Kallon, S.; Kwakye, G.F. Acute exposure to chlorpyrifos caused NADPH oxidase mediated oxidative stress and neurotoxicity in a striatal cell model of Huntington’s disease. Neurotoxicology 2017, 60, 54–69. [Google Scholar] [CrossRef]
  38. Wexler, N.S.; Lorimer, J.; Porter, J.; Gomez, F.; Moskowitz, C.; Shackell, E.; Marder, K.; Penchaszadeh, G.; Roberts, S.A.; Gayán, J.; et al. Venezuelan kindreds reveal that genetic and environmental factors modulate Huntington’s disease age of onset. Proc. Natl. Acad. Sci. USA 2004, 101, 3498–3503. [Google Scholar] [PubMed] [Green Version]
  39. Sudarsky, L.; Myers, R.H.; Walshe, T.M. Huntington’s disease in monozygotic twins reared apart. J. Med. Genet. 1983, 20, 408–411. [Google Scholar] [CrossRef] [Green Version]
  40. Bird, T.D.; Omenn, G.S. Monozygotic twins with Huntington’s disease in a family expressing the rigid variant. Neurology 1975, 25, 1126–1129. [Google Scholar] [CrossRef]
  41. Georgiou, N.; Bradshaw, J.L.; Chiu, E.; Tudor, A.; O’Gorman, L.; Phillips, J.G. Differential clinical and motor control function in a pair of monozygotic twins with Huntington’s disease. Mov. Disord. 1999, 14, 320–325. [Google Scholar] [CrossRef] [PubMed]
  42. Lumsden, A.L.; Henshall, T.L.; Dayan, S.; Lardelli, M.T.; Richards, R.I. Huntingtin-deficient zebrafish exhibit defects in iron utilization and development. Hum. Mol. Genet. 2007, 16, 1905–1920. [Google Scholar] [CrossRef] [PubMed] [Green Version]
  43. Pfalzer, A.C.; Wilcox, J.M.; Codreanu, S.G.; Totten, M.; Bichell, T.J.; Halbesma, T.; Umashanker, P.; Yang, K.L.; Parmalee, N.L.; Sherrod, S.D.; et al. Huntington’s disease genotype suppresses global manganese-responsive processes in pre-manifest and manifest YAC128 mice. Met. Integr. Biometal Sci. 2020, 12, 1118–1130. [Google Scholar] [CrossRef]
  44. Dexter, D.T.; Carayon, A.; Javoy-Agid, F.; Agid, Y.; Wells, F.R.; Daniel, S.E.; Lees, A.J.; Jenner, P.; Marsden, C.D. Alterations in the levels of iron, ferritin and other trace metals in Parkinson’s disease and other neurodegenerative diseases affecting the basal ganglia. Brain A J. Neurol. 1991, 114, 1953–1975. [Google Scholar] [CrossRef]
  45. Chen, P.; Miah, M.R.; Aschner, M. Metals and Neurodegeneration. F1000Res 2016, 5, 366. [Google Scholar] [CrossRef] [PubMed] [Green Version]
  46. Jomova, K.; Valko, M. Advances in metal-induced oxidative stress and human disease. Toxicology 2011, 283, 65–87. [Google Scholar] [CrossRef] [PubMed]
  47. Kwakye, G.F.; Paoliello, M.M.B.; Mukhopadhyay, S.; Bowman, A.B.; Aschner, M. Manganese-Induced Parkinsonism and Parkinson’s Disease: Shared and Distinguishable Features. Int. J. Environ. Res. Public Health 2015, 2, 7519–7540. [Google Scholar] [CrossRef] [PubMed] [Green Version]
  48. Muller, M.; Leavitt, B.R. Iron dysregulation in Huntington’s disease. J. Neurochem. 2014, 130, 328–350. [Google Scholar] [CrossRef]
  49. Patel, R.; Aschner, M. Commonalities between Copper Neurotoxicity and Alzheimer’s Disease. Toxics 2021, 9, 4. [Google Scholar] [CrossRef] [PubMed]
  50. Kubier, A.; Wilkin, R.T.; Pichler, T. Cadmium in soils and groundwater: A review. Appl. Geochem. 2019, 108, 104388. [Google Scholar] [CrossRef]
  51. Tucker, P. Cadmium toxicity. In Case Studies in Environmental Medicine (CSEM); Agency for Toxic Substances and Disease Registry: Atlanta, GA, USA, 2008. [Google Scholar]
  52. Proshad, R.; Zhang, D.; Uddin, M.; Wu, Y. Presence of cadmium and lead in tobacco and soil with ecological and human health risks in Sichuan province, China. Environ. Sci. Pollut. Res. Int. 2020, 27, 18355–18370. [Google Scholar] [CrossRef]
  53. Henson, M.C.; Chedrese, P.J. Endocrine disruption by cadmium, a common environmental toxicant with paradoxical effects on reproduction. Exp. Biol. Med. 2004, 229, 383–392. [Google Scholar] [CrossRef] [PubMed]
  54. Wang, B.; Du, Y. Cadmium and its neurotoxic effects. Oxidative Med. Cell. Longev. 2013, 2013, 898034. [Google Scholar] [CrossRef] [PubMed] [Green Version]
  55. Mazzocco, J.C.; Jagadapillai, R.; Gozal, E.; Kong, M.; Xu, Q.; Barnes, G.N.; Freedman, J.H. Disruption of essential metal homeostasis in the brain by cadmium and high-fat diet. Toxicol. Rep. 2020, 7, 1164–1169. [Google Scholar] [CrossRef] [PubMed]
  56. Son, Y.-O.; Wang, X.; Hitron, J.A.; Zhang, Z.; Cheng, S.; Budhraja, A.; Ding, S.; Lee, J.-C.; Shi, X. Cadmium Induces Autophagy through ROS-Dependent Activation of the LKB1-AMPK Signaling in Skin Epidermal Cells. Toxicol. Appl. Pharmacol. 2011, 255, 287–296. [Google Scholar] [CrossRef] [Green Version]
  57. Satarug, S.; Moore, M. Adverse Health Effects of Chronic Exposure to Low-Level Cadmium in Foodstuffs and Cigarette Smoke. Environ. Health Perspect. 2004, 112, 1099–1103. [Google Scholar] [CrossRef] [Green Version]
  58. Ehret, J.C.; Day, P.S.; Wiegand, R.; Wojcieszek, J.; Chambers, R.A. Huntington disease as a dual diagnosis disorder: Data from the National Research Roster for Huntington disease patients and families. Drug Alcohol Depend. 2007, 86, 283–286. [Google Scholar] [CrossRef] [Green Version]
  59. Jin, Y.N.; Jhnson GV, W. The interrelationship between mitochondrial dysfunction and transcriptional dysregulation in Huntington disease. J. Bioenerg. Biomembr. 2010, 42, 199–205. [Google Scholar] [CrossRef] [Green Version]
  60. Mendezarmenta, M. Brain Regional Lipid Peroxidation and Metallothionein Levels of Developing Rats Exposed to Cadmium and Dexamethasone. Toxicol. Lett. 2003, 144, 151–157. [Google Scholar] [CrossRef]
  61. Klionsky, D.J.; Abdelmohsen, K.; Abe, A.; Abedin, M.J.; Abeliovich, H.; Acevedo Arozena, A.; Adachi, H.; Adams, C.M.; Adams, P.D.; Adeli, K.; et al. Guidelines for the use and interpretation of assays for monitoring autophagy (3rd edition). Autophagy 2016, 12, 1–222. [Google Scholar] [CrossRef] [Green Version]
  62. Zheng, W.; Xie, W.; Yin, D.; Luo, R.; Liu, M.; Guo, F. ATG5 and ATG7 induced autophagy interplays with UPR via PERK signaling. Cell Commun. Signal. 2019, 17, 42. [Google Scholar] [CrossRef] [Green Version]
  63. Ortega, Z.; Lucas, J.J. Ubiquitin-proteasome system involvement in Huntington’s disease. Front. Mol. Neurosci. 2014, 7, 77. [Google Scholar] [CrossRef] [Green Version]
  64. Davies, S.W.; Turmaine, M.; Cozens, B.A.; DiFiglia, M.; Sharp, A.H.; Ross, C.A.; Scherzinger, E.; Wanker, E.E.; Mangiarini, L.; Bates, G.P. Formation of neuronal intranuclear inclusions underlies the neurological dysfunction in mice transgenic for the HD mutation. Cell 1997, 90, 537–548. [Google Scholar] [CrossRef] [Green Version]
  65. Waelter, S.; Boeddrich, A.; Lurz, R.; Scherzinger, E.; Lueder, G.; Lehrach, H.; Wanker, E.E. Accumulation of mutant huntingtin fragments in aggresome-like inclusion bodies as a result of insufficient protein degradation. Mol. Biol. Cell 2001, 12, 1393–1407. [Google Scholar] [CrossRef] [Green Version]
  66. DelRaso, N.J.; Foy, B.D.; Gearhart, J.M.; Frazier, J.M. Cadmium uptake kinetics in rat hepatocytes: Correction for albumin binding. Toxicol. Sci. 2003, 72, 19–30. [Google Scholar] [CrossRef] [Green Version]
  67. Gupta, A.; Shukla, G.S. Ontogenic profile of brain lipids following perinatal exposure to cadmium. J. Appl. Toxicol. 1996, 16, 227–233. [Google Scholar] [CrossRef]
  68. Genchi, G.; Sinicropi, M.S.; Lauria, G.; Carocci, A.; Catalano, A. The effects of cadmium toxicity. Int. J. Environ. Res. Public Health 2020, 17, 3782. [Google Scholar] [CrossRef]
  69. Kaul, S.; Kanthasamy, A.; Kitazawa, M.; Anantharam, V.; Kanthasamy, A.G. Caspase-3 dependent proteolytic activation of protein kinase Cδ mediates and regulates 1-methyl-4-phenylpyridinium (MPP+)-induced apoptotic cell death in dopaminergic cells: Relevance to oxidative stress in dopaminergic degeneration. Eur. J. Neurosci. 2003, 18, 1387–1401. [Google Scholar] [CrossRef] [PubMed]
  70. Reddy, P.H. Increased mitochondrial fission and neuronal dysfunction in Huntingtons disease: Implications for molecular inhibitors of excessive mitochondrial fission. Drug Discov. Today 2014, 19, 951–955. [Google Scholar] [CrossRef] [PubMed] [Green Version]
  71. Cherubini, M.; Lopez-Molina, L.; Gines, S. Mitochondrial fission in Huntington’s disease mouse striatum disrupts ER-mitochondria contacts leading to disturbances in Ca2+ efflux and Reactive Oxygen Species (ROS) homeostasis. Neurobiol. Dis. 2020, 136, 104741. [Google Scholar] [CrossRef]
  72. Song, W.; Chen, J.; Petrilli, A.; Liot, G.; Klinglmayr, E.; Zhou, Y.; Poquiz, P.; Tjong, J.; Pouladi, M.A.; Hayden, M.R.; et al. Mutant Huntingtin Binds the Mitochondrial Fission GTPase Dynamin-Related Protein-1 and Increases Its Enzymatic Activity. Nat. Med. 2011, 17, 377–382. [Google Scholar] [CrossRef] [PubMed] [Green Version]
  73. Belyaeva, E.A.; Glazunov, V.V.; Korotkov, S.M. Cd2+-promoted mitochondrial permeability transition: A comparison with other heavy metals. Acta Biochim. Pol. 2004, 51, 545–551. [Google Scholar] [CrossRef] [PubMed] [Green Version]
  74. Milenkovic, D.; Blaza, J.N.; Larsson, N.-G.; Hirst, J. The enigma of the respiratory chain supercomplex. Cell Metab. 2017, 25, 765–776. [Google Scholar] [CrossRef] [Green Version]
  75. Xu, S.; Pi, H.; Chen, Y.; Zhang, N.; Guo, P.; Lu, Y.; He, M.; Xie, J.; Zhong, M.; Zhang, Y.; et al. Cadmium induced Drp1-dependent mitochondrial fragmentation by disturbing calcium homeostasis in its hepatotoxicity. Cell Death Dis. 2013, 4, e540. [Google Scholar] [CrossRef] [PubMed] [Green Version]
  76. Ge, J.; Zhang, C.; Sun, Y.C.; Zhang, Q.; Lv, M.W.; Guo, K.; Li, J.L. Cadmium exposure triggers mitochondrial dysfunction and oxidative stress in chicken (Gallus gallus) kidney via mitochondrial UPR inhibition and Nrf2-mediated antioxidant defense activation. Sci. Total Environ. 2019, 689, 1160–1171. [Google Scholar] [CrossRef] [PubMed]
  77. Shirendeb, U.; Reddy, A.P.; Manczak, M.; Calkins, M.J.; Mao, P.; Tagle, D.A.; Reddy, P.H. Abnormal mitochondrial dynamics, mitochondrial loss and mutant huntingtin oligomers in Huntington’s disease: Implications for selective neuronal damage. Hum. Mol. Genet. 2011, 20, 1438–1455. [Google Scholar] [CrossRef] [Green Version]
  78. Davies, J.E.; Sarkar, S.; Rubinsztein, D.C. The ubiquitin proteasome system in Huntington’s disease and the spinocerebellar ataxias. BMC Biochem. 2007, 8 (Suppl. 1), S2. [Google Scholar] [CrossRef] [Green Version]
  79. Fukui, H.; Moraes, C.T. Extended polyglutamine repeats trigger a feedback loop involving the mitochondrial complex III, the proteasome and huntingtin aggregates. Hum. Mol. Genet. 2007, 16, 783–797. [Google Scholar] [CrossRef] [Green Version]
  80. Zainelli, G.M.; Ross, C.A.; Troncoso, J.C.; Muma, N.A. Transglutaminase cross-links in intranuclear inclusions in Huntington disease. J. Neuropathol. Exp. Neurol. 2003, 62, 14–24. [Google Scholar] [CrossRef] [Green Version]
  81. Yu, X.; Hong, S.; Faustman, E.M. Cadmium-induced activation of stress signaling pathways, disruption of ubiquitin-dependent protein degradation and apoptosis in primary rat Sertoli cell-gonocyte cocultures. Toxicol. Sci. 2008, 104, 385–396. [Google Scholar] [CrossRef] [Green Version]
  82. Liu, W.J.; Ye, L.; Huang, W.F.; Guo, L.J.; Xu, Z.G.; Wu, H.L.; Yang, C.; Liu, H.F. p62 links the autophagy pathway and the ubiqutin-proteasome system upon ubiquitinated protein degradation. Cell. Mol. Biol. Lett. 2016, 21, 29. [Google Scholar] [CrossRef] [PubMed] [Green Version]
  83. Ding, W.-X.; Yin, X.-M. Mitophagy: Mechanisms, pathophysiological roles, and analysis. Biol. Chem. 2012, 393, 547–564. [Google Scholar] [CrossRef] [Green Version]
  84. Heng, M.Y.; Detloff, P.J.; Paulson, H.L.; Albin, R.L. Early alterations of autophagy in Huntington disease-like mice. Autophagy 2010, 6, 1206–1208. [Google Scholar] [CrossRef] [Green Version]
  85. Duprez, L.; Wirawan, E.; Vanden Berghe, T.; Vandenabeele, P. Major cell death pathways at a glance. Microbes Infect. 2009, 11, 1050–1062. [Google Scholar] [CrossRef]
  86. Trettel, F.; Rigamonti, D.; Hilditch-Maguire, P.; Wheeler, V.C.; Sharp, A.H.; Persichetti, F.; Cattaneo, E.; MacDonald, M.E. Dominant phenotypes produced by the HD mutation in STHdh(Q111) striatal cells. Hum. Mol. Genet. 2000, 9, 2799–2809. [Google Scholar] [CrossRef] [Green Version]
  87. Kwakye, G.F.; Li, D.; Bowman, A.B. Novel high-throughput assay to assess cellular manganese levels in a striatal cell line model of Huntington’s disease confirms a deficit in manganese accumulation. Neurotoxicology 2011, 32, 630–639. [Google Scholar] [CrossRef] [Green Version]
  88. Bryan, M.R.; Uhouse, M.A.; Nordham, K.D.; Joshi, P.; Rose, D.I.; O’Brien, M.T.; Aschner, M.; Bowman, A.B. Phosphatidylinositol 3 kinase (PI3K) modulates manganese homeostasis and manganese-induced cell signaling in a murine striatal cell line. Neurotoxicology 2018, 64, 185–194. [Google Scholar] [CrossRef]
  89. Bryan, M.R.; O’Brien, M.T.; Nordham, K.D.; Rose, D.I.; Foshage, A.M.; Joshi, P.; Nitin, R.; Uhouse, M.A.; Di Pardo, A.; Zhang, Z.; et al. Acute manganese treatment restores defective autophagic cargo loading in Huntington’s disease cell lines. Hum. Mol. Genet. 2019, 28, 3825–3841. [Google Scholar] [CrossRef]
  90. Bryan, M.R.; Nordham, K.D.; Rose, D.I.; O’Brien, M.T.; Joshi, P.; Foshage, A.M.; Gonçalves, F.M.; Nitin, R.; Uhouse, M.A.; Aschner, M.; et al. Manganese Acts upon Insulin/IGF Receptors to Phosphorylate AKT and Increase Glucose Uptake in Huntington’s Disease Cells. Mol. Neurobiol. 2020, 57, 1570–1593. [Google Scholar] [CrossRef] [PubMed]
  91. Rigg, N.; Abu-Hijleh, F.A.; Patel, V.; Mishra, R.K. Ketamine-induced neurotoxicity is mediated through endoplasmic reticulum stress in vitro in STHdhQ7/Q7 cells. Neurotoxicology 2022, 91, 321–328. [Google Scholar] [CrossRef] [PubMed]
  92. Chong, M.J.; Murray, M.R.; Gosink, E.C.; Russell, H.R.; Srinivasan, A.; Kapsetaki, M.; Korsmeyer, S.J.; McKinnon, P.J. Atm and Bax cooperate in ionizing radiation-induced apoptosis in the central nervous system. Proc. Natl. Acad. Sci. USA 2000, 97, 889–894. [Google Scholar] [CrossRef] [PubMed] [Green Version]
  93. Snyder, H.; Mensah, K.; Theisler, C.; Lee, J.; Matouschek, A.; Wolozin, B. Aggregated and monomeric alpha-synuclein bind to the S6’ proteasomal protein and inhibit proteasomal function. J. Biol. Chem. 2003, 278, 11753–11759. [Google Scholar] [CrossRef] [PubMed] [Green Version]
Figure 1. HD striatal cells are more sensitive to Cd-induced cell death compared with WT. (A) Representative qualitative images and (B) quantitative analyses of cell death in WT and HD cells after exposure to 40 µM CdCl2 were examined at 0, 6, 12, and 24 h using an SYTOX Green cell death assay and Hoechst DNA stain. Cell death is expressed as the percentage of the respective vehicle. Results are represented by the mean ±  SEM from four biological replicates (N = 4). Sidak’s multiple comparison test compared the effect of Cd-induced cell death between genotypes at the indicated time points (* p < 0.01). Images at 10× magnification.
Ijms 24 07178 g001
Figure 2. HD striatal cells exhibit reduced mitochondrial bioenergetics compared with WT upon acute Cd exposure. (A) Representative qualitative brightfield images of JC-1 dye (red J aggregates and green monomers) and Hoechst DNA stain (blue) staining, and (B) quantitative representations of MMP upon exposure to 40 µM CdCl2 for 0, 6, and 24 h. MMP is represented as a ratio of red J-aggregates to green monomers normalized to its respective vehicle control. Results are represented by the mean  ±  SEM from four biological replicates (N = 4). (C) Cellular ATP measurement in WT and HD cells upon 40 µM Cd exposure at the indicated time points. Results are represented by the mean  ±  SEM from four biological replicates (N = 4). Sidak’s multiple comparison test compared the effect of Cd on MMP and cellular ATP levels between genotypes at the indicated time points (*** p < 0.001, **** p < 0.0001, Student’s t-test). Images at 20× magnification.
Ijms 24 07178 g002
Figure 3. Effect of Cd exposure on the expression of mitochondrial fission proteins in WT and HD striatal cells. (A) Representative confocal images show the effect of 40 µM CdCl2 exposure on the expression of DRP1 (green) and FIS1 (red) co-stained with DAPI (blue) upon 0, 6, 12, and 24 h exposures. Scale bar: 50 µm. (B) Western blot analysis of DRP1 and (C) FIS1 protein expression. Quantitative immunoblotting data is represented as percent expression relative to the respective control within each genotype. Representative images of Western blot analysis are shown. Results are represented by the mean  ±  SEM from four to nine biological replicates (N = 4–9). ns indicates no significant difference between genotypes at the indicated exposure time. Sidak’s multiple comparison test compared the effect of Cd on endogenous DRP1 and FIS1 expression between genotypes at the indicated time points (significant differences: * p < 0.05 and *** p < 0.001, Student’s t-test). Sidak’s multiple comparison test compared all treatments back to the vehicle for each genotype. Images at 63× magnification.
Ijms 24 07178 g003
Figure 4. Cd exposure reduces the expression of the pro-fusion mitochondrial protein in HD striatal cells. (A) Representative confocal images showing the expression of MFN1 (green) and MFN2 (red) co-stained with DAPI (blue) following 40 µM CdCl2 exposure for 0, 6, 12, and 24 h. Scale bar: 50 µm. (B) Immunoblotting analysis of MFN1 and (C) MFN2 in WT and HD striatal cells exposed to 40 µM Cd for the indicated time points. Quantitative immunoblotting data is represented as percent expression relative to the respective control within each genotype. Representative images of Western blot analysis are shown. Results are represented by the mean  ±  SEM from four to six biological replicates (N = 4–6). Sidak’s multiple comparison test compared the effect of Cd on endogenous MFN1 and MFN2 expression between genotypes at the indicated time points (significant difference: * p < 0.05, **** p < 0.0001, Student’s t-test). ns indicates no significant difference between genotypes at the indicated exposure time. Sidak’s multiple comparison test compared all treatments back to the vehicle for each genotype. # indicates statistical significance (p < 0.05) compared with the respective negative controls. Images at 63× magnification.
Ijms 24 07178 g004
Figure 5. Cd upregulates autophagy-related proteins in HD striatal cells. Representative confocal images of (A), p62 (red), (B), LC3 (green), and DAPI (blue) expression in WT and HD cells upon 40 µM CdCl2 exposure at the indicated time points. Scale bar: 50 µm. Representative immunoblotting and quantification of (C) p62, (D) LC3-II/I, and (E) ATG5 in WT and HD striatal cells after 40 µM CdCl2 at the indicated time points. Quantitative immunoblotting data is represented as percent expression relative to the respective control within each genotype. Results are represented by the mean  ±  SEM from nine to fourteen biological replicates (N = 9–14). Sidak’s multiple comparison test compared the effect of Cd on endogenous p62, LC3, and ATG5 expression between genotypes at the indicated time points (significant differences: * p < 0.05, ** p < 0.01, and **** p < 0.001 for CE). # indicates statistical significance (p < 0.05) compared with the respective negative controls. Images at 63× magnification.
Ijms 24 07178 g005
Figure 6. Effect of Cd exposure on UPS function and cytochrome C release. (A) Proteasomal activity was measured in WT and HD cells using a specific fluorogenic peptide substrate after exposure to 40 µM CdCl2 at the indicated time points. Proteasomal activity was normalized by the protein concentration and expressed as the percentage of vehicle-treated control cells. Results are represented by the mean  ±  SEM from eight biological replicates (N = 8). Sidak’s multiple comparison test compared the effect of Cd on proteasomal activity between genotypes at the indicated time points (significant difference: *** p < 0.001). (B) Representative Western blot of endogenous protein levels of cytochrome C (Cyto. C) after exposure to 40 µM CdCl2 for 0, 6, 12, and 24 h. Quantitative immunoblotting data is represented as percent expression relative to the respective control within each genotype. Results are represented by the mean  ±  SEM from four biological replicates (N = 4).
Ijms 24 07178 g006
Figure 7. A proposed model describing the pathogenic sequence of cell death signaling events in Cd-triggered deficits in mitochondrial health and function and protein degradation pathways. HD cells at baseline exhibit reduced mitochondrial biogenesis. HD cells, in tandem with Cd exposure, exacerbate perturbations in MMP, inhibit proteasomal activity, and augment autophagic pathways. Prolonged maintenance of these pathogenic mechanisms leads to defective mitochondrial function-mediated cell death.
Ijms 24 07178 g007
Disclaimer/Publisher’s Note: The statements, opinions and data contained in all publications are solely those of the individual author(s) and contributor(s) and not of MDPI and/or the editor(s). MDPI and/or the editor(s) disclaim responsibility for any injury to people or property resulting from any ideas, methods, instructions or products referred to in the content.

