Article

The Combination of Natural Molecules Naringenin, Hesperetin, Curcumin, Polydatin and Quercetin Synergistically Decreases SEMA3E Expression Levels and DPPIV Activity in In Vitro Models of Insulin Resistance

by
Emanuele-Salvatore Scarpa
1,*,
Chiara Giordani
2,
Antonella Antonelli
1,
Massimiliano Petrelli
3,
Giancarlo Balercia
4,
Francesca Silvetti
3,
Alessio Pieroni
3,
Jacopo Sabbatinelli
2,5,
Maria Rita Rippo
2,
Fabiola Olivieri
2,6 and
Giulia Matacchione
2
1
Department of Biomolecular Sciences, University of Urbino Carlo Bo, 61029 Urbino, Italy
2
Department of Clinical and Molecular Sciences (DISCLIMO), Università Politecnica delle Marche, 60126 Ancona, Italy
3
Clinic of Endocrinology and Metabolic Diseases, Department of Clinical and Molecular Sciences, Università Politecnica delle Marche, 60126 Ancona, Italy
4
Division of Endocrinology, Department of Clinical and Molecular Sciences, Università Politecnica delle Marche, 60126 Ancona, Italy
5
Laboratory Medicine Unit, Azienda Ospedaliero Universitaria delle Marche, 60126 Ancona, Italy
6
Clinic of Laboratory and Precision Medicine, IRCCS Istituto Nazionale di Ricovero e Cura per Anziani, 60121 Ancona, Italy
*
Author to whom correspondence should be addressed.
Int. J. Mol. Sci. 2023, 24(9), 8071; https://doi.org/10.3390/ijms24098071
Submission received: 20 April 2023 / Revised: 27 April 2023 / Accepted: 28 April 2023 / Published: 29 April 2023
(This article belongs to the Collection State-of-the-Art Bioactives and Nutraceuticals in Italy)

Abstract

:
Type 2 diabetes mellitus (T2DM) is a disease characterized by a prolonged hyperglycemic condition caused by insulin resistance mechanisms in muscle and liver, reduced insulin production by pancreatic β cells, and a chronic inflammatory state with increased levels of the pro-inflammatory marker semaphorin 3E. Phytochemicals present in several foods have been used to complement oral hypoglycemic drugs for the management of T2DM. Notably, dipeptidyl peptidase IV (DPPIV) inhibitors have demonstrated efficacy in the treatment of T2DM. Our study aimed to investigate, in in vitro models of insulin resistance, the ability of the flavanones naringenin and hesperetin, used alone and in combination with the anti-inflammatory natural molecules curcumin, polydatin, and quercetin, to counteract the insulin resistance and pro-inflammatory molecular mechanisms that are involved in T2DM development. Our results show for the first time that the combination of naringenin, hesperetin, curcumin, polydatin, and quercetin (that mirror the nutraceutical formulation GliceFen®, Mivell, Italy) synergistically decreases expression levels of the pro-inflammatory gene SEMA3E in insulin-resistant HepG2 cells and synergistically decreases DPPIV activity in insulin-resistant Hep3B cells, indicating that the combination of these five phytochemicals is able to inhibit pro-inflammatory and insulin resistance molecular mechanisms and could represent an effective innovative complementary approach to T2DM pharmacological treatment.

1. Introduction

Type 2 diabetes mellitus (T2DM) is a chronic disease characterized by a prolonged hyperglycemic state caused by a combination of underlying defects, which include insulin tolerance in muscle and liver and reduced insulin production by pancreatic β cells. The β cell dysfunction results from deficient glucose sensing and, thus, decreased insulin release, leading to an increase in glucose concentrations in the patients’ blood [1]. Noteworthy genetic and environmental factors, such as a high-fat diet and sedentary lifestyle, can fuel chronic inflammation, worsening hyperglycemia and insulin resistance and thus promoting T2DM progression [2]. Notably, phytochemicals have been used as complements to the most commonly prescribed oral hypoglycemic agents (i.e., sulfonylureas, biguanides, troglitazone, α-glucosidase inhibitors, and thiazolidinediones) for the management of T2DM [3]. Furthermore, conventional drug treatments fail to achieve rigorous metabolic control in more than 50% of T2DM cases, necessitating the search for novel antidiabetic agents that mimic or enhance the properties of insulin as well as protect against diabetic complications [4]. Increasing evidence suggests that natural molecules and functional foods could contribute to ameliorating diabetic syndromes via different mechanisms of action, including enhanced insulin secretion and sensitivity, glucose uptake, and inhibition of glucose absorption from the intestine, along with demonstrated anti-inflammatory properties [5]. In this framework, it was shown that the citrus flavonoids naringenin (NAR) and hesperetin (HES) possess antidiabetic potential, exerted through anti-inflammatory and antioxidant activities and the inhibition of insulin resistance mechanisms [6]. Noteworthy, it was demonstrated that the phytochemicals naringin and its aglycone NAR, have potent anti-diabetic effects in nicotinamide/streptozotocin-induced type 2 diabetic rats via their insulin-improving action, which is mediated through the enhancement of insulin receptor (INSR) and glucose transporter type 4 (GLUT4) levels [7]. Furthermore, it was shown that NAR and HES protected pancreatic β cells in both in vitro and in vivo models; interestingly, the inhibition of thioredoxin-interacting protein expression, regulated by histone acetylation, was critical for the protective role of NAR and HES, which inhibited β cell dysfunction in diabetic db/db mice [8]. Curcumin (CUR) is an active molecule present in the rhizome of the Curcuma longa plant [9]. The biological and pharmacological effects of CUR include antioxidant, anti-inflammatory, and hypoglycemic effects [10,11,12]. Polydatin (POL) is a glucoside of resveratrol and is the key component of Polygonum cuspidatum [13]. POL has hypoglycemic, antioxidant, and anti-inflammatory activities [14,15]. Interestingly, it was shown that POL treatment improved glucose metabolism by decreasing fasting blood glucose and glycosylated hemoglobin levels in an in vivo experimental model [16]. The flavonoid quercetin (QRC), which can be found in several fruits and vegetables, is able to inhibit lipid peroxidation and possesses anti-inflammatory, antioxidant, and antidiabetic properties [17]. Interestingly, it was shown that QRC and coumarin can remarkably inhibit dipeptidyl peptidase IV (DPPIV) catalytic activity [4]. DPPIV inhibitors provide a potent treatment for T2DM by prolonging the activity of glucagon-like peptide 1 (GLP-1), improving insulin secretion, reducing blood glucose levels, and inhibiting the molecular pathways of insulin resistance [18]. Noteworthy, aberrant activation of the nucleotide-binding domain, leucine-rich containing family, and pyrin domain-containing-3 (NLRP3) inflammasome is responsible for the progression of several human diseases, including septic shock, atherosclerosis, Alzheimer’s disease, and T2DM [19]. Notably, the activation of the inflammasome leads to the maturation and activation of the pro-inflammatory enzyme caspase 1 [20]. It is known that the transcription factor p53 plays a pivotal role in the regulation of glucose metabolism and insulin resistance through molecular pathways involved in the development of T2DM [21]. Indeed, p53 can suppress glucose transport and entry into cells by directly repressing the transcription of the genes glucose transporter type 1 (GLUT1), glucose transporter type 3 (GLUT3), and GLUT4, leading to an increase in blood glucose levels [21]. In addition, it represses the promoter of the INSR gene, thereby inhibiting glucose uptake and inducing insulin resistance [21]. Oxidative stress and radical oxygen species (ROS) can activate p53, which induces the transcription of the semaphorin 3E (SEMA3E) gene, which is involved in the development of both pro-inflammatory processes and insulin resistance mechanisms [22]. Furthermore, it was shown that the transcription factor p63 can increase the expression levels of sirtuin 1 (SIRT1), which is able to deacetylate p53, leading to its destabilization and inactivation [23]. This scientific evidence indicates that p53 activation by metabolic stress can promote diabetes progression by regulating several molecular pathways in adipose tissue, the pancreas, and the liver [21]. In our work, we employed two hepatic cell lines: HepG2 and Hep3B. HepG2 cells represent a TP53 wt cell line [24], while Hep3B cells represent a TP53mut cell line, where p53 function is impaired by the TP53-Fragile X mental retardation syndrome-related protein 2 (FXR2) fusion [25]. In our study, we investigated, in in vitro models of insulin-resistant hepatic cells [26,27], the ability of the flavanones NAR and HES, used alone and in combination with the natural compounds CUR, POL, and QRC, to counteract the insulin resistance and pro-inflammatory molecular mechanisms that are involved in T2DM development. Notably, it was shown that in young and replicative senescent HUVEC cells exposed to a high-glucose condition and treated with CUR, POL, and QRC, used individually or in combination, the phytochemical combination of these three natural molecules exerted synergistic anti-inflammatory and antioxidant activities [28].

2. Results and Discussion

2.1. Evaluation of HepG2 and Hep3B Cell Viability after NAR, HES, N + H, C + P + Q, MIX Treatments

We first evaluated the cell viability of HepG2 and Hep3B cells treated for 24 h with different concentrations of NAR and HES, used individually and in combination (N + H) (Figure 1). The results of dose-response cytotoxicity experiments with 0–240 µM NAR and 0–240 µM HES showed that NAR induced a cytotoxic effect in HepG2 cells already at 60 µM concentration with a further decrease of cell viability at 120 µM and 240 µM concentrations (Figure 1A), while in Hep3B cells only the 120 µM and 240 µM NAR treatments induced a significant cytotoxic effect (Figure 1D). When HepG2 and Hep3B cells were treated with the natural compound HES, only the 120 µM and 240 µM HES concentrations were able to significantly decrease the cell viability of both cell lines (Figure 1B,E).
These dose-response experiments allowed us to select the 30 µM treatment of NAR and the 30 µM treatment of HES for the RTqPCR assays, the western blots, the caspase 1 activity assays, and the DPPIV catalytic activity experiments. In addition, we tested the effect of the N + H treatment on the viability of HepG2 and Hep3B cells. Our results showed that the phytochemical combination did not induce any significant cytotoxic effect either in HepG2 (Figure 1C) or in Hep3B (Figure 1F) cell lines, which showed residual cell viability values > 70% (Figure 1). Furthermore, our results indicated that the C + P + Q treatment and the combination of the five natural molecules NAR, HES, CUR, POL, and QRC (MIX) did not induce any cytotoxic effects in both HepG2 and Hep3B cells (Figure 1C,F).

2.2. Modulation of INSR, GLUT2, GLUT3, SIRT1, and SEMA3E Gene Expression Levels in HepG2 and Hep3B Cell Lines

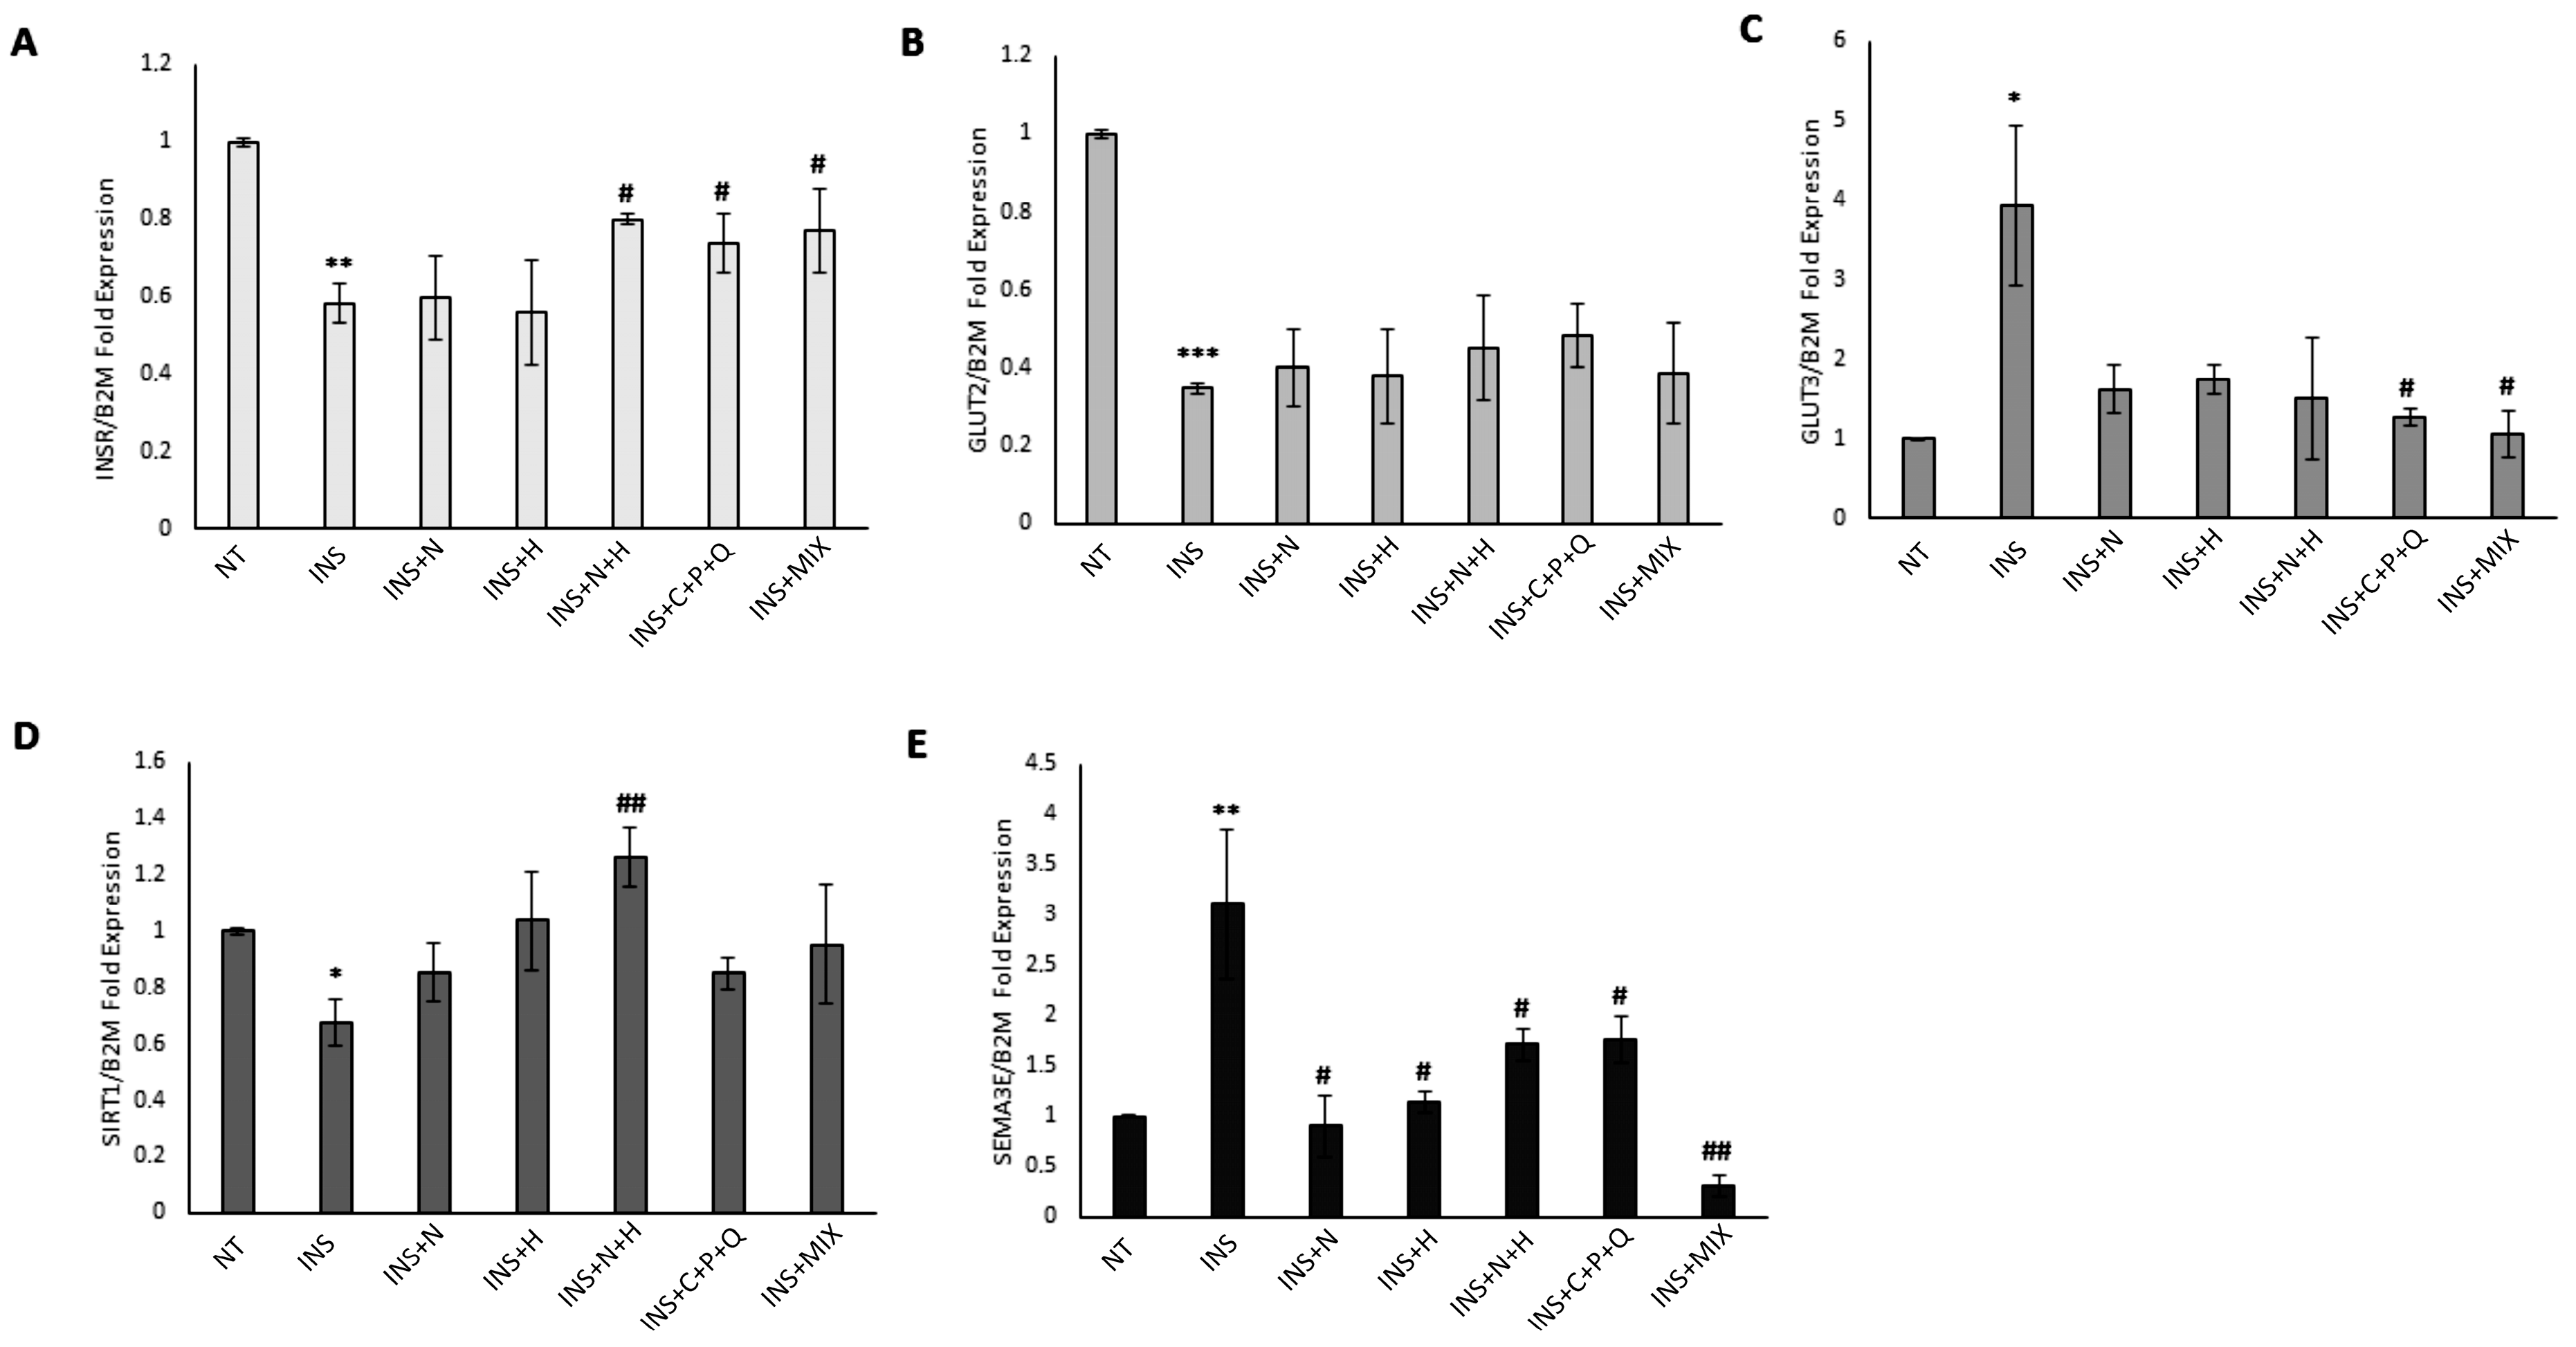
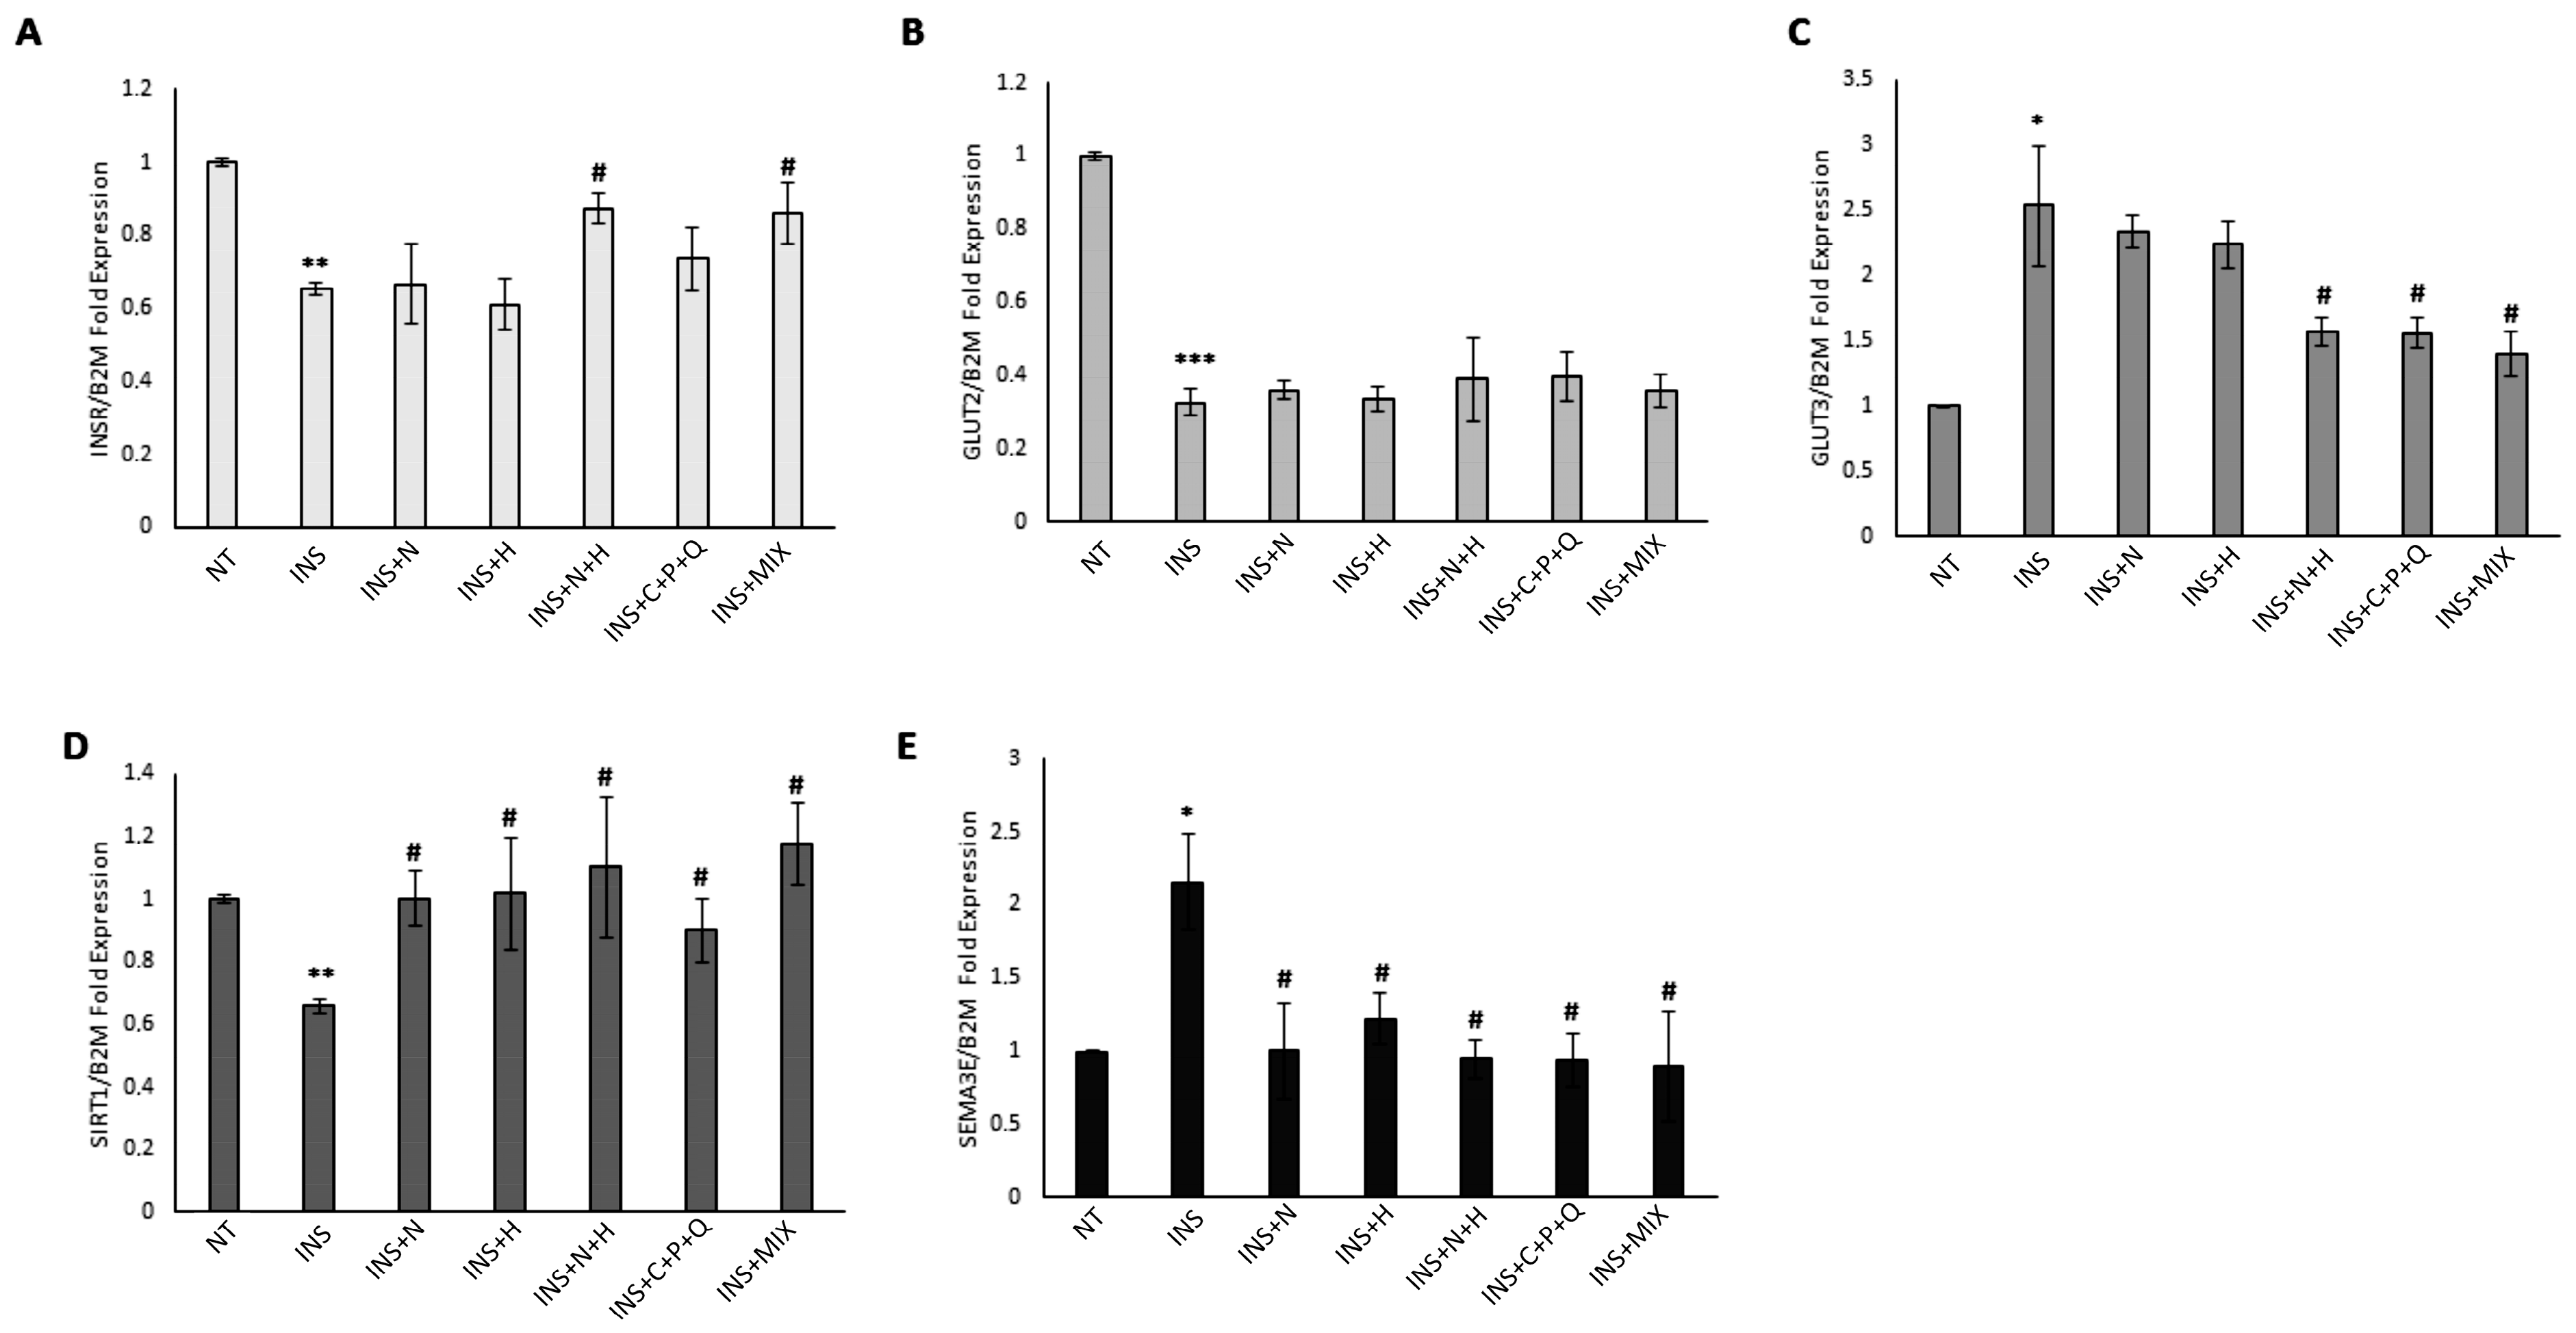
HepG2 and Hep3B cells were treated for 72 h with 500 nM human recombinant insulin to induce a condition of insulin resistance [26]. Our results show that in both cell lines, there was a significant decrease in INSR expression levels (Figure 2A and Figure 3A), indicating that a condition of insulin resistance has been established [26]. RTqPCR data indicate that when NAR and HES were used individually in insulin-treated HepG2 and Hep3B cells, there was not a statistically significant increase in INSR mRNA levels, while the N + H treatment significantly increased the expression levels of this gene in both insulin-treated HepG2 and Hep3B cells (Figure 2A and Figure 3A).
Interestingly, the increase in INSR expression levels induced by the combination of NAR and HES in HepG2 (+36.9%) and Hep3B (+33.7%) was synergic (Table 1), indicating a synergistic inhibition of the molecular mechanisms of insulin resistance in these cell lines.
In addition, C + P + Q treatment was able to significantly increase the INSR expression levels only in HepG2 cells, while MIX treatment induced a significant upregulation of INSR mRNA levels in both HepG2 and Hep3B cell lines (Figure 2A and Figure 3A). Since it was demonstrated that the hypoglycemic properties shown by the phytochemical ginsenoside Rk3 were exerted through the increase of GLUT2 levels in an insulin-resistant HepG2 in vitro model [29], we evaluated the modulation of GLUT2 mRNA levels mediated by our natural compounds. Figure 2B and Figure 3B show that there was a remarkable and significant decrease in GLUT2 expression levels in both insulin-treated HepG2 and Hep3B cells, but the treatments with NAR, HES, N + H, C + P + Q, and MIX were not able to increase GLUT2 mRNA levels. As it was shown that the phytochemical corosolic acid can modulate insulin resistance mechanisms in hepatic cells by decreasing the expression levels of GLUT3 [30], we evaluated the effects of our natural compounds on the modulation of GLUT3 mRNA levels. The insulin treatment significantly increased the GLUT3 expression levels in both HepG2 and Hep3B cell lines (Figure 2C and Figure 3C), and the C + P + Q and MIX treatments were associated with a significant decrease of GLUT3 mRNA levels in these cells (Figure 2C and Figure 3C); in addition, only in Hep3B, the N + H treatment induced a statistically significant decrease of GLUT3 expression levels (Figure 3C). Interestingly, the decrease of GLUT3 mRNA levels induced by the combination of NAR and HES in Hep3B (−38.4%) was synergic (Table 1). Noteworthy, Sirtuin 1 is an NAD+-dependent protein deacetylase with a critical function in the regulation of glucose metabolism, insulin resistance, inflammation, and oxidative stress [31]. Sirtuin 1 is also involved in the regulation of insulin secretion from pancreatic β cells, and its catalytic activity protects these cells from inflammation and oxidative stress-mediated tissue damage. In this regard, several sirtuin 1 activators exerted a beneficial impact in reversing T2DM-related complications [31]. Figure 2D and Figure 3D show that the insulin treatment significantly decreased SIRT1 expression levels in both HepG2 and Hep3B cells, while the N + H treatment was able to remarkably increase SIRT1 mRNA levels in HepG2 (Figure 2D). Interestingly, the increase in SIRT1 expression levels induced by the combination of NAR and HES in HepG2 cells (+87.1%) was synergic (Table 1). Moreover, Figure 3D indicates that NAR, HES, N + H, C + P + Q, and MIX treatments were all able to significantly increase SIRT1 mRNA levels in Hep3B cells. Notably, our RTqPCR results show that there was a statistically significant increase in SEMA3E expression levels in the insulin-treated HepG2 and Hep3B cells (Figure 2E and Figure 3E). Noteworthy, NAR, HES, N + H, C + P + Q, and MIX treatments were all able to significantly decrease the SEMA3E mRNA levels in both cell lines (Figure 2E and Figure 3E). In particular, the decrease of SEMA3E expression levels induced by the MIX treatment in HepG2 cells (−90.1%) was higher than the downregulation mediated by the sum of the effects of the N + H (−45.1%) and C + P + Q treatments (−43.4%), indicating a synergistic inhibition of the molecular mechanisms of insulin resistance and inflammatory conditions exerted by the combination of these five natural molecules in these cells (Table 1). Notably, the values of SEMA3E mRNA levels after MIX treatment in HepG2 cells were significantly different when compared with the SEMA3E mRNA levels obtained after N + H (p = 0.009) and C + P + Q (p = 0.005) treatments. We hypothesize that the synergistic and remarkable decrease of SEMA3E expression levels exerted by the MIX treatment in only HepG2 cells could be associated with the different TP53 status of HepG2 (p53 wt) and Hep3B (p53-Null) cell lines since it was shown that p53 induces the transcription of the SEMA3E gene [22]. Interestingly, Tsvetkov et al. [32] have demonstrated that CUR inhibits the activity of NADPH quinone oxidoreductase 1, leading to the ubiquitin-independent degradation of p53. In addition, Zeng Z. et al. [33] have shown that POL-dependent activation of the deacetylase sirtuin 1 induced a decrease in the levels of acetylated p53, leading to the inactivation of this transcription factor and a decrease in the expression levels of the genes regulated by p53. This scientific evidence indicates that the synergistic decrease in SEMA3E mRNA levels exerted by the MIX treatment in HepG2 cells could be associated with the combined effects of CUR and POL phytochemicals. Notably, it was shown that semaphorin 3E promotes the insulin resistance condition through the inhibition of Ak strain-transforming (AKT) phosphorylation, a marker involved in the activation of insulin signaling [34]. Interestingly, it was demonstrated that patients with diabetes show increased plasma levels of semaphorin 3E, indicating a role for semaphorin 3E-plexin D1 (semaphorin 3E receptor) signaling in diabetes development [22]. In fact, the same authors have shown in an in vivo experimental model that delivery of a soluble form of plexin D1 was able to counteract the detrimental effects of semaphorin 3E, including the recruitment of macrophages in adipose tissue, the macrophage-mediated release of pro-inflammatory molecules Interleukin-6 (IL-6) and tumor necrosis factor-α (TNF-α), and the induction of insulin resistance mechanisms [22].

2.3. Modulation of INSR and Semaphorin 3E Protein Levels in HepG2 and Hep3B Cell Lines

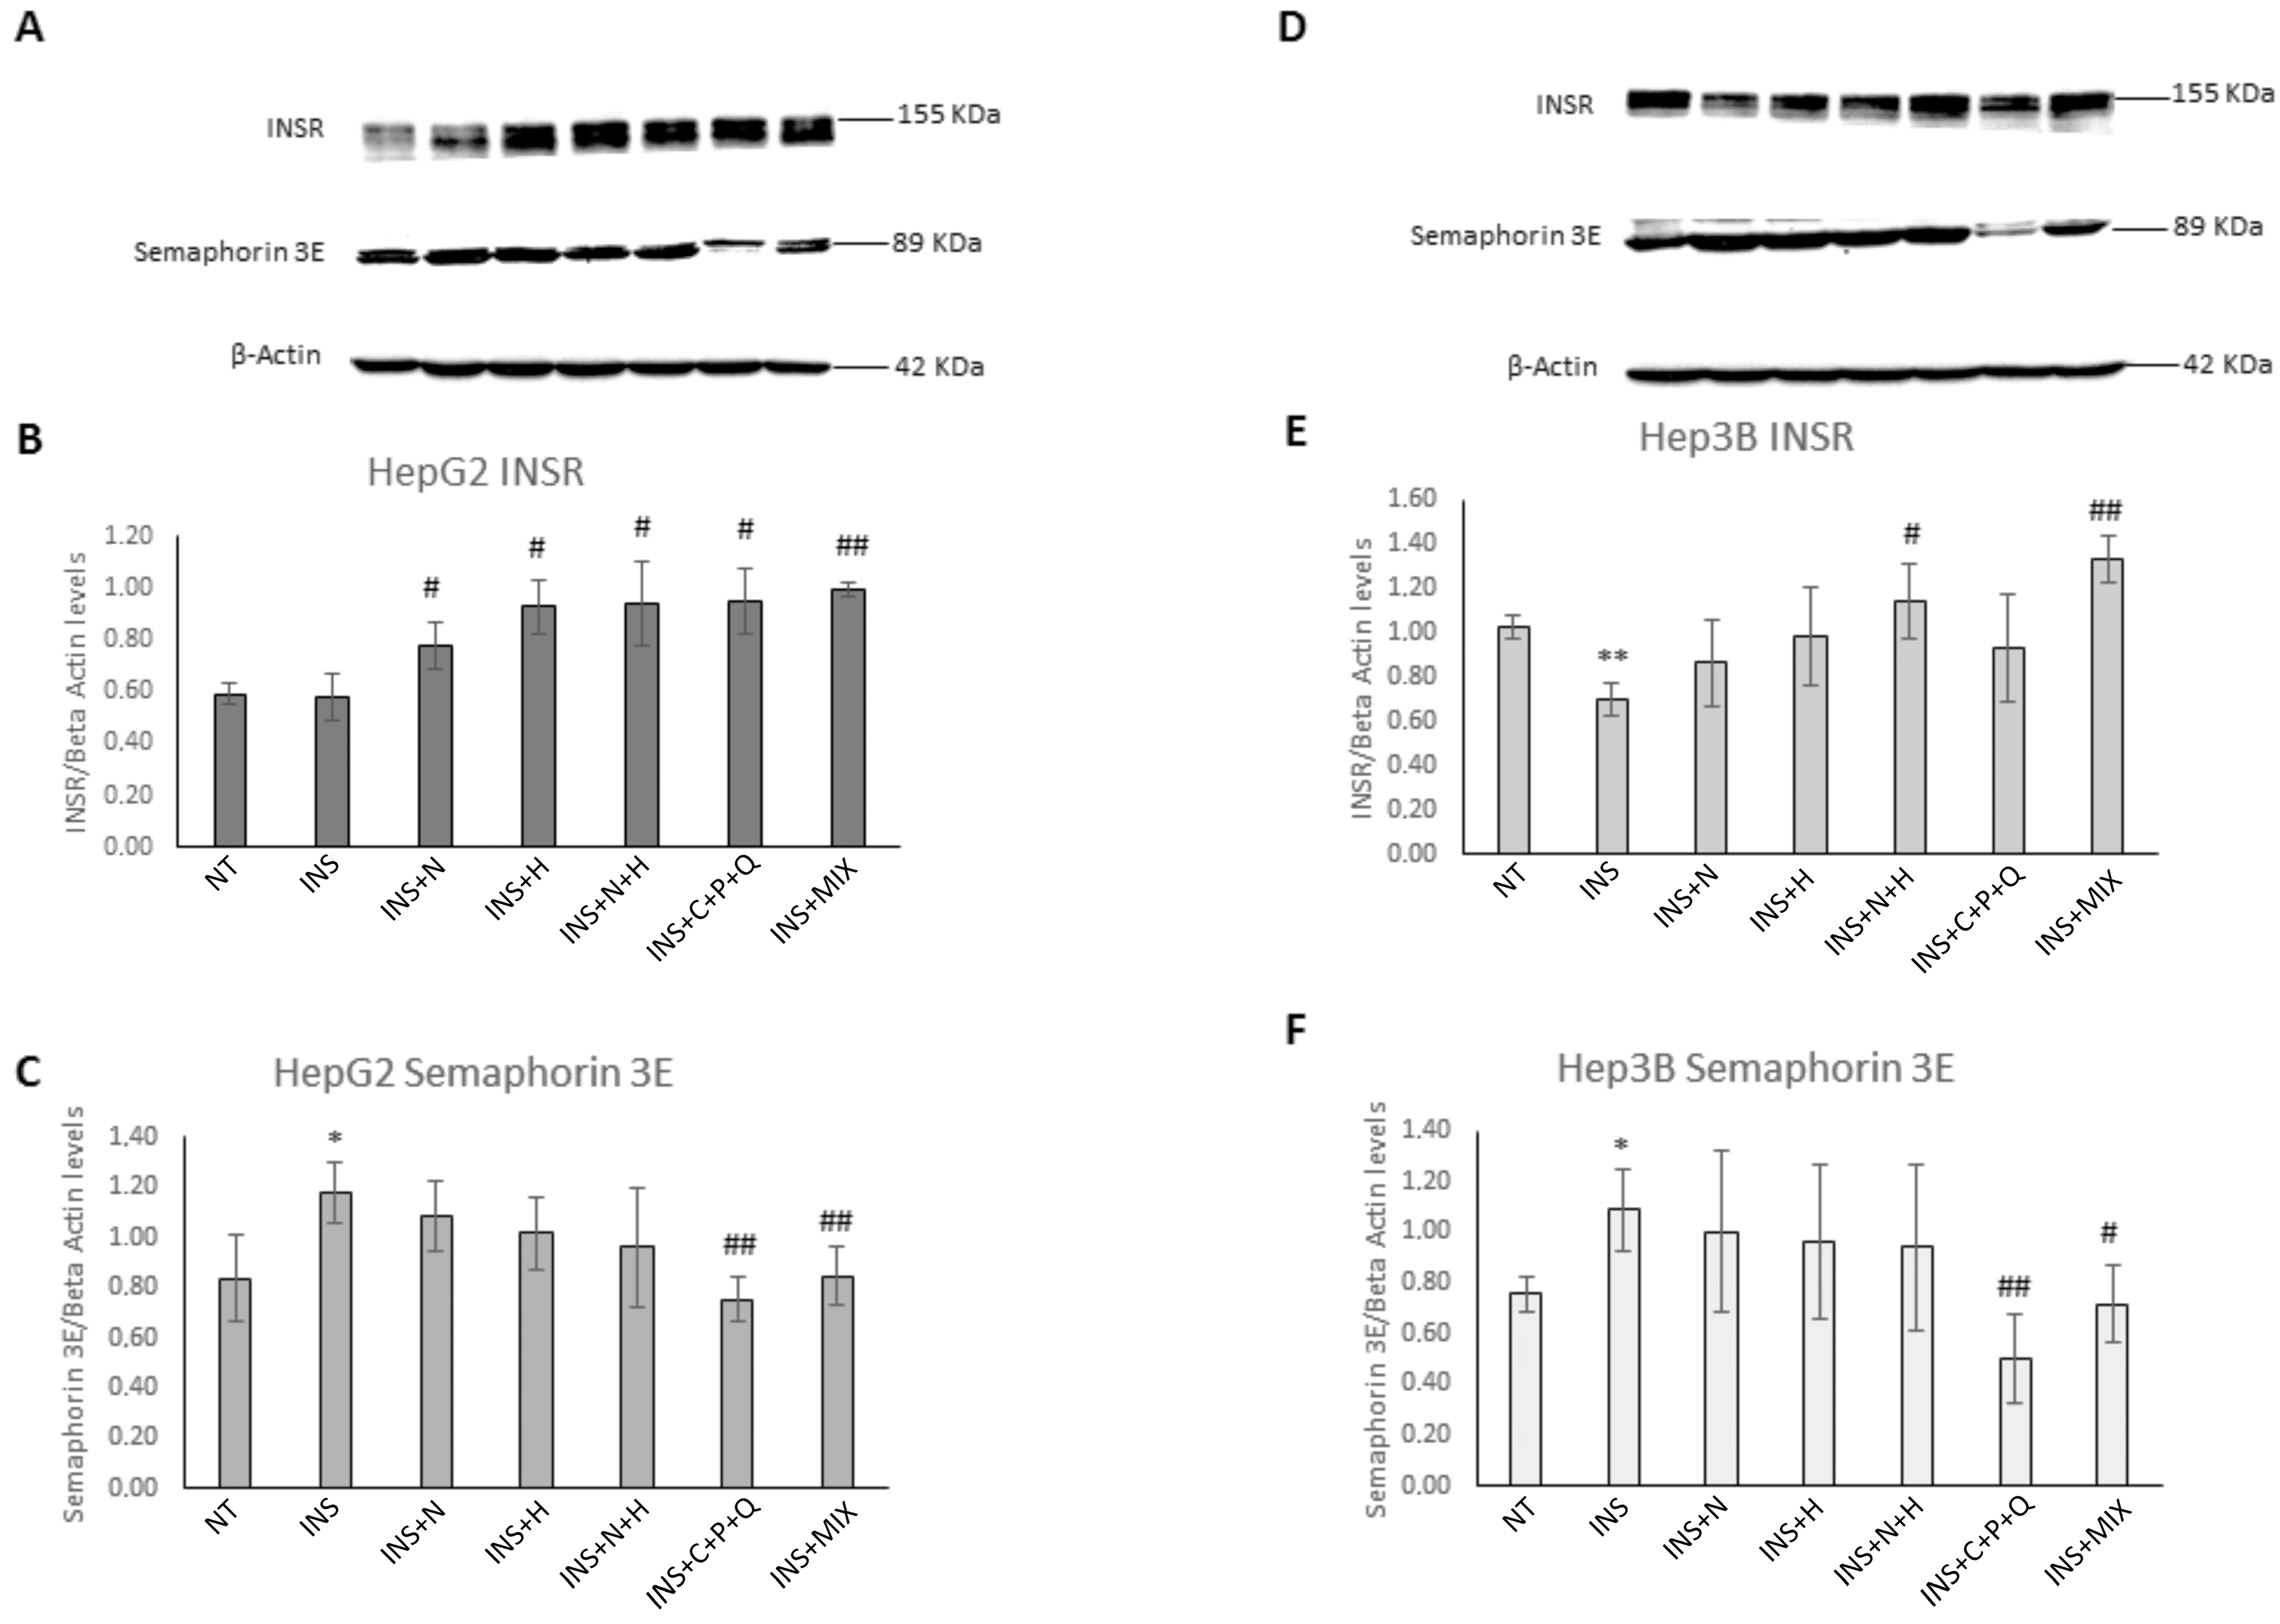
As it was shown that the increase of INSR mRNA and protein levels plays a pivotal role in counteracting insulin resistance mechanisms [35] and that the protein Semaphorin 3E promotes the insulin resistance condition through the inhibition of Akt phosphorylation, a marker involved in the activation of insulin signaling [34], we evaluated, through western blot assays, if NAR, HES, N + H, C + P + Q, and MIX treatments were able to modulate the protein levels of these two markers involved in insulin resistance molecular pathways and in T2DM development. Insulin signaling begins with the binding of this hormone to its cell surface receptor, activation of the receptor tyrosine kinase, and tyrosine phosphorylation of insulin receptor substrate (IRS) proteins, which assemble a signaling complex that includes proteins such as phosphoinositide 3-kinase (PI3K) [35]. This event generates an increase in phosphatidylinositol 3,4,5-trisphosphate levels, leading to the recruitment of Ser/Thr protein kinases such as AKT and 3-phosphoinositide-dependent kinase 1 (PDK1), which phosphorylates AKT at one of its activating sites (Thr308). Partially active AKT phosphorylates and activates mammalian target of rapamycin complex 2 (mTORC2), which phosphorylates AKT at Ser473, leading to full AKT activation [35]. AKT plays a pivotal role in the insulin signaling pathway as it has more than 100 substrates and mediates most, if not all, of the physiological metabolic actions of insulin. Noteworthy, AKT plays an important role in insulin regulated GLUT4 translocation, at least in part by phosphorylating TBC1 domain family member 4 (TBC1D4), which controls the activity of the GTPase RAB10, which induces GLUT4 translocation to the cell membrane, leading to an increase in glucose uptake by the cells [36]. Interestingly, Figure 4A,B shows that in HepG2 cells, all the phytochemical treatments significantly increased the protein levels of INSR, in particular the MIX (Figure 4B), demonstrating an inhibition of the molecular pathways of insulin resistance. Noteworthy, in Hep3B cells, the INS treatment induced a significant decrease in the INSR protein levels (Figure 4D,E). Notably, Figure 4E shows that only the N + H and MIX treatments were able to significantly increase the INSR protein levels, indicating that the combination of these natural molecules can counteract the insulin resistance mechanisms in Hep3B cells. Interestingly, Figure 4A,C,D,F shows that in HepG2 and Hep3B cells, the insulin treatment induced a significant increase in semaphorin 3E protein levels, and only the C + P + Q and MIX treatments were able to significantly decrease the levels of this pro-inflammatory marker (Figure S1 shows the uncropped blots of images of Figure 4). Our results indicate that these natural molecules can counteract both the pro-inflammatory and insulin resistance pathways modulated by semaphorin 3E. Notably, the protein levels of semaphorin 3E after the MIX treatment in Hep3B cells were significantly different when compared with the semaphorin 3E levels obtained after N + H treatment (p = 0.038) and were similar to those obtained after C + P + Q treatment (p = 0.081). To the best of our knowledge, our study describes for the first time the remarkable decrease of semaphorin 3E protein levels induced by the combination of natural molecules CUR, POL, and QRC in in vitro models of insulin resistance.

2.4. Inhibition of the Catalytic Activity of the Pro-Inflammatory Enzyme Caspase 1 in HepG2 and Hep3B Cells

Noteworthy, it was shown that aberrant activation of the NLRP3 inflammasome is responsible for the progression of several human diseases, including septic shock, atherosclerosis, Alzheimer’s disease, and T2DM [19]. During inflammasome assembly, pro-caspase 1 and sensor proteins are linked by an adapter protein known as an apoptosis-associated speck-like protein containing a caspase-recruitment domain (ASC); this interaction leads to the cleavage and activation of pro-caspase 1 and the maturation of pro-inflammatory cytokines such as Interleukin-1β (IL-1β) or interleukin-18 (IL-18), which are involved in the T2DM pathogenesis [20]. Considering this scientific evidence, we evaluated if NAR, HES, N + H, C + P + Q, and MIX treatments were able to decrease caspase 1 activity in insulin-treated HepG2 and Hep3B cells. Figure 5A,B shows that the insulin treatment significantly increased caspase 1 activity levels in both HepG2 and Hep3B cells, with a higher increase in catalytic activity in the HepG2 cell line. These results indicate that the establishment of the insulin resistance condition induces an inflammation state, which can lead to the development and worsening of the T2DM pathological condition [19]. The NAR, HES, N + H, C + P + Q, and MIX treatments were all able to significantly decrease the caspase 1 activity in HepG2 cells (Figure 5A). In Hep3B cells, the HES, N + H, C + P + Q, and MIX treatments significantly reduced caspase 1 activity levels, while the NAR treatment induced only a slight decrease (Figure 5B).
Interestingly, it was shown that other phytochemicals are also able to inhibit caspase 1 activity: 10-gingerol and the shogaols extracted from ginger [37]. The authors demonstrated that shogaols and 10-gingerol inhibited IL-1β secretion, reduced NLRP3 levels, and decreased the ATP-induced activation of the pro-inflammatory enzyme caspase 1 [37]. Regarding the modulation of inflammasome activity by the investigated phytochemicals NAR, CUR, and POL, it was demonstrated that NAR was able to inhibit the activation of caspase 1 and receptor-interacting protein 2 (RIP2) in the human mast cell line HMC-1 [38]. Furthermore, it was shown that CUR inhibited caspase 1 activation and IL-1β secretion by suppressing the NLRP3-mediated inflammasome activation pathway in an in vitro experimental model [39]. Notably, it was demonstrated that POL was able to decrease caspase 1, ASC, and NLRP3 protein levels in an in vivo experimental model, leading to the inhibition of pro-inflammatory cytokine production in serum and kidney [40].

2.5. Inhibition of the Catalytic Activity of the Hyperglycemic Enzyme DPPIV in HepG2 and Hep3B Cells

Interestingly, it was shown that DPPIV inhibitors provide a potent treatment for T2DM, improving insulin secretion, reducing blood glucose levels, and inhibiting the molecular pathways of insulin resistance [18]. Considering this scientific evidence, we evaluated if NAR, HES, N + H, C + P + Q, and MIX treatments were able to decrease the DPPIV activity levels in insulin-treated HepG2 and Hep3B cells. Figure 6A,B indicates that the insulin treatment induced a significant increase in DPPIV activity in both HepG2 and Hep3B cells. Furthermore, Figure 6A shows that the NAR, N + H, C + P + Q, and MIX treatments were able to significantly decrease the DPPIV activity levels in HepG2 cells, while the HES treatment induced only a slight decrease. Figure 6B shows that in Hep3B cells, all the treatments (i.e., NAR, HES, N + H, C + P + Q, and MIX) significantly decreased the catalytic activity of DPPIV. Noteworthy, the decrease of DPPIV activity levels induced by the MIX treatment in Hep3B cells (−35.5%) was higher than the decrease mediated by the sum of the effects of the N + H (−16.3%) and C + P + Q (−15.6%) treatments (Table 1), indicating a synergistic inhibition of the molecular pathways of insulin resistance exerted by the combination of these five natural molecules. Regarding the modulation of the DPPIV enzymatic activity exerted by the investigated phytochemicals NAR, HES, and CUR, it was shown that the natural molecules NAR, cirsimarin, hispidulin (obtained from the plant Lippia graveolens), and the bioactives HES, rutin, and eriodictyol, present in three citrus bioflavonoid nutraceuticals, were all able to decrease the catalytic activity of DPPIV [41,42]. Interestingly, it was demonstrated, through molecular docking techniques and in vitro models, that CUR was able to interact with the catalytic site of DPPIV, inhibiting its activity [43]. Notably, it was shown that orally active DPPIV inhibitors, suitable for once-daily administration in patients, have demonstrated efficacy in new therapies for the treatment of T2DM, leading to an increase in GLP-1 levels, a hormone that is cleaved by DPPIV [44]. GLP-1 plays a pivotal role in stimulating insulin secretion, increasing insulin sensitivity, and improving the glycemic profile of patients [44]. Noteworthy, the results of a clinical trial showed that the combination of HES and trans-resveratrol (the aglycone of POL) exerted anti-inflammatory effects and was also able to reverse the insulin resistance condition in overweight and obese patients [45].

3. Materials and Methods

3.1. Natural Compounds

The standards of the following natural compounds have been used: CUR (A218580100, Carlo Erba, Cornaredo, Italy), POL (P1878, TCI, Haven, Belgium), QRC (P0042, TCI, Haven, Belgium), NAR (N0072, TCI, Haven, Belgium), and HES (H0721, TCI, Haven, Belgium).

3.2. Cell Cultures

HepG2 and Hep3B human hepatic cell lines were purchased from the American Type Culture Collection (ATCC, Rockville, Daytona Beach, FL, USA) and maintained in DMEM supplemented with 10% FBS, 2 mM glutamine, 100 U/mL penicillin, 100 μg/mL streptomycin, and 200 μM MEM nonessential amino-acid solution (DMEM complete medium). Cell lines were grown at 37 °C in a humidified atmosphere with 5% CO2.

3.3. Serum Starvation and Insulin Treatments

HepG2 and Hep3B cells were seeded in 6-wells, 12-wells, or 96-wells, then the cell medium was removed and replaced with DMEM supplemented with 2 mM glutamine, 100 U/mL penicillin, 100 μg/mL streptomycin, and 200 μM MEM nonessential amino-acid solution, but without FBS to obtain serum starvation conditions. After 6 h, this medium was removed and replaced with DMEM complete medium. The treated cells were incubated for 72 h with 500 nM human recombinant insulin to induce insulin resistance, while the control cells were grown in DMEM complete medium. After 48 h of insulin treatment, HepG2 and Hep3B cells were incubated for 24 h with the natural compounds.

3.4. Natural Compound Treatments

The natural molecules analyzed in this study are part of the nutraceutical formulation GliceFen® (Mivell, Fano, Italy; Italian Patent Application: 102021000032909). POL, CUR, and QRC were used at concentrations of 10 µM, 1 µM, and 0.5 µM, respectively, as previously described [28]. Based on the results of cell viability assays, HepG2 and Hep3B cells were treated with 30 µM NAR and 30 µM HES. The treatments with the single phytochemicals NAR and HES, the mix of 30 µM NAR and 30 µM HES (N + H), the combination of 1 µM CUR, 10 µM POL, and 0.5 µM QRC (C + P + Q), and the combination of 30 µM NAR, 30 µM HES, 1 µM CUR, 10 µM POL, and 0.5 µM QRC (MIX) were performed for 24 h. Noteworthy, the combination of phytochemicals exerts a synergistic effect when the observed biological effect of the combination of the natural molecules is greater than the sum of the biological effects of the individual natural molecules.

3.5. Cell Viability Assay

HepG2 and Hep3B cells were seeded in 96-well plates at a density of 10,000 cells/well and were grown for 24 h. The treated cells were incubated for 24 h with 0–240 µM NAR or 0–240 µM HES or with the combination of 30 µM NAR + 30 µM HES (N + H) or with C + P + Q or MIX treatments. The control cells were incubated for 24 h with 0.4% DMSO. The effect of natural compounds on cell viability was evaluated using the CellTiter 96 AQueous One Solution Cell Proliferation Assay (Promega s.r.l., Milan, Italy). This assay is based on the reduction of the MTS reagent [3-(4,5-dimethylthiazol-2yl)-5-(3-carboxymethoxyphenyl)-2-(4-sulfophenyl)2H-tetrazolium, inner salt] into a colored formazan product that is soluble in culture medium. This conversion is accomplished by NADPH or NADH produced by dehydrogenase enzymes in metabolically active cells. The quantity of formazan product, measured by absorbance at 490 nm with the Biotek Synergy H1 plate reader (Agilent, Santa Clara, California; USA), is directly proportional to the number of living cells in the culture. The results were expressed as a percentage of residual cell viability compared to control cells (CTRL) treated with 0.4% DMSO (set at 100% cell viability) for both HepG2 and Hep3B cell lines.

3.6. Real-Time Quantitative Polymerase Chain Reaction (RTqPCR)

HepG2 and Hep3B cells were seeded in 12-well plates at a concentration of 150,000 cells/well and grown for 24 h The cells were then treated as described in Section 3.3 and Section 3.4. In particular, after 48 h of insulin treatment, HepG2 and Hep3B cells were incubated for 24 h with 30 µM NAR or 30 µM HES or with the N + H, C + P + Q, or MIX treatments. For gene-specific expression analysis, total RNA was isolated using the Total RNA Purification Kit of NORGEN Biotek Corp. (Thorold, ON, Canada). A quantity of 1 µg of total RNA was reverse-transcribed using the ImProm-IITM Reverse Transcription System (Promega s.r.l., Milan, Italy) with oligo-dT primers, following the manufacturer’s instructions and according to the following thermal profile: 25 °C for 5 min, 42 °C for 60 min, and 70 °C for 15 min. RTqPCR detection and expression analysis of genes was performed with SYBR green quantitative real-time PCR using the TB green Premix Ex Taq II (Tli RNaseH Plus) Kit (Takara, Kusatsu, Japan), according to the manufacturer’s instructions. Briefly, the reaction was set up in a 20 µL final volume, using 20 ng of cDNA as the template and 200 nM of each specific primer. For RTqPCR amplifications, 40 PCR cycles were run with the following 2-step thermal profile: 5 s at 95 °C and 34 s at 60 °C per cycle; before cycling, 30 s at 95 °C were allowed for Taq DNA polymerase activation. The fluorescence intensity of each amplified sample was measured with the QuantStudio3 sequence detection system (Applied Biosystems, Foster City, CA, USA). All measurements were performed in triplicate and reported as the average values ± standard deviation of the mean (mean ± SD). Target gene values were normalized with β2-microglobulin (B2M) mRNA measurements, and expression data were calculated according to the 2−ΔΔCt Livak method. The sequences of the primers used for RTqPCR assays are reported in Table 2.

3.7. Determination of Caspase 1 Activity

HepG2 and Hep3B cells were seeded on 6-well plates at a density of 300,000 cells/well and grown for 24 h. The cells were then treated as described in Section 3.3 and Section 3.4. After 48 h of insulin treatment, HepG2 and Hep3B cells were incubated for 24 h with 30 µM NAR, 30 µM HES, or the N + H, C + P + Q, or MIX treatments. On the day of the experiment, the medium was removed, and the 6-well plates were put on ice. The cells were washed twice with 1 mL of phosphate buffered saline (PBS) 1×, then 100 μL of cell lysis buffer (Enzo Life Sciences, Farmingdale, NY, USA) were added to each well, and the cells were scraped for 2 min. The lysates from each sample were then recovered and transferred into fresh 1.5 mL tubes. The samples were maintained at −80 °C for 30 min, then unfrozen in ice and sonicated for 20 min at room temperature in a water-sonication bath (Ultrasonic Cleaner, BRANSON 200). The samples were centrifuged at 12,000× g at 4 °C for 10 min, then the supernatants (the cytosols) were recovered and put into fresh 1.5 mL tubes, as previously reported [46]. The protein concentration of each sample was assessed through the Bradford assay (BioRad Laboratories, Hercules, CA, USA), measuring the absorbance values at λ = 595 nm in a Biotek Synergy H1 plate reader. Caspase 1 activity was assessed through the Caspase Colorimetric Assay Kit (Enzo Life Sciences), as previously reported for other caspases [47]. Briefly, 100 μg of cytosol from untreated or phytochemically treated HepG2 and Hep3B cells were incubated with caspase reaction buffer (25 mM Hepes pH 7.4, 50 mM NaCl, 0.05% Triton, 0.5 mM EDTA, 5% glycerol, 5 mM DTT), then the substrate YVAD-pNA (400 μM and 200 μM final concentrations for HepG2 and Hep3B samples, respectively) specific for caspase 1 was added, and the samples were transferred into a 96-well microplate and were incubated at 37 °C for 2 h. The absorbance, representing the activity of caspase 1, was measured at λ = 405 nm in a Biotek Synergy H1 plate reader.

3.8. In Situ Cell-Based DPPIV Activity Assay

HepG2 and Hep3B cells were seeded on black 96-well plates with clear bottoms at a density of 10,000 cells/well and were grown for 24 h. The cells were then treated as described in Section 3.3 and Section 3.4. In particular, after 48 h of insulin treatment, HepG2 and Hep3B cells were incubated for 24 h with 30 µM NAR or 30 µM HES or with the N + H, C + P + Q, or MIX treatments. On the day of the experiment, cells were washed once with 100 µL of PBS, then H-Gly-Pro-AMC (AS-24098, AnaSpec Inc., Fremont, CA, USA) substrate diluted in PBS (5 µM and 1 µM final concentrations for HepG2 and Hep3B cells, respectively) was added, and the fluorescence signals (excitation and emission wavelengths of 353 and 442 nm, respectively) in each well were measured using a Synergy Biotek plate reader after 10 min of incubation, as previously reported [48]. All measurements were performed in triplicate and reported as the average values ± standard deviation of the mean (mean ± SD).

3.9. Western Blot Analysis

HepG2 and Hep3B cells were seeded on 6-well plates at a density of 250,000 cells/well and grown for 24 h. The cells were then treated as described in Section 3.3 and Section 3.4. In particular, after 48 h of insulin treatment, HepG2 and Hep3B cells were incubated for 24 h with 30 µM NAR, 30 µM HES, or the N + H, C + P + Q, or MIX treatments. On the day of the experiment, the medium was removed, and the HepG2 and Hep3B cells of the 6-well plates were incubated with 500 μL of trypsin/EDTA 1× solution for 5 min at 5% CO2 and 37 °C, then 1 mL of complete DMEM medium was added to each well. The cells were recovered and transferred to sterile 1.5 mL tubes, which were centrifuged at 12,000× g for 5 min to obtain the cell pellets that had been stored at −80 °C. Cell lysates were obtained using RIPA buffer (20 mM Tris-HCl pH 7.5; 150 mM NaCl, 1 mM Na2EDTA, 1 mM EGTA, 1% NP-40, 1% sodium deoxycholate, 2.5 mM sodium pyrophosphate, 1 mM β-glycerophosphate, 1 mM Na3VO4, and 1 µg/mL leupeptin) with the addition of protease inhibitor cocktail (Cell Signaling Technology, Danvers, MA, USA). HepG2 and Hep3B samples were sonicated for 20 min at room temperature in a water-sonication bath (Ultrasonic Cleaner, BRAN-SON 200). The samples were centrifuged at 12,000× g at 4 °C for 10 min, then the supernatants (the cytosols) were recovered and put into fresh 1.5 mL tubes. The samples were boiled for 5 min and then stored at −80 °C. Protein concentration for each sample was determined by Bradford assay after evaluating the absorbance values at λ = 595 nm. Proteins were resolved by SDS polyacrylamide gel electrophoresis (SDS-PAGE) and electroblotted onto a PVDF membrane (0.2 µm pore size) (Bio-Rad, Hercules, CA, USA). The blots were probed with the following primary antibodies: anti-InsR (#MA1-10865, monoclonal; Thermo Fisher, Waltham, MA, USA), anti-semaphorin 3E (#PA5-75684, polyclonal; Thermo Fisher), and anti-β-actin (#VMA00048, monoclonal; Bio-Rad), which was used as a loading control. Immunoreactive bands were detected by horseradish peroxidase (HRP)-conjugated secondary antibodies (Bio-Rad). Peroxidase activity was detected with the enhanced chemiluminescence detection method (WesternBright ECL, Advasta, Menlo Park, CA, USA) using the ChemiDoc MP Imaging System (Bio-Rad), as previously described [49]. Quantification of the protein bands was performed using Image J Software version 1.8.0.

3.10. Statistical Analysis

The data were expressed as the mean ± SD from at least three independent experiments. Student’s t-test and one-way ANOVA analyses were performed with Past3 Software, which was used for statistical analysis of the data; differences between groups were considered statistically significant when p < 0.05.

4. Conclusions

The treatment of insulin-resistant human hepatic HepG2 and Hep3B cells with the combination of the phytochemicals NAR, HES, CUR, POL, and QRC (that mirror the nutraceutical formulation GliceFen®, Mivell, Fano, Italy) modulates the expression of several genes involved in the regulation of insulin resistance molecular mechanisms. In fact, the mixture of these five natural compounds increases the mRNA levels of the INSR gene, decreases the expression levels of GLUT3 and SEMA3E, and, in only Hep3B cells, can induce an increase in the mRNA levels of the SIRT1 gene. Notably, the inhibition of SEMA3E expression levels in HepG2 cells is synergistic, indicating that the combination of these five natural molecules can remarkably inhibit the pro-inflammatory mechanisms associated with T2DM pathology. In addition, our results show that the mixture of NAR, HES, CUR, POL, and QRC induces an increase in INSR protein levels and a decrease in semaphorin 3E levels in both the investigated in vitro models. Notably, the combination of these five bioactives decreased the activity of the pro-inflammatory enzyme caspase 1 and of the hyperglycemic enzyme DPPIV in the insulin resistant HepG2 and Hep3B cells. Noteworthy, the inhibition of DPPIV catalytic activity in Hep3B cells is synergistic, indicating that the mixture of these phytochemicals can counteract the establishment of a hyperglycemia condition and can inhibit the molecular pathways of insulin resistance that lead to T2DM development. In conclusion, our results indicate that the combination of NAR, HES, CUR, POL and QRC could be used as an innovative therapeutic strategy for the insulin resistance condition and could represent an effective innovative complementary approach to the T2DM pharmacological treatment.

5. Patents

Italian Patent Application: 102021000032909; Mivell, Fano, Italy.

Supplementary Materials

The following supporting information can be downloaded at: https://www.mdpi.com/article/10.3390/ijms24098071/s1.

Author Contributions

Conceptualization, E.-S.S.; methodology, E.-S.S., C.G. and G.M.; software, A.P.; data curation, E.-S.S. and J.S.; writing—original draft preparation, E.-S.S.; writing—review and editing, C.G., M.P., G.B., F.S., A.A., M.R.R., F.O. and G.M.; supervision, E.-S.S.; project administration, E.-S.S. and F.O.; funding acquisition, E.-S.S. and F.O. All authors have read and agreed to the published version of the manuscript.

Funding

We acknowledge the financial support of the European Union—POR MARCHE FESR 2014/2020 (Grant code: I34I19007170007)—Asse 1, OS 2, Azione 2.1—Intervento 2.1.1—Development of a collaborative platform in the field of personalized medicine, drugs, and new therapeutic approaches. Project acronym: Marche BioBank, www.marchebiobank.it (accessed on 5 May 2022). The content of the paper is the sole responsibility of the authors and can under no circumstances be regarded as reflecting the position of the European Union and/or Marche Region authorities.

Institutional Review Board Statement

Not applicable.

Informed Consent Statement

Not applicable.

Data Availability Statement

Data is contained within the article or Supplementary Materials.

Acknowledgments

We thank Nicola Delli Muti (Clinic of Endocrinology and Metabolic Diseases, Università Politecnica delle Marche, Ancona, Italy) for the critical reading of the manuscript.

Conflicts of Interest

The authors declare no conflict of interest. The funders had no role in the design of the study, in the collection, analysis, or interpretation of data, in the writing of the manuscript, or in the decision to publish the results.

Abbreviations

Akt: Ak strain transforming; ASC, Apoptosis-associated speck-like protein containing a caspase-recruitment domain; B2M, β2-microglobulin; CUR, Curcumin; DPPIV, Dipeptidyl peptidase IV; FXR2, Fragile X mental retardation syndrome-related protein 2; GLP-1, Glucagon-like peptide 1; GLUT1, Glucose transporter type 1; GLUT3, Glucose transporter type 3; GLUT4, Glucose transporter type 4; HES, Hesperetin; HRP, Horseradish peroxidase; IL-1β, Interleukin-1β; IL-6, Interleukin-6; IL-18, Interleukin-18; INSR, Insulin Receptor; IRS, Insulin receptor substrate; mTORC2, mammalian Target of rapamycin complex 2; NAR, Naringenin; NLRP3, Nucleotide-binding domain, leucine-rich containing family, pyrin domain-containing-3; PBS, Phosphate Buffered Saline; PDK1, 3-phosphoinositide-dependent kinase 1; PI3K, Phosphoinositide 3-kinase; POL, Polydatin; QRC, Quercetin; RIP2, Receptor-interacting protein 2; ROS, Radical Oxygen Species; SDS-PAGE, SDS Polyacrylamide gel electrophoresis; SEMA3E, Semaphorin 3E; SIRT1, Sirtuin 1; T2DM, Type 2 diabetes mellitus; TBC1D4, TBC1 Domain Family member 4; TNF-α, Tumor Necrosis Factor-α.

References

  1. DeMarsilis, A.; Reddy, N.; Boutari, C.; Filippaios, A.; Sternthal, E.; Katsiki, N.; Mantzoros, C. Pharmacotherapy of type 2 diabetes: An update and future directions. Metabolism 2022, 137, 155332. [Google Scholar] [CrossRef] [PubMed]
  2. Suárez, R.; Chapela, S.P.; Álvarez-Córdova, L.; Bautista-Valarezo, E.; Sarmiento-Andrade, Y.; Verde, L.; Frias-Toral, E.; Sarno, G. Epigenetics in Obesity and Diabetes Mellitus: New Insights. Nutrients 2023, 15, 811. [Google Scholar] [CrossRef] [PubMed]
  3. Shaikh, S.; Lee, E.-J.; Ahmad, K.; Ahmad, S.-S.; Lim, J.-H.; Choi, I. A Comprehensive Review and Perspective on Natural Sources as Dipeptidyl Peptidase-4 Inhibitors for Management of Diabetes. Pharmaceuticals 2021, 14, 591. [Google Scholar] [CrossRef] [PubMed]
  4. Singh, A.K.; Patel, P.K.; Choudhary, K.; Joshi, J.; Yadav, D.; Jin, J.Q. Quercetin and Coumarin Inhibit Dipeptdyl peptidase-IV and Exhibits Antioxidant properties; In Silico, In Vitro, Ex Vivo. Biomolecules 2020, 10, 207. [Google Scholar] [CrossRef]
  5. Jiménez-Cortegana, C.; Iglesias, P.; Ribalta, J.; Vilariño-García, T.; Montañez, L.; Arrieta, F.; Aguilar, M.; Durán, S.; Obaya, J.C.; Becerra, A.; et al. Nutrients and Dietary Approaches in Patients with Type 2 Diabetes Mellitus and Cardiovascular Disease: A Narrative Review. Nutrients 2021, 13, 4150. [Google Scholar] [CrossRef]
  6. Gandhi, G.R.; Vasconcelos, A.B.S.; Wu, D.-T.; Li, H.-B.; Antony, P.J.; Li, H.; Geng, F.; Gurgel, R.Q.; Narain, N.; Gan, R.-Y. Citrus Flavonoids as Promising Phytochemicals Targeting Diabetes and Related Complications: A Systematic Review of In Vitro and In Vivo Studies. Nutrients 2020, 12, 2907. [Google Scholar] [CrossRef]
  7. Ahmed, O.M.; Hassan, M.A.; Abdel-Twab, S.M.; Azeem, M.N.A. Navel orange peel hydroethanolic extract, naringin and naringenin have anti-diabetic potentials in type 2 diabetic rats. Biomed. Pharmacother. 2017, 94, 197–205. [Google Scholar] [CrossRef]
  8. Wang, S.-W.; Sheng, H.; Bai, Y.-F.; Weng, Y.-Y.; Fan, X.-Y.; Zheng, F.; Fu, J.-Q.; Zhang, F. Inhibition of histone acetyltransferase by naringenin and hesperetin suppresses Txnip expression and protects pancreatic β cells in diabetic mice. Phytomedicine 2020, 88, 153454. [Google Scholar] [CrossRef]
  9. Pivari, F.; Mingione, A.; Brasacchio, C.; Soldati, L. Curcumin and Type 2 Diabetes Mellitus: Prevention and Treatment. Nutrients 2019, 11, 1837. [Google Scholar] [CrossRef]
  10. Mirzaei, H.; Shakeri, A.; Rashidi, B.; Jalili, A.; Banikazemi, Z.; Sahebkar, A. Phytosomal curcumin: A review of pharma-co-kinetic, experimental and clinical studies. Biomed. Pharmacother. 2017, 85, 102–112. [Google Scholar] [CrossRef]
  11. Jain, S.K.; Rains, J.; Croad, J.; Larson, B.; Jones, K. Curcumin Supplementation Lowers TNF-α, IL-6, IL-8, and MCP-1 Secretion in High Glucose-Treated Cultured Monocytes and Blood Levels of TNF-α, IL-6, MCP-1, Glucose, and Glycosylated Hemoglobin in Diabetic Rats. Antiox. Redox Signal. 2008, 11, 241–249. [Google Scholar] [CrossRef]
  12. Zheng, J.; Cheng, J.; Zheng, S.; Feng, Q.; Xiao, X. Curcumin, a polyphenolic curcuminoid with its protective effects and molecular mechanisms in diabetes and diabetic cardiomyopathy. Front. Pharmacol. 2018, 9, 472–481. [Google Scholar] [CrossRef]
  13. Du, Q.-H.; Peng, C.; Zhang, H. Polydatin: A review of pharmacology and pharmacokinetics. Pharm. Biol. 2013, 51, 1347–1354. [Google Scholar] [CrossRef]
  14. Luo, J.; Chen, S.; Wang, L.; Zhao, X.; Piao, C. Pharmacological effects of polydatin in the treatment of metabolic diseases: A review. Phytomedicine 2022, 102, 154161. [Google Scholar] [CrossRef]
  15. Regev-Shoshani, G.; Shoseyov, O.; Bilkis, I.; Kerem, Z. Glycosylation of resveratrol protects it from enzymic oxidation. Biochem. J. 2003, 374, 157–163. [Google Scholar] [CrossRef]
  16. Karami, A.; Fakhri, S.; Kooshki, L.; Khan, H. Polydatin: Pharmacological Mechanisms, Therapeutic Targets, Biological Activities, and Health Benefits. Molecules 2022, 27, 6474. [Google Scholar] [CrossRef]
  17. Ansari, P.; Choudhury, S.T.; Seidel, V.; Bin Rahman, A.; Aziz, A.; Richi, A.E.; Rahman, A.; Jafrin, U.H.; Hannan, J.M.A.; Abdel-Wahab, Y.H.A. Therapeutic Potential of Quercetin in the Management of Type-2 Diabetes Mellitus. Life 2022, 12, 1146. [Google Scholar] [CrossRef]
  18. Hsu, C.Y.; Sulake, R.S.; Huang, P.-K.; Shih, H.-Y.; Sie, H.-W.; Lai, Y.-K.; Chen, C.; Weng, C.F. Synthetic (+)-antroquinonol exhibits dual actions against insulin resistance by triggering AMP kinase and inhibiting dipeptidyl peptidase IV activities. Br. J. Pharmacol. 2014, 172, 38–49. [Google Scholar] [CrossRef]
  19. Qin, Q.; Liu, H.; Shou, J.; Jiang, Y.; Yu, H.; Wang, X. The inhibitor effect of RKIP on inflammasome activation and inflammasome-dependent diseases. Cell. Mol. Immunol. 2020, 18, 992–1004. [Google Scholar] [CrossRef]
  20. Misawa, T.; Takahama, M.; Kozaki, T.; Lee, H.; Zou, J.; Saitoh, T.; Akira, S. Microtubule-driven spatial arrangement of mitochondria promotes activation of the NLRP3 inflammasome. Nat. Immunol. 2013, 14, 454–460. [Google Scholar] [CrossRef]
  21. Itahana, Y.; Itahana, K. Emerging Roles of p53 Family Members in Glucose Metabolism. Int. J. Mol. Sci. 2018, 19, 776. [Google Scholar] [CrossRef] [PubMed]
  22. Shimizu, I.; Yoshida, Y.; Moriya, J.; Nojima, A.; Uemura, A.; Kobayashi, Y.; Minamino, T. Semaphorin3E-Induced Inflammation Contributes to Insulin Resistance in Dietary Obesity. Cell Metab. 2013, 18, 491–504. [Google Scholar] [CrossRef]
  23. Lee, C.W.; Wong, L.L.Y.; Tse, E.Y.T.; Liu, H.F.; Leong, V.Y.L.; Lee, J.M.F.; Hardie, D.G.; Ng, I.O.L.; Ching, Y.P. AMPK promotes p53 acetylation via phosphorylation and inactivation of SIRT1 in liver cancer cells. Cancer Res. 2012, 72, 4394–4404. [Google Scholar] [CrossRef] [PubMed]
  24. Scarpa, E.S.; Antonini, E.; Palma, F.; Mari, M.; Ninfali, P. Antiproliferative activity of vitexin-2-O-xyloside and avenan-thramides on CaCo-2 and HepG2 cancer cells occurs through apoptosis induction and reduction of pro-survival mechanisms. Eur. J. Nutr. 2018, 57, 1381–1395. [Google Scholar] [CrossRef] [PubMed]
  25. Jinesh, G.G.; Napoli, M.; Smallin, M.Y.; Davis, A.; Ackerman, H.D.; Raulji, P.; Montey, N.; Flores, E.R.; Brohl, A.S. Mutant p53s and chromosome 19 microRNA cluster overexpression regulate cancer testis antigen expression and cellular transformation in hepatocellular carcinoma. Sci. Rep. 2021, 11, 12673–12685. [Google Scholar] [CrossRef]
  26. Liu, X.; Li, L.; Li, J.; Cheng, Y.; Chen, J.; Shen, M.; Zhang, S.; Wei, H. Insulin resistance contributes to multidrug resistance in HepG2 cells via activation of the PERK signaling pathway and upregulation of Bcl-2 and P-gp. Oncol. Rep. 2016, 35, 3018–3024. [Google Scholar] [CrossRef]
  27. Yoshida, T.; Yamagishi, S.; Nakamura, K.; Matsui, T.; Imaizumi, T.; Takeuchi, M.; Koga, H.; Ueno, T.; Sata, M. Pigment epithelium-derived factor (PEDF) ameliorates advanced glycation end product (AGE)-induced hepatic insulin resistance in vitro by suppressing Rac-1 activation. Horm. Metab. Res. 2008, 40, 620–625. [Google Scholar] [CrossRef]
  28. Matacchione, G.; Valli, D.; Silvestrini, A.; Giuliani, A.; Sabbatinelli, J.; Giordani, C.; Coppari, S.; Rippo, M.R.; Albertini, M.C.; Olivieri, F. Curcumin, Polydatin and Quercetin Synergistic Activity Protects from High-Glucose-Induced Inflammation and Oxidative Stress. Antioxidants 2022, 11, 1037. [Google Scholar] [CrossRef]
  29. Liu, Y.; Deng, J.; Fan, D. Ginsenoside Rk3 ameliorates high-fat-diet/streptozocin induced type 2 diabetes mellitus in mice via the AMPK/Akt signaling pathway. Food Funct. 2019, 10, 2538–2551. [Google Scholar] [CrossRef]
  30. Xu, S.; Wang, G.; Peng, W.; Xu, Y.; Zhang, Y.; Ge, Y.; Jing, Y.; Gong, Z. Corosolic acid isolated from Eriobotrya japonica leaves reduces glucose level in human hepatocellular carcinoma cells, zebrafish and rats. Sci. Rep. 2019, 9, 4388. [Google Scholar] [CrossRef]
  31. Mihanfar, A.; Akbarzadeh, M.; Darband, S.G.; Sadighparvar, S.; Majidinia, M. SIRT1: A promising therapeutic target in type 2 diabetes mellitus. Arch. Physiol. Biochem. 2021, 11, 1–16. [Google Scholar] [CrossRef]
  32. Tsvetkov, P.; Asher, G.; Reiss, V.; Shaul, Y.; Sachs, L.; Lotem, J. Inhibition of NADP(H):quinone oxidoreductase 1 activity and induction of p53 degradation by the natural phenolic compound curcumin. PNAS 2005, 102, 5535–5540. [Google Scholar] [CrossRef]
  33. Zeng, Z.; Chen, Z.; Xu, S.; Zhang, Q.; Wang, X.; Gao, Y.; Zhao, K. Polydatin Protecting Kidneys against Hemorrhagic Shock-Induced Mitochondrial Dysfunction via SIRT1 Activation and p53 Deacetylation. Oxid. Med. Cell Longev. 2016, 2016, 1737185. [Google Scholar] [CrossRef]
  34. Schmidt, A.M.; Moore, K.J. The Semaphoring 3E/Plexin D1 Axis Regulates Macrophage Inflammation in Obesity. Cell Metab. 2013, 18, 461–462. [Google Scholar] [CrossRef]
  35. James, D.E.; Stöckli, J.; Birnbaum, M.J. The aetiology and molecular landscape of insulin resistance. Nat. Rev. Mol. Cell Biol. 2021, 22, 751–771. [Google Scholar] [CrossRef]
  36. Sano, H.; Eguez, L.; Teruel, M.N.; Fukuda, M.; Chuang, T.D.; Chavez, J.A.; Lienhard, G.E.; McGraw, T.E. Rab10, a Target of the AS160 Rab GAP, Is Required for Insulin-Stimulated Translocation of GLUT4 to the Adipocyte Plasma Membrane. Cell Metab. 2007, 5, 293–303. [Google Scholar] [CrossRef]
  37. Ho, S.C.; Chang, Y.H. Comparison of Inhibitory Capacities of 6-, 8- and 10-Gingerols/Shogaols on the Canonical NLRP3 In-flammasome-Mediated IL-1β Secretion. Molecules 2018, 23, 466. [Google Scholar] [CrossRef]
  38. Moon, P.-D.; Choi, I.-H.; Kim, H.-M. Naringenin suppresses the production of thymic stromal lymphopoietin through the blockade of RIP2 and caspase-1 signal cascade in mast cells. Eur. J. Pharmacol. 2011, 671, 128–132. [Google Scholar] [CrossRef]
  39. Yin, H.; Guo, Q.; Li, X.; Tang, T.; Li, C.; Wang, H.; Sun, Y.; Feng, Q.; Ma, C.; Gao, C.; et al. Curcumin Suppresses IL-1β Secretion and Prevents Inflammation through Inhibition of the NLRP3 Inflammasome. J. Immunol. 2018, 200, 2835–2846. [Google Scholar] [CrossRef]
  40. Chen, L.; Lan, Z. Polydatin attenuates potassium oxonate-induced hyperuricemia and kidney inflammation by inhibiting NF-κB/NLRP3 inflammasome activation via the AMPK/SIRT1 pathway. Food Funct. 2017, 24, 1785–1792. [Google Scholar] [CrossRef]
  41. Bower, A.M.; Hernandez, L.M.R.; Berhow, M.A.; de Mejia, E.G. Bioactive Compounds from Culinary Herbs Inhibit a Molecular Target for Type 2 Diabetes Management, Dipeptidyl Peptidase IV. J. Agric. Food Chem. 2014, 62, 6147–6158. [Google Scholar] [CrossRef]
  42. Gupta, A.; Jacobson, G.A.; Burgess, J.R.; Jelinek, H.F.; Nichols, D.; Narkowicz, C.K.; Al-Aubaidy, H.A. Citrus bioflavonoids dipeptidyl peptidase-4 inhibition compared with gliptin antidiabetic medications. Biochem. Biophys. Res. Commun. 2018, 503, 21–25. [Google Scholar] [CrossRef] [PubMed]
  43. Cao, W.; Chen, X.; Chin, Y.; Zheng, J.; Lim, P.E.; Xue, C.; Tang, Q. Identification of curcumin as a potential α-glucosidase and dipeptidyl-peptidase 4 inhibitor: Molecular docking study, in vitro and in vivo biological evaluation. J. Food Biochem. 2022, 46, e13686. [Google Scholar] [CrossRef] [PubMed]
  44. Holst, J.J. Treatment of type 2 diabetes mellitus with agonists of the GLP-1 receptor or DPP-IV inhibitors. Expert Opin. Emerg. Drugs 2004, 9, 155–166. [Google Scholar] [CrossRef] [PubMed]
  45. Rabbani, N.; Xue, M.; Weickert, M.O.; Thornallley, P.J. Reversal of Insulin Resistance in Overweight and Obese Subjects by trans-Resveratrol and Hesperetin Combination-Link to Dysglycemia, Blood Pressure, Dyslipidemia, and Low-Grade In-flammation. Nutrients 2021, 13, 2374. [Google Scholar] [CrossRef]
  46. Scarpa, E.S.; Emanuelli, M.; Frati, A.; Pozzi, V.; Antonini, E.; Diamantini, G.; Di Ruscio, G.; Sartini, D.; Armeni, T.; Palma, F.; et al. Betacyanins enhance vitexin-2-O-xyloside mediated inhibition of proliferation of T24 bladder cancer cells. Food Funct. 2016, 7, 4772–4780. [Google Scholar] [CrossRef]
  47. Scarpa, E.S.; Mari, M.; Antonini, E.; Palma, F.; Ninfali, P. Natural and synthetic avenanthramides activate caspases 2, 8, 3 and downregulate hTERT, MDR1 and COX-2 genes in CaCo-2 and Hep3B cancer cells. Food Funct. 2018, 9, 2913–2921. [Google Scholar] [CrossRef]
  48. Lammi, C.; Bollati, C.; Ferruzza, S.; Ranaldi, G.; Sambuy, Y.; Arnoldi, A. Soybean- and Lupin-Derived Peptides Inhibit DPP-IV Activity on In Situ Human Intestinal Caco-2 Cells and Ex Vivo Human Serum. Nutrients 2018, 10, 1082. [Google Scholar] [CrossRef]
  49. Scarpa, E.S.; Tasini, F.; Crinelli, R.; Ceccarini, C.; Magnani, M.; Bianchi, M. The Ubiquitin Gene Expression Pattern and Sensi-tivity to UBB and UBC Knockdown Differentiate Primary 23132/87 and Metastatic MKN45 Gastric cancer Cells. Int. J. Mol. Sci. 2020, 21, 5435. [Google Scholar] [CrossRef]
Figure 1. Dose-response curves of HepG2 and Hep3B cell viability after NAR, HES, N + H, C + P + Q, and MIX treatments. HepG2 (AC) and Hep3B (DF) cells were treated with different concentrations of NAR (0–240 µM), HES (0–240 µM), N + H (30 µM NAR + 30 µM HES), C + P + Q (1 μM CUR + 10 μM POL + 0.5 μM QRC), MIX (N + H + C + P + Q), or 0.4% DMSO alone as a control for 24 h. Results are expressed as a percentage of cell viability compared to the cell viability of 0.4% DMSO-treated cells (CTRL, set to 100%) and presented as mean value ± SD from three independent experiments performed in quadruplicate. * p < 0.05, ** p < 0.01; *** p < 0.001.
Ijms 24 08071 g001
Figure 2. Modulation of INSR, GLUT2, GLUT3, SIRT1, and SEMA3E expression levels in HepG2 cells. Cells were treated for 72 h with 500 nM insulin (INS) alone or for 72 h with 500 nM INS with the addition of 30 µM NAR, 30 µM HES, N + H (30 µM NAR + 30 µM HES), C + P + Q (1 μM CUR + 10 μM POL + 0.5 μM QRC), and MIX (N + H + C + P + Q) for 24 h. Cells treated with 0.4% DMSO alone for 24 h were used as controls (NT). (A) RTqPCR data of the relative expression of INSR in HepG2 cells. (B) RTqPCR data of the relative expression of GLUT2 in HepG2 cells. (C) RTqPCR data of the relative expression of GLUT3 in HepG2 cells. (D) RTqPCR data of the relative expression of SIRT1 in HepG2 cells. (E) RTqPCR data of the relative expression of SEMA3E in HepG2 cells. Results are presented as the mean value ± SD from three independent experiments performed in triplicate. * p < 0.05; ** p < 0.01; *** p < 0.001 when compared with the control (NT) sample; # p < 0.05; ## p < 0.01 when compared with the INS-treated (INS) sample.
Ijms 24 08071 g002
Figure 3. Modulation of INSR, GLUT2, GLUT3, SIRT1, and SEMA3E expression levels in Hep3B cells. Cells were treated for 72 h with 500 nM insulin (INS) alone or for 72 h with 500 nM INS with the addition of 30 µM NAR, 30 µM HES, N + H (30 µM NAR + 30 µM HES), C + P + Q (1 μM CUR + 10 μM POL + 0.5 μM QRC), and MIX (N + H + C + P + Q) for 24 h. Cells treated with 0.4% DMSO alone for 24 h were used as controls (NT). (A) RTqPCR data of the relative expression of INSR in Hep3B cells. (B) RTqPCR data of the relative expression of GLUT2 in Hep3B cells. (C) RTqPCR data of the relative expression of GLUT3 in Hep3B cells. (D) RTqPCR data of the relative expression of SIRT1 in Hep3B cells. (E) RTqPCR data of the relative expression of SEMA3E in Hep3B cells. Results are presented as the mean value ± SD from three independent experiments performed in triplicate. * p < 0.05; ** p < 0.01; *** p < 0.001 when compared with the control (NT) sample; # p < 0.05 when compared with the INS-treated (INS) sample.
Ijms 24 08071 g003
Figure 4. Modulation of INSR and semaphorin 3E protein levels in HepG2 and Hep3B cells. Cells were treated for 72 h with 500 nM insulin (INS) alone or for 72 h with 500 nM INS with the addition of 30 µM NAR, 30 µM HES, N + H (30 µM NAR + 30 µM HES), C + P + Q (1 μM CUR + 10 μM POL + 0.5 μM QRC), and MIX (N + H + C + P + Q) for 24 h. Cells treated with 0.4% DMSO alone for 24 h were used as controls. (A) Representative western blot analysis showing INSR and semaphorin 3E protein levels in HepG2 cells not treated (NT) or treated with INS, INS + N, INS + H, INS + N + H, INS + C + P + Q, and INS + MIX; β-actin levels were used as loading controls. (B) Graphical representation of western blot data of INSR protein levels, normalized to β-actin protein levels, in HepG2 cells. (C) Graphical representation of western blot data of semaphorin 3E protein levels, normalized to β-actin protein levels, in HepG2 cells. (D) Representative western blot analysis showing INSR and semaphorin 3E protein levels in Hep3B cells not treated (NT) or treated with INS, INS + N, INS + H, INS + N + H, INS + C + P + Q, and INS + MIX; β-actin levels were used as loading controls. (E) Graphical representation of western blot data of INSR protein levels, normalized to β-actin protein levels, in Hep3B cells. (F) Graphical representation of western blot data of semaphorin 3E protein levels, normalized to β-actin protein levels, in Hep3B cells. Results are presented as mean value ± SD from three independent experiments. * p < 0.05, ** p < 0.01 when compared with the not-treated (NT) sample; # p < 0.05, ## p < 0.01 when compared with the INS sample.
Ijms 24 08071 g004
Figure 5. Regulation of caspase 1 catalytic activity in HepG2 and Hep3B cells. Cells were treated for 72 h with 500 nM insulin (INS) alone or for 72 h with 500 nM INS with the addition of 30 µM NAR, 30 µM HES, N + H (30 µM NAR + 30 µM HES), C + P + Q (1 μM CUR + 10 μM POL + 0.5 μM QRC), and MIX (N + H + C + P + Q) for 24 h. Cells treated with 0.4% DMSO alone for 24 h were used as controls (NT). (A) Caspase 1 activity levels in HepG2 cells. (B) Caspase 1 activity levels in Hep3B cells. Results are presented as mean values ± SD from three independent experiments performed in duplicate. * p < 0.05; ** p < 0.01 when compared with the not-treated (NT) sample; # p < 0.05 when compared with the INS-treated sample.
Ijms 24 08071 g005
Figure 6. Regulation of DPPIV catalytic activity in HepG2 and Hep3B cells. Cells were treated for 72 h with 500 nM insulin (INS) alone or for 72 h with 500 nM INS with the addition of 30 µM NAR, 30 µM HES, N + H (30 µM NAR + 30 µM HES), C + P + Q (1 μM CUR + 10 μM POL + 0.5 μM QRC), and MIX (N + H + C + P + Q) for 24 h. Cells treated with 0.4% DMSO alone for 24 h were used as controls (NT). (A) DPPIV activity levels in HepG2 cells. (B) DPPIV activity levels in Hep3B cells. Results are presented as the mean value ± SD from three independent experiments performed in triplicate. * p < 0.05 when compared with the not-treated (NT) sample; # p < 0.05 when compared with the INS-treated sample.
Ijms 24 08071 g006
Table 1. Evaluation of the synergistic biological effects of the N + H and MIX treatments in HepG2 and Hep3B cells.
HepG2INSR FOLDHep3BINSR FOLD
INS + N+2.60%INS + N+2.10%
INS + H−4.30%INS + H−6.60%
INS + N + H+36.90%INS + N + H+33.70%
HepG2SIRT1 FOLDHep3BGLUT3 FOLD
INS + N+26.30%INS + N−7.90%
INS + H+53.70%INS + H−11.90%
INS + N + H+87.10%INS + N + H−38.40%
HepG2SEMA3E FOLDHep3BDPPIV Activity
INS + N + H−45.10%INS + N + H−16.30%
INS + C + P + Q−43.40%INS + C + P + Q−15.60%
INS + MIX−90.10%INS + MIX−35.50%
Table 2. Sequence of primers used for RTqPCR experiments.
PrimerSequence
INSR FTACCCTTCAAGAGATGATT
INSR RCAGAAGAAGTGGTGAAGAC
GLUT2 FTGGGCTGAGGAAGAGACTGT
GLUT2 RAGAGACTGAAGGATGGCTCG
GLUT3 FCAATGCTCCTGAGAAGATCATAA
GLUT3 RAAAGCGGTTGACGAAGAGT
SIRT1 FTAGGCGGCTTGATGGTAA
SIRT1 RATGGGTTCTTCTAAACTTGG
SEMA3E FAAGTCAGATTCCATCACTGTGACAT
SEMA3E RAGCAAAGTACTGTTGTTCTCTATGC
B2M FGCCTGCCGTGTGAACCAT
B2M RCATCTTCAAACCTCCATGATGCT
Disclaimer/Publisher’s Note: The statements, opinions and data contained in all publications are solely those of the individual author(s) and contributor(s) and not of MDPI and/or the editor(s). MDPI and/or the editor(s) disclaim responsibility for any injury to people or property resulting from any ideas, methods, instructions or products referred to in the content.