
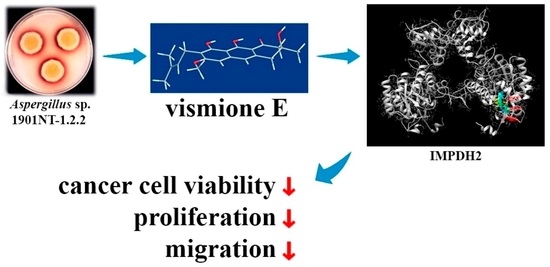
Absolute Stereochemistry and Cytotoxic Effects of Vismione E from Marine Sponge-Derived Fungus Aspergillus sp. 1901NT-1.2.2
 , , , , , and
Abstract
:
1. Introduction
2. Results
2.1. Metabolite Profile of Aspergillus sp. 1901NT-1.2.2
2.2. Isolation of Compound 1
2.3. Cytotoxic Activity of Vismione E (1)
2.3.1. Influence on Cell Viability
2.3.2. Influence on MCF-7 Cell Cycle and Proliferation
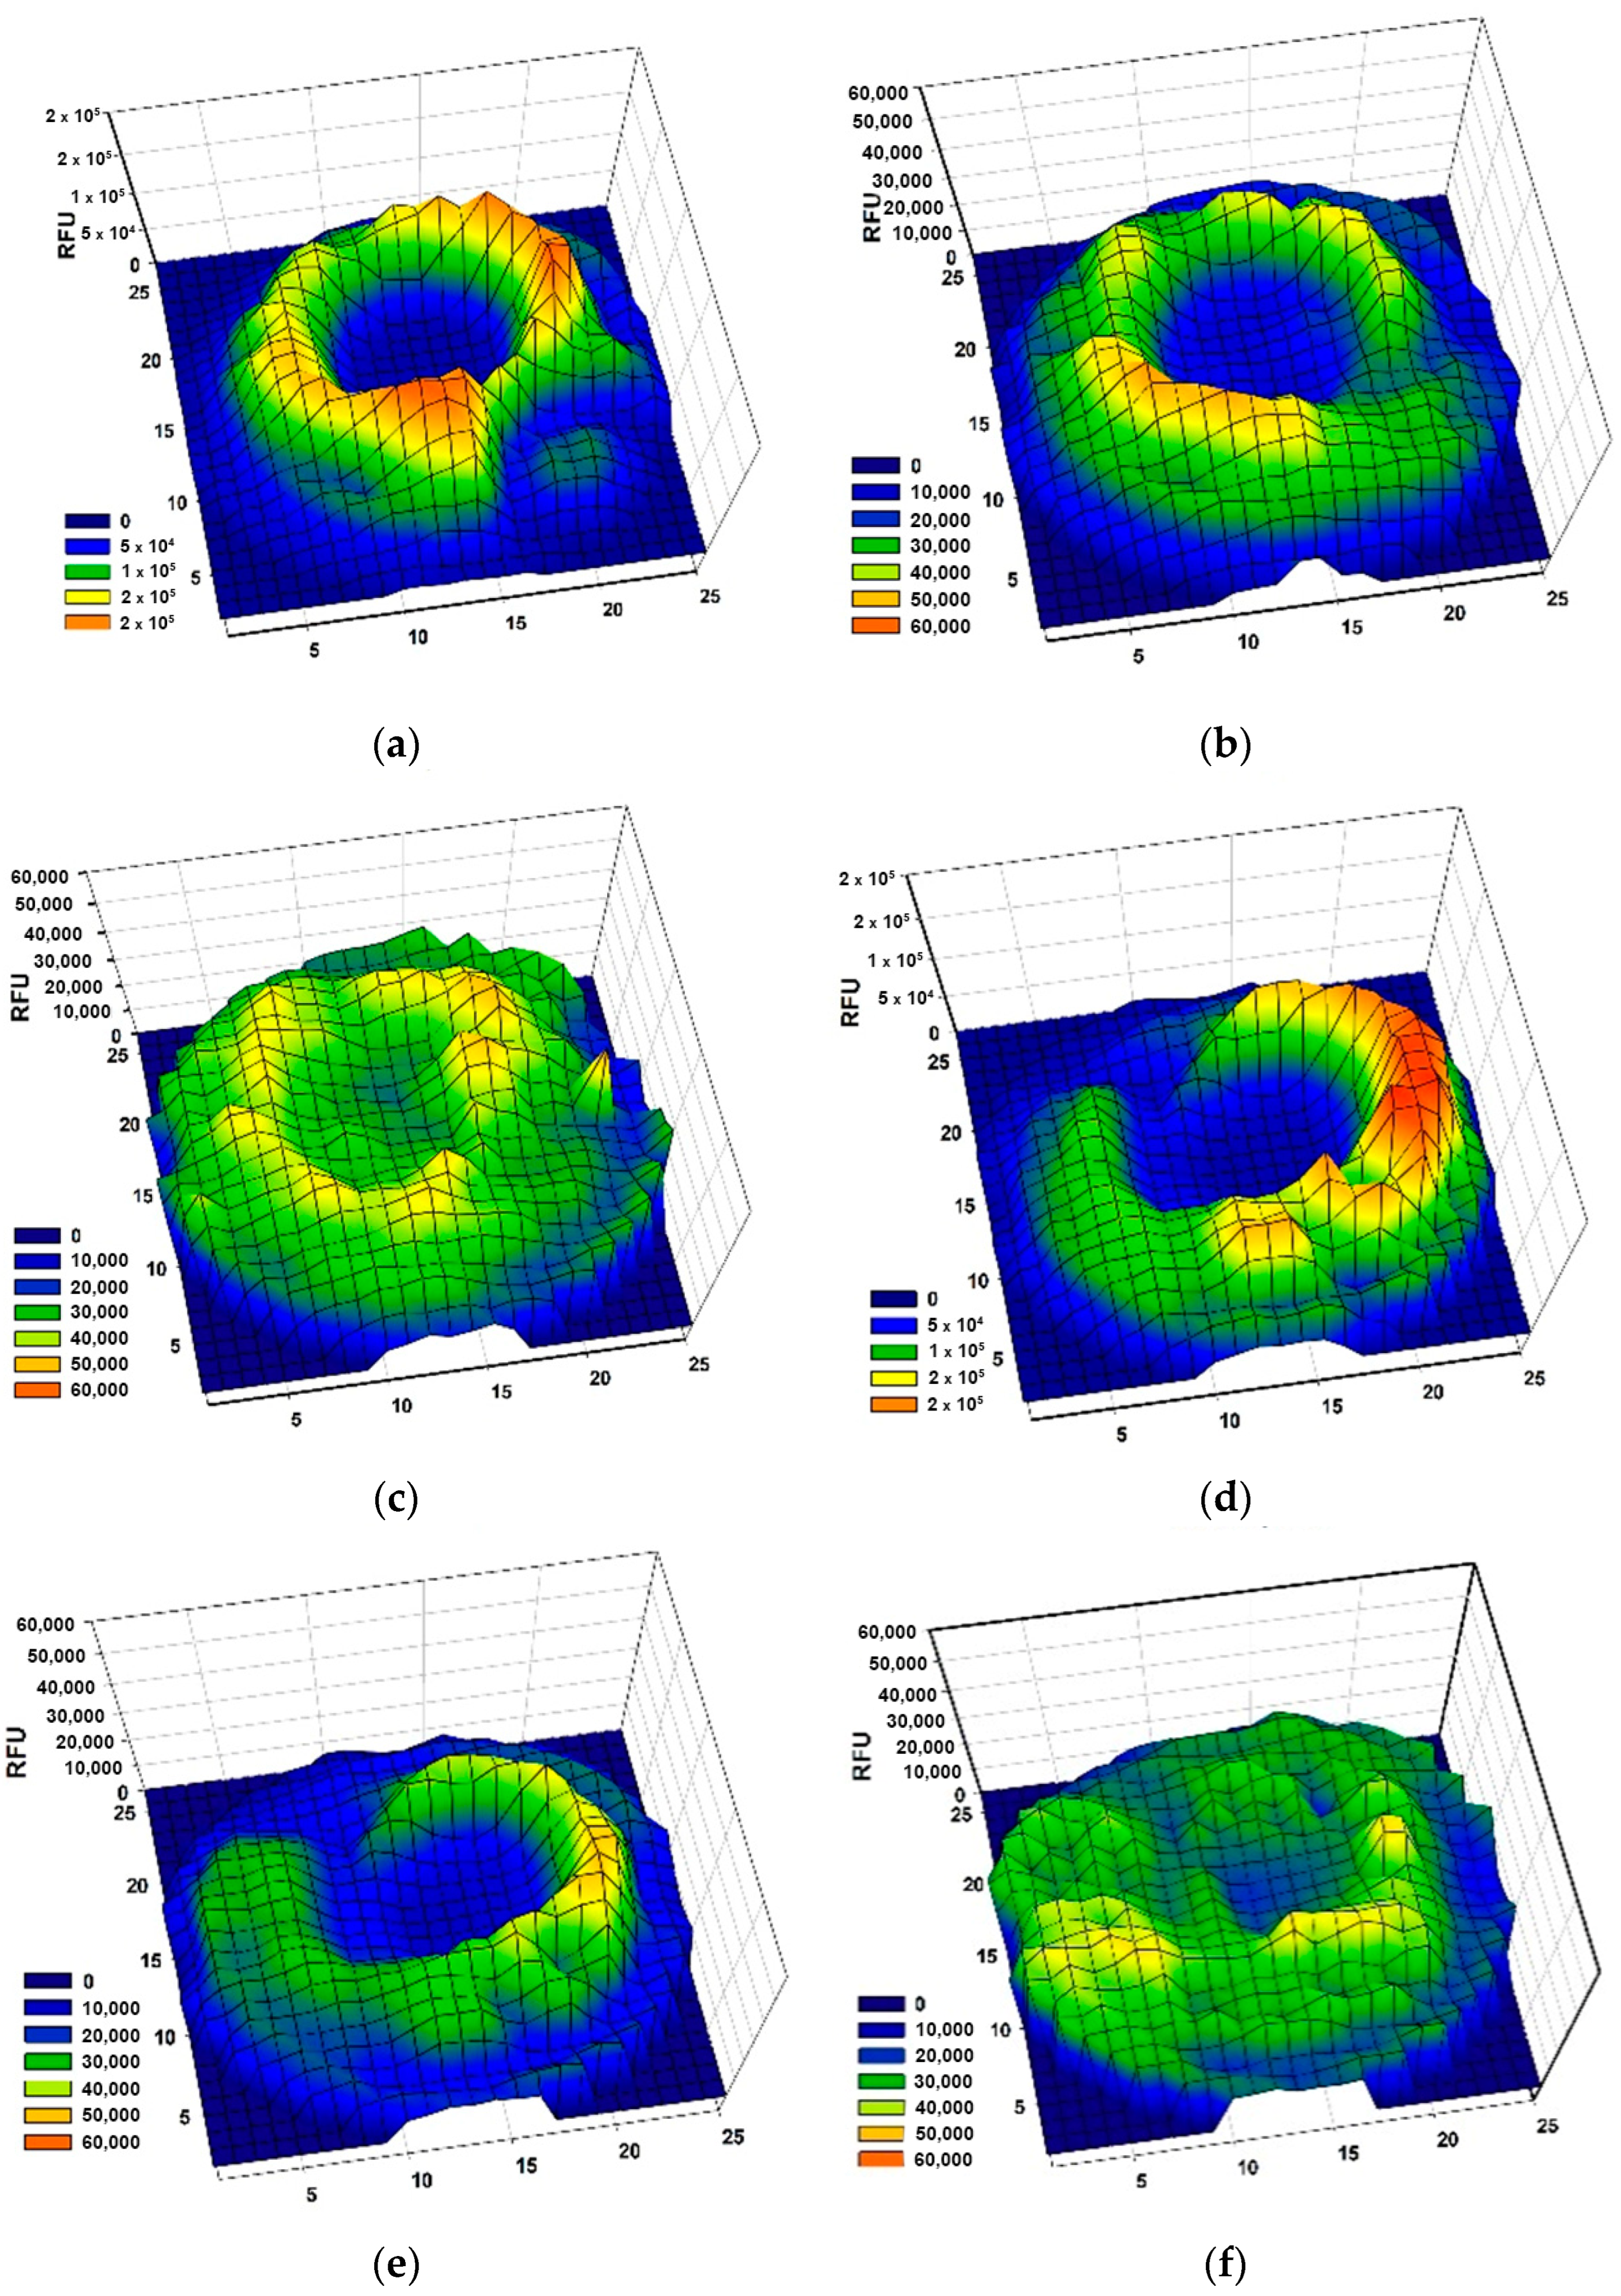
2.3.3. Influence on Cell Migration
2.3.4. Prediction of Molecular Targets and Molecular Docking
3. Discussion
4. Materials and Methods
4.1. General
4.2. Fungal Material and Fermentation
4.3. Extraction and HPLC MS Analysis
Data Analysis
4.4. Isolation of Vismione E
Vismione E (1)
4.5. Bioassays
4.5.1. Cell Culture
4.5.2. Cell Viability Assay
4.5.3. EdU Incorporation Assay
4.5.4. Cell Cycle Investigation
4.5.5. CFDA SE Proliferation Assay
4.5.6. Cell Migration Assay
4.5.7. Preparation of Suction Cup Inserts for Cell Migration Assay
4.6. Search of Proposed Molecular Targets of Vismione E
4.7. Virtual Screening of Molecular Targets of Vismione E
4.8. Statistical Data Evaluation
5. Conclusions
Supplementary Materials
Author Contributions
Funding
Institutional Review Board Statement
Informed Consent Statement
Data Availability Statement
Conflicts of Interest
Appendix A

| N | Name | Structure | RT | Exact Mass (Measured) | Exact Mass (Calcd) | Δ, ppm | MQScore (GNPS) | Ref. |
|---|---|---|---|---|---|---|---|---|
| 1 | C9H8O5 | 3.59 | 195.0288 [M + H]+ | 195.0288 | 0 | |||
| 2 | 7-hydroxy-3-(2-hydroxypropyl)-5-methylisochromen-1-one |  | 5.12 | 235.0970 [M + H]+ | 235.0965 | −2.2 | 0.89 | [19] |
| 3 | C11H10O3 | 6.18 | 191.0709 [M + H]+ | 191.0703 | −3.3 | |||
| 4 | C17H14O6 | 6.96 | 315.0870 [M + H]+ | 315.0863 | −2.2 | |||
| 5 | endocrocin | 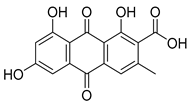 | 8.16 | 315.0504 [M + H]+ | 315.0499 | −1.5 | 0.93 | [20] |
| 6 | C15H12O5 | 8.47 | 273.0745 [M + H]+ | 273.0758 | 4.6 | |||
| 7 | C21H24O6 | 9.08 | 373.1643 [M + H]+ | 373.1646 | 0.7 | |||
| 8 | C21H24O6 | 9.60 | 373.1643 [M + H]+ | 373.1646 | 0.7 | |||
| 9 | C20H26O4 | 10.95 | 331.1906 [M + H]+ | 331.1904 | −0.6 | |||
| 10 | C30H49NO11 | 11.16 | 600.3391 [M + H]+ | 600.3378 | −2.1 | |||
| 11 | C20H22O5 | 12.16 | 343.1542 [M + H]+ | 343.1540 | −0.6 | |||
| 12 | 11a-hydroxy-4,4,9-trimethyl-9-vinyl-1,2,3,4,9,10,11,11a-octahydrodibenzo[c,e]oxepine-5,7-dione |  | 13.16 | 317.1750 [M + H]+ | 317.1747 | −0.8 | 0.83 | [56] |
| 13 | C18H19N2O8 | 13.26 | 391.1129 [M + H]+ | 391.1136 | 1.8 | |||
| 14 | C21H20O6 | 13.75 | 369.1306 [M + H]+ | 369.1333 | 7.2 | |||
| 15 | C20H28O3 | 14.28 | 317.2115 [M + H]+ | 317.2111 | −1.2 | |||
| 16 | vismione E | 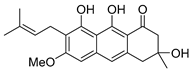 | 15.59 | 357.1700 [M + H]+ | 357.1697 | 0.2 | [21,22,23,24] | |
| 17 | C20H20O9 | 16.05 | 427.0996 [M + Na]+ | 427.0999 | 0.8 | |||
| 18 | C26H22O6 | 16.57 | 453.1299 [M + Na]+ | 453.1309 | 2.1 | |||
| 19 | C17H14O4 | 17.67 | 283.0975 [M + H]+ | 283.0965 | −3.6 | |||
| 20 | C21H36O4 | 18.39 | 353.2657 [M + H]+ | 283.2686 | 8.3 | |||
| 21 | C20H30O | 18.75 | 287.2372 [M + H]+ | 287.2369 | −0.9 | |||
| 22 | C30H38O4 | 19.15 | 463.2826 [M + H]+ | 463.2843 | 3.6 | |||
| 23 | C24H38O4 | 20.35 | 413.2674 [M + Na]+ | 413.2662 | −2.8 |
Appendix B
| Target | Common Name | Uniprot ID | ChEMBL ID | Probability |
|---|---|---|---|---|
| Inosine-5′-monophosphate dehydrogenase 2 | IMPDH2 | P12268 | CHEMBL2002 | 0.109339753231 |
| Matrix metalloproteinase 1 | MMP1 | P03956 | CHEMBL332 | 0.109339753231 |
| ADAM17 | ADAM17 | P78536 | CHEMBL3706 | 0.109339753231 |
| CDK8/Cyclin C | CCNC CDK8 | P24863 P49336 | CHEMBL3038474 | 0.109339753231 |
| Cell division protein kinase 8 | CDK8 | P49336 | CHEMBL5719 | 0.109339753231 |
| PI3-kinase p110- alpha subunit | PIK3CA | P42336 | CHEMBL4005 | 0.109339753231 |
| Proto-oncogene tyrosine-protein kinase ROS | ROS1 | P08922 | CHEMBL5568 | 0.109339753231 |
| Interleukin-8 receptor B | CXCR2 | P25025 | CHEMBL2434 | 0.109339753231 |
| Tyrosine-protein kinase SYK | SYK | P43405 | CHEMBL2599 | 0.109339753231 |
| Leucine-rich repeat serine/threonineprotein kinase 2 | LRRK2 | Q5S007 | CHEMBL1075104 | 0.109339753231 |
| Cyclin-dependent kinase 1/cyclin B | CCNB3 CDK1 CCNB1 CCNB2 | Q8WWL7 P06493 P14635 O95067 | CHEMBL2094127 | 0.109339753231 |
| Mammalian target of rapamycin (mTORC1) | FKBP1A MTOR | P62942 P42345 | CHEMBL2221341 | 0.109339753231 |
| Phosphodiesterase 5A | PDE5A | O76074 | CHEMBL1827 | 0.109339753231 |
| Matrix metalloproteinase 9 | MMP9 | P14780 | CHEMBL321 | 0.109339753231 |
| Interleukin-1 receptor-associated kinase 4 | IRAK4 | Q9NWZ3 | CHEMBL3778 | 0.109339753231 |
| Corticotropin releasing factor receptor 1 | CRHR1 | P34998 | CHEMBL1800 | 0.109339753231 |
| Matrix metalloproteinase 3 | MMP3 | P08254 | CHEMBL283 | 0.109339753231 |
| Thrombin and coagulation factor X | F10 | P00742 | CHEMBL244 | 0.109339753231 |
| Protein farnesyltransferase | FNTA FNTB | P49354 P49356 | CHEMBL2094108 | 0.109339753231 |
| Phosphodiesterase 2A | PDE2A | O00408 | CHEMBL2652 | 0.109339753231 |
| P2X purinoceptor 3 | P2RX3 | P56373 | CHEMBL2998 | 0.109339753231 |
| Macrophage colony stimulating factor receptor | CSF1R | P07333 | CHEMBL1844 | 0.109339753231 |
| Tyrosine-protein kinase JAK3 | JAK3 | P52333 | CHEMBL2148 | 0.109339753231 |
| Protein kinase C gamma | PRKCG | P05129 | CHEMBL2938 | 0.109339753231 |
| Protein kinase C delta | PRKCD | Q05655 | CHEMBL2996 | 0.109339753231 |
| Protein kinase C alpha | PRKCA | P17252 | CHEMBL299 | 0.109339753231 |
| Cyclin-dependent kinase 4/cyclin D1 | CCND1 CDK4 | P24385 P11802 | CHEMBL1907601 | 0.109339753231 |
| Cyclin-dependent kinase 2/cyclin E | CCNE2 CDK2 CCNE1 | O96020 P24941 P24864 | CHEMBL2094126 | 0.109339753231 |
| Casein kinase II alpha | CSNK2A1 | P68400 | CHEMBL3629 | 0.109339753231 |
| Cyclin-dependent kinase 2/cyclin A | CDK2 CCNA1 CCNA2 | P24941 P78396 P20248 | CHEMBL2094128 | 0.109339753231 |
| PI3-kinase p110- beta subunit | PIK3CB | P42338 | CHEMBL3145 | 0.109339753231 |
| Nerve growth factor receptor Trk-A | NTRK1 | P04629 | CHEMBL2815 | 0.109339753231 |
| p53-binding protein Mdm-2 | MDM2 | Q00987 | CHEMBL5023 | 0.109339753231 |
| Serine/threonineprotein kinase SMG1 | SMG1 | Q96Q15 | CHEMBL1795195 | 0.109339753231 |
| Tyrosine-protein kinase ABL | ABL1 | P00519 | CHEMBL1862 | 0.109339753231 |
| Proto-oncogene vav | VAV1 | P15498 | CHEMBL3259472 | 0.109339753231 |
| Phosphodiesterase 10A | PDE10A | Q9Y233 | CHEMBL4409 | 0.109339753231 |
References
- Stien, D. Marine microbial diversity as a source of bioactive natural products. Mar. Drugs 2020, 18, 215. [Google Scholar] [CrossRef]
- Liu, Z.; Zhao, J.Y.; Sun, S.F.; Li, Y.; Liu, Y.B. Fungi: Outstanding source of novel chemical scaffolds. J. Asian Nat. Prod. Res. 2020, 22, 99–120. [Google Scholar] [CrossRef]
- Carroll, A.R.; Copp, B.R.; Davis, R.A.; Keyzers, R.A.; Prinsep, M.R. Marine natural products. Nat. Prod. Rep. 2020, 37, 175–223. [Google Scholar] [CrossRef] [PubMed]
- Samirana, P.O.; Murti, Y.B.; Jenie, R.I.; Setyowati, E.P. Marine Sponge-Derived Fungi: Fermentation and Cytotoxic Activity. J. Appl. Pharm. Sci. 2021, 11, 21–39. [Google Scholar]
- Noman, E.; Al-Shaibani, M.M.; Bakhrebah, M.A.; Almoheer, R.; Al-Sahari, M.; Al-Gheethi, A.; Radin Mohamed, R.M.S.; Almulaiky, Y.Q.; Abdulaal, W.H. Potential of anti-cancer activity of secondary metabolic products from marine fungi. J. Fungi 2021, 7, 436. [Google Scholar] [CrossRef]
- Sung, H.A.-O.; Ferlay, J.; Siegel, R.A.-O.; Laversanne, M.; Soerjomataram, I.; Jemal, A.; Bray, F. Global Cancer Statistics 2020: GLOBOCAN Estimates of Incidence and Mortality Worldwide for 36 Cancers in 185 Countries. CA Cancer J. Clin. 2021, 71, 209–249. [Google Scholar] [CrossRef] [PubMed]
- Arnold, M.; Morgan, E.; Rumgay, H.; Mafra, A.; Singh, D.; Laversanne, M.; Vignat, J.; Gralow, J.R.; Cardoso, F.; Siesling, S.; et al. Current and future burden of breast cancer: Global statistics for 2020 and 2040. Breast 2022, 66, 15–23. [Google Scholar] [CrossRef]
- Cheng, M.M.; Tang, X.L.; Sun, Y.T.; Song, D.Y.; Cheng, Y.J.; Liu, H.; Li, P.L.; Li, G.Q. Biological and chemical diversity of marine sponge-derived microorganisms over the last two decades from 1998 to 2017. Molecules 2020, 25, 853. [Google Scholar] [CrossRef]
- Phan Thi, H.T.; Yurchenko, E.A.; Yurchenko, A.N.; Ngo Thi, D.N.; Vo Thi, D.T.; Cao Thi, T.H.; Tran Thi, T.V.; Pham Duc, T.; Huynh Hoang, N.K.; Le Dinh, H.; et al. Evaluation of cytotoxic activity of marine fungi isolated from sponges in Nha Trang bay. Vietnam J. Mar. Sci. Technol. 2022, 22, 51–57. [Google Scholar] [CrossRef] [PubMed]
- Varga, J.; Samson, R.A. Aspergillus in the Genomic Era; Wageningen Academic Publishers: Gelderland, The Netherlands, 2008; pp. 1–334. [Google Scholar]
- Hubka, V.; Nováková, A.; Samson, R.A.; Houbraken, J.; Frisvad, J.C.; Sklenář, F.; Varga, J.; Kolařík, M. Aspergillus europaeus sp. nov., a widely distributed soil-borne species related to A. wentii (section Cremei). Plant Syst. Evol. 2016, 302, 641–650. [Google Scholar] [CrossRef]
- Dorner, J.W.; Cole, R.J.; Springer, J.P.; Cox, R.H.; Cutler, H.; Wicklow, D.T. Isolation and identification of two new biologically active norditerpene dilactones from Aspergillus wentii. Phytochemistry 1980, 19, 1157–1161. [Google Scholar] [CrossRef]
- Wells, J.M.; Cole, R.J.; Kirksey, J.W. Emodin, a Toxic Metabolite of Aspergillus wentii Isolated from Weevil-Damaged Chestnuts. Appl. Microbiol. 1975, 30, 26–28. [Google Scholar] [CrossRef]
- Assante, G.; Camarda, L.; Nasini, G. Secondary mould metabolites. IX. Structure of a new bianthrone and of three new secoanthraquinones from Aspergillus wentii Wehmer [Toxicity to chickens]. Gazz. Chim. Ital. 1980, 110, 629–631. [Google Scholar]
- Deshmukh, S.K.; Prakash, V.; Ranjan, N. Marine fungi: A source of potential anticancer compounds. Front. Microbiol. 2018, 8, 2536. [Google Scholar] [CrossRef] [PubMed]
- Du, X.; Liu, D.; Huang, J.; Zhang, C.; Proksch, P.; Lin, W. Polyketide derivatives from the sponge associated fungus Aspergillus europaeus with antioxidant and NO inhibitory activities. Fitoterapia 2018, 130, 190–197. [Google Scholar] [CrossRef]
- Fouillaud, M.; Venkatachalam, M.; Girard-Valenciennes, E.; Caro, Y.; Dufossé, L. Anthraquinones and derivatives from marine-derived fungi: Structural diversity and selected biological activities. Mar. Drugs 2016, 14, 64. [Google Scholar] [CrossRef]
- Selvakumar, V.; Singh, S.; Kannan, K.; Annamalai, P. Pharmaceutically important metabolites from marine fungi. In Bioactive Natural Products in Drug Discovery; Springer: Singapore, 2020; pp. 411–425. [Google Scholar]
- Wang, Q.-X.; Bao, L.; Yang, X.-L.; Guo, H.; Yang, R.-N.; Ren, B.; Zhang, L.-X.; Dai, H.-Q.; Guo, L.-D.; Liu, H.-W. Polyketides with antimicrobial activity from the solid culture of an endolichenic fungus Ulocladium sp. Fitoterapia 2012, 83, 209–214. [Google Scholar] [CrossRef] [PubMed]
- Kurobane, I.; Vining, L.C.; Gavin McInnes, A. Biosynthetic relationships among the secalonic acids isolation of emodin, endocrocin and secalonic acids from Pyrenochaeta terrestris and Aspergillus aculeatus. J. Antibiot. 1979, 32, 1256–1266. [Google Scholar] [CrossRef] [PubMed]
- Botta, B.; Delle Monache, F.; Delle Monache, G.; MariniBettolo, G.B.; Oguakwa, J.U. 3-Geranyloxy-6-methyl-1,8-dihydroxyanthraquinone and vismiones C, D and E from Psorospermum febrifugum. Phytochemistry 1983, 22, 539–542. [Google Scholar] [CrossRef]
- Hussein, A.A.; Bozzi, B.; Correa, M.; Capson, T.L.; Kursar, T.A.; Coley, P.D.; Solis, P.N.; Gupta, M.P. Bioactive constituents from three Vismia species. J. Nat. Prod. 2003, 66, 858–860. [Google Scholar] [CrossRef]
- Boonnak, N.; Karalai, C.; Chantrapromma, S.; Ponglimanont, C.; Kanjana-Opas, A.; Chantrapromma, K.; Fun, H.-K. Quinonoids from the barks of Cratoxylum formosum subsp. pruniflorum. Can. J. Chem. 2007, 85, 341–345. [Google Scholar] [CrossRef]
- Laphookhieo, S.; Maneerat, W.; Koysomboon, S. Antimalarial and cytotoxic phenolic compounds from Cratoxylum maingayi and Cratoxylum cochinchinense. Molecules 2009, 14, 1389–1395. [Google Scholar] [CrossRef] [PubMed]
- Frisch, M.J.; Trucks, G.W.; Schlegel, H.B.; Scuseria, G.E.; Robb, M.A.; Cheeseman, J.R.; Scalmani, G.; Barone, V.; Petersson, G.A.; Nakatsuji, H.; et al. Gaussian 16 Rev. B.01; Scientific Research: Wallingford, CT, USA, 2016. [Google Scholar]
- Yu, J.; Yang, H.; Lv, C.; Dai, X. The cytotoxicity of karanjin toward breast cancer cells is involved in the PI3K/Akt signaling pathway. Drug Dev. Res. 2022, 83, 1673–1682. [Google Scholar] [CrossRef]
- Raghav, P.K.; Singh, A.K.; Gangenahalli, G. Stem cell factor and NSC87877 combine to enhance c-Kit mediated proliferation of human megakaryoblastic cells. PLoS ONE 2018, 13, e0206364. [Google Scholar]
- Gfeller, D.; Grosdidier, A.; Wirth, M.; Daina, A.; Michielin, O.; Zoete, V. SwissTargetPrediction: A web server for target prediction of bioactive small molecules. Nucleic Acids Res. 2014, 42, W32–W38. [Google Scholar] [CrossRef]
- Zafar, F.; Gupta, A.; Thangavel, K.; Khatana, K.; Sani, A.A.; Ghosal, A.; Tandon, P.; Nishat, N. Physicochemical and Pharmacokinetic Analysis of Anacardic Acid Derivatives. ACS Omega 2020, 5, 6021–6030. [Google Scholar] [CrossRef] [PubMed]
- Gautam, R.; Karkhile, K.V.; Bhutani, K.K.; Jachak, S.M. Anti-inflammatory, cyclooxygenase (COX)-2, COX-1 inhibitory, and free radical scavenging effects of Rumex nepalensis. Planta Med. 2010, 76, 1564–1569. [Google Scholar] [CrossRef] [PubMed]
- Song, C.; Wu, M.; Zhang, Y.; Li, J.; Yang, J.; Wei, D.; Li, H.; Guo, L.; Qin, J. Bioactive Monomer and Polymer Polyketides from Edible Mushroom Cortinarius caerulescens as Glutamate Dehydrogenase Inhibitors and Antioxidants. J. Agric. Food Chem. 2022, 70, 804–814. [Google Scholar] [CrossRef] [PubMed]
- Berthier, E.; Lim, F.Y.; Deng, Q.; Guo, C.-J.; Kontoyiannis, D.P.; Wang, C.C.C.; Rindy, J.; Beebe, D.J.; Huttenlocher, A.; Keller, N.P. Low-Volume Toolbox for the Discovery of Immunosuppressive Fungal Secondary Metabolites. PLoS Pathog. 2013, 9, e1003289. [Google Scholar] [CrossRef] [PubMed]
- Lee, C.; Li, W.; Bang, S.; Lee, S.J.; Kang, N.-y.; Kim, S.; Kim, T.I.; Go, Y.; Shim, S.H. Secondary metabolites of the endophytic fungus Alternaria alternata JS0515 isolated from Vitex rotundifolia and their effects on pyruvate dehydrogenase activity. Molecules 2019, 24, 4450. [Google Scholar] [CrossRef]
- Romsdahl, J.; Wang, C.C.C. Recent advances in the genome mining of: Aspergillus secondary metabolites (covering 2012–2018). Med. Chem. Commun. 2019, 10, 840–866. [Google Scholar] [CrossRef] [PubMed]
- Löhr, N.A.; Eisen, F.; Thiele, W.; Platz, L.; Motter, J.; Hüttel, W.; Gressler, M.; Müller, M.; Hoffmeister, D. Unprecedented Mushroom Polyketide Synthases Produce the Universal Anthraquinone Precursor. Angew. Chem. Int. Ed. 2022, 61, e202116142. [Google Scholar] [CrossRef] [PubMed]
- Sazonova, E.V.; Chesnokov, M.S.; Zhivotovsky, B.; Kopeina, G.S. Drug toxicity assessment: Cell proliferation versus cell death. Cell Death Discov. 2022, 8, 417. [Google Scholar] [CrossRef] [PubMed]
- Manetti, F.; Stecca, B.; Santini, R.; Maresca, L.; Giannini, G.; Taddei, M.; Petricci, E. Pharmacophore-based virtual screening for identification of negative modulators of GLI1 as potential anticancer agents. ACS Med. Chem. Lett. 2020, 11, 832–838. [Google Scholar] [CrossRef] [PubMed]
- Infante, P.; Mori, M.; Alfonsi, R.; Ghirga, F.; Aiello, F.; Toscano, S.; Ingallina, C.; Siler, M.; Cucchi, D.; Po, A. Gli1/DNA interaction is a druggable target for Hedgehog-dependent tumors. EMBO J. 2015, 34, 200–217. [Google Scholar] [CrossRef] [PubMed]
- Daina, A.; Michielin, O.; Zoete, V. SwissTargetPrediction: Updated data and new features for efficient prediction of protein targets of small molecules. Nucleic Acids Res. 2019, 47, W357–W364. [Google Scholar] [CrossRef]
- Broude, E.V.; Gyorffy, B.; Chumanevich, A.A.; Chen, M.; McDermott, M.S.J.; Shtutman, M.; Catroppo, J.F.; Roninson, I.B. Expression of CDK8 and CDK8-interacting genes as potential biomarkers in breast cancer. Curr. Cancer Drug Targets 2015, 15, 739–749. [Google Scholar] [CrossRef] [PubMed]
- Menzl, I.; Witalisz-Siepracka, A.; Sexl, V. CDK8-Novel Therapeutic Opportunities. Pharmaceuticals 2019, 12, 92. [Google Scholar] [CrossRef]
- Laronha, H.; Caldeira, J. Structure and Function of Human Matrix Metalloproteinases. Cells 2020, 9, 1076. [Google Scholar] [CrossRef]
- Boire, A.; Covic, L.; Agarwal, A.; Jacques, S.; Sherifi, S.; Kuliopulos, A. PAR1 Is a Matrix Metalloprotease-1 Receptor that Promotes Invasion and Tumorigenesis of Breast Cancer Cells. Cell 2005, 120, 303–313. [Google Scholar] [CrossRef]
- Düsterhöft, S.; Lokau, J.; Garbers, C. The metalloprotease ADAM17 in inflammation and cancer. Pathol.-Res. Pract. 2019, 215, 152410. [Google Scholar] [CrossRef] [PubMed]
- Carr, S.F.; Papp, E.; Wu, J.C.; Natsumeda, Y. Characterization of human type I and type II IMP dehydrogenases. J. Biol. Chem. 1993, 268, 27286–27290. [Google Scholar] [CrossRef] [PubMed]
- Benjanuwattra, J.; Chaiyawat, P.; Pruksakorn, D.; Koonrungsesomboon, N. Therapeutic potential and molecular mechanisms of mycophenolic acid as an anticancer agent. Eur. J. Pharmacol. 2020, 887, 173580. [Google Scholar] [CrossRef] [PubMed]
- Sidi, Y.; Panet, C.; Wasserman, L.; Cyjon, A.; Novogrodsky, A.; Nordenberg, J. Growth inhibition and induction of phenotypic alterations in MCF-7 breast cancer cells by an IMP dehydrogenase inhibitor. Br. J. Cancer 1988, 58, 61–63. [Google Scholar] [CrossRef]
- Naffouje, R.; Grover, P.; Yu, H.; Sendilnathan, A.; Wolfe, K.; Majd, N.; Smith, E.P.; Takeuchi, K.; Senda, T.; Kofuji, S.; et al. Anti-Tumor Potential of IMP Dehydrogenase Inhibitors: A Century-Long Story. Cancers 2019, 11, 1346. [Google Scholar] [CrossRef]
- Nagai, M.; Natsumeda, Y.; Weber, G. Proliferation-linked Regulation of Type II IMP Dehydrogenase Gene in Human Normal Lymphocytes and HL-60 Leukemic Cells1. Cancer Res. 1992, 52, 258–261. [Google Scholar]
- Natsumeda, Y.; Ohno, S.; Kawasaki, H.; Konno, Y.; Weber, G.; Suzuki, K. Two distinct cDNAs for human IMP dehydrogenase. J. Biol. Chem. 1990, 265, 5292–5295. [Google Scholar] [CrossRef]
- Chambers, M.C.; MacLean, B.; Burke, R.; Amodei, D.; Ruderman, D.L.; Neumann, S.; Gatto, L.; Fischer, B.; Pratt, B.; Egertson, J.; et al. A cross-platform toolkit for mass spectrometry and proteomics. Nat. Biotechnol. 2012, 30, 918–920. [Google Scholar] [CrossRef]
- Pluskal, T.; Castillo, S.; Villar-Briones, A.; Orešič, M. MZmine 2: Modular framework for processing, visualizing, and analyzing mass spectrometry-based molecular profile data. BMC Bioinform. 2010, 11, 395. [Google Scholar] [CrossRef]
- Myers, O.D.; Sumner, S.J.; Li, S.; Barnes, S.; Du, X. One Step Forward for Reducing False Positive and False Negative Compound Identifications from Mass Spectrometry Metabolomics Data: New Algorithms for Constructing Extracted Ion Chromatograms and Detecting Chromatographic Peaks. Anal. Chem. 2017, 89, 8696–8703. [Google Scholar] [CrossRef]
- Available online: https://lumiprobe.com/protocols/cell-proliferation-assay (accessed on 29 December 2022).
- Grosdidier, A.; Zoete, V.; Michielin, O. Fast docking using the CHARMM force field with EADock DSS. J. Comput. Chem. 2011, 32, 2149–2159. [Google Scholar] [CrossRef] [PubMed]
- Available online: https://scifinder-n.cas.org/searchDetail/substance/63f62f3f692896544b2a8a0c/substanceDetails (accessed on 22 February 2023).


| Pos. | δC, Mult | δH (J in Hz) | HMBC |
|---|---|---|---|
| 1 | 156.1, C | ||
| 2 | 114.8, C | ||
| 3 | 162.0, C | ||
| 4 | 97.8, CH | 6.54, s | 1 *, 2, 4a, 11 *, 9 *, 10 |
| 4a | 108.1, C | ||
| 5 | 43.4, CH2 | 3.02, d (15.8) 3.06, d (15.8) | 4a, 6, 7, 8a *, 10, 10a, 6-Me |
| 6 | 71.0, C | ||
| 7 | 51.1, CH2 | 2.81, d (17.2) 2.85, d (17.2) | 4a *, 5, 6, 6-Me, 8 |
| 8 | 201.5, C | ||
| 8a | 139.0, C | ||
| 9 | 165.9, C | ||
| 9a | 108.1, C | ||
| 10 | 117.6, CH | 6.86, s | 1 *, 4, 4, 5, 8, 8a, 9 * |
| 10a | 134.1, C | ||
| 11 | 22.0, CH2 | 3.44, d (7.1) 3.44, d (7.1) | 1, 2, 3, 12, 13 |
| 12 | 122.3, CH | 5.24, t (6.9) | 2, 11, 14, 15 |
| 13 | 131.7, C | ||
| 14 | 17.8, CH3 | 1.81, s | 12, 13, 15 |
| 15 | 25.8, CH3 | 1.68, s | 12, 13, 14 |
| 1-OH | - | 9.95, s | 1, 2, 4a |
| 3-OMe | 55.6, CH3 | 3.92, s | 3 |
| 6-Me | 28.8, CH3 | 1.44, s | 5, 6, 7, 8 * |
| PC-3 | MCF-7 | MCF-10A | H9c2 |
|---|---|---|---|
| IC50, µM | |||
| 10.1 ± 2.1 | 9.0 ± 0.4 | 65.3 ± 2.2 | 69.3 ± 8.0 |
| Target | ΔG (kcal/mol) | Full Fitness (kcal/mol) | Energy | H-Binding Residue/ H-Bonding Distance |
|---|---|---|---|---|
| Vismione E | ||||
| IMPDH2 | −7.478466 | −5339.8955 | 7.369 | Lys229 H …O 2.165 Å |
| −7.4588733 | −5338.026 | 18.4965 | Lys489 HN … O 2.678 Å H …O Glu487 3.265 Å | |
| MMP1 | −6.889332 | −4766.2676 | 29.1129 | H…O Gln974 2.119 Å |
| ADAM17 | −7.782852 | −3054.5269 | 12.3965 | Lys455 H … O 3.173 Å Ala266 HN … O 2.051 Å H … O Ala270 2.679 Å Lys273 H … O 2.302 Å |
| CDK8CCNC | −7.634472 | −3557.7717 | 15.7452 | Lys18 H…O 2.056 Å |
| Mycophenolic acid | ||||
| IMPDH2 | −7.7401905 | −5380.3955 | 1.44649 | Lys489 HN … O 2.830 Å Asp16 HN … O 2.136 Å H …O Pro14 1.805 Å |
| Theoretical de-prenylated derivative of vismione E | ||||
| IMPDH2 | −6.7235613 | −5343.706 | 22.4293 | Lys489 HN … O 2.269 Å |
| −6.6762652 | −5344.5107 | 18.8873 | H …O Asp15 2.911 Å | |
Disclaimer/Publisher’s Note: The statements, opinions and data contained in all publications are solely those of the individual author(s) and contributor(s) and not of MDPI and/or the editor(s). MDPI and/or the editor(s) disclaim responsibility for any injury to people or property resulting from any ideas, methods, instructions or products referred to in the content. |
© 2023 by the authors. Licensee MDPI, Basel, Switzerland. This article is an open access article distributed under the terms and conditions of the Creative Commons Attribution (CC BY) license (https://creativecommons.org/licenses/by/4.0/).
Share and Cite
Girich, E.V.; Trinh, P.T.H.; Nesterenko, L.E.; Popov, R.S.; Kim, N.Y.; Rasin, A.B.; Menchinskaya, E.S.; Kuzmich, A.S.; Chingizova, E.A.; Minin, A.S.; et al. Absolute Stereochemistry and Cytotoxic Effects of Vismione E from Marine Sponge-Derived Fungus Aspergillus sp. 1901NT-1.2.2. Int. J. Mol. Sci. 2023, 24, 8150. https://doi.org/10.3390/ijms24098150
Girich EV, Trinh PTH, Nesterenko LE, Popov RS, Kim NY, Rasin AB, Menchinskaya ES, Kuzmich AS, Chingizova EA, Minin AS, et al. Absolute Stereochemistry and Cytotoxic Effects of Vismione E from Marine Sponge-Derived Fungus Aspergillus sp. 1901NT-1.2.2. International Journal of Molecular Sciences. 2023; 24(9):8150. https://doi.org/10.3390/ijms24098150
Chicago/Turabian StyleGirich, Elena V., Phan Thi Hoai Trinh, Liliana E. Nesterenko, Roman S. Popov, Natalya Yu. Kim, Anton B. Rasin, Ekaterina S. Menchinskaya, Aleksandra S. Kuzmich, Ekaterina A. Chingizova, Artem S. Minin, and et al. 2023. "Absolute Stereochemistry and Cytotoxic Effects of Vismione E from Marine Sponge-Derived Fungus Aspergillus sp. 1901NT-1.2.2" International Journal of Molecular Sciences 24, no. 9: 8150. https://doi.org/10.3390/ijms24098150