Article

Human Tissues Exhibit Diverse Composition of Translation Machinery

by
Aleksandra S. Anisimova
1,2,*,†,‡,
Natalia M. Kolyupanova
2,†,
Nadezhda E. Makarova
1,2,§,
Artyom A. Egorov
1,‖,
Ivan V. Kulakovskiy
3,4,5 and
Sergey E. Dmitriev
1,2,*
1
Belozersky Institute of Physico-Chemical Biology, Lomonosov Moscow State University, 119234 Moscow, Russia
2
Faculty of Bioengineering and Bioinformatics, Lomonosov Moscow State University, 119234 Moscow, Russia
3
Vavilov Institute of General Genetics, Russian Academy of Sciences, 117971 Moscow, Russia
4
Institute of Protein Research, Russian Academy of Sciences, 142290 Pushchino, Russia
5
Laboratory of Regulatory Genomics, Institute of Fundamental Medicine and Biology, Kazan Federal University, 420008 Kazan, Russia
*
Authors to whom correspondence should be addressed.
These authors contributed equally to this work.
Current address: Max Perutz Labs, Vienna BioCenter, Medical University of Vienna, 1030 Vienna, Austria.
§
Current address: Faculty of Biology, University of Barcelona, 08028 Barcelona, Catalonia, Spain.
Current address: Department of Experimental Medical Science, Lund University, 22362 Lund, Sweden.
Int. J. Mol. Sci. 2023, 24(9), 8361; https://doi.org/10.3390/ijms24098361
Submission received: 5 March 2023 / Revised: 26 April 2023 / Accepted: 3 May 2023 / Published: 6 May 2023
(This article belongs to the Special Issue Molecular Regulation and Mechanism of Ribonucleoprotein Complexes)

Abstract

:
While protein synthesis is vital for the majority of cell types of the human body, diversely differentiated cells require specific translation regulation. This suggests the specialization of translation machinery across tissues and organs. Using transcriptomic data from GTEx, FANTOM, and Gene Atlas, we systematically explored the abundance of transcripts encoding translation factors and aminoacyl-tRNA synthetases (ARSases) in human tissues. We revised a few known and identified several novel translation-related genes exhibiting strict tissue-specific expression. The proteins they encode include eEF1A1, eEF1A2, PABPC1L, PABPC3, eIF1B, eIF4E1B, eIF4ENIF1, and eIF5AL1. Furthermore, our analysis revealed a pervasive tissue-specific relative abundance of translation machinery components (e.g., PABP and eRF3 paralogs, eIF2B and eIF3 subunits, eIF5MPs, and some ARSases), suggesting presumptive variance in the composition of translation initiation, elongation, and termination complexes. These conclusions were largely confirmed by the analysis of proteomic data. Finally, we paid attention to sexual dimorphism in the repertoire of translation factors encoded in sex chromosomes (eIF1A, eIF2γ, and DDX3), and identified the testis and brain as organs with the most diverged expression of translation-associated genes.

1. Introduction

In multicellular organisms, differences between cell types are largely defined by specific patterns of gene expression. The cell specialization is partially determined at the translational level. Multiple studies showed that gene expression profiles at the level of transcription and translation vary across organs (see [1,2] and references therein). However, the differential regulation of protein synthesis across cell types and tissues is still poorly studied [3,4].
Recent advances in high-throughput approaches gave a new impetus to research in this field [5]. The cell type-specific expression of tagged ribosomal proteins provided a methodology for affinity purification of polysomal mRNAs from defined cell populations within a complex tissue [6,7,8]. These approaches were further enhanced by integration with ribosome profiling (Ribo-Seq), a technique that allows the analysis of ribosome occupancy of mRNA on a transcriptome-wide scale [9,10]. Although these techniques enabled quantitative and qualitative characterization of translatome from specific cells and lineages [10,11], existing studies have a limited ability to assess a bona fide translation efficiency of particular transcripts due to a lack of the complementing transcriptome information (RNA-Seq) from the same cells. Recently, studies involving Ribo-Seq of animal tissues and organs revealed organ-specific differences in translation efficiency and elongation speed [12,13,14,15]. Other findings revealed different tRNA repertoires and codon usage in different tissues [16,17], as well as peculiar features such as the readthrough rate [18]. However, to which extent the tissue-specificity of gene expression is determined at the translation level is still a poorly resolved issue.
It is clear that the variability of the transcriptome across cell types requires specialization of the translation apparatus. Although protein synthesis machinery is indispensable for life and hence thought to be ubiquitously present, recent systematical analyses revealed that some ribosomal components [19,20,21] and tRNAs [22,23] demonstrate tissue-specific expressions. This is likely true for other components of translation machinery, such as translation factors, aminoacyl-tRNA synthetases (ARSases), and other auxiliary proteins, but only a few cases of the tissue-specific expression of these components have been described until now.
The classic example is the well-documented tissue-specific expression of two eEF1A paralogs in rodents, with eEF1A2 present only in the brain, heart, and muscle and eEF1A1 expressed in all other tissues [24,25]. Testis-restricted transcription was reported for the human PABPC3 gene [26], which is absent in mice, while gonad-specific expression of other poly(A)-binding protein paralog, PABPC1L/ePAB, is controlled at both transcriptional and post-transcriptional levels in mice and humans [27,28]. An elevated concentration in the testis was also shown for translation elongation factor eIF5A2 [29]. Diverged cap-binding protein eIF4E1B was declared to be oocyte-specific in some vertebrates (for review, see [30]), although its expression has not been extensively analyzed across multiple tissues and organs.
The above fragmentary information indicates that the expression of selected translation machinery components is restricted to particular cell types or tissues. It is even more intriguing that the abundance of canonical translation factors, such as eIF2γ, eIF5, ETF1/eRF1, GSPT2/eRF3b, eEF1B subunits, or mitochondrial translation factors, also varies significantly across tissues [31,32,33,34,35,36,37,38,39,40]. Thus, the uniformity of translation apparatus in different tissues is illusory, suggesting that distinct translational properties of human cell types exist that provide an additional layer of tissue-specific regulation of gene expression.
As mammalian organs require diverse levels of protein synthesis activity [41,42,43], it is expected that some of the tissues have more translation machinery components, including ribosomes, than others [19,20,44]. However, it remains unclear whether this difference significantly affects translation regulation, as, in many cases, it is determined not by the absolute but by the relative abundance of translation factors [45]. To our knowledge, no such analyses have been performed yet.
Here, using gene expression data from multiple sources, we systematically analyzed the abundance of mRNAs encoding translation factors and ARSases across human tissues. We found intriguing differences in the transcript levels, not only in terms of the absolute values but also in relative shares within physically and functionally related complexes. The diverged expression repertoire of translation-associated genes was especially prominent in the testis and brain. Where possible, we confirmed these observations by analysis of proteomic data.

2. Results

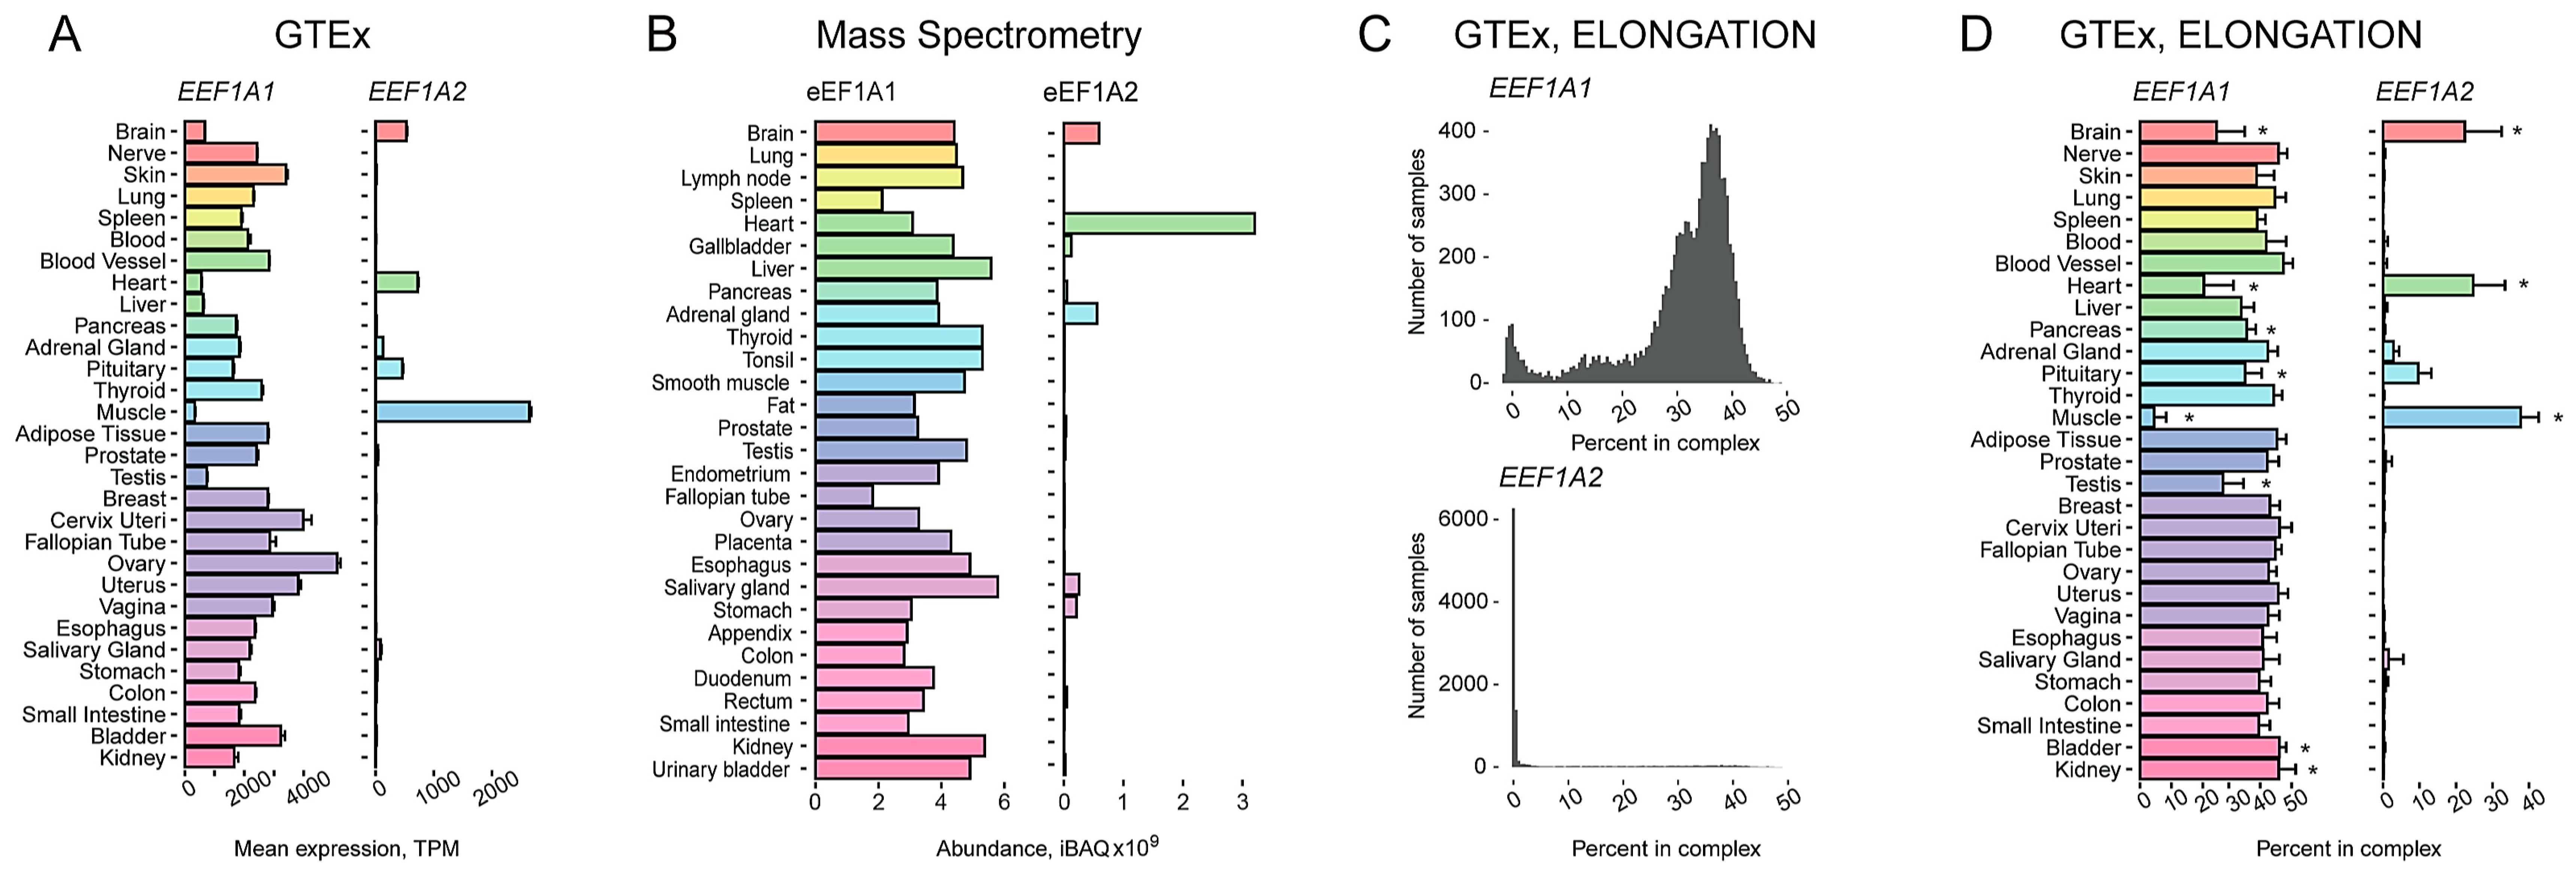
2.1. Characterization of a Tissue-Specific Expression Pattern of Two Human eEF1A Paralogs Using an Integrated Transcriptomic and Proteomic Data Analysis

We analyzed transcriptomic data from GTEx, FANTOM, and Gene Atlas databases, available for various human tissues, to assess the differential expression of genes encoding translation factors, ARSases, and auxiliary proteins (hereafter called TAG, for translation-associated genes). Since different cell types clearly have distinct requirements for protein synthesis and its efficiency, expected levels of translation machinery components vary in a wide range. This has previously been shown for the expression of ribosomal protein genes [19,20] (see also our rough estimate of their mean transcript abundance in GTEx shown in Supplementary Figure S1).
Therefore, to access the differences in the composition of translation machinery across tissues, we analyzed the relative abundance of the TAG transcripts within functional complexes. To this end, we determined several complexes and functional groups of translation-associated proteins (Table 1). TAGs were combined into groups based on known physical and functional interactions of their products. Each factor could be included in more than one group, and selected smaller groups were fully included in the larger ones. Importantly, the total expression of genes encoding components of the large groups such as “INITIATION”, “ELONGATION”, “TERMINATION”, or “ARSases” is well correlated with that of ribosomal protein genes (with a few exceptions, such as ovary in all groups, or brain and muscle in “ELONGATION”), as shown in Supplementary Figure S2. Next, we calculated two parameters for each gene, the transcript abundance value (see Materials and Methods) and the relative abundance of the transcript within the group. The latter allowed us to detect putative differences in the stoichiometry of the complexes.
The classic example of TAGs with a highly pronounced tissue-specific expression is the genes encoding rodent eEF1A paralogs. The translation elongation factor eEF1A delivers aminoacyl-tRNA to the ribosomal A-site for decoding, which is critical for protein synthesis [46,47]. It is also one of the most abundant proteins in the cell. In many eukaryotes, eEF1A is encoded by two paralogous genes. In mice and rats, these genes (Eef1a1 and Eef1a2) have a well-documented mutually exclusive expression pattern [25,48]. Here, we used the example of their human orthologs, EEF1A1, and EEF1A2, to illustrate a strategy for the characterization of tissue-specific TAG expression.
Analysis of GTEx data showed that human EEF1A2 is exclusively expressed not only in the brain, heart, and muscle (similarly to the rodent gene) but also in the pituitary and, to a lesser extent, in adrenal and salivary glands (Figure 1A). The expression pattern of EEF1A2 was in agreement with proteomics data from one of the most representative proteomics atlas of human tissues (Figure 1B) [1]. Notably, the gland-specific expression of this gene has not been documented before.
As expected, the expression of EEF1A1 generally mirrored that of EEF1A2, being reduced in the organs and tissues with elevated EEF1A2 expression (Figure 1A,B). However, a closer examination of its mRNA and protein representation among components of the “ELONGATION” complex revealed that, while relative eEF1A1 abundance was strongly reduced in skeletal muscle in comparison with most other tissues, in heart and brain samples, it remained at a high level, indicating the simultaneous presence of two eEF1A paralogs in these samples (Figure 1C,D). This contradicts the widely accepted view that the two eEF1A variants are mutually exclusive in tissues. Similar results were obtained with data from Gene Atlas and FANTOM databases (Supplementary Figure S3A,B). Due to a slightly different set of organs and tissues analyzed in the three projects, EEF1A2 expression in the tongue, eye, throat, and pineal gland also became evident.
To further strengthen our conclusions, we also used an alternative normalization approach. We took the weighted total of the ribosomal protein gene expression (see above, Supplementary Figure S1) instead of the “ELONGATION” complex genes to normalize the abundance of the EEF1A1 and EEF1A2 transcripts and obtained essentially the same results (Supplementary Figure S3C).
To additionally validate our method, we similarly processed the transcriptomic data for mRNAs encoding three subunits of eEF1B, a guanidine nucleotide exchange factor for eEF1A [47]: EEF1B2/eEF1Bα, EEF1D/eEF1Bδ, and EEF1G/eEF1Bγ. It was shown previously that absolute abundances of eEF1B subunits vary significantly across mammalian tissues [37]. In accordance with this, we found that the mRNA levels differ greatly between human tissues (Supplementary Figure S4A); however, their relative amounts showed a much more even distribution (Supplementary Figure S4B), suggesting a coordinated expression of the three genes and consistent with the essential function of the eEF1B complex in translation. A similar relative accordance is observed at the protein level (Supplementary Figure S4C,D), although with some outliers explained either by a lower representation of mass-spectrometry data or by post-transcriptional regulation.
In mammalian cells, eEF1A, together with eEF1B and valyl-tRNA synthetase (VARS1), forms a supercomplex called eEF1H (for review, see [47]). Thus, we also analyzed the relative abundance of eEF1H components at both mRNA and protein levels (Supplementary Figure S5). This analysis revealed an intriguingly high relative abundance of mRNA encoding VARS1 in the testis that was likely neutralized at the post-transcriptional level.

2.2. Tissue Specificity of Translation-Associated Proteins Encoded in Sex Chromosomes

To further validate our approach, we assessed the tissue specificity of translation-associated proteins encoded by sex chromosomes. Obviously, the expression of Y-encoded TAGs should not be detected in female-specific tissues. Among 65 protein-encoding genes located at the human Y chromosome [49], there are only two TAGs from our list, EIF1AY and DDX3Y. Both of them have paralogs at the X chromosome, EIF1AX and DDX3X, respectively.
EIF1AX and EIF1AY are paralogs coding for the canonical translation initiation factor eIF1A, which is indispensable for 48S preinitiation complex formation [45]. Two eIF1A variants are almost identical (they differ by only one amino acid out of one hundred forty-four, Leu50 in eIF1AY and Met50 in eIF1AX in humans) and thus probably have identical functions. An equal overall eIF1A level in male and female cells thus requires that the EIF1AX gene escapes X chromosome inactivation, which is indeed the case [50,51]. Analysis of EIF1AX and EIF1AY mRNA abundance confirmed the absence of the EIF1AY transcript in female-specific organs and revealed the differential expression between tissues (Supplementary Figure S6A). We then calculated their relative abundance within the group “INITIATION”. This approach revealed a slightly variable relative abundance of the EIF1AX mRNA, while the expression level of the EIF1AY gene was not uniform (Figure 2A). This analysis also showed a predominance of the EIF1AX gene as a source of the eIF1A protein but pointed to the heart as an organ with an apparently higher overall eIF1A level due to the elevated impact of EIF1AY expression. The proteomic data [1] available only for eIF1AX revealed its depletion in the testis in comparison with other factors of the “INITIATION” complex (Supplementary Figure S6B). This was not seen in transcriptomic data from either source and suggested an additional layer of regulation at the post-transcriptional level, as well as a putative role in specialized translational control in this organ. Interestingly, the presence of the Y-encoded eIF1A isoform is not a conserved feature in mammals, as mice have only one gene, Eif1ax, which does not escape X inactivation [52].
DDX3X and DDX3Y produce isoforms of DEAD-box helicase, DDX3, an auxiliary translation initiation component, which plays an essential role in eukaryotic RNA metabolism [53]. The two proteins share only 92% identity. DDX3X cannot substitute for DDX3Y function, while the replacement of DDX3X with DDX3Y does not affect the translation rate [54,55,56]. Deletions encompassing the DDX3Y gene are thought to result in spermatogenic failure (reviewed in [57,58]), although this opinion has been challenged recently [59]. Mutations in DDX3X are a cause of intellectual disability in females and a decreased viability in males (reviewed in [60]), which, as Venkataramanan et al. suggest, can be explained by the tissue-specific expression of DDX3X and DDX3Y [56]. Similar to EIF1AX, DDX3X escapes X-chromosome inactivation [52].
Our data analysis showed the absence of DDX3Y mRNA and protein in female-specific tissues that met our expectations. In contrast, both the mRNA and protein levels were high in the testis. DDX3X is expressed ubiquitously; however, the abundance of its transcript is somewhat higher in the female reproductive system (Figure 2B), but this slight difference is not reflected in proteomics data (Supplementary Figure S6C).
In humans, X-chromosome contains one more unevenly expressed TAG—EIF2S3. It codes for the γ-subunit of eIF2, a critical translation machinery component required for Met-tRNAi delivery during translation initiation. GTEx data analysis revealed that the EIF2S3 transcript abundance is higher in female reproductive tissues than in testes (Figure 2C), which is in agreement with its X-inactivation escape profile [61]. The relative expression of eIF2 complex components (Supplementary Figure S6D) varies between female and male reproductive tissues accordingly. Interestingly, mice have a paralog of Eif2s3x, Eif2s3y, which is required to drive spermatogenesis and represents one of the two genes irreplaceable for male mice fertility [62]. Mouse Eif2s3x escapes from X inactivation similarly to the human gene [52,61] and is expressed higher in female mice than in males in developing and adult brains at the transcriptional level [31]. Notably, mutations in the human EIF2S3 result in the brain affecting MEHMO syndrome (Mental retardation, Epileptic seizures, Hypogenitalism, Microcephaly, and Obesity) in males [63].

2.3. A Number of Translation Factors Have a Pronounced Tissue-Specific Representation within Corresponding Functional Groups

PABPC1 is usually considered the main source of cytoplasmic poly(A)-binding proteins in cells; however, our analysis indicates that some tissues have specifically produced PABP paralogs, which may act together with PABPC1 or partially substitute it. Not all of them were represented in proteomic datasets, but the available information, together with transcriptomic data, is sufficient to draw the following conclusions.
The level of the PABPC1 transcript is relatively high in reproductive tissues (Supplementary Figure S7A), while it is reduced in brain, heart, and skeletal muscles. The expression pattern is reflected in the “INITIATION” and, to some extent, “TERMINATION+” complexes (Supplementary Figure S7B). Analysis of the relative PABPC1 mRNA abundance among all PABPC paralogs (hereafter called “PABPC paralogs” group) also revealed a significant decline of its expression in muscles (Figure 3A), suggesting that its role in this organ may be of lower importance.
PABPC1L/ePAB was previously reported to have a gonad- and embryo-restricted expression [26,27]. This is consistent with its role in oocyte maturation in mice and its importance for female fertility in both mice and humans [64,65]. However, our analysis also unexpectedly revealed a high level of this transcript in the pituitary and thyroid glands, as well as in the liver and kidney, relative to that of other components of the “PABPCs complex” (Figure 3A). Its putative function in hormone-producing organs can contribute to its role in fertility.
PABPC3 was previously shown to be abundant only in the testis [26]. Our analysis confirmed this highly specific expression pattern at the mRNA level (Figure 3A), but the protein level was unexpectedly high not only in the testis but also in adipose tissue, colon, and prostate (Supplementary Figure S7C). This case highlights the importance of addressing gene expression regulation at different levels. Importantly, PABPC1, PABPC1L, and PABPC3 expressions are perturbed in infertile men [66].
PABPC4 is able to compensate for the loss of PABPC1 [67]. In accordance with this, our approach revealed that PABPC4 is upregulated at the mRNA and protein levels in muscle, heart, and pancreas in the “PABPCs complex”, where PABPC1 and PABPC5 are downregulated (Figure 3A).
PABPC5 is an X-linked poly(A)-binding protein [68]. The analysis of its relative abundance within “PABPC paralogs” revealed a relatively decreased level of the PABPC5 transcript in the pancreas, muscle, liver, salivary gland, and blood (Figure 3A, Supplementary Figure S7D). Interestingly, the pancreas, muscle, and liver are among the most translationally active tissues containing the highest amount of ribosomes [44], so this pattern suggests its regulatory role in general protein synthesis.
eRF1 is an essential translation termination factor encoded by the ETF1 gene. ETF1 was claimed to be expressed at a high level in the testis, brain, heart, and kidney and downregulated in the liver and colon [32]. The data obtained from GTEx (Figure 3B) only partially confirmed this, indicating the ETF1 mRNA abundance is lower in the liver, pancreas, kidney, and heart (likely the most metabolically active tissues [69]), as well as in the brain, while there no significant difference between the colon and other tissues was observed. Remarkably, ETF1, while encoding a general translation factor, demonstrated an uneven transcription level within the “TERMINATION+” group: its expression is higher in the muscle, heart, and pituitary (Figure 3C).
GSPT1 and GSPT2 code for GTP-binding termination factors, eRF3a/GSPT1 and eRF3b/GSPT2, respectively [35]. The factors have at least partially redundant functions, as eRF3b can compensate for a silenced eRF3a [36]. We found that the level of GSPT1 mRNA quite closely corresponds to that of mRNA encoding eRF1 (Figure 3B,C). On the contrary, analysis of the GSPT2 mRNA abundance suggests its specific relative increase in the brain and testis in comparison to other “TERMINATION” components (Figure 3C). The elevated GSPT2 mRNA level in the brain is consistent with Hoshino results [35] and may reflect a substituting role of eRF3b in non-proliferating cells, where eRF3a should be depleted.
GTPBP1 and GTPBP2 are GTPases involved in translational control: GTPBP1 has eEF1A-like elongation activity, while GTPBP2 is likely involved in stalling ribosome rescue [70,71]. Their expression in mammalian tissues is poorly studied. The mouse brain was shown to have an elevated level of the GTPBP1 transcripts [72], while the testis and thymus are the organs with an increased abundance of the GTPBP2 mRNA [73]. Our analysis of GTEx data revealed blood as a tissue with the highest level of the GTPBP1 mRNA in the human body (Figure 4A), suggesting their specific role in blood cell differentiation and physiology. Unfortunately, these tissues were not represented in the proteomics data that we analyzed in this study.
EIF4G3 codes for a paralog of eIF4G1. Both eIF4G1 and eIF4G3 are able to bind cap-binding protein eIF4E and RNA helicase eIF4A, thus forming the trimeric translation initiation factor eIF4F. In humans, these paralogs share less than 50% identity and could have slightly different functions [74]. It was demonstrated previously that EIF4G1 is highly expressed in the liver and testis, while EIF4G3 is upregulated in the testis and fetal brain and downregulated in the lung, heart, liver, and placenta [75,76]. In agreement with these data, we found the level of EIF4G3 transcript is elevated in the testis (Supplementary Figure S8A) or in the testis and brain if considered within the “INITIATION” group (Figure 4B). This is consistent with the fact that EIF4G3 mutations cause male infertility [77]. Proteomic data confirmed the elevated level of eIF4G3 in the testis and additionally revealed its elevated abundance in the small intestine and smooth muscle (Supplementary Figure S8B). Thus, while eIF4G1 likely represents the major source of eIF4G activity in most tissues (Figure 4B, Supplementary Figure S8B), eIF4G3 might differentially contribute to translation in different organs, providing a fine-tuning of cap-dependent and alternative translation initiation pathways [78].
eIF2B is a guanine nucleotide exchange factor for eIF2. It consists of five subunits, α to ε, encoded by EIF2B1-EIF2B5 genes, all of which are linked to a severe inherited human neurodegenerative disorder called Leukoencephalopathy with Vanishing White Matter, or VWM (for review, see [79]). Intriguingly, eIF2B subunits are known to form a number of differentially composed sub-complexes with non-identical activity [79]. Thus, we performed a comprehensive analysis of the relative abundance of individual eIF2B subunits and their mRNAs in comparison to those of all the subunits (the “eIF2B” group). At the mRNA level, we revealed the ubiquitous expression of five genes with no more than ~2-fold difference between tissues (Figure 4C), probably with some deviations in the testis (with a lower EIF2B1 and EIF2B5 levels and a higher EIF2B4 one), muscles, and heart (lower EIF2B1 and higher EIF2B3 levels). Importantly, we observed no prominent specificity in subunit abundance either at the mRNA or protein level in the brain, suggesting that the neural manifestation of VWM is not related to a distinct eIF2B composition in this organ. Mass-spectrometry data showed a more uneven subunit distribution (Supplementary Figure S8C), with putatively distinct stoichiometry in organs: for example, in the heart, liver, thyroid, salivary gland, small intestine, and kidney, EIF2B4 and EIF2B5 have an abundance above average levels, while EIF2B1 is below the average; in contrast, in the gallbladder, pancreas, endometrium, and esophagus, the proportions seem to be the opposite. While the discrepancy at the mRNA and protein levels can be partially explained by a lower quality of the mass-spectrometry data, it should be noted that the abundance of eIF2B subunits is known to be regulated at the post-transcriptional level [80]. Overall, these findings suggest a diverse composition of the eIF2B complex across the human tissues.
Another multisubunit initiation factor is eIF3. Depending on the organism and terminology, up to 13 proteins can be considered its subunits, named eIF3a-eIF3m (Table 1) [81,82,83]. Although some eIF3 subunits are thought to form sub-complexes or even function as independent proteins [83], our analysis revealed no cases of prominent tissue-specific expression of any of the subunits (Supplementary Figure S9). However, some fluctuations can be observed, for example, in the abundance of the EIF3G (higher in the testis), EIF3J (lower in the ovary and higher in the brain, liver, and muscles), and EIF3K (higher in the heart) transcripts.

2.4. New Striking Examples of Tissue-Specific Expression of Genes Encoding Translation Factors

Translation initiation factor eIF4E1B belongs to the eIF4E cap-binding protein family, but it has a low affinity for the m7G-cap [84]. In amphibians, the eIF4E1B orthologue is part of a multisubunit complex that specifically inhibits the translation of some mRNAs in oocytes [84,85]. Thus, it has been proposed that EIF4E1B expression is limited to ovaries and oocytes, where the factor plays a role in the translational repression of maternal mRNAs ensures subsequent reprogramming of the zygotic genome [84,86], while its canonical ortholog EIF4E1 is transcribed ubiquitously to support the cap-dependent translation. Unexpectedly, besides the ovary, we found a high level of the EIF4E1B expression also in the testis, retina, spinal cord, and brain, including pineal and pituitary glands (Figure 5A, Supplementary Figure S10A). This peculiar pattern of expression is probably related to that well documented for its putative partner CPEB [85,87].
EIF4ENIF1 encodes a multifunctional eIF4E-binding protein 4E-T that plays a role in the nucleocytoplasmic shuttling of eIF4E and in translational repression [88,89]. Interestingly, it binds not only the canonical eIF4E protein but also its orthologs (including eIF4E1B). Our analysis revealed that testis has the highest level of EIF4ENIF1 transcript and protein (Figure 5B, Supplementary Figure S10B,C).
eIF5A, a translation elongation factor having the unique post-translation modification hypusine, is encoded in the human genome by three genes: EIF5A, EIF5A2, and EIF5AL1. eIF5A1 (encoded by EIF5A) and EIF5AL1 are almost identical (98%), while eIF5A2 is slightly more diverged (84% identity) [29]. eIF5A1 is thought to be ubiquitous, while the EIF5A2 expression has been reported to be restricted by brain and testis only, where it is represented by two or more isoforms with different 3′ UTR lengths [29,90]. Our analysis of GTEx and mass-spectrometry data confirmed the ubiquitous expression of EIF5A but revealed a more complex pattern of the EIF5A2 expression (Figure 5C, Supplementary Figure S10D). In particular, eIF5A2 relative abundance is much lower at both mRNA and protein levels in the liver and probably some other visceral organs but noticeably higher in the testis. Additionally, we revealed a strict testis-specific expression of EIF5AL1: according to GTEx, this gene is almost exclusively expressed in this organ (Figure 5C). Yet, there was no information about the protein level of EIF5AL1. Taking into account the high similarity of eIF5A paralogs, it can be assumed that protein synthesis in male gonads specifically requires a higher eIF5A concentration, although a distinct testis-specific function of eIF5AL1 cannot be ruled out either.
BZW1/5MP2 and BZW2/5MP1 are eIF5-mimic proteins that regulate the stringency of start site selection [91]. The relative level of BZW1 mRNA varies moderately between tissues, being highest in the liver and testis and lowest in the pancreas (Figure 5D). In contrast, the relative abundance of BZW2 transcript (which is overall lower if assessed in the context of the “INITIATION+” group) is noticeably high in only two tissues, the heart and muscle (Figure 5D).
The elevated expression of BZW2 in the heart is also evident at the protein level, and it is also high in the placenta (Supplementary Figure S10E). This suggests that BZW1/5MP2 is likely a general regulator of protein synthesis, while BZW2/5MP1 could be a specialized factor for tissue- and mRNA-specific translational control.
A poorly studied protein, eIF1B is 92% identical to its paralog eIF1, which plays a major role in the start codon selection along with eIF5 [92]. While EIF1 relative expression is ubiquitous with little variations across organs (Figure 5E), EIF1B mRNA relative abundance is clearly higher in the heart and brain while lower in the skin and pancreas (Figure 5E). An even more complex distribution of eIF1B across tissues is observed at the protein level (Supplementary Figure S10F), in agreement with a proposed regulation at the level of translation [93]. The high similarity between eIF1B and eIF1, as well as some indirect data (see [92] and references therein), suggests the functional redundancy of these proteins. Thus, an increased total amount of the eIF1/eIF1B activity could contribute to tissue-specific regulation of initiation codon selection similar to that observed in cells artificially overexpressing eIF1 [94].
We also detected tissue-specific expression of some translation quality control factors that had not been reported before. PELO and HBS1L encode non-canonical termination factors mediating the dissociation of inactive, vacant, or stalled ribosomes (for review, see [95]). At least one case of a cell-type specific translational control by PELO and HBS1L abundance has been reported [96]. It is also important to note that HBS1L deficiency causes organ-specific defects during development [97]. These facts suggest the involvement of the factors in tissue-specific regulation of gene expression. Although PELO and HBS1L are thought to work in tandem, analyses of transcriptomic and mass-spectrometry data suggest that their abundances do not correlate well across tissues. In particular, we would like to report the inverse ratio of the encoding mRNAs in the brain and muscle (where the relative level of HBS1L mRNA is higher than that of PELO) vs. the adrenal gland, kidney, and spleen (where the proportion is inverse), see Figure 5F. At the protein level, the liver, gallbladder, duodenum, and testis have relatively higher levels of HBS1L than PELO, while the thyroid, prostate, and bladder demonstrate the opposite tendency (Supplementary Figure S10G).

2.5. Genes Encoding Some ARSases Also Have a Pronounced Tissue-Specific Expression

Aminoacyl-tRNA synthetases (ARSases) are key components of protein synthesis machinery. Surprisingly, we found that some of them also have diverse expression patterns across organs and tissues. As before, we analyzed absolute and relative mRNA and protein abundance of ARSases (including mitochondrial and dual-targeted ones) within functional groups. In Metazoa, some ARSases form a multiprotein complex with auxiliary factors, called Multiple ARSase Complex (MARS) [98]. Thus, we used two functional groups: “ARSases” and “ARSase COMPLEX” (Table 1).
HARS1 gene encoding histidyl-tRNA synthetase (HARS1) has been previously reported as highly expressed in the heart, brain, liver, and kidney [99]. According to our analysis, the corresponding mRNA is relatively more abundant in the brain, especially in the pituitary, as compared to other ARSases, although more or less homogenously distributed in other organs (Figure 6A, Supplementary Figure S11A). The TARSL2/TARS3 gene encoding threonyl-tRNA synthetase is relatively upregulated in the brain, spinal cord, muscle, and heart. The data from GTEx and FANTOM revealed that TARSL2 was efficiently transcribed in the brain and muscles (Figure 6A, Supplementary Figure S11A). It is consistent with its high abundance in muscle and heart in mice, as reported earlier [100]. Lung, blood, and placenta are the organs with increased relative levels of tryptophanyl-tRNA synthetase (WARS) transcript and protein (Figure 6B, Supplementary Figure S11B).
AIMP2 codes for a scaffold protein of the MARS complex, AIMP2, which has two partners: AIMP1 and EEFE1/AIMP3 [98]. The data obtained from all three databases indicated that the relative abundance of AIMP2 transcript (as compared to that of all “ARSase COMPLEX” components, see Table 1) is elevated in muscle tissues and testis (Figure 6C). In contrast, AIMP1 mRNA and protein did not show any prominent tissue-specific pattern (Figure 6C and Supplementary Figure S11C), The third key MARS component, EEF1E1, shows no unambiguous correlation between mRNA and protein levels, suggesting regulation of its abundance at the translational level.
ARSase components of MARS can also be differentially distributed across tissues. A more or less homogenous expression is exemplified by the KARS gene coding for lysyl-tRNA synthetase (Figure 6D and Supplementary Figure S11D). In contrast, the relative expression of NARS (encoding asparaginyl-tRNA synthetase), although similarly high in most tissues, is further elevated in the brain but repressed in the testis, as evident at both mRNA and protein levels (Figure 6D and Supplementary Figure S11D). Thus, MARS composition may vary in different human organs and tissues.

3. Discussion

mRNA translation is one of the basic processes in a living cell. However, it is clear that in a multicellular organism, various cell types differentially rely on the synthesis of new proteins and thus require different amounts of translation machinery components. In addition, the composition of this apparatus can contribute to the translational control of gene expression. Thus, human tissues and organs may have diverse concentrations, ratios, and architectures of ribosomes and ribosomal complexes, tRNAs, translation factors, and other auxiliary proteins.
Differential abundance of tRNA species in human tissues was reported previously [22,23]. Expression levels of genes coding for ribosomal proteins and rRNAs were found to vary significantly across human tissues as well [20,44,102,103]. A concept of the specialized ribosomes (comprehensively reviewed in [104]) even states that different mRNA species can be differentially translated by heterogeneously composed ribosomal particles, depending on cell types and conditions. The variable composition of ribosomes has indeed been confirmed by a number of studies [19,20,21,105]. Interest in this area has especially increased in recent years thanks to the research by Maria Barna and colleagues [106].
Here, we present evidence that many translation factors, both general and non-canonical ones, as well as auxiliary proteins such as ARSases, also show tissue-specific expression patterns, dictating diverse composition of translation apparatus in different cell types. In particular, we systematically explored three transcriptomic databases (GTEx, FANTOM, and Gene Atlas) and one source of proteomic data [1] and found a number of translation machinery components with strict tissue-specific appearance: eEF1A1, eEF1A2, PABPC1L, PABPC3, eIF1B, eIF4E1B, eIF4ENIF1, and eIF5AL1; we then identified a differential relative abundance of PABP and eRF3 paralogs, eIF2B and eIF3 subunits, eIF5-mimic proteins, and some ARSases, suggesting that even some general factors may have tissue-specific functions. We also noted sexual dimorphism in the repertoire of translation-associated proteins encoded in sex chromosomes: eIF1A, eIF2γ, and DDX3.
Recently, a global analysis of translation factors and tRNA expressions in human cancers was performed [107]. The authors revealed the overproduction of tRNA modification enzymes, ARSases, and other translation-associated proteins, which may play a role in the activation of protein synthesis across multiple cancer types. However, cancer cells are well known to have deregulated gene expression, so it was very important to show that normal human tissues can have a diverse composition of translation machinery as well.
Obviously, normal mammalian tissues have highly variable levels of protein synthesis, depending on metabolic rate, secretory activity, and cell proliferation status. A number of studies assessed protein synthesis rates across tissues by metabolic labeling [41,42,43]. These analyses revealed the highest amino acid incorporation and/or protein turnover in the small intestine and pancreas; intermediate in the kidney, spleen, and liver; and the lowest in lung, heart, brain, muscle, and adipose tissue. It was also shown that the protein synthesis rate is tightly coupled to cell metabolic fluxes [108]. Metabolic activities of mammalian tissues vary significantly, in a row, from heart and kidney (the most active ones) to skeletal muscle and adipose tissue [69]. Ribosome amounts also vary dramatically (∼50-fold) between the tissues, with more ribosomes present in the pancreas, salivary gland, liver, and intestine; medium in muscle, ovary, kidney, and brain cortex; and lower in the thymus, spleen, heart, lung, and cerebellum [44]. All this makes it clear that for the assessment of tissue-specific features of translation machinery, one should not use absolute values of mRNA or protein abundances of its components. Thus, in our analyses, we use a novel methodology when we combine translation factors into functional groups and calculate the relative mRNA or protein abundance of the particular component within the group. Importantly, we found a good correlation between expression levels of these functional groups (e.g., consolidated sets of initiation, elongation, or termination factors, as well as ARSases) and ribosomal proteins across tissues, with a few notable exceptions, such as the ovary (where mRNAs encoding ribosomal proteins turned out to be over-represented likely due to accelerated ribosome production during oocytes maturation).
Our approach allowed comparing the relative concentration of translation factors and revealed some tissue-specific peculiarities in the composition of protein synthesis machinery that can contribute to translational landscapes of human tissues. For example, we would like to note a potentially higher total activity of eIF1, eIF1A, and BZW in the heart due to an “additional source” of these factors, i.e., the elevated expression of EIF1B, EIF1AX, and BZW2 genes specifically in this organ. These factors are known to enhance the stringency of start site selection [45,91] and thus should remodel a pattern of efficiently translated mRNAs. Future studies using ribosome profiling of animal organs could shed some light on this issue [2,12,13,14,15].
We would also like to note that some translation machinery components may have moonlighting functions, being involved in unrelated processes [109]. Thus, some of the observed differences may reflect these additional activities rather than tissue-specific features of protein synthesis. The cases presented in this study can provide a starting point for further research in this intriguing direction.
Our study also draws attention to sexual dimorphism in the abundance of some translation machinery components. At least three important factors, eIF1A, eIF2γ, and DDX3, are encoded in sex chromosomes (by the X-linked EIF1AX, DDX3X, and EIF2S3 genes, and Y-linked EIF1AY and DDX3Y genes). In addition to the predictable lack of the Y-linked gene expression in female organs, this issue clearly contributes to total amounts of translation factors in some organs (e.g., the higher eIF1A level in the heart due to a “double portion” of EIF1AX/Y expression, or the lower eIF2γ level in the testis than in female organs due to EIF2S3 X-inactivation escape).
Our analysis identified the testis and brain as organs with the most diverged expression of TAGs. Although it is well known that neurons and nervous tissues have peculiarities in protein synthesis [110,111], translation regulation in the testis has not yet been extensively investigated. A recent study [2] found that the correlation between transcriptome and translatome in the testis is much lower than in the brain and liver and revealed a unique pattern in the testis that is explained by strong differential regulation of translation across spermatogenic cell types. The authors also found that translational upregulation specifically counterbalanced the effects of meiotic sex-chromosome inactivation during spermatogenesis [2]. It should also be noted that the brain and testis are immunologically privileged organs, and this may bring some bias in transcriptomic and proteomic analysis of their content. It was also shown recently that the testis and brain express genes that are enriched in rare codons both in humans and flies [112].
Recent studies show that different tissues can have different tRNA repertoires and codon usage [16,17]. The adaptation of the tRNA pool was found to be largely related to a tissue proliferative state [16]. Then, two clusters of tissues with an opposite pattern of codon preferences were identified [113]: some tissues (including kidney, muscle, heart, liver, colon, fat, and ovary) generally favor C/G-ending codons, while others (including lung, brain, pancreas, spleen, small intestine, adrenal and salivary glands, placenta, and testis) better tolerate translation of rare A/T-ending codons. Although we were unable to find any obvious correlation between these clusters and the distribution of elongation factors or ARSases, a more in-depth analysis may reveal such patterns in future.
Finally, we would like to emphasize the importance of using both transcriptomic and proteomic analyses. Although mRNA levels are primary determinants for protein abundance (for review, see [114]), translation regulation can significantly contribute to the levels of translation machinery components [93]. Unfortunately, for many poorly expressed genes, proteomic data are either lacking or statistically unreliable, while transcriptomic datasets from GTEx, FANTOM, and Gene Atlas are usually enriched in reliable information about most human genes. The discrepancy between the transcript and protein levels that we reported for some translation-associated genes can be a starting point for the investigation of their post-transcription regulation.

4. Materials and Methods

Data analysis and visualization were conducted in R environment (R 4.2.2). We analyzed mRNA abundance data of different tissues and primary cells available in FANTOM5 (http://fantom.gsc.riken.jp/5/, accessed on 5 March 2023), GTEx (https://gtexportal.org/, accessed on 5 March 2023), and Gene Atlas [101] databases, while mass-spectrometry data were taken from [1]. We considered the genes encoding protein synthesis machinery components according to Table 1.
The CAGE data (cap analysis of gene expression) from FANTOM5 (http://fantom.gsc.riken.jp/5/) phase 1 mapped to hg19 genome assembly were downloaded as normalized TPM (Tags Per Million) for each transcript, as provided in the FANTOM5 data, and summed up across transcripts to obtain the gene-level expression estimates. Samples with extreme normalization factors (less than 0.7 or higher than 1.4) were excluded from the analysis. The Gene Atlas data [101] were obtained from the BioGPS portal (http://biogps.org/, accessed on 5 March 2023) as normalized expression units from the Human U133A/GNF1H microarray. Probe sets represented in U133A annotation were selected for further analysis, and the mean expression across probes was considered as the estimate of gene expression. GTEx v7 RNASeQCv1.1.8 gene expression data were downloaded as TPM (Transcripts Per Kilobase Million) from https://gtexportal.org/home/datasets, accessed on 5 March 2023.
In our analysis, we used absolute gene expression estimates as well as relative expression estimated as a share of a particular gene in the total gene expression of a particular complex (see Table 1). Relative estimates were used to analyze the target gene expression in the context of a protein complex with a particular functional role. For the latter analysis, we classified the gene complexes according to the functional and physical interactions of the respective proteins (Table 1). The use of relative gene expression allowed us to address the changes in relative transcript abundance in the context of the expression of protein partners and the stoichiometry of the complexes.
To obtain a reliable statistical estimate of the tissue-specific contribution of a particular protein to a particular complex or group, we used GTEx data and the following approach. First, for each complex, we excluded the samples with the total expression of genes of the complex less than half a mean across samples. Next, for each member of the complex, we estimated its share in the total expression of the complex. With the vector of shares across samples, we performed set enrichment analysis on the ranked list of samples. To this end, we classified the samples according to the tissue of origin, e.g., ‘brain’ (30 groups of 11,688 samples in total according to GTEx metadata), and checked the positions of samples of a particular group in the total ranked list of samples. Normalized enrichment scores (NES) and statistical significance were estimated with fgsea R package [115] (10,000 permutations). p-values were corrected for multiple testing using FDR correction for the number of sample groups.
To calculate correlation of the mean expression of genes encoding ribosomal proteins (Supplementary Table S1) and the mean expression of the major translation-associated gene sets in various human tissues, the weighted total expression for each tissue was calculated as a sum of weighted expression values for each gene estimated as gene expression values (TPM) normalized to the mean of expression values for the gene in every sample. Pearson correlation was computed with R.

5. Conclusions

In summary, in this study, we systematically explored the tissue-specific expression of translation-associated genes and found new cases of differentially represented translation factors and auxiliary proteins in human organs and tissues. These findings contribute to our understanding of translational control in health and disease.

Supplementary Materials

The following supporting information can be downloaded at: https://www.mdpi.com/1422-0067/24/9/8361/s1.

Author Contributions

Conceptualization, S.E.D., A.S.A. and I.V.K.; experimental design, A.S.A., I.V.K., A.A.E. and S.E.D.; methodology, A.S.A., I.V.K., A.A.E. and S.E.D.; data analysis, A.S.A.; discussion of results, A.S.A., N.M.K., N.E.M., A.A.E., I.V.K. and S.E.D.; writing of manuscript and editing, A.S.A., N.M.K., N.E.M., A.A.E., I.V.K. and S.E.D.; project administration, S.E.D.; funding acquisition, S.E.D. All authors have read and agreed to the published version of the manuscript.

Funding

This study was supported by the Russian Science Foundation grant no. 18-14-00291 to S.E.D. (conceptualization, design, and data analysis) and Ministry of Science and Higher Education of the Russian Federation grant no. 075152021601 (data processing pipeline).

Institutional Review Board Statement

Not applicable.

Informed Consent Statement

Not applicable.

Data Availability Statement

Not applicable.

Acknowledgments

N.M.K., N.E.M., A.A.E. and S.E.D. are members of the Interdisciplinary Scientific and Educational School of Moscow University «Molecular Technologies of the Living Systems and Synthetic Biology».

Conflicts of Interest

The authors declare that the research was conducted in the absence of any commercial or financial relationships that could be construed as a potential conflict of interest.

References

  1. Wang, D.; Eraslan, B.; Wieland, T.; Hallstrom, B.; Hopf, T.; Zolg, D.P.; Zecha, J.; Asplund, A.; Li, L.H.; Meng, C.; et al. A deep proteome and transcriptome abundance atlas of 29 healthy human tissues. Mol. Syst. Biol. 2019, 15, e8503. [Google Scholar] [CrossRef] [PubMed]
  2. Wang, Z.Y.; Leushkin, E.; Liechti, A.; Ovchinnikova, S.; Mossinger, K.; Bruning, T.; Rummel, C.; Grutzner, F.; Cardoso-Moreira, M.; Janich, P.; et al. Transcriptome and translatome co-evolution in mammals. Nature 2020, 588, 642–647. [Google Scholar] [CrossRef]
  3. Genuth, N.R.; Barna, M. Heterogeneity and specialized functions of translation machinery: From genes to organisms. Nat. Rev. Genet. 2018, 19, 431–452. [Google Scholar] [CrossRef]
  4. Shi, Z.; Barna, M. Translating the genome in time and space: Specialized ribosomes, RNA regulons, and RNA-binding proteins. Annu. Rev. Cell Dev. Biol. 2015, 31, 31–54. [Google Scholar] [CrossRef] [PubMed]
  5. Iwasaki, S.; Ingolia, N.T. The Growing Toolbox for Protein Synthesis Studies. Trends Biochem. Sci. 2017, 42, 612–624. [Google Scholar] [CrossRef] [PubMed]
  6. Doyle, J.P.; Dougherty, J.D.; Heiman, M.; Schmidt, E.F.; Stevens, T.R.; Ma, G.; Bupp, S.; Shrestha, P.; Shah, R.D.; Doughty, M.L.; et al. Application of a translational profiling approach for the comparative analysis of CNS cell types. Cell 2008, 135, 749–762. [Google Scholar] [CrossRef] [PubMed]
  7. Heiman, M.; Schaefer, A.; Gong, S.; Peterson, J.D.; Day, M.; Ramsey, K.E.; Suarez-Farinas, M.; Schwarz, C.; Stephan, D.A.; Surmeier, D.J.; et al. A translational profiling approach for the molecular characterization of CNS cell types. Cell 2008, 135, 738–748. [Google Scholar] [CrossRef]
  8. Sanz, E.; Yang, L.; Su, T.; Morris, D.R.; McKnight, G.S.; Amieux, P.S. Cell-type-specific isolation of ribosome-associated mRNA from complex tissues. Proc. Natl. Acad. Sci. USA 2009, 106, 13939–13944. [Google Scholar] [CrossRef]
  9. Ingolia, N.T.; Hussmann, J.A.; Weissman, J.S. Ribosome Profiling: Global Views of Translation. Cold Spring Harb. Perspect. Biol. 2019, 11, a032698. [Google Scholar] [CrossRef]
  10. Gonzalez, C.; Sims, J.S.; Hornstein, N.; Mela, A.; Garcia, F.; Lei, L.; Gass, D.A.; Amendolara, B.; Bruce, J.N.; Canoll, P.; et al. Ribosome profiling reveals a cell-type-specific translational landscape in brain tumors. J. Neurosci. Off. J. Soc. Neurosci. 2014, 34, 10924–10936. [Google Scholar] [CrossRef]
  11. Gao, X.; Wan, J.; Liu, B.; Ma, M.; Shen, B.; Qian, S.B. Quantitative profiling of initiating ribosomes in vivo. Nat. Methods 2015, 12, 147–153. [Google Scholar] [CrossRef] [PubMed]
  12. Anisimova, A.S.; Meerson, M.B.; Gerashchenko, M.V.; Kulakovskiy, I.V.; Dmitriev, S.E.; Gladyshev, V.N. Multifaceted deregulation of gene expression and protein synthesis with age. Proc. Natl. Acad. Sci. USA 2020, 117, 15581–15590. [Google Scholar] [CrossRef] [PubMed]
  13. Gerashchenko, M.V.; Peterfi, Z.; Yim, S.H.; Gladyshev, V.N. Translation elongation rate varies among organs and decreases with age. Nucleic Acids Res. 2021, 49, e9. [Google Scholar] [CrossRef] [PubMed]
  14. Ori, A.; Toyama, B.H.; Harris, M.S.; Bock, T.; Iskar, M.; Bork, P.; Ingolia, N.T.; Hetzer, M.W.; Beck, M. Integrated Transcriptome and Proteome Analyses Reveal Organ-Specific Proteome Deterioration in Old Rats. Cell Syst. 2015, 1, 224–237. [Google Scholar] [CrossRef] [PubMed]
  15. Castelo-Szekely, V.; Arpat, A.B.; Janich, P.; Gatfield, D. Translational contributions to tissue specificity in rhythmic and constitutive gene expression. Genome Biol. 2017, 18, 116. [Google Scholar] [CrossRef]
  16. Hernandez-Alias, X.; Benisty, H.; Schaefer, M.H.; Serrano, L. Translational efficiency across healthy and tumor tissues is proliferation-related. Mol. Syst. Biol. 2020, 16, e9275. [Google Scholar] [CrossRef] [PubMed]
  17. Kames, J.; Alexaki, A.; Holcomb, D.D.; Santana-Quintero, L.V.; Athey, J.C.; Hamasaki-Katagiri, N.; Katneni, U.; Golikov, A.; Ibla, J.C.; Bar, H.; et al. TissueCoCoPUTs: Novel Human Tissue-Specific Codon and Codon-Pair Usage Tables Based on Differential Tissue Gene Expression. J. Mol. Biol. 2020, 432, 3369–3378. [Google Scholar] [CrossRef] [PubMed]
  18. Karki, P.; Carney, T.D.; Maracci, C.; Yatsenko, A.S.; Shcherbata, H.R.; Rodnina, M.V. Tissue-Specific Regulation of Translational Readthrough Tunes Functions of the Traffic Jam Transcription Factor. bioRxiv 2020. [Google Scholar] [CrossRef]
  19. Gupta, V.; Warner, J.R. Ribosome-omics of the human ribosome. Rna 2014, 20, 1004–1013. [Google Scholar] [CrossRef]
  20. Guimaraes, J.C.; Zavolan, M. Patterns of ribosomal protein expression specify normal and malignant human cells. Genome Biol. 2016, 17, 236. [Google Scholar] [CrossRef]
  21. Kondrashov, N.; Pusic, A.; Stumpf, C.R.; Shimizu, K.; Hsieh, A.C.; Ishijima, J.; Shiroishi, T.; Barna, M. Ribosome-mediated specificity in Hox mRNA translation and vertebrate tissue patterning. Cell 2011, 145, 383–397. [Google Scholar] [CrossRef] [PubMed]
  22. Dittmar, K.A.; Goodenbour, J.M.; Pan, T. Tissue-specific differences in human transfer RNA expression. PLoS Genet. 2006, 2, e221. [Google Scholar] [CrossRef] [PubMed]
  23. Waldman, Y.Y.; Tuller, T.; Shlomi, T.; Sharan, R.; Ruppin, E. Translation efficiency in humans: Tissue specificity, global optimization and differences between developmental stages. Nucleic Acids Res. 2010, 38, 2964–2974. [Google Scholar] [CrossRef] [PubMed]
  24. Lee, S.; Francoeur, A.M.; Liu, S.; Wang, E. Tissue-specific expression in mammalian brain, heart, and muscle of S1, a member of the elongation factor-1 alpha gene family. J. Biol. Chem. 1992, 267, 24064–24068. [Google Scholar] [CrossRef] [PubMed]
  25. Khalyfa, A.; Bourbeau, D.; Chen, E.; Petroulakis, E.; Pan, J.; Xu, S.; Wang, E. Characterization of elongation factor-1A (eEF1A-1) and eEF1A-2/S1 protein expression in normal and wasted mice. J. Biol. Chem. 2001, 276, 22915–22922. [Google Scholar] [CrossRef] [PubMed]
  26. Feral, C.; Guellaen, G.; Pawlak, A. Human testis expresses a specific poly(A)-binding protein. Nucleic Acids Res. 2001, 29, 1872–1883. [Google Scholar] [CrossRef]
  27. Seli, E.; Lalioti, M.D.; Flaherty, S.M.; Sakkas, D.; Terzi, N.; Steitz, J.A. An embryonic poly(A)-binding protein (ePAB) is expressed in mouse oocytes and early preimplantation embryos. Proc. Natl. Acad. Sci. USA 2005, 102, 367–372. [Google Scholar] [CrossRef]
  28. Guzeloglu-Kayisli, O.; Lalioti, M.D.; Babayev, E.; Torrealday, S.; Karakaya, C.; Seli, E. Human embryonic poly(A)-binding protein (EPAB) alternative splicing is differentially regulated in human oocytes and embryos. Mol. Hum. Reprod. 2014, 20, 59–65. [Google Scholar] [CrossRef]
  29. Jenkins, Z.A.; Haag, P.G.; Johansson, H.E. Human eIF5A2 on chromosome 3q25-q27 is a phylogenetically conserved vertebrate variant of eukaryotic translation initiation factor 5A with tissue-specific expression. Genomics 2001, 71, 101–109. [Google Scholar] [CrossRef]
  30. Evsikov, A.V.; Marin de Evsikova, C. Evolutionary origin and phylogenetic analysis of the novel oocyte-specific eukaryotic translation initiation factor 4E in Tetrapoda. Dev. Genes Evol. 2009, 219, 111–118. [Google Scholar] [CrossRef]
  31. Xu, J.; Watkins, R.; Arnold, A.P. Sexually dimorphic expression of the X-linked gene Eif2s3x mRNA but not protein in mouse brain. Gene Expr. Patterns 2006, 6, 146–155. [Google Scholar] [CrossRef] [PubMed]
  32. Dubourg, C.; Toutain, B.; Le Gall, J.Y.; Le Treut, A.; Guenet, L. Promoter analysis of the human translation termination factor 1 gene. Gene 2003, 316, 91–101. [Google Scholar] [CrossRef] [PubMed]
  33. Urbero, B.; Eurwilaichitr, L.; Stansfield, I.; Tassan, J.P.; Le Goff, X.; Kress, M.; Tuite, M.F. Expression of the release factor eRF1 (Sup45p) gene of higher eukaryotes in yeast and mammalian tissues. Biochimie 1997, 79, 27–36. [Google Scholar] [CrossRef] [PubMed]
  34. Si, K.; Das, K.; Maitra, U. Characterization of multiple mRNAs that encode mammalian translation initiation factor 5 (eIF-5). J. Biol. Chem. 1996, 271, 16934–16938. [Google Scholar] [CrossRef] [PubMed]
  35. Hoshino, S.; Imai, M.; Mizutani, M.; Kikuchi, Y.; Hanaoka, F.; Ui, M.; Katada, T. Molecular cloning of a novel member of the eukaryotic polypeptide chain-releasing factors (eRF). Its identification as eRF3 interacting with eRF1. J. Biol. Chem. 1998, 273, 22254–22259. [Google Scholar] [CrossRef] [PubMed]
  36. Chauvin, C.; Salhi, S.; Le Goff, C.; Viranaicken, W.; Diop, D.; Jean-Jean, O. Involvement of human release factors eRF3a and eRF3b in translation termination and regulation of the termination complex formation. Mol. Cell. Biol. 2005, 25, 5801–5811. [Google Scholar] [CrossRef]
  37. Cao, Y.; Portela, M.; Janikiewicz, J.; Doig, J.; Abbott, C.M. Characterisation of translation elongation factor eEF1B subunit expression in mammalian cells and tissues and co-localisation with eEF1A2. PLoS ONE 2014, 9, e114117. [Google Scholar] [CrossRef] [PubMed]
  38. Kaitsuka, T.; Tomizawa, K.; Matsushita, M. Transformation of eEF1Bdelta into heat-shock response transcription factor by alternative splicing. EMBO Rep. 2011, 12, 673–681. [Google Scholar] [CrossRef]
  39. Wells, J.; Henkler, F.; Leversha, M.; Koshy, R. A mitochondrial elongation factor-like protein is over-expressed in tumours and differentially expressed in normal tissues. FEBS Lett. 1995, 358, 119–125. [Google Scholar] [CrossRef] [PubMed]
  40. Chen, L.; Xu, Q.; Liu, X.L.; Zhao, J.; Ma, L. Differential and Tissue-specific Expression of Mitochondrial Elongation Factor Tu and Ts during Development. Sheng Wu Hua Xue Yu Sheng Wu Wu Li Xue Bao 1999, 31, 37–40. [Google Scholar]
  41. Jang, C.; Hui, S.; Zeng, X.; Cowan, A.J.; Wang, L.; Chen, L.; Morscher, R.J.; Reyes, J.; Frezza, C.; Hwang, H.Y.; et al. Metabolite Exchange between Mammalian Organs Quantified in Pigs. Cell Metab. 2019, 30, 594–606.e3. [Google Scholar] [CrossRef] [PubMed]
  42. Neinast, M.D.; Jang, C.; Hui, S.; Murashige, D.S.; Chu, Q.; Morscher, R.J.; Li, X.; Zhan, L.; White, E.; Anthony, T.G.; et al. Quantitative Analysis of the Whole-Body Metabolic Fate of Branched-Chain Amino Acids. Cell Metab. 2019, 29, 417–429.e4. [Google Scholar] [CrossRef]
  43. Li, X.; Hui, S.; Mirek, E.T.; Jonsson, W.O.; Anthony, T.G.; Lee, W.D.; Zeng, X.; Jang, C.; Rabinowitz, J.D. Circulating metabolite homeostasis achieved through mass action. Nat. Metab. 2022, 4, 141–152. [Google Scholar] [CrossRef] [PubMed]
  44. Geiger, T.; Velic, A.; Macek, B.; Lundberg, E.; Kampf, C.; Nagaraj, N.; Uhlen, M.; Cox, J.; Mann, M. Initial quantitative proteomic map of 28 mouse tissues using the SILAC mouse. Mol. Cell. Proteom. 2013, 12, 1709–1722. [Google Scholar] [CrossRef] [PubMed]
  45. Hinnebusch, A.G. The scanning mechanism of eukaryotic translation initiation. Annu. Rev. Biochem. 2014, 83, 779–812. [Google Scholar] [CrossRef] [PubMed]
  46. Abbas, W.; Kumar, A.; Herbein, G. The eEF1A Proteins: At the Crossroads of Oncogenesis, Apoptosis, and Viral Infections. Front. Oncol. 2015, 5, 75. [Google Scholar] [CrossRef] [PubMed]
  47. Negrutskii, B.S.; Shalak, V.F.; Novosylna, O.V.; Porubleva, L.V.; Lozhko, D.M.; El’skaya, A.V. The eEF1 family of mammalian translation elongation factors. BBA Adv. 2023, 3, 100067. [Google Scholar] [CrossRef] [PubMed]
  48. Lee, S.; Wolfraim, L.A.; Wang, E. Differential expression of S1 and elongation factor-1 alpha during rat development. J. Biol. Chem. 1993, 268, 24453–24459. [Google Scholar] [CrossRef] [PubMed]
  49. “Chromosome Y: Chromosome Summary—Homo Sapiens”. Ensembl Release 88. 2017-03-29. Available online: https://grch37.ensembl.org/Homo_sapiens/Location/Chromosome?r=Y (accessed on 5 March 2023).
  50. Carrel, L.; Willard, H.F. X-inactivation profile reveals extensive variability in X-linked gene expression in females. Nature 2005, 434, 400–404. [Google Scholar] [CrossRef] [PubMed]
  51. Bellott, D.W.; Hughes, J.F.; Skaletsky, H.; Brown, L.G.; Pyntikova, T.; Cho, T.J.; Koutseva, N.; Zaghlul, S.; Graves, T.; Rock, S.; et al. Mammalian Y chromosomes retain widely expressed dosage-sensitive regulators. Nature 2014, 508, 494–499. [Google Scholar] [CrossRef] [PubMed]
  52. Berletch, J.B.; Ma, W.; Yang, F.; Shendure, J.; Noble, W.S.; Disteche, C.M.; Deng, X. Escape from X inactivation varies in mouse tissues. PLoS Genet. 2015, 11, e1005079. [Google Scholar] [CrossRef] [PubMed]
  53. Sharma, D.; Jankowsky, E. The Ded1/DDX3 subfamily of DEAD-box RNA helicases. Crit. Rev. Biochem. Mol. Biol. 2014, 49, 343–360. [Google Scholar] [CrossRef] [PubMed]
  54. Rosner, A.; Rinkevich, B. The DDX3 subfamily of the DEAD box helicases: Divergent roles as unveiled by studying different organisms and in vitro assays. Curr. Med. Chem. 2007, 14, 2517–2525. [Google Scholar] [CrossRef] [PubMed]
  55. Sekiguchi, T.; Iida, H.; Fukumura, J.; Nishimoto, T. Human DDX3Y, the Y-encoded isoform of RNA helicase DDX3, rescues a hamster temperature-sensitive ET24 mutant cell line with a DDX3X mutation. Exp. Cell Res. 2004, 300, 213–222. [Google Scholar] [CrossRef] [PubMed]
  56. Venkataramanan, S.; Calviello, L.; Wilkins, K.; Floor, S.N. DDX3X and DDX3Y are redundant in protein synthesis. bioRxiv 2020. [Google Scholar] [CrossRef] [PubMed]
  57. Kotov, A.A.; Olenkina, O.M.; Godneeva, B.K.; Adashev, V.E.; Olenina, L.V. Progress in understanding the molecular functions of DDX3Y (DBY) in male germ cell development and maintenance. Biosci. Trends 2017, 11, 46–53. [Google Scholar] [CrossRef]
  58. Ramathal, C.; Angulo, B.; Sukhwani, M.; Cui, J.; Durruthy-Durruthy, J.; Fang, F.; Schanes, P.; Turek, P.J.; Orwig, K.E.; Reijo Pera, R. DDX3Y gene rescue of a Y chromosome AZFa deletion restores germ cell formation and transcriptional programs. Sci. Rep. 2015, 5, 15041. [Google Scholar] [CrossRef] [PubMed]
  59. Matsumura, T.; Endo, T.; Isotani, A.; Ogawa, M.; Ikawa, M. An azoospermic factor gene, Ddx3y and its paralog, Ddx3x are dispensable in germ cells for male fertility. J. Reprod. Dev. 2019, 65, 121–128. [Google Scholar] [CrossRef]
  60. Lennox, A.L.; Hoye, M.L.; Jiang, R.; Johnson-Kerner, B.L.; Suit, L.A.; Venkataramanan, S.; Sheehan, C.J.; Alsina, F.C.; Fregeau, B.; Aldinger, K.A.; et al. Pathogenic DDX3X Mutations Impair RNA Metabolism and Neurogenesis during Fetal Cortical Development. Neuron 2020, 106, 404–420.e8. [Google Scholar] [CrossRef] [PubMed]
  61. Ehrmann, I.E.; Ellis, P.S.; Mazeyrat, S.; Duthie, S.; Brockdorff, N.; Mattei, M.G.; Gavin, M.A.; Affara, N.A.; Brown, G.M.; Simpson, E.; et al. Characterization of genes encoding translation initiation factor eIF-2gamma in mouse and human: Sex chromosome localization, escape from X-inactivation and evolution. Hum. Mol. Genet. 1998, 7, 1725–1737. [Google Scholar] [CrossRef]
  62. Yamauchi, Y.; Riel, J.M.; Stoytcheva, Z.; Ward, M.A. Two Y genes can replace the entire Y chromosome for assisted reproduction in the mouse. Science 2014, 343, 69–72. [Google Scholar] [CrossRef] [PubMed]
  63. Skopkova, M.; Hennig, F.; Shin, B.S.; Turner, C.E.; Stanikova, D.; Brennerova, K.; Stanik, J.; Fischer, U.; Henden, L.; Muller, U.; et al. EIF2S3 Mutations Associated with Severe X-Linked Intellectual Disability Syndrome MEHMO. Hum. Mutat. 2017, 38, 409–425. [Google Scholar] [CrossRef]
  64. Maddirevula, S.; Awartani, K.; Coskun, S.; AlNaim, L.F.; Ibrahim, N.; Abdulwahab, F.; Hashem, M.; Alhassan, S.; Alkuraya, F.S. A genomics approach to females with infertility and recurrent pregnancy loss. Hum. Genet. 2020, 139, 605–613. [Google Scholar] [CrossRef] [PubMed]
  65. Guzeloglu-Kayisli, O.; Lalioti, M.D.; Aydiner, F.; Sasson, I.; Ilbay, O.; Sakkas, D.; Lowther, K.M.; Mehlmann, L.M.; Seli, E. Embryonic poly(A)-binding protein (EPAB) is required for oocyte maturation and female fertility in mice. Biochem. J. 2012, 446, 47–58. [Google Scholar] [CrossRef]
  66. Ozturk, S.; Sozen, B.; Uysal, F.; Bassorgun, I.C.; Usta, M.F.; Akkoyunlu, G.; Demir, N. The poly(A)-binding protein genes, EPAB, PABPC1, and PABPC3 are differentially expressed in infertile men with non-obstructive azoospermia. J. Assist. Reprod. Genet. 2016, 33, 335–348. [Google Scholar] [CrossRef] [PubMed]
  67. Xie, J.; Wei, X.; Chen, Y. Loss of PABPC1 is compensated by elevated PABPC4 and correlates with transcriptome changes. bioRxiv 2021. [Google Scholar] [CrossRef]
  68. Blanco, P.; Sargent, C.A.; Boucher, C.A.; Howell, G.; Ross, M.; Affara, N.A. A novel poly(A)-binding protein gene (PABPC5) maps to an X-specific subinterval in the Xq21.3/Yp11.2 homology block of the human sex chromosomes. Genomics 2001, 74, 1–11. [Google Scholar] [CrossRef]
  69. Elia, M. Organ and tissue contribution to metabolic rate. In Energy Metabolism: Tissue Determinants and Cellular Corollaries; Kinney, J.M., Tucker, H.N., Eds.; Raven Press: New York, NY, USA, 1992; pp. 61–80. [Google Scholar]
  70. Zinoviev, A.; Goyal, A.; Jindal, S.; LaCava, J.; Komar, A.A.; Rodnina, M.V.; Hellen, C.U.T.; Pestova, T.V. Functions of unconventional mammalian translational GTPases GTPBP1 and GTPBP2. Genes Dev. 2018, 32, 1226–1241. [Google Scholar] [CrossRef]
  71. Ishimura, R.; Nagy, G.; Dotu, I.; Zhou, H.; Yang, X.L.; Schimmel, P.; Senju, S.; Nishimura, Y.; Chuang, J.H.; Ackerman, S.L. RNA function. Ribosome stalling induced by mutation of a CNS-specific tRNA causes neurodegeneration. Science 2014, 345, 455–459. [Google Scholar] [CrossRef]
  72. Senju, S.; Nishimura, Y. Identification of human and mouse GP-1, a putative member of a novel G-protein family. Biochem. Biophys. Res. Commun. 1997, 231, 360–364. [Google Scholar] [CrossRef] [PubMed]
  73. Watanabe, M.; Yoshida, K.; Hida, M.; Kato, H.; Uchida, K.; Yamaguchi, R.; Tateyama, S.; Sugano, S. Cloning, expression analysis, and chromosomal mapping of GTPBP2, a novel member of the G protein family. Gene 2000, 256, 51–58. [Google Scholar] [CrossRef] [PubMed]
  74. Coldwell, M.J.; Sack, U.; Cowan, J.L.; Barrett, R.M.; Vlasak, M.; Sivakumaran, K.; Morley, S.J. Multiple isoforms of the translation initiation factor eIF4GII are generated via use of alternative promoters, splice sites and a non-canonical initiation codon. Biochem. J. 2012, 448, 1–11. [Google Scholar] [CrossRef] [PubMed]
  75. Gradi, A.; Imataka, H.; Svitkin, Y.V.; Rom, E.; Raught, B.; Morino, S.; Sonenberg, N. A novel functional human eukaryotic translation initiation factor 4G. Mol. Cell. Biol. 1998, 18, 334–342. [Google Scholar] [CrossRef] [PubMed]
  76. Hernandez, G.; Vazquez-Pianzola, P. Functional diversity of the eukaryotic translation initiation factors belonging to eIF4 families. Mech. Dev. 2005, 122, 865–876. [Google Scholar] [CrossRef] [PubMed]
  77. Sun, F.; Palmer, K.; Handel, M.A. Mutation of Eif4g3, encoding a eukaryotic translation initiation factor, causes male infertility and meiotic arrest of mouse spermatocytes. Development 2010, 137, 1699–1707. [Google Scholar] [CrossRef] [PubMed]
  78. Shatsky, I.N.; Dmitriev, S.E.; Andreev, D.E.; Terenin, I.M. Transcriptome-wide studies uncover the diversity of modes of mRNA recruitment to eukaryotic ribosomes. Crit. Rev. Biochem. Mol. Biol. 2014, 49, 164–177. [Google Scholar] [CrossRef]
  79. Wortham, N.C.; Proud, C.G. eIF2B: Recent structural and functional insights into a key regulator of translation. Biochem. Soc. Trans. 2015, 43, 1234–1240. [Google Scholar] [CrossRef]
  80. Wortham, N.C.; Stewart, J.D.; Harris, S.; Coldwell, M.J.; Proud, C.G. Stoichiometry of the eIF2B complex is maintained by mutual stabilization of subunits. Biochem. J. 2016, 473, 571–580. [Google Scholar] [CrossRef]
  81. Wolf, D.A.; Lin, Y.; Duan, H.; Cheng, Y. eIF-Three to Tango: Emerging functions of translation initiation factor eIF3 in protein synthesis and disease. J. Mol. Cell Biol. 2020, 12, 403–409. [Google Scholar] [CrossRef] [PubMed]
  82. Cate, J.H. Human eIF3: From ‘blobology’ to biological insight. Philos. Trans. R. Soc. B 2017, 372, 20160176. [Google Scholar] [CrossRef] [PubMed]
  83. Valasek, L.S.; Zeman, J.; Wagner, S.; Beznoskova, P.; Pavlikova, Z.; Mohammad, M.P.; Hronova, V.; Herrmannova, A.; Hashem, Y.; Gunisova, S. Embraced by eIF3: Structural and functional insights into the roles of eIF3 across the translation cycle. Nucleic Acids Res. 2017, 45, 10948–10968. [Google Scholar] [CrossRef] [PubMed]
  84. Kubacka, D.; Miguel, R.N.; Minshall, N.; Darzynkiewicz, E.; Standart, N.; Zuberek, J. Distinct features of cap binding by eIF4E1b proteins. J. Mol. Biol. 2015, 427, 387–405. [Google Scholar] [CrossRef] [PubMed]
  85. Minshall, N.; Reiter, M.H.; Weil, D.; Standart, N. CPEB interacts with an ovary-specific eIF4E and 4E-T in early Xenopus oocytes. J. Biol. Chem. 2007, 282, 37389–37401. [Google Scholar] [CrossRef]
  86. Yang, G.; Xin, Q.; Feng, I.; Dean, J. Germ-cell specific eIF4E1B regulates maternal RNA translation to ensure zygotic genome activation. bioRxiv 2022. [Google Scholar] [CrossRef]
  87. Kozlov, E.; Shidlovskii, Y.V.; Gilmutdinov, R.; Schedl, P.; Zhukova, M. The role of CPEB family proteins in the nervous system function in the norm and pathology. Cell Biosci. 2021, 11, 64. [Google Scholar] [CrossRef] [PubMed]
  88. Kamenska, A.; Lu, W.T.; Kubacka, D.; Broomhead, H.; Minshall, N.; Bushell, M.; Standart, N. Human 4E-T represses translation of bound mRNAs and enhances microRNA-mediated silencing. Nucleic Acids Res. 2014, 42, 3298–3313. [Google Scholar] [CrossRef] [PubMed]
  89. Dostie, J.; Ferraiuolo, M.; Pause, A.; Adam, S.A.; Sonenberg, N. A novel shuttling protein, 4E-T, mediates the nuclear import of the mRNA 5′ cap-binding protein, eIF4E. EMBO J. 2000, 19, 3142–3156. [Google Scholar] [CrossRef]
  90. Clement, P.M.; Johansson, H.E.; Wolff, E.C.; Park, M.H. Differential expression of eIF5A-1 and eIF5A-2 in human cancer cells. FEBS J. 2006, 273, 1102–1114. [Google Scholar] [CrossRef]
  91. Loughran, G.; Firth, A.E.; Atkins, J.F.; Ivanov, I.P. Translational autoregulation of BZW1 and BZW2 expression by modulating the stringency of start codon selection. PLoS ONE 2018, 13, e0192648. [Google Scholar] [CrossRef]
  92. Fijalkowska, D.; Verbruggen, S.; Ndah, E.; Jonckheere, V.; Menschaert, G.; Van Damme, P. eIF1 modulates the recognition of suboptimal translation initiation sites and steers gene expression via uORFs. Nucleic Acids Res. 2017, 45, 7997–8013. [Google Scholar] [CrossRef]
  93. Andreev, D.E.; Dmitriev, S.E.; Loughran, G.; Terenin, I.M.; Baranov, P.V.; Shatsky, I.N. Translation control of mRNAs encoding mammalian translation initiation factors. Gene 2018, 651, 174–182. [Google Scholar] [CrossRef] [PubMed]
  94. Ivanov, I.P.; Loughran, G.; Sachs, M.S.; Atkins, J.F. Initiation context modulates autoregulation of eukaryotic translation initiation factor 1 (eIF1). Proc. Natl. Acad. Sci. USA 2010, 107, 18056–18060. [Google Scholar] [CrossRef] [PubMed]
  95. Schuller, A.P.; Green, R. Roadblocks and resolutions in eukaryotic translation. Nat. Reviews. Mol. Cell Biol. 2018, 19, 526–541. [Google Scholar] [CrossRef]
  96. Mills, E.W.; Wangen, J.; Green, R.; Ingolia, N.T. Dynamic Regulation of a Ribosome Rescue Pathway in Erythroid Cells and Platelets. Cell Rep. 2016, 17, 1–10. [Google Scholar] [CrossRef]
  97. O’Connell, A.E.; Gerashchenko, M.V.; O’Donohue, M.F.; Rosen, S.M.; Huntzinger, E.; Gleeson, D.; Galli, A.; Ryder, E.; Cao, S.; Murphy, Q.; et al. Mammalian Hbs1L deficiency causes congenital anomalies and developmental delay associated with Pelota depletion and 80S monosome accumulation. PLoS Genet. 2019, 15, e1007917. [Google Scholar] [CrossRef]
  98. Kaminska, M.; Havrylenko, S.; Decottignies, P.; Gillet, S.; Le Marechal, P.; Negrutskii, B.; Mirande, M. Dissection of the structural organization of the aminoacyl-tRNA synthetase complex. J. Biol. Chem. 2009, 284, 6053–6060. [Google Scholar] [CrossRef] [PubMed]
  99. O’Hanlon, T.P.; Raben, N.; Miller, F.W. A novel gene oriented in a head-to-head configuration with the human histidyl-tRNA synthetase (HRS) gene encodes an mRNA that predicts a polypeptide homologous to HRS. Biochem. Biophys. Res. Commun. 1995, 210, 556–566. [Google Scholar] [CrossRef] [PubMed]
  100. Chen, Y.; Ruan, Z.R.; Wang, Y.; Huang, Q.; Xue, M.Q.; Zhou, X.L.; Wang, E.D. A threonyl-tRNA synthetase-like protein has tRNA aminoacylation and editing activities. Nucleic Acids Res. 2018, 46, 3643–3656. [Google Scholar] [CrossRef] [PubMed]
  101. Su, A.I.; Wiltshire, T.; Batalov, S.; Lapp, H.; Ching, K.A.; Block, D.; Zhang, J.; Soden, R.; Hayakawa, M.; Kreiman, G.; et al. A gene atlas of the mouse and human protein-encoding transcriptomes. Proc. Natl. Acad. Sci. USA 2004, 101, 6062–6067. [Google Scholar] [CrossRef]
  102. Bortoluzzi, S.; d’Alessi, F.; Romualdi, C.; Danieli, G.A. Differential expression of genes coding for ribosomal proteins in different human tissues. Bioinformatics 2001, 17, 1152–1157. [Google Scholar] [CrossRef] [PubMed]
  103. Parks, M.M.; Kurylo, C.M.; Dass, R.A.; Bojmar, L.; Lyden, D.; Vincent, C.T.; Blanchard, S.C. Variant ribosomal RNA alleles are conserved and exhibit tissue-specific expression. Sci. Adv. 2018, 4, eaao0665. [Google Scholar] [CrossRef] [PubMed]
  104. Emmott, E.; Jovanovic, M.; Slavov, N. Ribosome Stoichiometry: From Form to Function. Trends Biochem. Sci. 2019, 44, 95–109. [Google Scholar] [CrossRef] [PubMed]
  105. Slavov, N.; Semrau, S.; Airoldi, E.; Budnik, B.; van Oudenaarden, A. Differential Stoichiometry among Core Ribosomal Proteins. Cell Rep. 2015, 13, 865–873. [Google Scholar] [CrossRef] [PubMed]
  106. Xue, S.; Barna, M. Specialized ribosomes: A new frontier in gene regulation and organismal biology. Nat. Reviews. Mol. Cell Biol. 2012, 13, 355–369. [Google Scholar] [CrossRef] [PubMed]
  107. Zhang, Z.; Ye, Y.; Gong, J.; Ruan, H.; Liu, C.J.; Xiang, Y.; Cai, C.; Guo, A.Y.; Ling, J.; Diao, L.; et al. Global analysis of tRNA and translation factor expression reveals a dynamic landscape of translational regulation in human cancers. Commun. Biol. 2018, 1, 234. [Google Scholar] [CrossRef]
  108. Dolfi, S.C.; Chan, L.L.; Qiu, J.; Tedeschi, P.M.; Bertino, J.R.; Hirshfield, K.M.; Oltvai, Z.N.; Vazquez, A. The metabolic demands of cancer cells are coupled to their size and protein synthesis rates. Cancer Metab. 2013, 1, 20. [Google Scholar] [CrossRef] [PubMed]
  109. Farache, D.; Antine, S.P.; Lee, A.S.Y. Moonlighting translation factors: Multifunctionality drives diverse gene regulation. Trends Cell Biol. 2022, 32, 762–772. [Google Scholar] [CrossRef] [PubMed]
  110. Buffington, S.A.; Huang, W.; Costa-Mattioli, M. Translational control in synaptic plasticity and cognitive dysfunction. Annu. Rev. Neurosci. 2014, 37, 17–38. [Google Scholar] [CrossRef]
  111. Lashkevich, K.A.; Dmitriev, S.E. mRNA Targeting, Transport and Local Translation in Eukaryotic Cells: From the Classical View to a Diversity of New Concepts. Mol. Biol. 2021, 55, 507–537. [Google Scholar] [CrossRef]
  112. Allen, S.R.; Stewart, R.K.; Rogers, M.; Ruiz, I.J.; Cohen, E.; Laederach, A.; Counter, C.M.; Sawyer, J.K.; Fox, D.T. Distinct responses to rare codons in select Drosophila tissues. bioRxiv 2022. [Google Scholar] [CrossRef] [PubMed]
  113. Hernandez-Alias, X.; Benisty, H.; Serrano, L.; Schaefer, M.H. Using protein-per-mRNA differences among human tissues in codon optimization. bioRxiv 2022. [Google Scholar] [CrossRef]
  114. Liu, Y.; Beyer, A.; Aebersold, R. On the Dependency of Cellular Protein Levels on mRNA Abundance. Cell 2016, 165, 535–550. [Google Scholar] [CrossRef] [PubMed]
  115. Sergushichev, A.A. An algorithm for fast preranked gene set enrichment analysis using cumulative statistic calculation. bioRxiv 2016. [Google Scholar] [CrossRef]
Figure 1. Tissue-specific expression pattern of two human genes encoding eEF1A paralogs, EEF1A1 and EEF1A2. (A) Expression of the EEF1A1 and EEF1A2 genes in various human tissues according to GTEx. (B) Levels of eEF1A1 and eEF1A2 proteins in various human tissues according to high-throughput proteomic analysis [1]. (C) Histograms showing the distribution of the percentage of EEF1A1 (top) and EEF1A2 (bottom) expressions among the genes from the “ELONGATION” complex across various human tissues, according to GTEx. (D) Percentage of EEF1A1 and EEF1A2 expressions among the genes from the “ELONGATION” complex across various human tissues, according to GTEx. TPM, Transcripts Per Kilobase Million; *, FDR corrected p-value < 0.01 in enrichment analysis (fgsea R package).
Ijms 24 08361 g001
Figure 2. Tissue-specific expression pattern of translation-associated genes localized in sex chromosomes. (A) Percentage of EIF1AX and EIF1AY expression among the genes from the “INITIATION” complex across various human tissues, according to GTEx. (B) Expression of the DDX3X and DDX3Y genes in various human tissues according to GTEx. (C) Expression of the EIF2S3 gene in various human tissues according to GTEx. TPM, Transcripts Per Kilobase Million; *, FDR corrected p-value < 0.01 in enrichment analysis (fgsea R package).
Ijms 24 08361 g002
Figure 3. Tissue-specific expression pattern of genes encoding PABPC homologs and translation termination factors. (A) Percentage of PABPC1, PABPC1L, PABPC3, PABPC4, and PABPC5 expression among the genes from the “PABPC” complex across various human tissues, according to GTEx. (B) Expression of the ETF1, GSPT1, and GSPT1 genes encoding eRF1, eRF3a/GSPT1, and eRF3b/GSPT2 correspondingly in various human tissues according to GTEx. (C) Percentage of ETF1, GSPT1, and GSPT1 expression among the genes from the “TERMINATION” complex across various human tissues, according to GTEx. TPM, Transcripts Per Kilobase Million; *, FDR corrected p-value < 0.01 in enrichment analysis (fgsea R package).
Ijms 24 08361 g003
Figure 4. Tissue-specific expression pattern of genes encoding GTPBP1 and GTPBP2 proteins, eIF4G paralogs, and eIF2B subunits. (A) Expression of the GTPBP1 and GTPBP2 genes in various human tissues according to GTEx. (B) Percentage of EIF4G1 and EIF4G3 among the genes from the “INITIATION” complex across various human tissues, according to GTEx. (C) Percentage of EIF2B1, EIF2B2, EIF2B3, EIF2B4, and EIF2B5 expression among the genes encoding components of the “eIF2B” complex across various human tissues, according to GTEx. TPM, Transcripts Per Kilobase Million; *, FDR corrected p-value < 0.01 in enrichment analysis (fgsea R package).
Ijms 24 08361 g004
Figure 5. Tissue-specific expression pattern of translation-associated genes showing high tissue specificity. (A) Percentage of EIF4E1B expression among the genes from the “INITIATION” complex across various human tissues, according to GTEx. (B) Expression of the EIF4ENIF1 in various human tissues according to GTEx. (C) Expression of the EIF5A, EIF5A2, and EIF5AL1 in various human tissues according to GTEx. (D) Percentage of BZW1 and BZW2 expression among the genes from the “INITIATION+” complex across various human tissues according to GTEx. (E) Percentage of EIF1B expression among the genes from the “INITIATION” complex across various human tissues, according to GTEx. (F) Percentage of PELO and HBS1L expression among the genes from the “TERMINATION+” complex across various human tissues according to GTEx. TPM, Transcripts Per Kilobase Million; *, FDR corrected p-value < 0.01 in enrichment analysis (fgsea R package).
Ijms 24 08361 g005
Figure 6. Tissue-specific expression pattern of genes encoding several aminoacyl-tRNA-synthetases (ARSases) showing tissue specificity. (A) Percentage of HARS and TARSL2 expression among the genes from the “ARSases” complex across various human tissues, according to GTEx. (B) Percentage of WARS expression among the genes from the “ARSases” complex across various human tissues, according to Gene Atlas [101]. (C) Percentage of AIMP1, AIMP2, and EEF1E1 expression among the genes from the “ARSase COMPLEX” complex across various human tissues, according to GTEx. (D) Percentage of KARS and NARS expression among the genes from the “ARSase COMPLEX” complex across various human tissues, according to GTEx. *, FDR corrected p-value < 0.01 in enrichment analysis (fgsea R package).
Ijms 24 08361 g006
Table 1. Complexes and functional groups of translation-associated proteins classified according to functional and physical interactions.
Complex or GroupProtein Names
eIF2EIF2S1, EIF2S2, EIF2S3
eIF2BEIF2B1, EIF2B2, EIF2B3, EIF2B4, EIF2B5
eIF3EIF3A, EIF3B, EIF3C, EIF3D, EIF3E, EIF3F, EIF3G, EIF3H, EIF3I, EIF3J, EIF3J, EIF3K, EIF3L, EIF3M
Multifactor complex (MFC)EIF1, EIF1AX, EIF1AY, EIF2B1, EIF2B2, EIF2B3, EIF2B4, EIF2B5, EIF2S1, EIF2S2, EIF2S3, EIF3A, EIF3B, EIF3C, EIF3D, EIF3E, EIF3F, EIF3G, EIF3H, EIF3I, EIF3J, EIF3J, EIF3K, EIF3L, EIF3M, EIF5
eIF4sEIF4A1, EIF4A2, EIF4B, EIF4H, EIF4E, EIF4E1B, EIF4E3, EIF4G1, EIF4G3
eIF4, 4EBPEIF4EBP1, EIF4EBP2, EIF4EBP3, EIF4A1, EIF4A2, EIF4B, EIF4H, EIF4E, EIF4E1B, EIF4E3, EIF4G1, EIF4G3
INITIATIONEIF1, EIF1AX, EIF1AY, EIF1B, EIF2B1, EIF2B2, EIF2B3, EIF2B4, EIF2B5, EIF2S1, EIF2S2, EIF2S3, EIF3A, EIF3B, EIF3C, EIF3D, EIF3E, EIF3F, EIF3G, EIF3H, EIF3I, EIF3J, EIF3J, EIF3K, EIF3L, EIF3M, EIF4A1, EIF4A2, EIF4B, EIF4H, EIF4E, EIF4E1B, EIF4E3, EIF4G1, EIF4G3, DDX3X, DDX3Y, DHX29, EIF4EBP1, EIF4EBP2, EIF4EBP3, EIF5, EIF5B, PABPC1
INITIATION+EIF1, EIF1AX, EIF1AY, EIF1B, EIF2B1, EIF2B2, EIF2B3, EIF2B4, EIF2B5, EIF2S1, EIF2S2, EIF2S3, EIF3A, EIF3B, EIF3C, EIF3D, EIF3E, EIF3F, EIF3G, EIF3H, EIF3I, EIF3J, EIF3J, EIF3K, EIF3L, EIF3M, EIF4A1, EIF4A2, EIF4B, EIF4H, EIF4E, EIF4E1B, EIF4E3, EIF4G1, EIF4G3, DDX3X, DDX3Y, DHX29, EIF4EBP1, EIF4EBP2, EIF4EBP3, EIF5, EIF5B, EIF6, PABPC1, ABCE1, EIF2D, MCTS1, DENR, MCTS2P, BZW1, BZW2, EIF4E2, EIF4G2, CTIF, PAIP1, PAIP2, EIF2A, ABCF1, NCBP1, NCBP2
eEF1BEEF1B2, EEF1D, EEF1G
eEF1HEEF1A1, EEF1A2, EEF1B2, EEF1D, EEF1G, VARS1
ELONGATIONEEF1A1, EEF1A2, EEF1B2, EEF1B2P2, EEF1D, EEF1G, EEF2, EEFSEC, EIF5A, EIF5A2
ELONGATION+EEF1A1, EEF1A2, EEF1B2, EEF1B2P2, EEF1D, EEF1G, EEF2, DPH1, DPH2, DPH3, DPH5, DPH6, DPH7, EEFSEC, EIF5A, EIF5A2, EIF5AL1, DHPS, DOHH
ELONGATION+
GTPBPs
GTPBP1, GTPBP2, EEF1A1, EEF1A2, EEF1B2, EEF1B2P2, EEF1D, EEF1G, EEF2, DPH1, DPH2, DPH3, DPH5, DPH6, DPH7, EEFSEC, EIF5A, EIF5A2, EIF5AL1, DHPS, DOHH
TERMINATIONETF1, GSPT1, GSPT2
TERMINATION+ETF1, GSPT1, GSPT2, PABPC1, ABCE1, EIF2D, MCTS1, DENR, MCTS2P, HBS1L, PELO
PABPC paralogsPABPC1L, PABPC1L2A, PABPC1L2B, PABPC3, PABPC4, PABPC4L, PABPC5, PABPC1
ARSasesAIMP1, AIMP2, EEF1E1, NARS, RARS, EPRS, MARS, QARS, IARS, KARS, LARS, YARS, VARS, AARS, CARS, DARS, FARSA, FARSB, GARS, HARS, HARS2, SARS, SARS2, TARS, TARSL2, WARS, LARS2, RARS2, VARS2, AARS2, TARS2, YARS2, WARS2, NARS2, PARS2, MARS2, IARS2, FARS2, EARS2, DARS2, CARS2
ARSase COMPLEXAIMP1, AIMP2, EEF1E1, NARS, RARS, EPRS, MARS, QARS, IARS, KARS, LARS
Disclaimer/Publisher’s Note: The statements, opinions and data contained in all publications are solely those of the individual author(s) and contributor(s) and not of MDPI and/or the editor(s). MDPI and/or the editor(s) disclaim responsibility for any injury to people or property resulting from any ideas, methods, instructions or products referred to in the content.

