Article

Differential Response of MYB Transcription Factor Gene Transcripts to Circadian Rhythm in Tea Plants (Camellia sinensis)

1
Tea Science Research Institute, College of Horticulture, Nanjing Agricultural University, Nanjing 210095, China
2
State Key Laboratory of Crop Genetics & Germplasm Enhancement and Utilization, Nanjing Agricultural University, Nanjing 210095, China
*
Authors to whom correspondence should be addressed.
Int. J. Mol. Sci. 2024, 25(1), 657; https://doi.org/10.3390/ijms25010657
Submission received: 23 September 2023 / Revised: 31 December 2023 / Accepted: 2 January 2024 / Published: 4 January 2024
(This article belongs to the Special Issue Advances in Research for Horticultural Crops Breeding and Genetics)

Abstract

:
The circadian clock refers to the formation of a certain rule in the long-term evolution of an organism, which is an invisible ‘clock’ in the body of an organism. As one of the largest TF families in higher plants, the MYB transcription factor is involved in plant growth and development. MYB is also inextricably correlated with the circadian rhythm. In this study, the transcriptome data of the tea plant ‘Baiyeyihao’ were measured at a photoperiod interval of 4 h (24 h). A total of 25,306 unigenes were obtained, including 14,615 unigenes that were annotated across 20 functional categories within the GO classification. Additionally, 10,443 single-gene clusters were annotated to 11 sublevels of metabolic pathways using KEGG. Based on the results of gene annotation and differential gene transcript analysis, 22 genes encoding MYB transcription factors were identified. The G10 group in the phylogenetic tree had 13 members, of which 5 were related to the circadian rhythm, accounting for 39%. The G1, G2, G8, G9, G15, G16, G18, G19, G20, G21 and G23 groups had no members associated with the circadian rhythm. Among the 22 differentially expressed MYB transcription factors, 3 members of LHY, RVE1 and RVE8 were core circadian rhythm genes belonging to the G10, G12 and G10 groups, respectively. Real-time fluorescence quantitative PCR was used to detect and validate the expression of the gene transcripts encoding MYB transcription factors associated with the circadian rhythm.

1. Introduction

The circadian rhythm is an endogenous timing mechanism that operates on a 24 h cycle, reflecting the relative length of day and night [1]. The input, central oscillator and output pathways are the three components that constitute the circadian rhythm system in higher plants. Among them, the central oscillator, which is the central element of the biological clock system, is essential for controlling plant growth [2,3]. Previous studies have identified core clock genes, such as the CIRCADIAN CLOCK ASSOCIATED 1 (CCA1), PSEUDO RESPONSE REGULATOR (PRR) family, TIMING OF CAB EXPRESSION 1 (TOC1), GIGANTEA (GI), REVEILLEs (RVEs), NIGHT LIGHT-INDUCIBLE AND CLOCK-REGULATED (LNK) and EARLY FLOWERING (ELF) genes [4]. At present, research related to the circadian rhythm mainly focuses on Arabidopsis, rice, tomato, etc. [5,6,7]. Huang et al. investigated photosynthetic efficiency through the circadian clock network under different light intensities in tomatoes [7]. The appearance of mutations in EID1 and LNK2 during domestication delayed both the phase and period of its circadian rhythm [6]. Most clock genes in Arabidopsis have homologous genes in rice [8]. OsELF3 promotes flowering by repressing Ghd7 at the transcriptional level and maintains circadian accumulation by interacting with HAF1 under long-day conditions [9]. The photoperiodic control of flowering time and photoregulation of growth are two examples of features that can be altered by clock gene mutations [10,11]. When comparing the phenotypes of wild-type and mutant plants with clock-changing functions, it can be found that different physiological characteristics (total CO2 assimilation rate, sugar status and photosynthetic utilization efficiency) are affected by the circadian rhythm [12,13]. The expression profiles of genes related to the circadian rhythm show different patterns in the photoperiods of plants.
Transcription factors (TFs) are a group of proteins that specifically bind to upstream sequences at the 5′ end of the genes, thereby ensuring targeted gene expression with precise spatiotemporal control. MYBs are an important family of transcription factors in higher plants [14,15]. In higher plants, there are four main types of MYB transcription factors: 1R-MYB, R2R3-MYB, 3R-MYB and 4R-MYB [16,17,18,19]. Genome-wide descriptions have been relatively detailed for model plants such as Arabidopsis, rice and carrot [20,21]. MYB transcription factors exhibit diverse functions in higher plants, including the regulation of various subbiological metabolic synthesis and abiotic stress responses [22,23,24,25]. MYB transcription factors have also been reported in tea plants [26,27]. CsMYB4a is potentially involved in the regulation of gene expression related to flavonoid biosynthesis [28]. CsMYB2 and CsMYB26 are two other regulatory genes involved in the biosynthesis of tea flavonoids [27].
In higher plants, MYB transcription factors are associated with the circadian rhythm [29,30,31,32,33]. The MYB transcription factors CCA1 and LHY (LATE ELONGATED HYPOCOTYL) play crucial roles in maintaining the diurnal cycle of the central oscillator in the biological rhythm system and in regulating the circadian rhythm in Arabidopsis [30,34]. REVEILLE1 (RVE1), a transcription factor that is similar to MYB, is homologous to LHY and CCA1. As a node in the auxin network that connects elements of the circadian rhythm, RVE1 provides a mechanistic link between two important signaling pathways [35]. Another member of the RVE family, RVE8, is an MYB transcription factor. RVE8 interacts with the transcriptional coactivators LNK1 and LNK2 to promote the expression of clock genes during nighttime [36]. Duan et al. identified a novel MYB transcription factor in rice, CMYB1, through transcriptome analysis and observed significant rhythmic expression profiles, suggesting that CMYB1 plays a crucial role in cold tolerance via circadian regulation [32]. MYB-like transcription factors LUX (LUX ARRHYTHMO), ELF3 (EARLY FLOWERING 3) and ELF4 constitute the Evening Complex (EC) [37]. In the morning, the EC was inhibited by CCA1 and LHY, and in the evening, it was inhibited by TOC1. MYB112 can directly bind to the promoter of the LUX gene (the core component of the central oscillator of the biological clock) and inhibit its transcription, weakening the inhibitory effect of LUX on the transcription of PIF4 and thus promoting its transcription of the PIF4 gene [38]. Circadian rhythm gene expression and various regulatory relationships within the core oscillator are critical for maintaining the circadian rhythm. The circadian rhythm core oscillator forms a highly linked regulatory network with other circadian rhythm components, affecting a wide range of plant signal transduction and metabolic pathways [39].
To date, studies of MYB transcription factors have mainly focused on anthocyanin biosynthesis regulation [40,41], lignin biosynthesis regulation [42] and the abiotic stress response [43]. To the best of our knowledge, there are few reports on the circadian rhythm of tea plants. The response of MYB transcription factors to the circadian rhythm in tea plants has also not been reported. Understanding the mechanism of MYB transcription factors in regulating the circadian rhythm can enhance the adaptability and stress resistance of tea plants, change the regional restriction of tea plants and improve tea quality.
The tea plant (Camellia sinensis (L.) O. Kuntze) has a history of over 5000 years and boasts rich germplasm resources. As a natural, nonalcoholic beverage popular worldwide, tea plays a significant role in the prevention of cancer and cardiovascular diseases [44,45]. Tea is derived from the leaves of tea plants. As the primary organs responsible for photosynthesis and transpiration, plant leaves provide both the material and energy necessary for growth and development [46]. With the development of the tea genome and sequencing technology, omics studies of tea plants have been reported [47,48,49]. Here, the high-throughput sequencing technology DNBSEQ was used to sequence the transcriptome of the tea plant ‘Baiyeyihao’ at intervals of 4 h within one photoperiod (24 h). We identified prospective genes involved in the circadian rhythm, and differentially expressed gene transcripts with MYB transcription factor annotation information were further screened. The selected candidate genes encoding MYB transcription factors were evaluated using a heatmap to understand the response of the circadian rhythm in tea plants. Real-time fluorescence quantitative PCR was used to identify and confirm the expression profiles of circadian-rhythm-related MYB genes in tea plants. This is the first transcriptome analysis of circadian rhythm transcription factors in tea plants. These results also provide a reference for further research on the roles of MYB transcription factors in the circadian rhythm of higher plants.

2. Results

2.1. Sequencing Quality Analysis

Through transcriptome sequencing analysis of tea leaves at a photoperiod interval of 4 h (0 h, 4 h, 8 h, 12 h, 16 h, 20 h), 10.42~10.45 Gb of effective data was obtained. The values of Q20 (error rate less than 1%) were above 96.21%, and the values of Q30 (error rate less than 1%) were above 91.00%. The percentages of GC contents were 45.046%, 44.611%, 44.659%, 44.157%, 44.306% and 44.529%, respectively (Table 1).

2.2. Analysis of Gene Transcripts

Adaptor sequences, duplicated sequences and low-quality reads were excluded. The filtered data were qualitatively controlled using fastqc, and the StringTie software (Version: 2.1.4; Parameter: default) was used to assemble the transcripts. In total, 25,306 transcripts were obtained. Among them, ‘o’ is other overlapped parts of the same chain with reference exons, with a total of 694; ‘j’ is for multiple exons with at least one match, of which there are 14,060; ‘x’ is exon overlap on the antichain; ‘i’ is completely contained in the intron of the reference transcript; and ‘u’ is 9415 unknown new transcripts. TransDecoder was used to predict the encoding region of a new transcript. The results showed that the length of the unigenes was mainly between 100 and 1500 bp, and the length of the N50 was 1392 bp (Figure 1).

2.3. Functional Annotation and Categorization

To obtain functional information on the transcripts, functional annotations were drawn up for transcripts from seven databases: Nr (NCBI non-redundant) [50], Pfam [51], Uniprot [52], KEGG (Kyoto Encyclopedia of Genes and Genomes) [53], GO (Gene Ontology) [54], COG (Clusters of Orthologous Groups) [55] and PATHWAY [53]. A total of 19,872 unigenes were annotated in the Nr database, accounting for 78.53%. A total of 19,641 unigenes were annotated in the Uniport database, accounting for 77.61%. A total of 48 unigenes were annotated in the KOG database, accounting for 0.19%. A total of 14,615 unigenes were annotated in the GO database, accounting for 57.75%. A total of 5779 unigenes were annotated in the KEGG database, accounting for 22.84% (Supplementary Table S1).
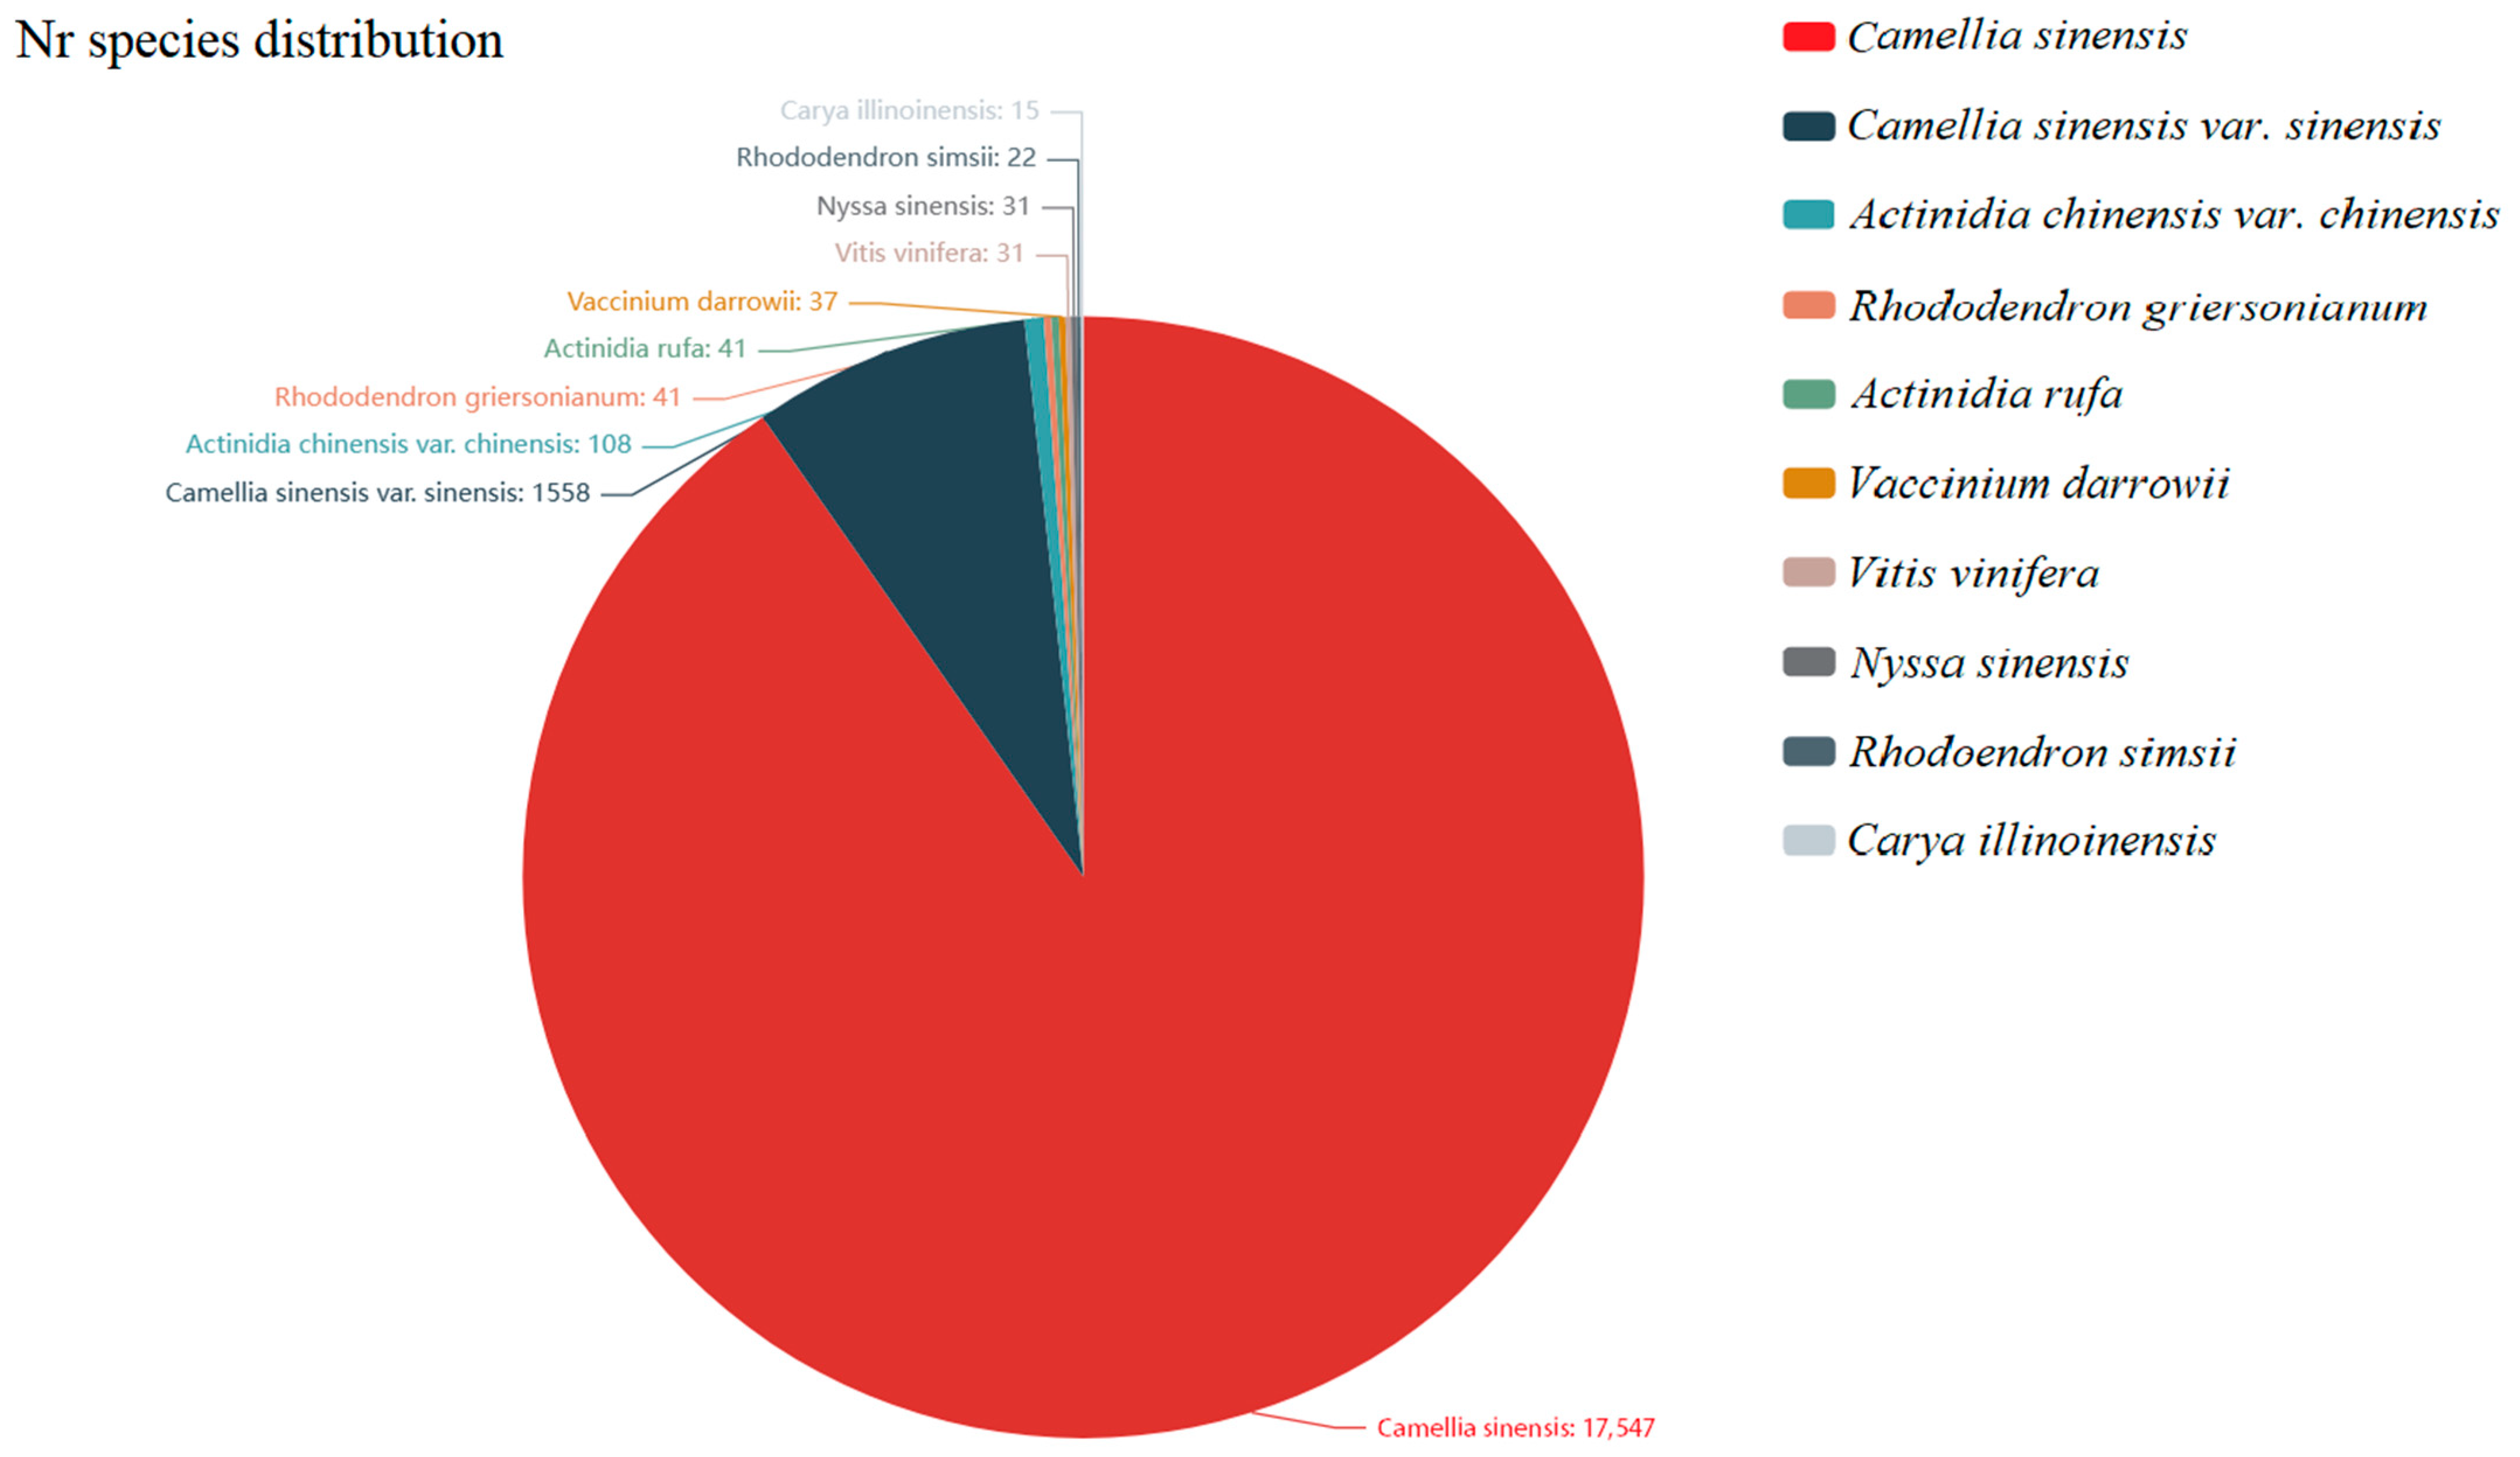
The 25,306 assembled unigenes were compared with the related databases. Among these, 19,872 unigenes were annotated in the Nonredundant Collection of Nucleotide Sequences (nr). According to the comparative annotation results of the Nr database with Camellia sinensis as a reference, the top 10 species with the most comparisons were determined to be as follows: Camellia sinensis (17,547), C. sinensis var. sinensis (1558), Aactinidia chinensis var. chinensis (108), Rhododendron griersonianum (41), Actinidia rufa (41), Vaccinium darrowii (37), Vitis vinifera (31), Nyssa sinensis (31), Rhodoendron simsii (22) and Carya illinoinensis (15) (Figure 2).

2.4. GO Analysis

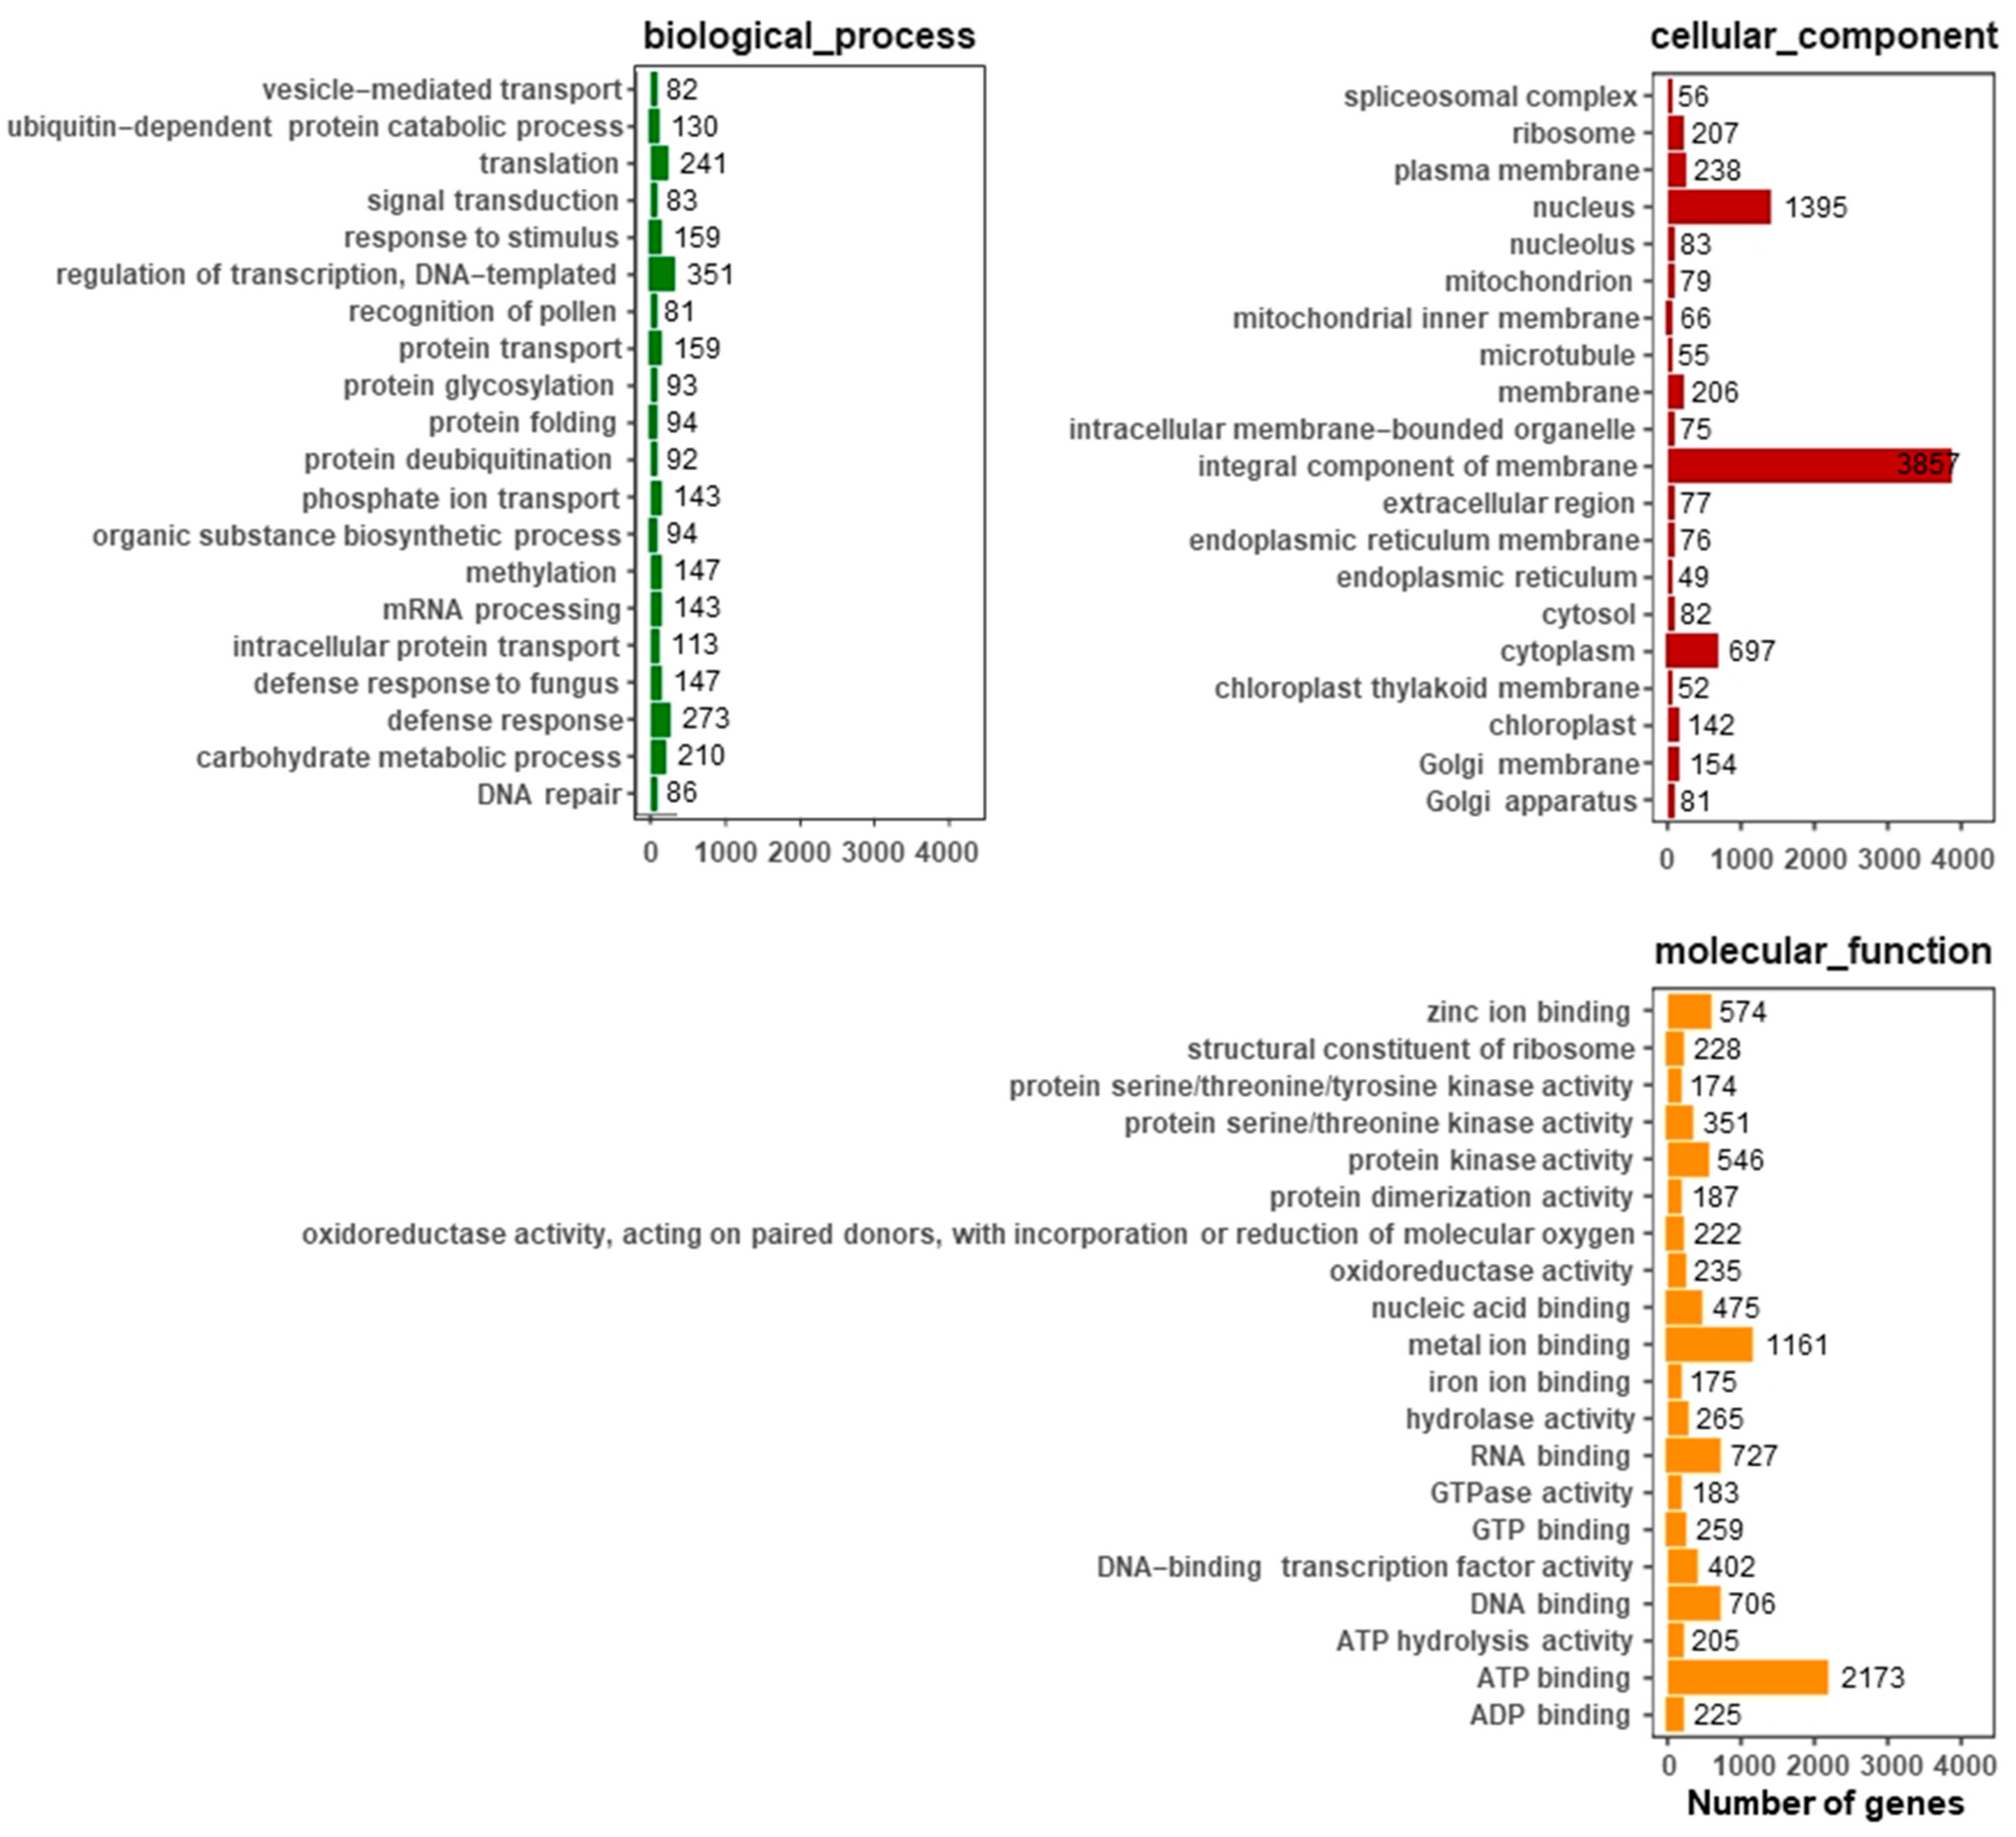
Gene Ontology (GO) is an international standard classification system of gene function. The GO database was used to classify the annotated tea transcriptome data. A total of 14,615 unigenes of C. sinensis had Gene Ontology (GO) annotations. GO describes gene function from three aspects: cellular component (CC), molecular function (MF) and biological process (BP). The top 20 most common GOslim secondary categories in each category were selected for plotting (Figure 3). Among them, transcription regulation & DNA—templated (351), defense response (273) and translation (241) involved the largest number of differentially expressed gene transcripts (DETs). Among the cell components, the integral components of the membrane (3857), nucleus (1395) and cytoplasm (697) were involved in the most DETs. The most common terms in molecular functions were ATP binding (2173), metal ion binding (1161) and RNA binding (727).

2.5. KEGG Classification

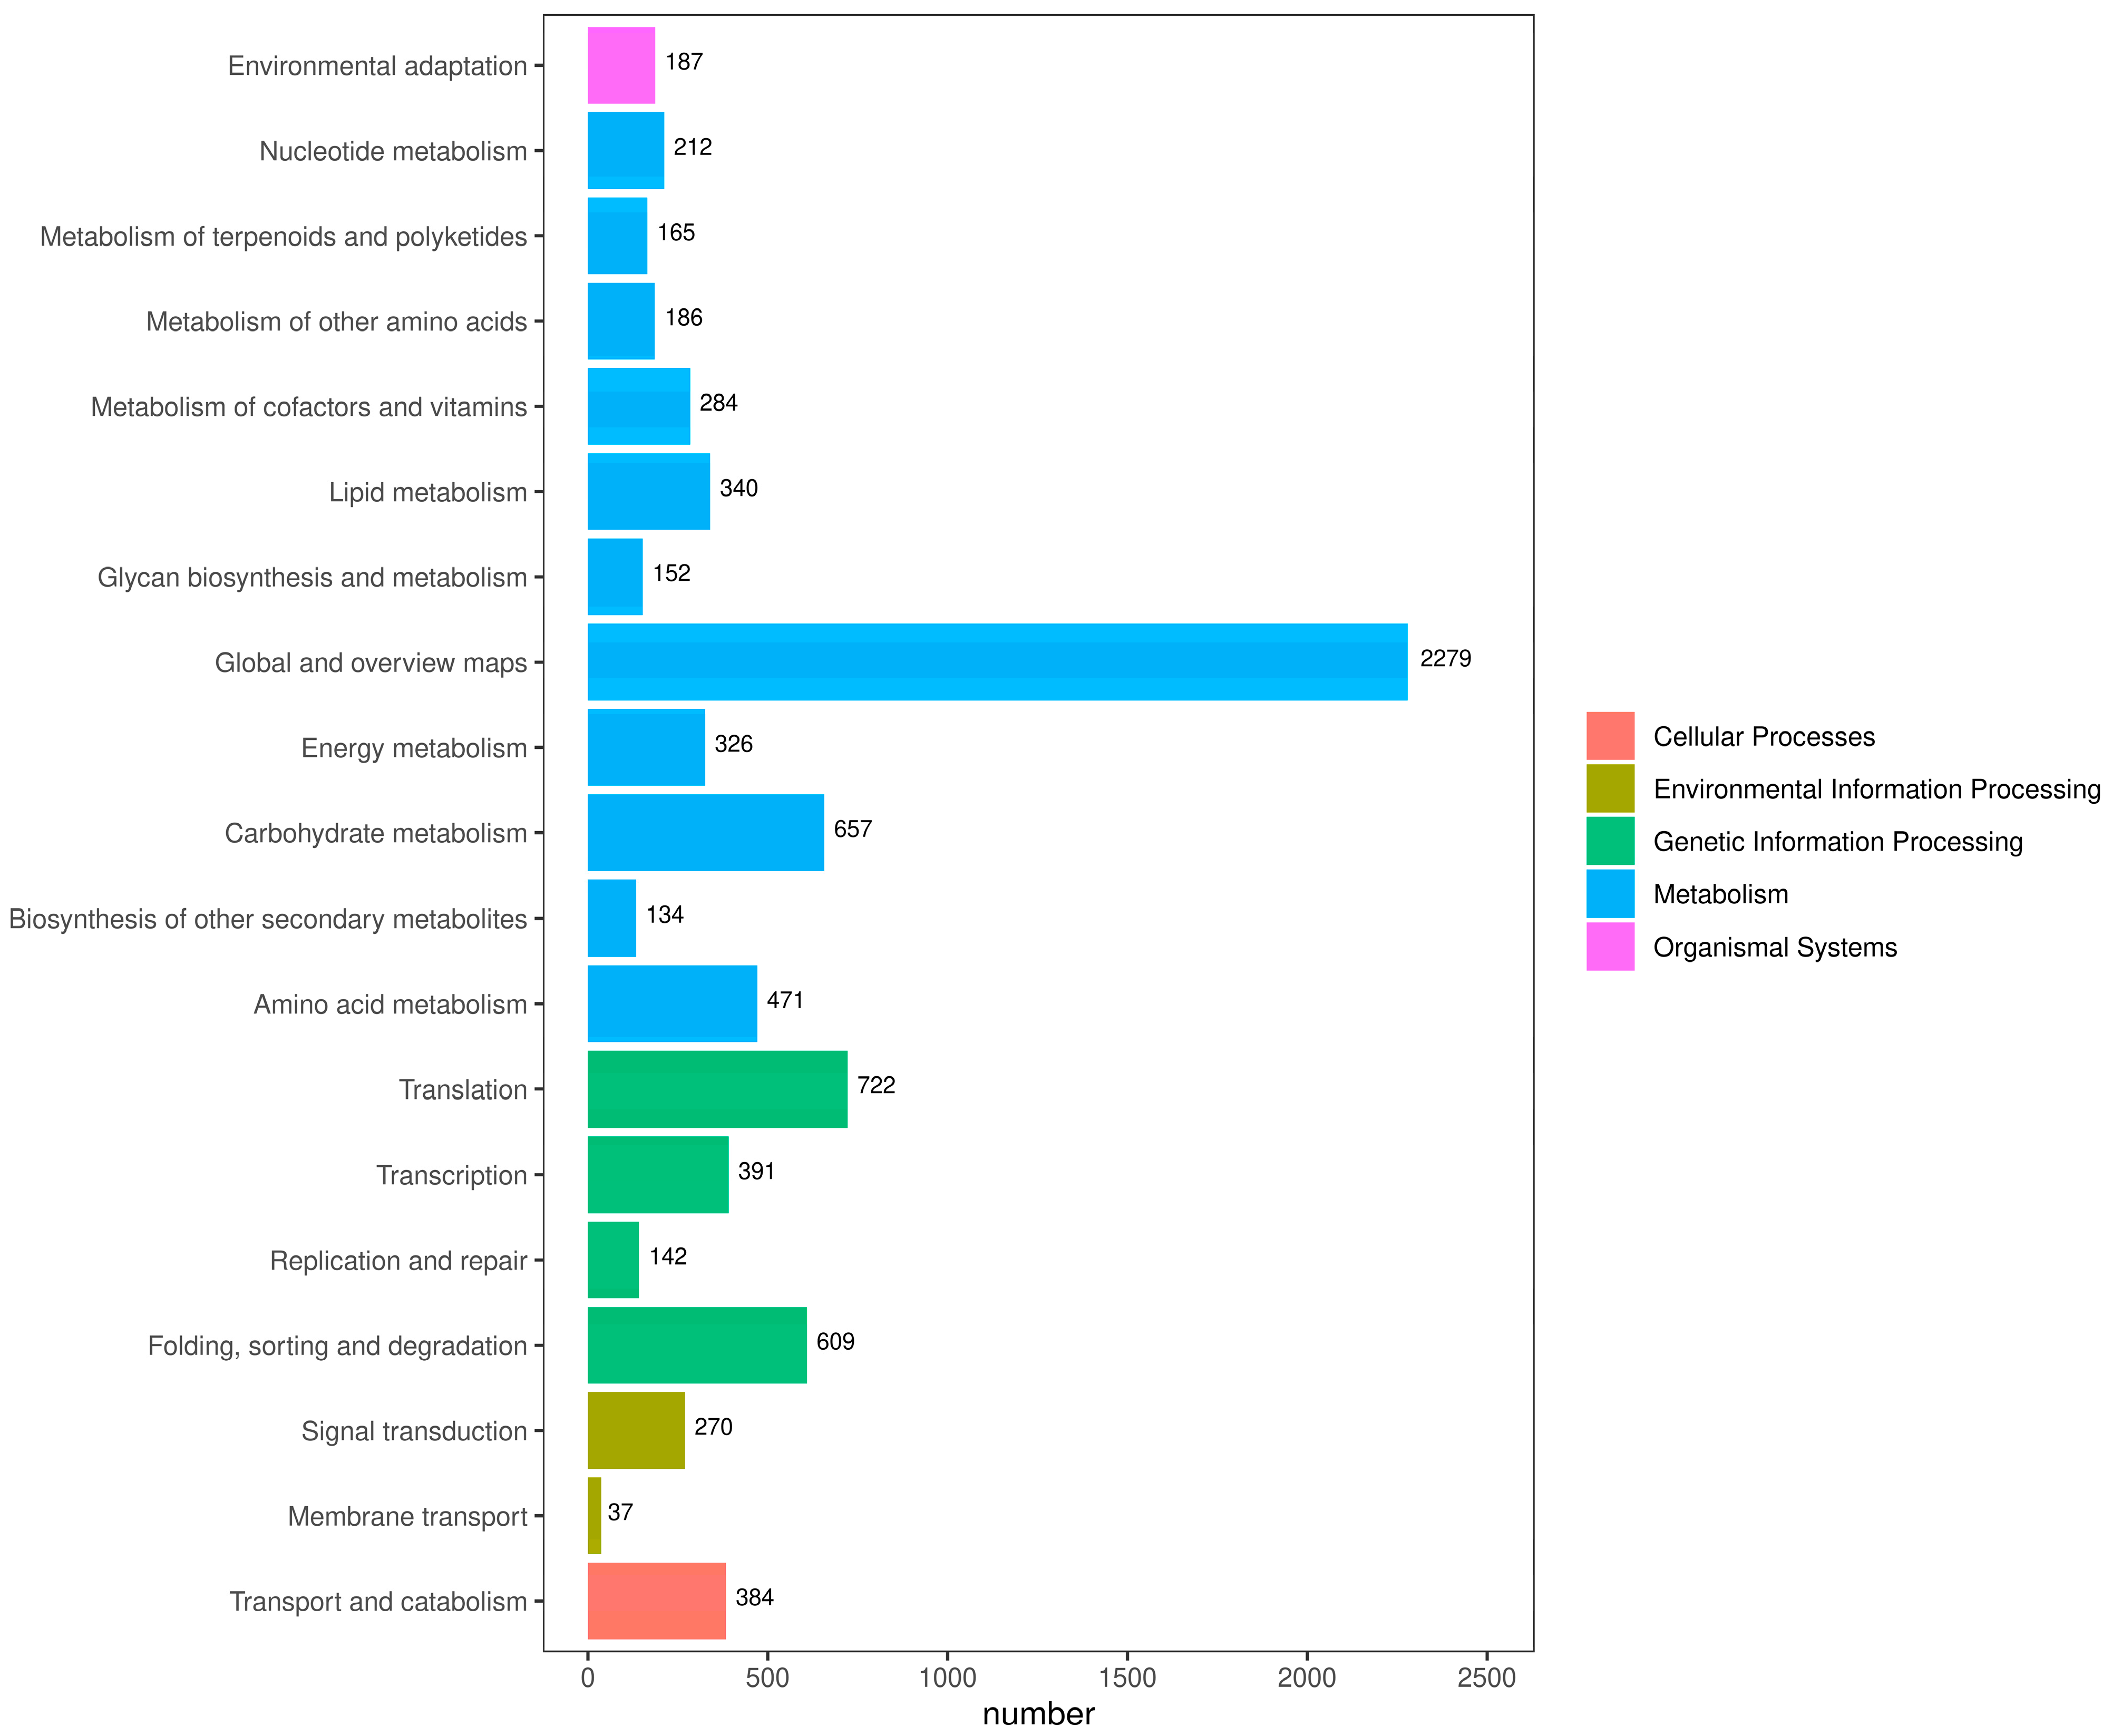
After KEGG annotation of transcript sequences, they were classified according to the KEGG metabolic pathways in which they participated, and the results are shown in Figure 4. A total of 10,443 DETs were annotated. This classification is divided into five levels: cellular processes, environmental information processing, genetic information processing, metabolism and organismal systems. The largest level of these was metabolism, which had 11 sublevels. Among the 11 sublevel metabolic pathways were global and overview maps (2279), carbohydrate metabolism (657) and amino acid metabolism (471). In the processing of genetic information, translation (n = 722) and folding, sorting and degradation (n = 609) occupied large proportions.

2.6. Differential Gene Transcript Analysis

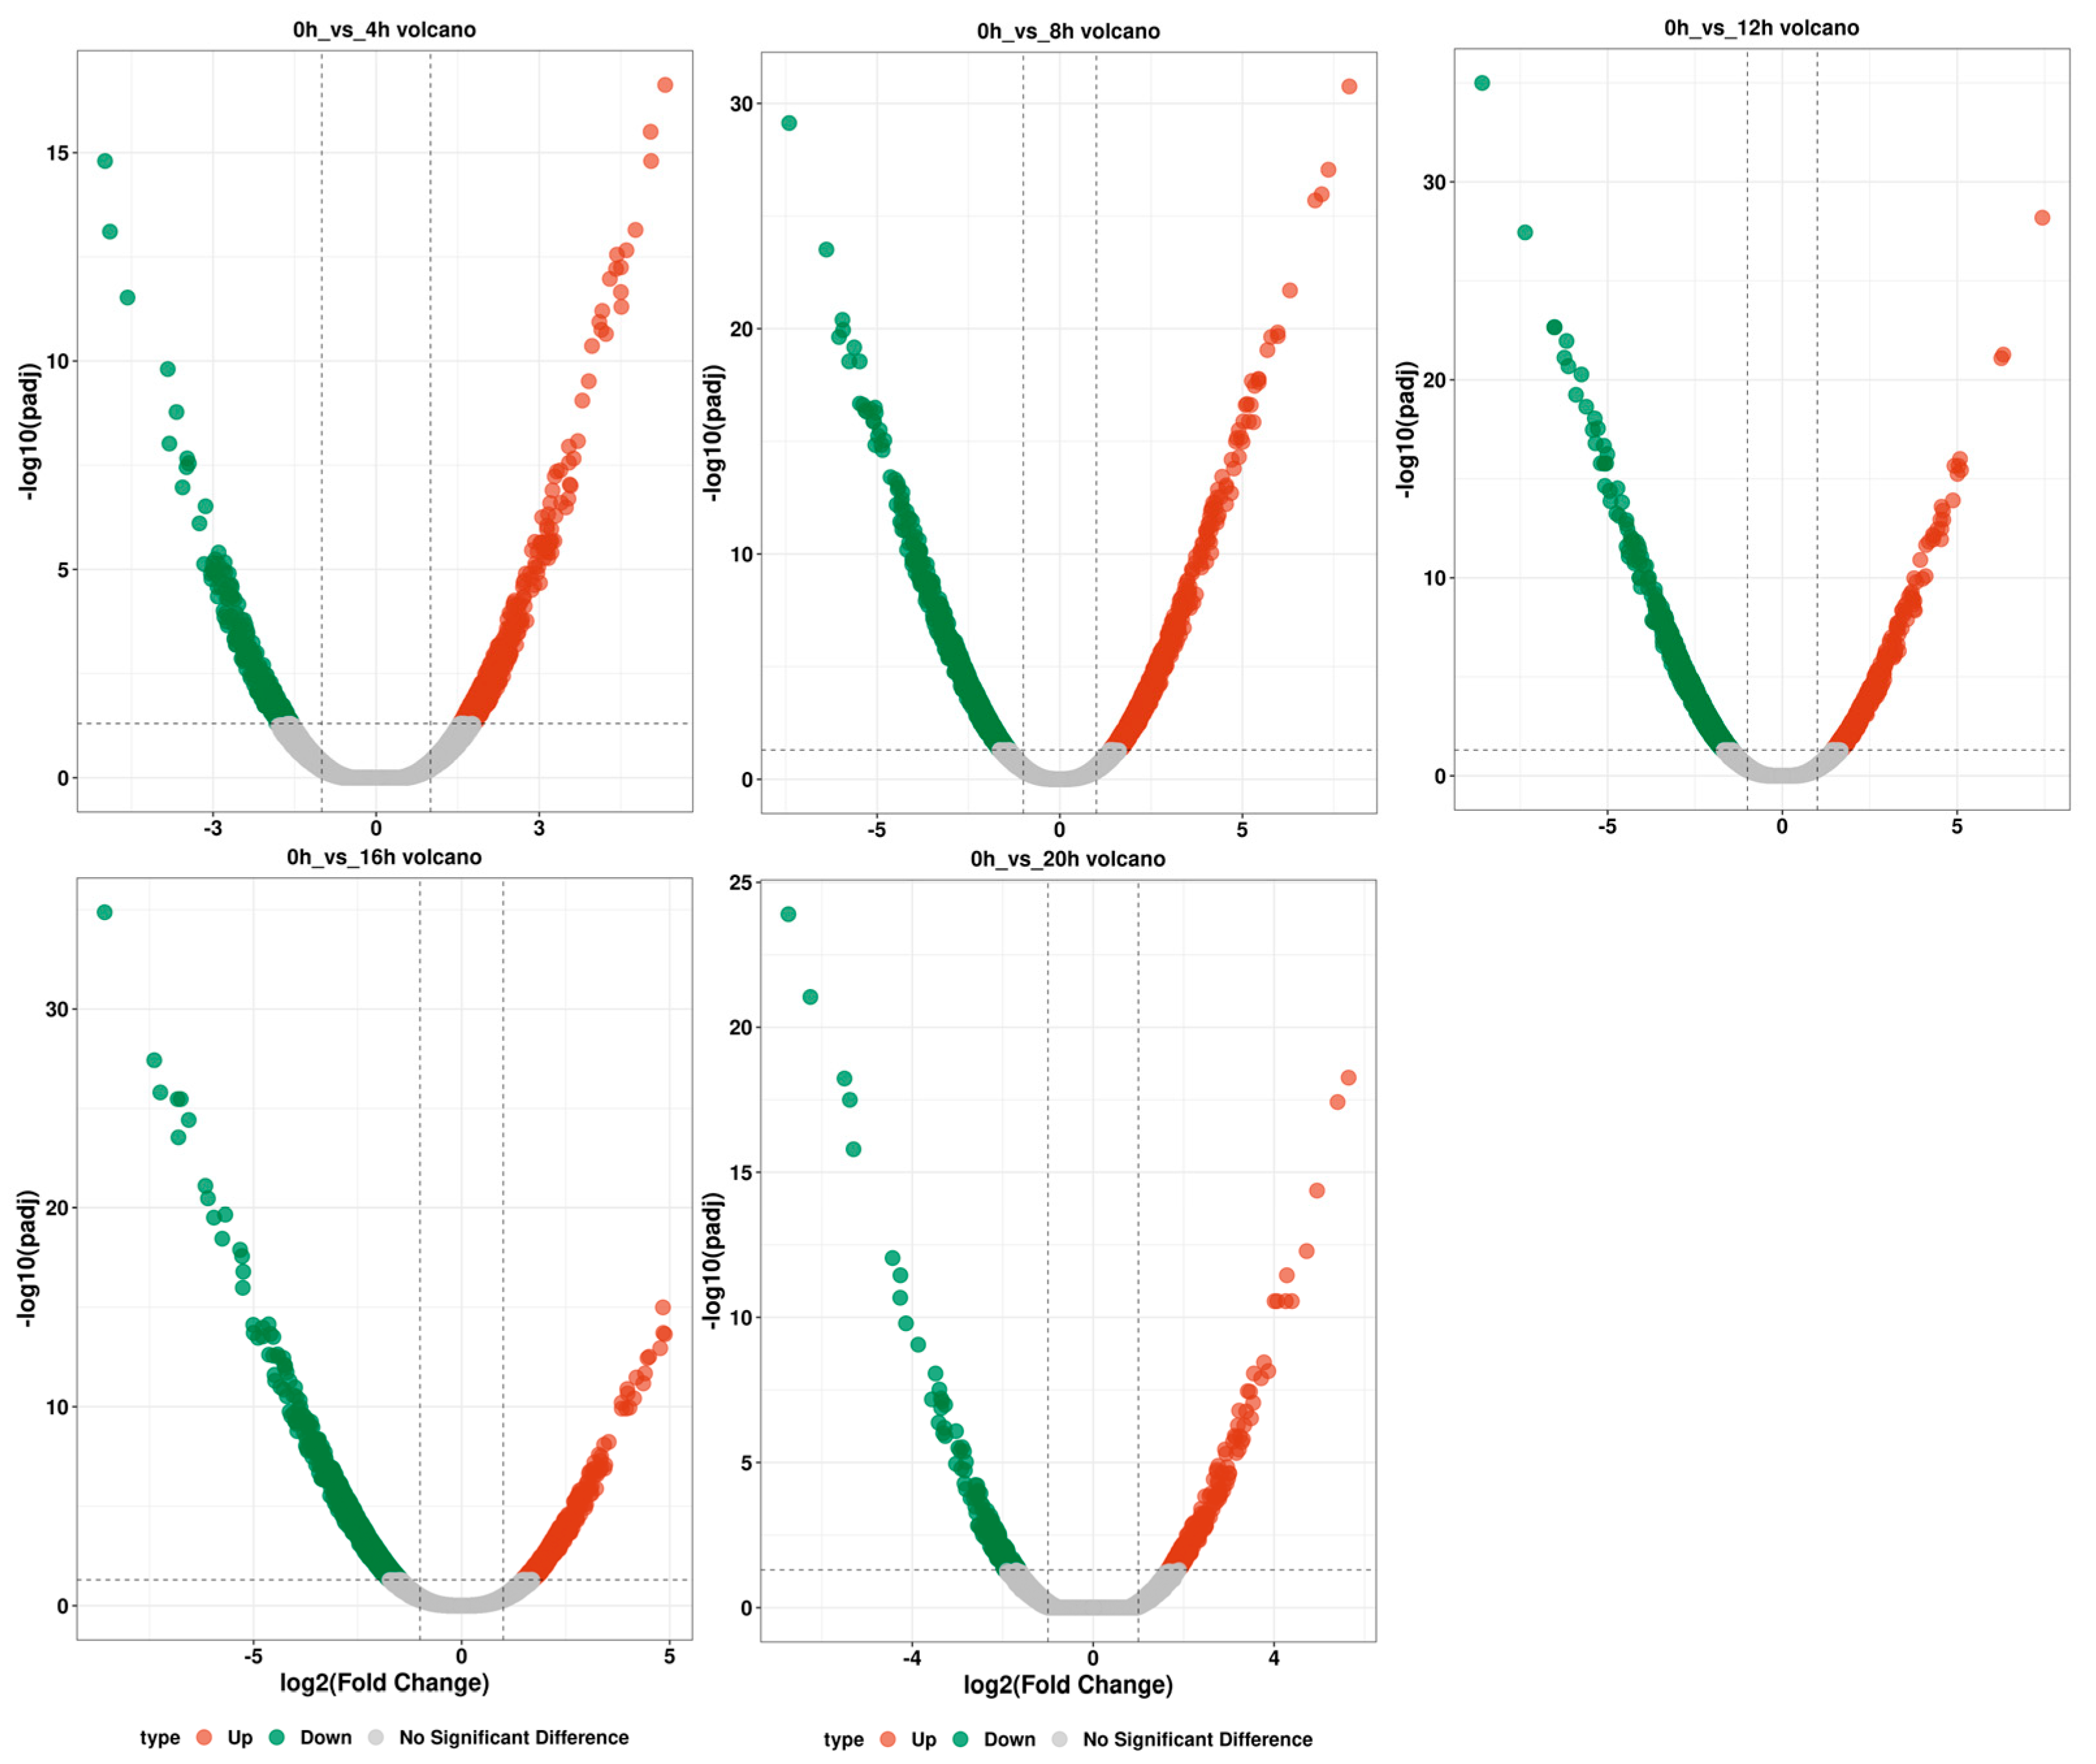
In our differential expression analysis, the expression levels of the gene transcripts in each sample were obtained through expression quantitation of read count data. A total of 772, 2411, 1731, 1434 and 393 differentially expressed gene transcripts were identified in “0 h_vs._4 h”, “0 h_vs._8 h”, “0 h_vs._12 h”, “0 h_vs._16 h” and “0 h_vs._20 h.” In “0 h_vs._4 h”, a total of 469 differentially expressed gene transcripts were upregulated and 303 were downregulated. In “0 h_vs._8 h”, a total of 1215 differentially expressed gene transcripts were up- and 1196 downregulated. In “0 h_vs._12 h”, a total of 697 differentially expressed gene transcripts were up- and 1034 downregulated. In “0 h_vs._16 h”, a total of 532 differentially expressed gene transcripts were up- and 902 downregulated. In “0 h_vs._20 h”, a total of 235 differentially expressed gene transcripts were up- and 158 downregulated (Figure 5).

2.7. Differential Expression of Gene Transcripts Encoding Transcription Factors

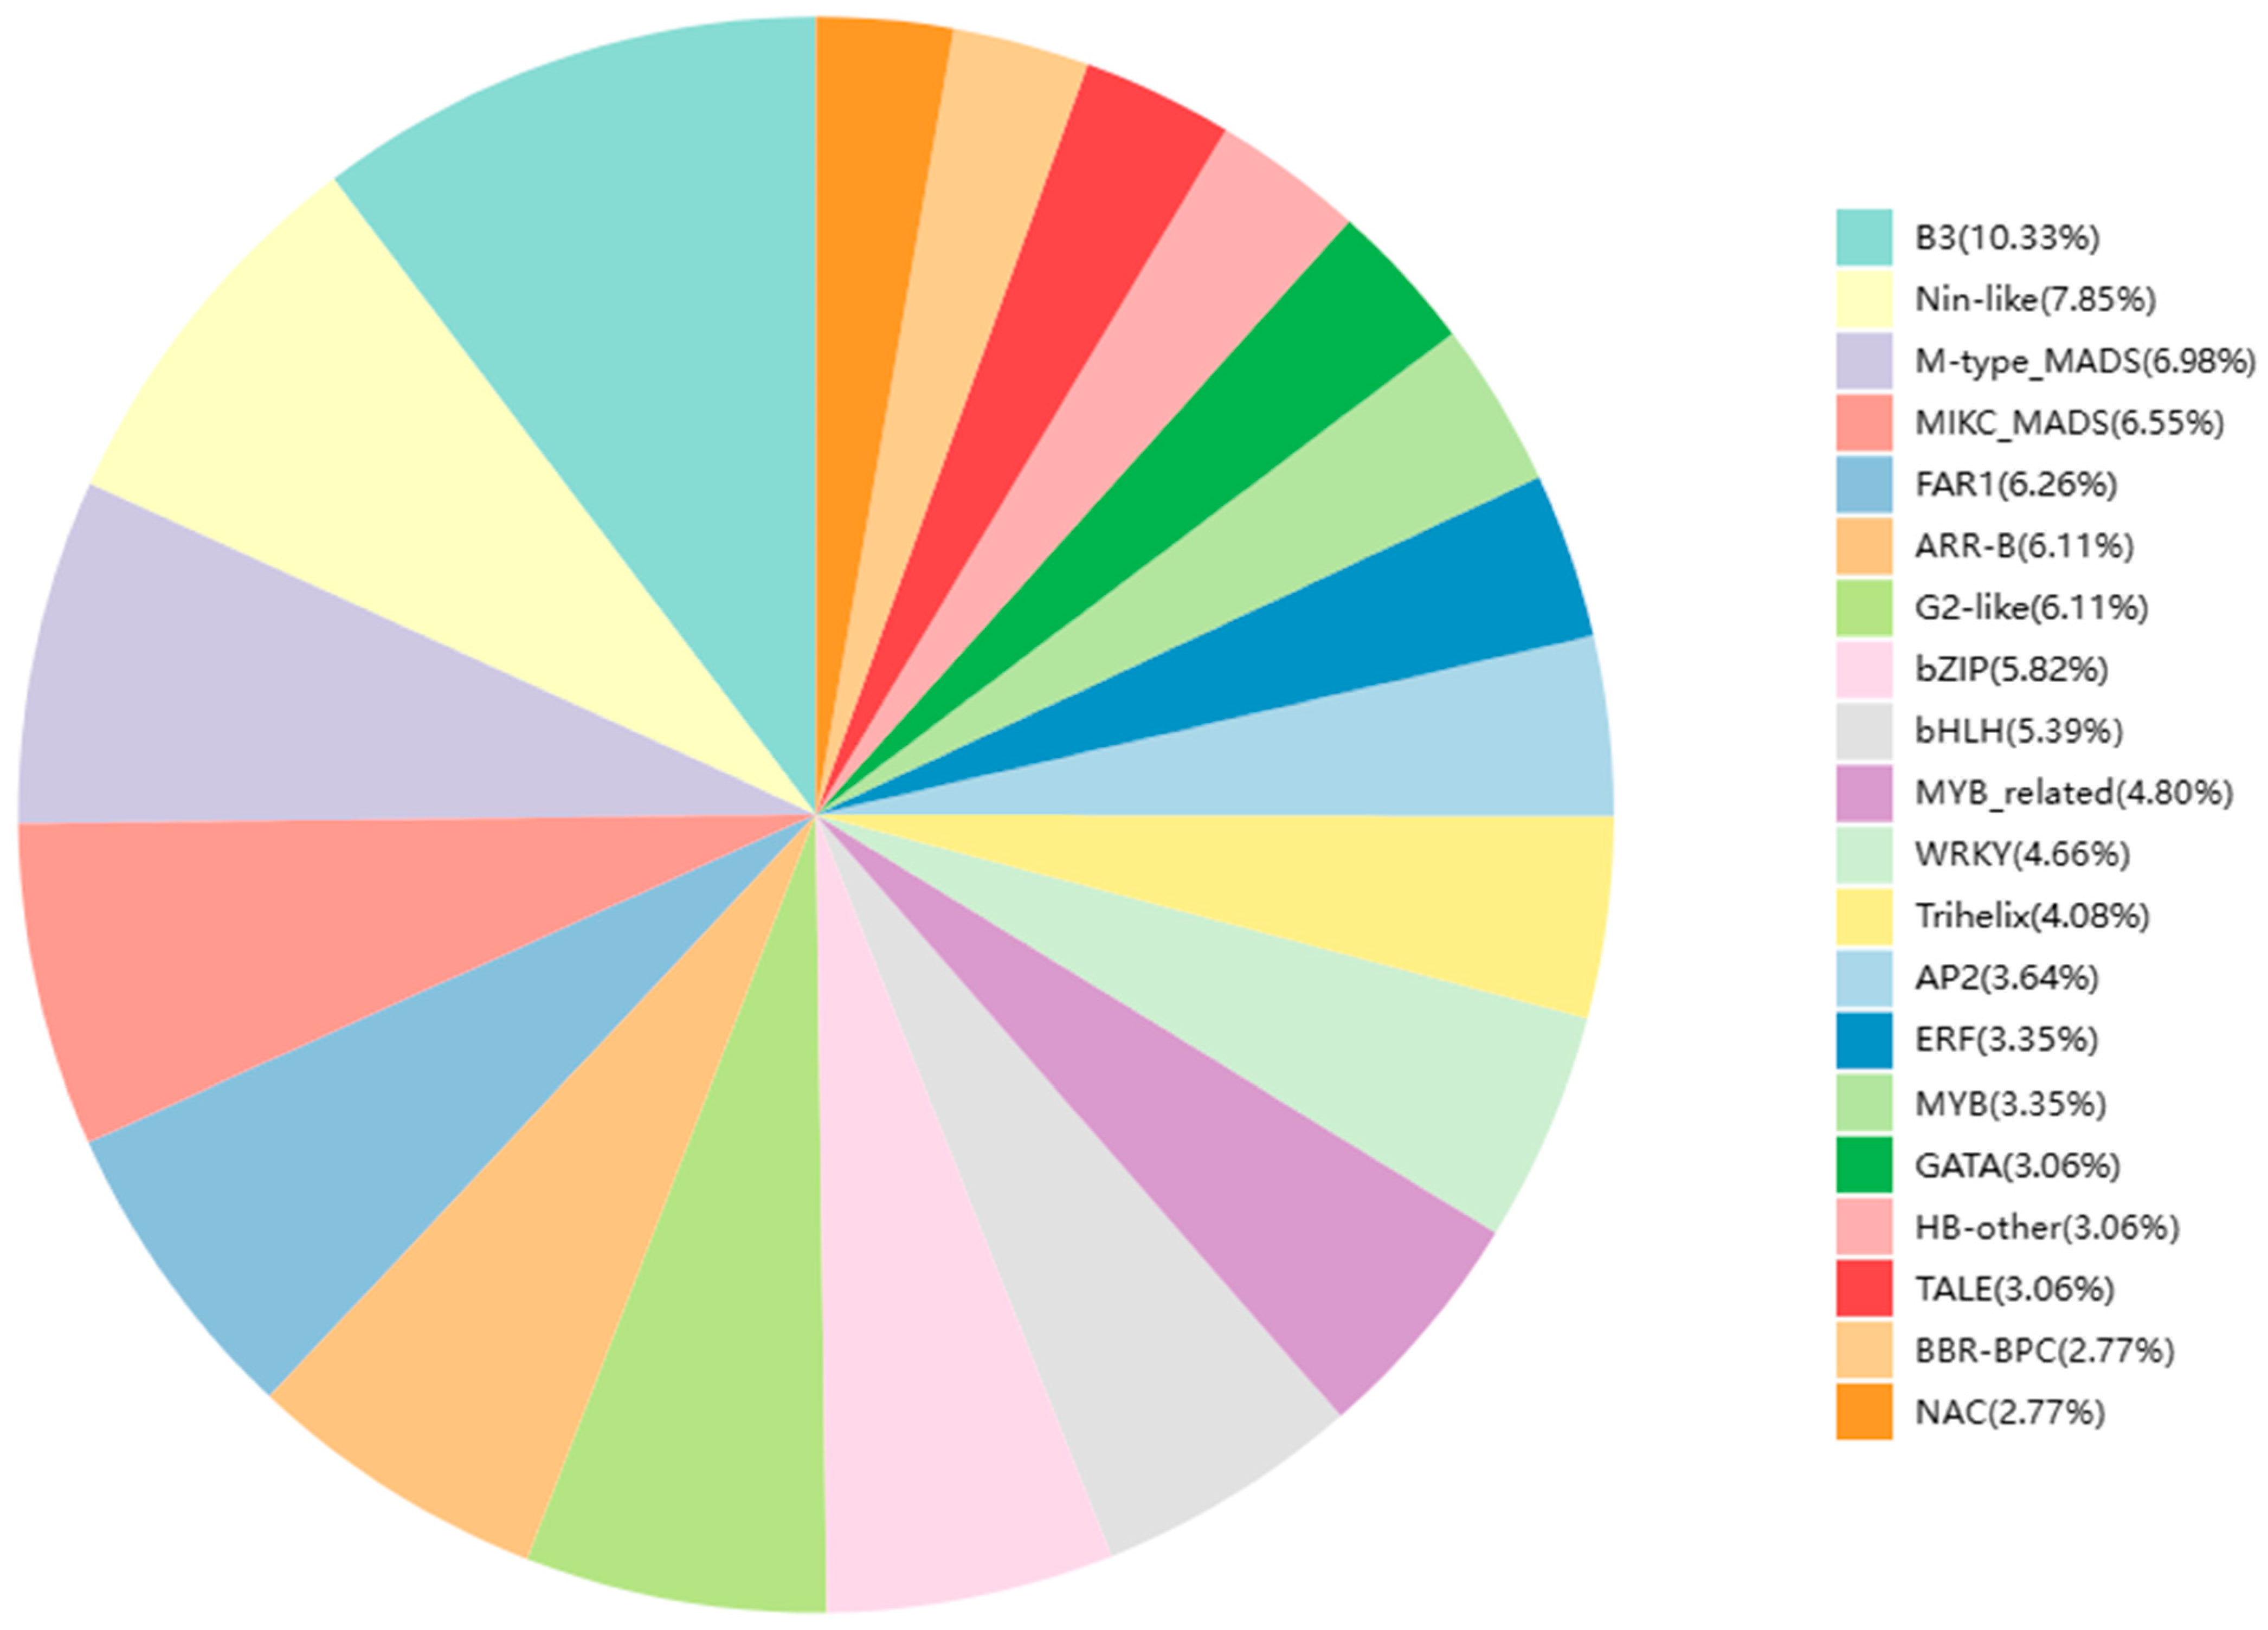
DETs encoding transcription factors were predicted using PlantTFDB [56]. The top 20 transcription factor families with differential expression were selected for plotting, and the proportion statistics are shown in Figure 6. A total of 894 DETs encoding transcription factors were detected, the most abundant of which were the B3 (71) and Nin-like (54) transcription factor families. Twenty-three MYB transcription factors and thirty-three MYB-related transcription factors were identified, accounting for 3.35% and 4.80% of the total differentially expressed transcription factors (894), respectively. According to the results of transcription factor annotation, DETs with transcription factor annotation information were further screened, and duplicate transcription factors were removed. A total of 22 transcripts of the MYB transcription factors were obtained for subsequent analysis. We identified one upregulated and four downregulated unigenes in “0 h_vs._4 h”; two upregulated and twelve downregulated unigenes in “0 h_vs._8 h”; one upregulated and eight downregulated unigenes in “0 h_vs._12 h”; one upregulated and eight downregulated unigenes in “0 h_vs._16 h”; and one upregulated and zero downregulated unigenes in “0 h_vs._20 h.”

2.8. Distribution of the DETs Encoding MYB Transcription Factors

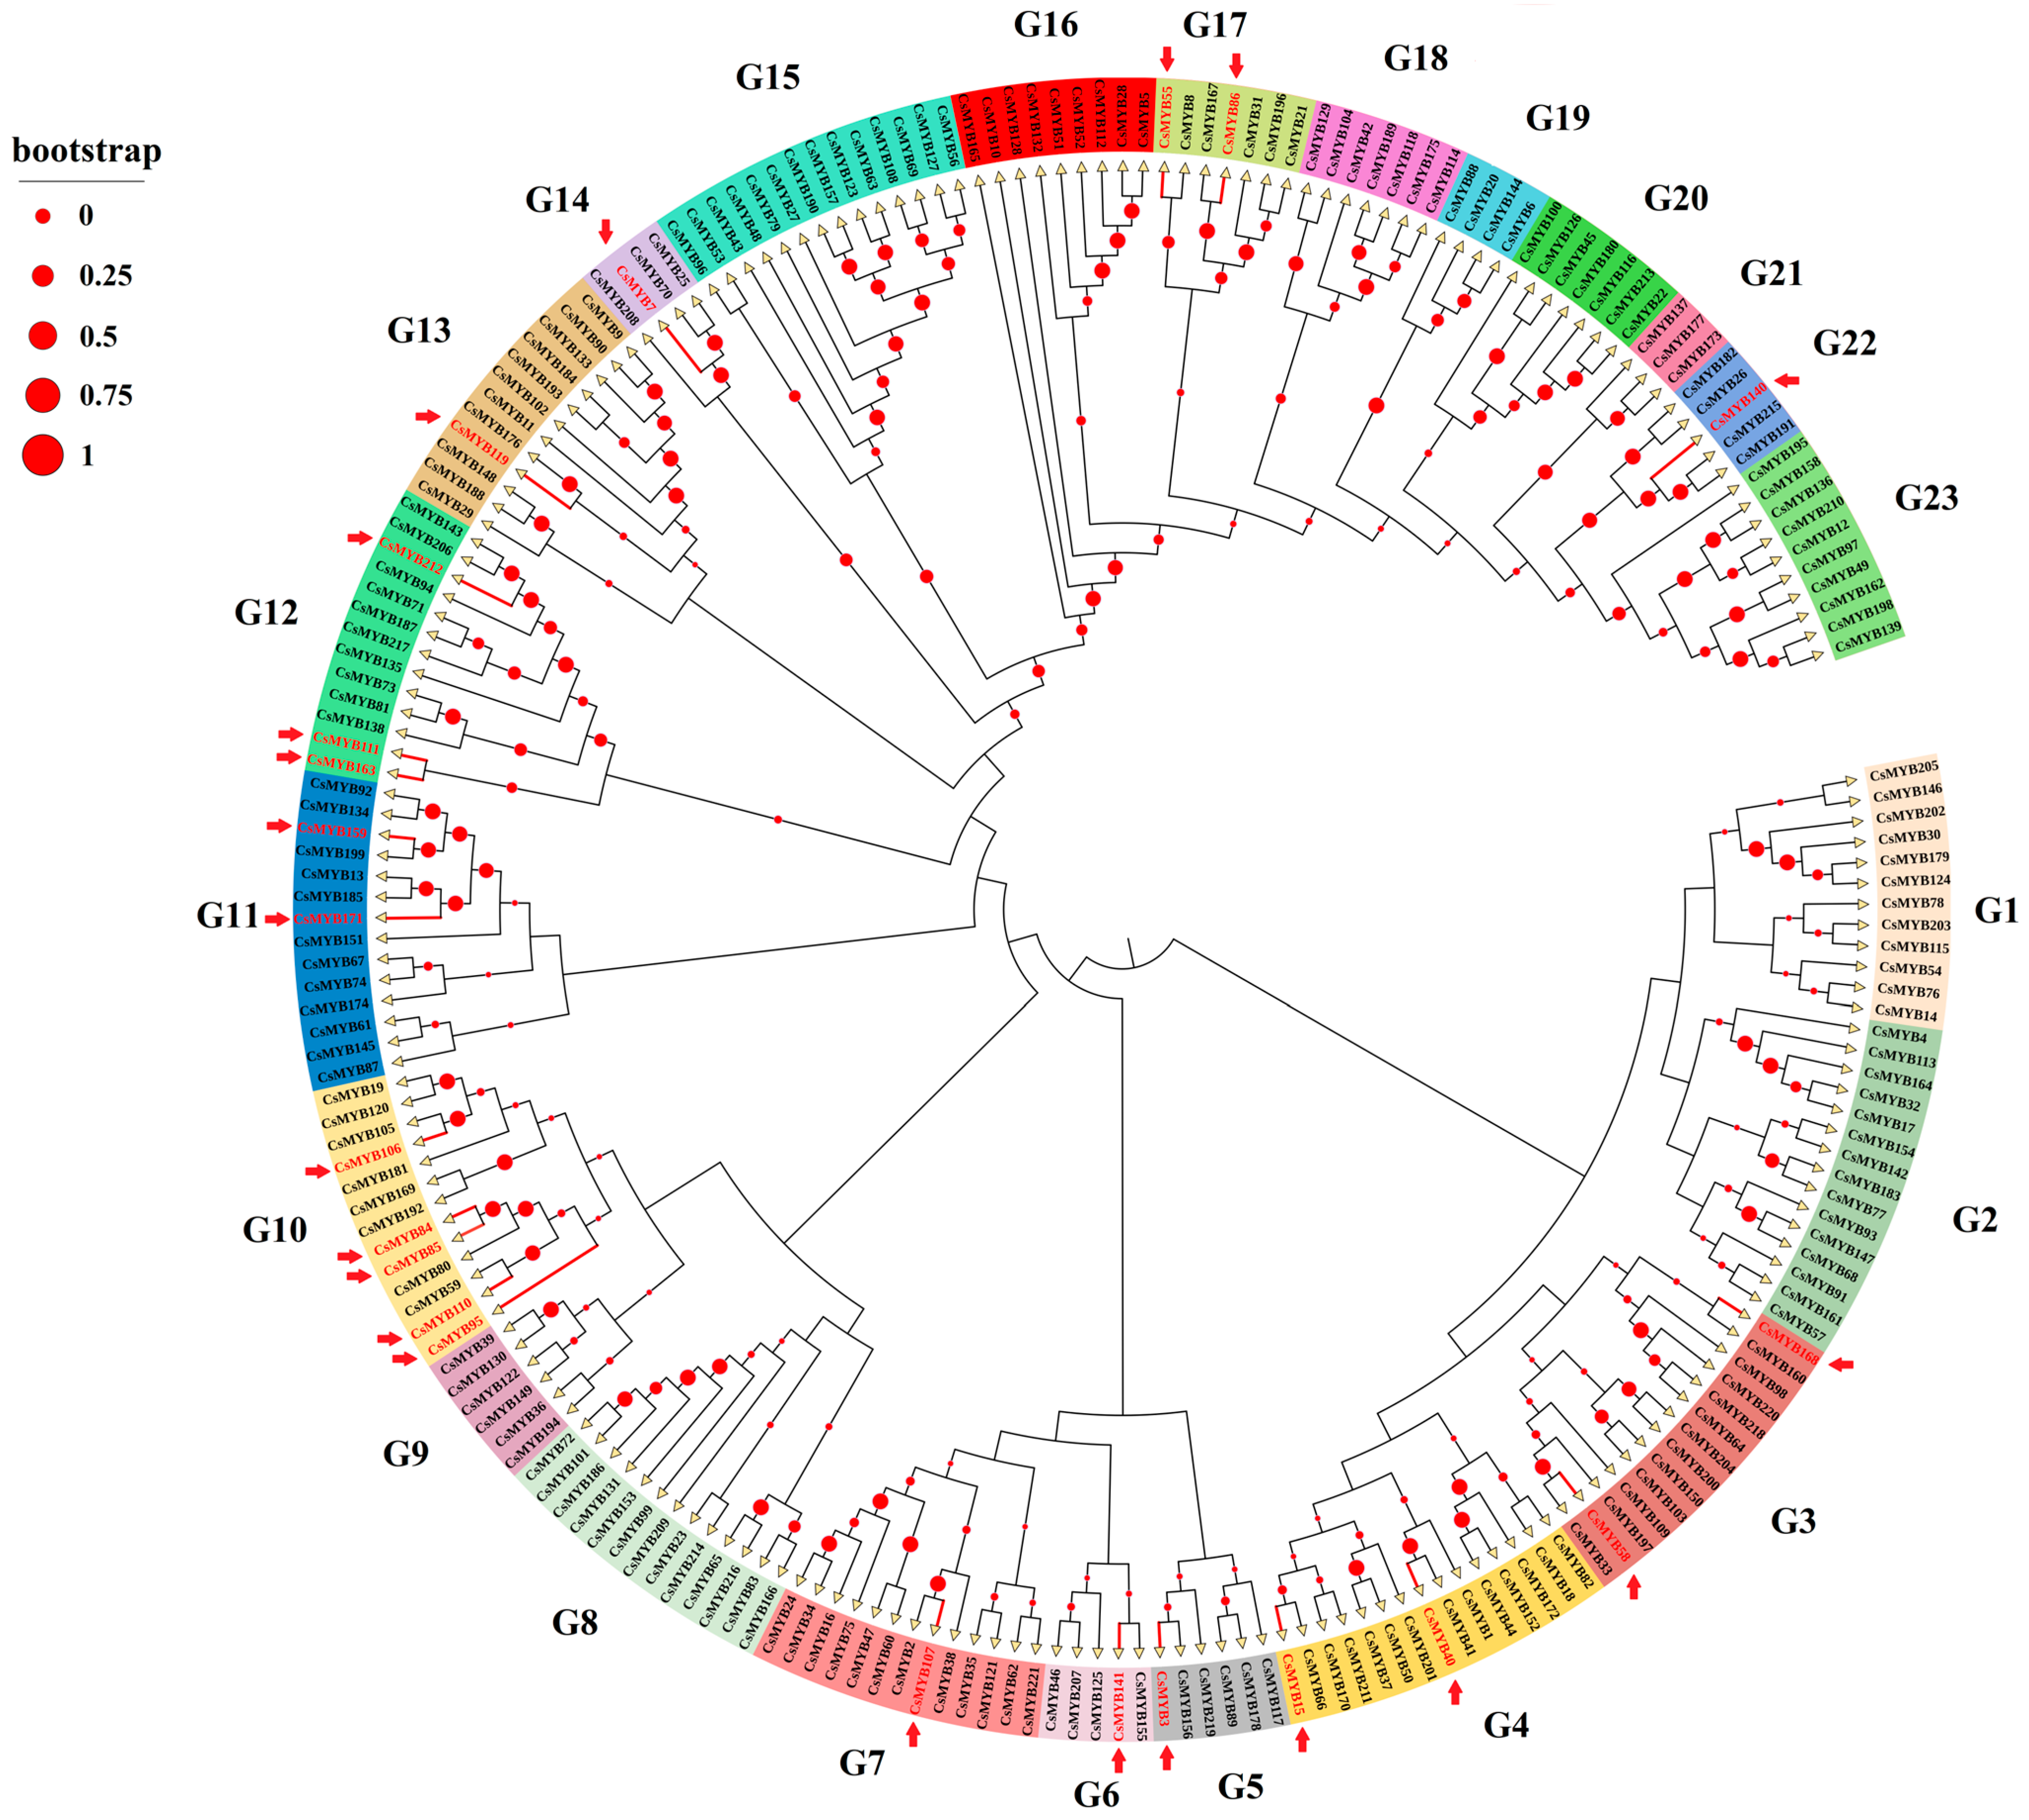
A total of 222 MYB transcription factors were retrieved from the TPIA database. Multiple sequence alignment was performed on those, and an NJ phylogenetic tree was generated based on the alignment results (Figure 7). The results showed that tea plant MYB members can be divided into 23 subfamilies, named Groups 1 to 23. The 22 selected DETs encoding MYB and MYB-related transcription factors related to the circadian rhythm of tea plants were distributed among the different subfamilies. The numbers of DET MYB transcription factors belonging to the G10, G11 and G12 groups were higher than those in the other groups. Among them, the G10 group had the highest number of transcripts (a total of five) associated with the circadian rhythm. In the G1, G2, G8, G9, G15, G16, G18, G19, G20, G21 and G23 groups, no member was associated with the circadian rhythm.

2.9. Expression Analysis of MYB Transcription Factors in the Circadian Rhythm of Tea Plants

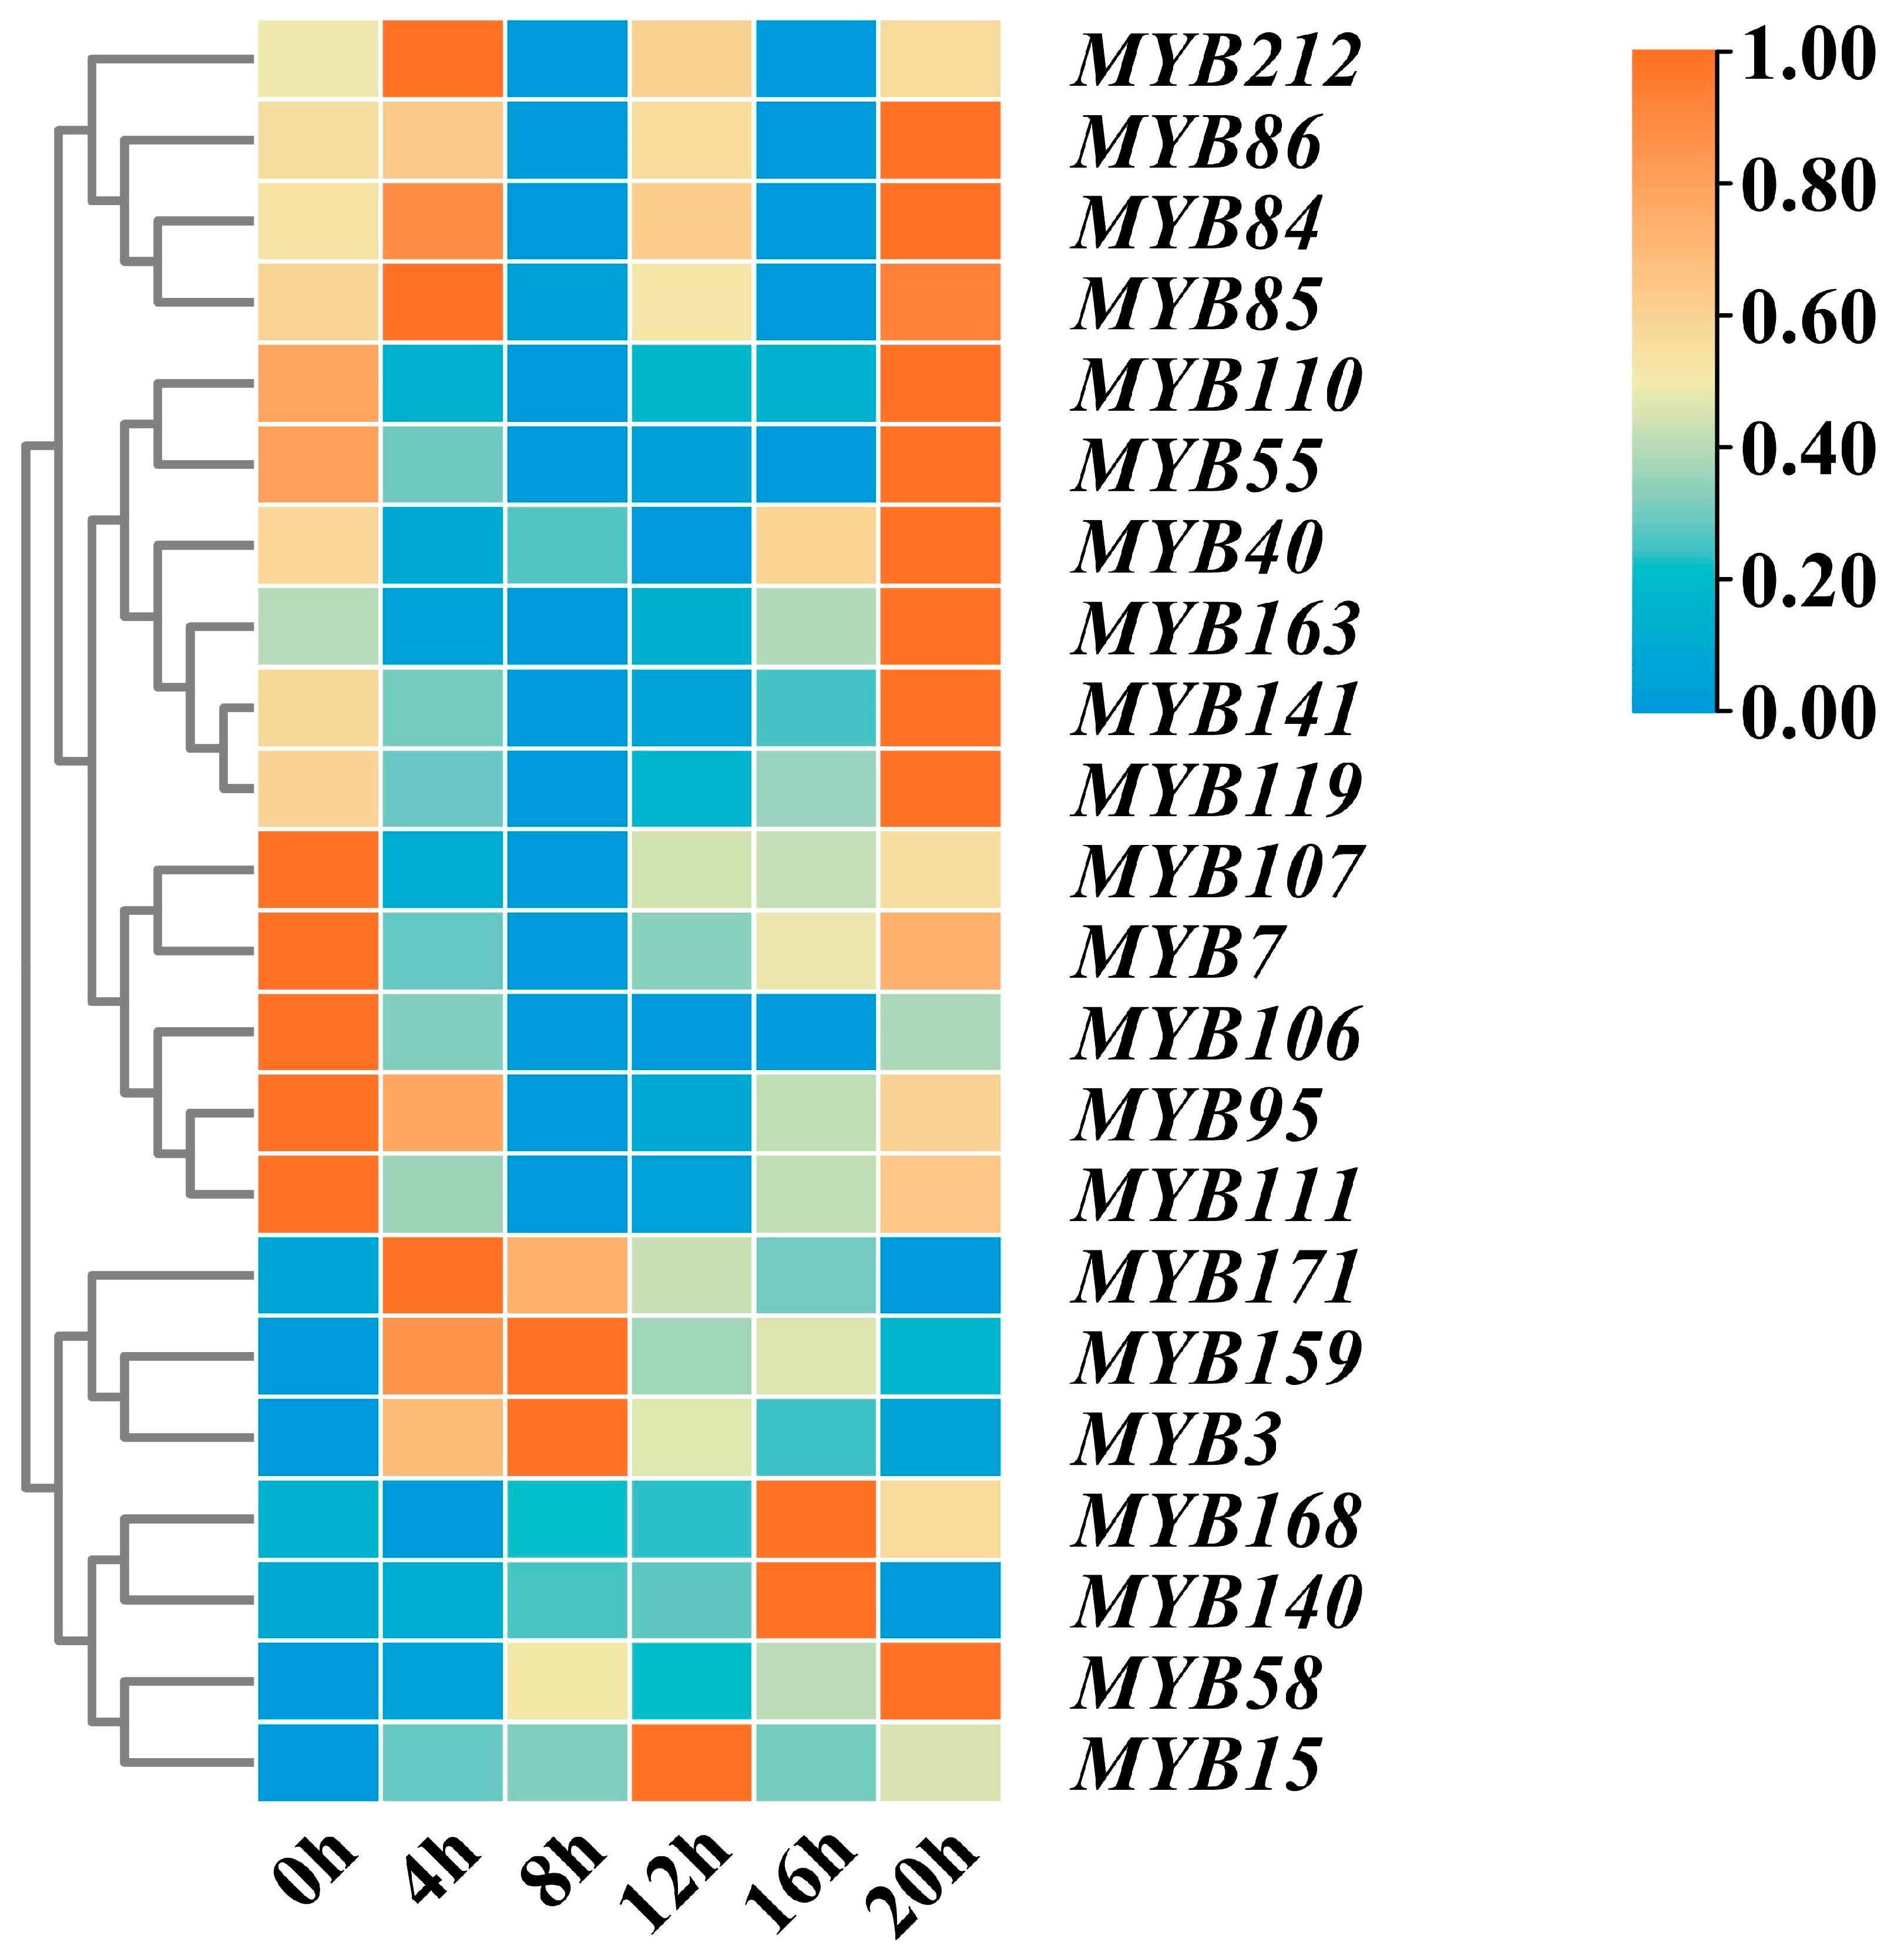
In studying the expression patterns of the 22 MYB transcription factors in the circadian rhythm of tea plants, heatmap analysis showed the expression levels of the gene transcripts within a photoperiod (Figure 8). The heatmap showed that the expression levels of MYB3, MYB159 and MYB171 were high during the day and low at night, and the process from 0 h treatment showed an obvious rise to fall. The expression levels of MYB15, MYB58, MYB140 and MYB168 were high at night and low during the day, showing a process of decline to rise. The expression levels of MYB84, MYB85, MYB86 and MYB212 were the highest at 0 h and then began to decline, rise again, fall again and rise again at night, then reached a peak, showing a zigzag pattern. The expression levels of MYB7, MYB95, MYB106 and MYB107 were the highest at 0 h, then began to decline and then began to increase after 20 h treatment. The daytime period is 0 h–12 h (9:00–21:00) on the horizontal coordinate, and the nighttime period is 12 h–20 h (21:00–5:00) on the horizontal coordinate.
The 22 MYB gene transcripts showed differential responses in terms of tea plant circadian rhythm based on the results of the RPKM method (Table S3). The expression levels of MYB3, MYB7, MYB15, MYB40, MYB55, MYB58, MYB84, MYB85, MYB86, MYB95 (RVE8), MYB106 (LHY), MYB107, MYB110, MYB111, MYB119, MYB140, MYB141, MYB159, MYB163 (RVE1), MYB168, MYB171 and MYB212 were measured and analyzed using RT-qPCR. The results showed that the gene expression profiles of the 22 MYB transcription factors can be divided into four patterns according to photoperiod: low expression level in a photoperiod, high expression level during the day and low expression level at night, low expression level during the day and high expression level at night, and irregularity. In general, the expression levels of the 22 DETs encoding MYB transcription factors in the tea plant circadian rhythm were consistent with the trend of the transcriptome sequencing results.

2.10. The Expression Profiles of the MYB Gene Transcripts

2.10.1. High Expression Level in the Day and Low Expression Level at Night

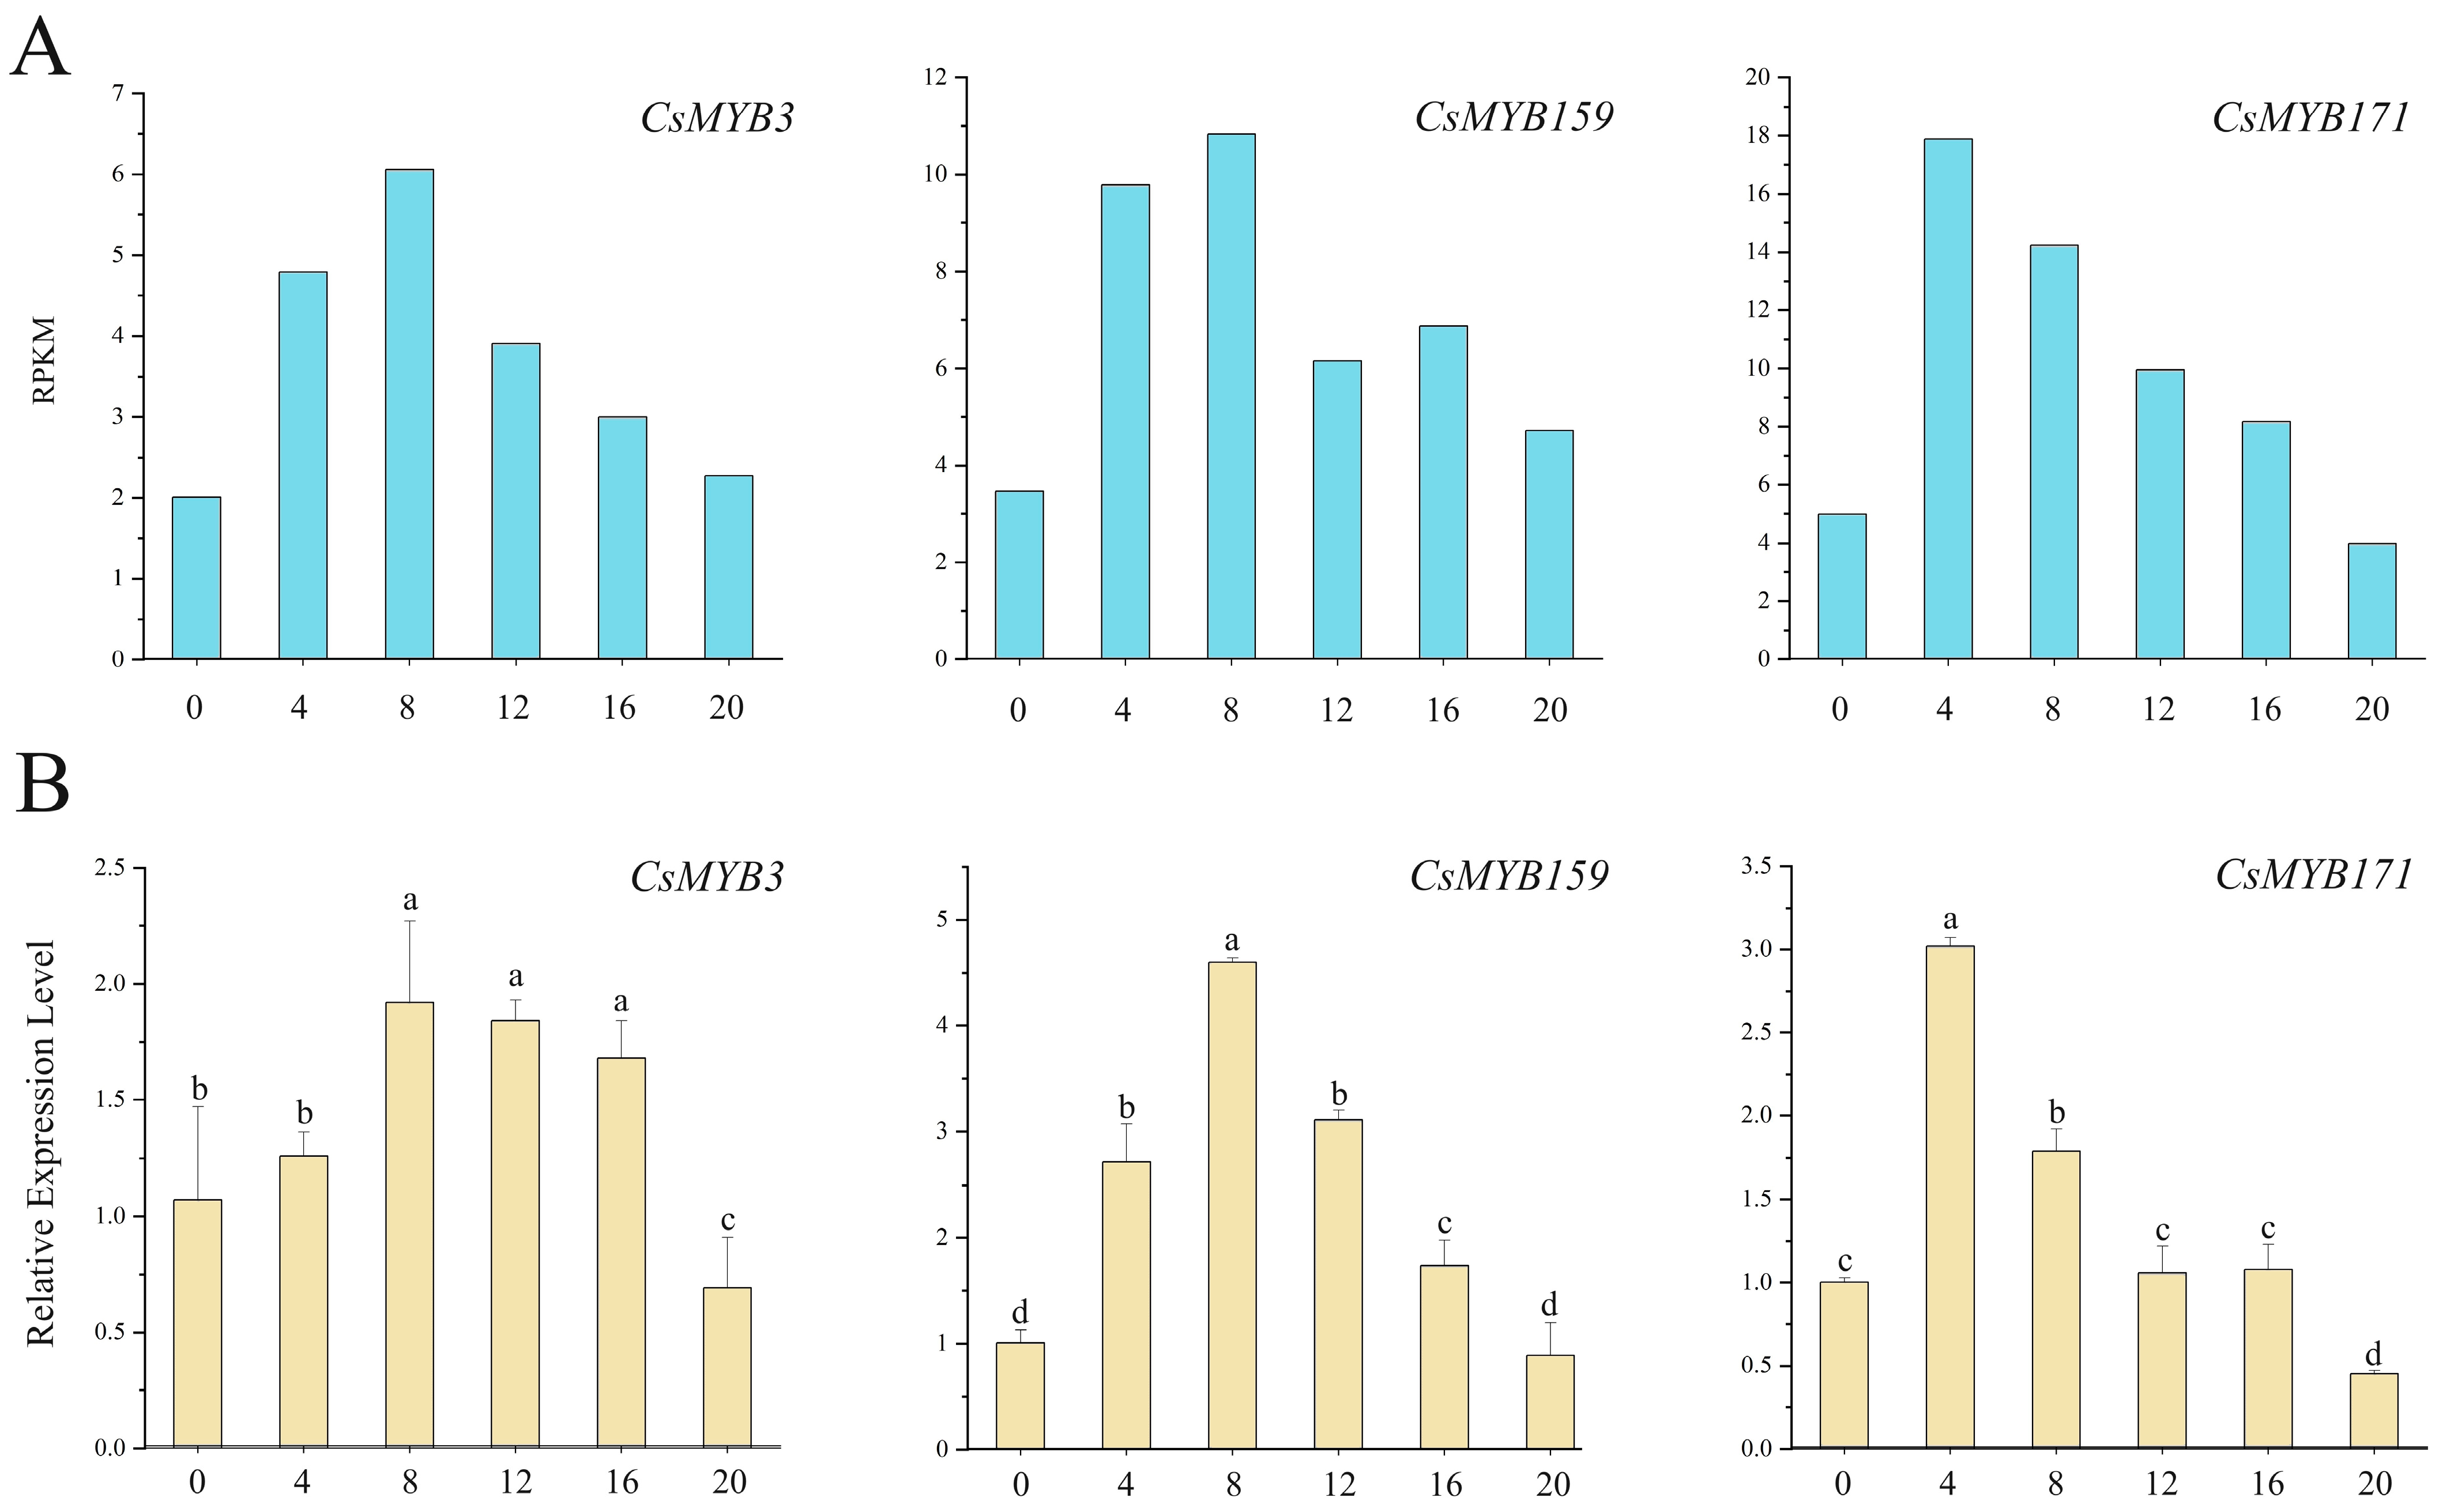
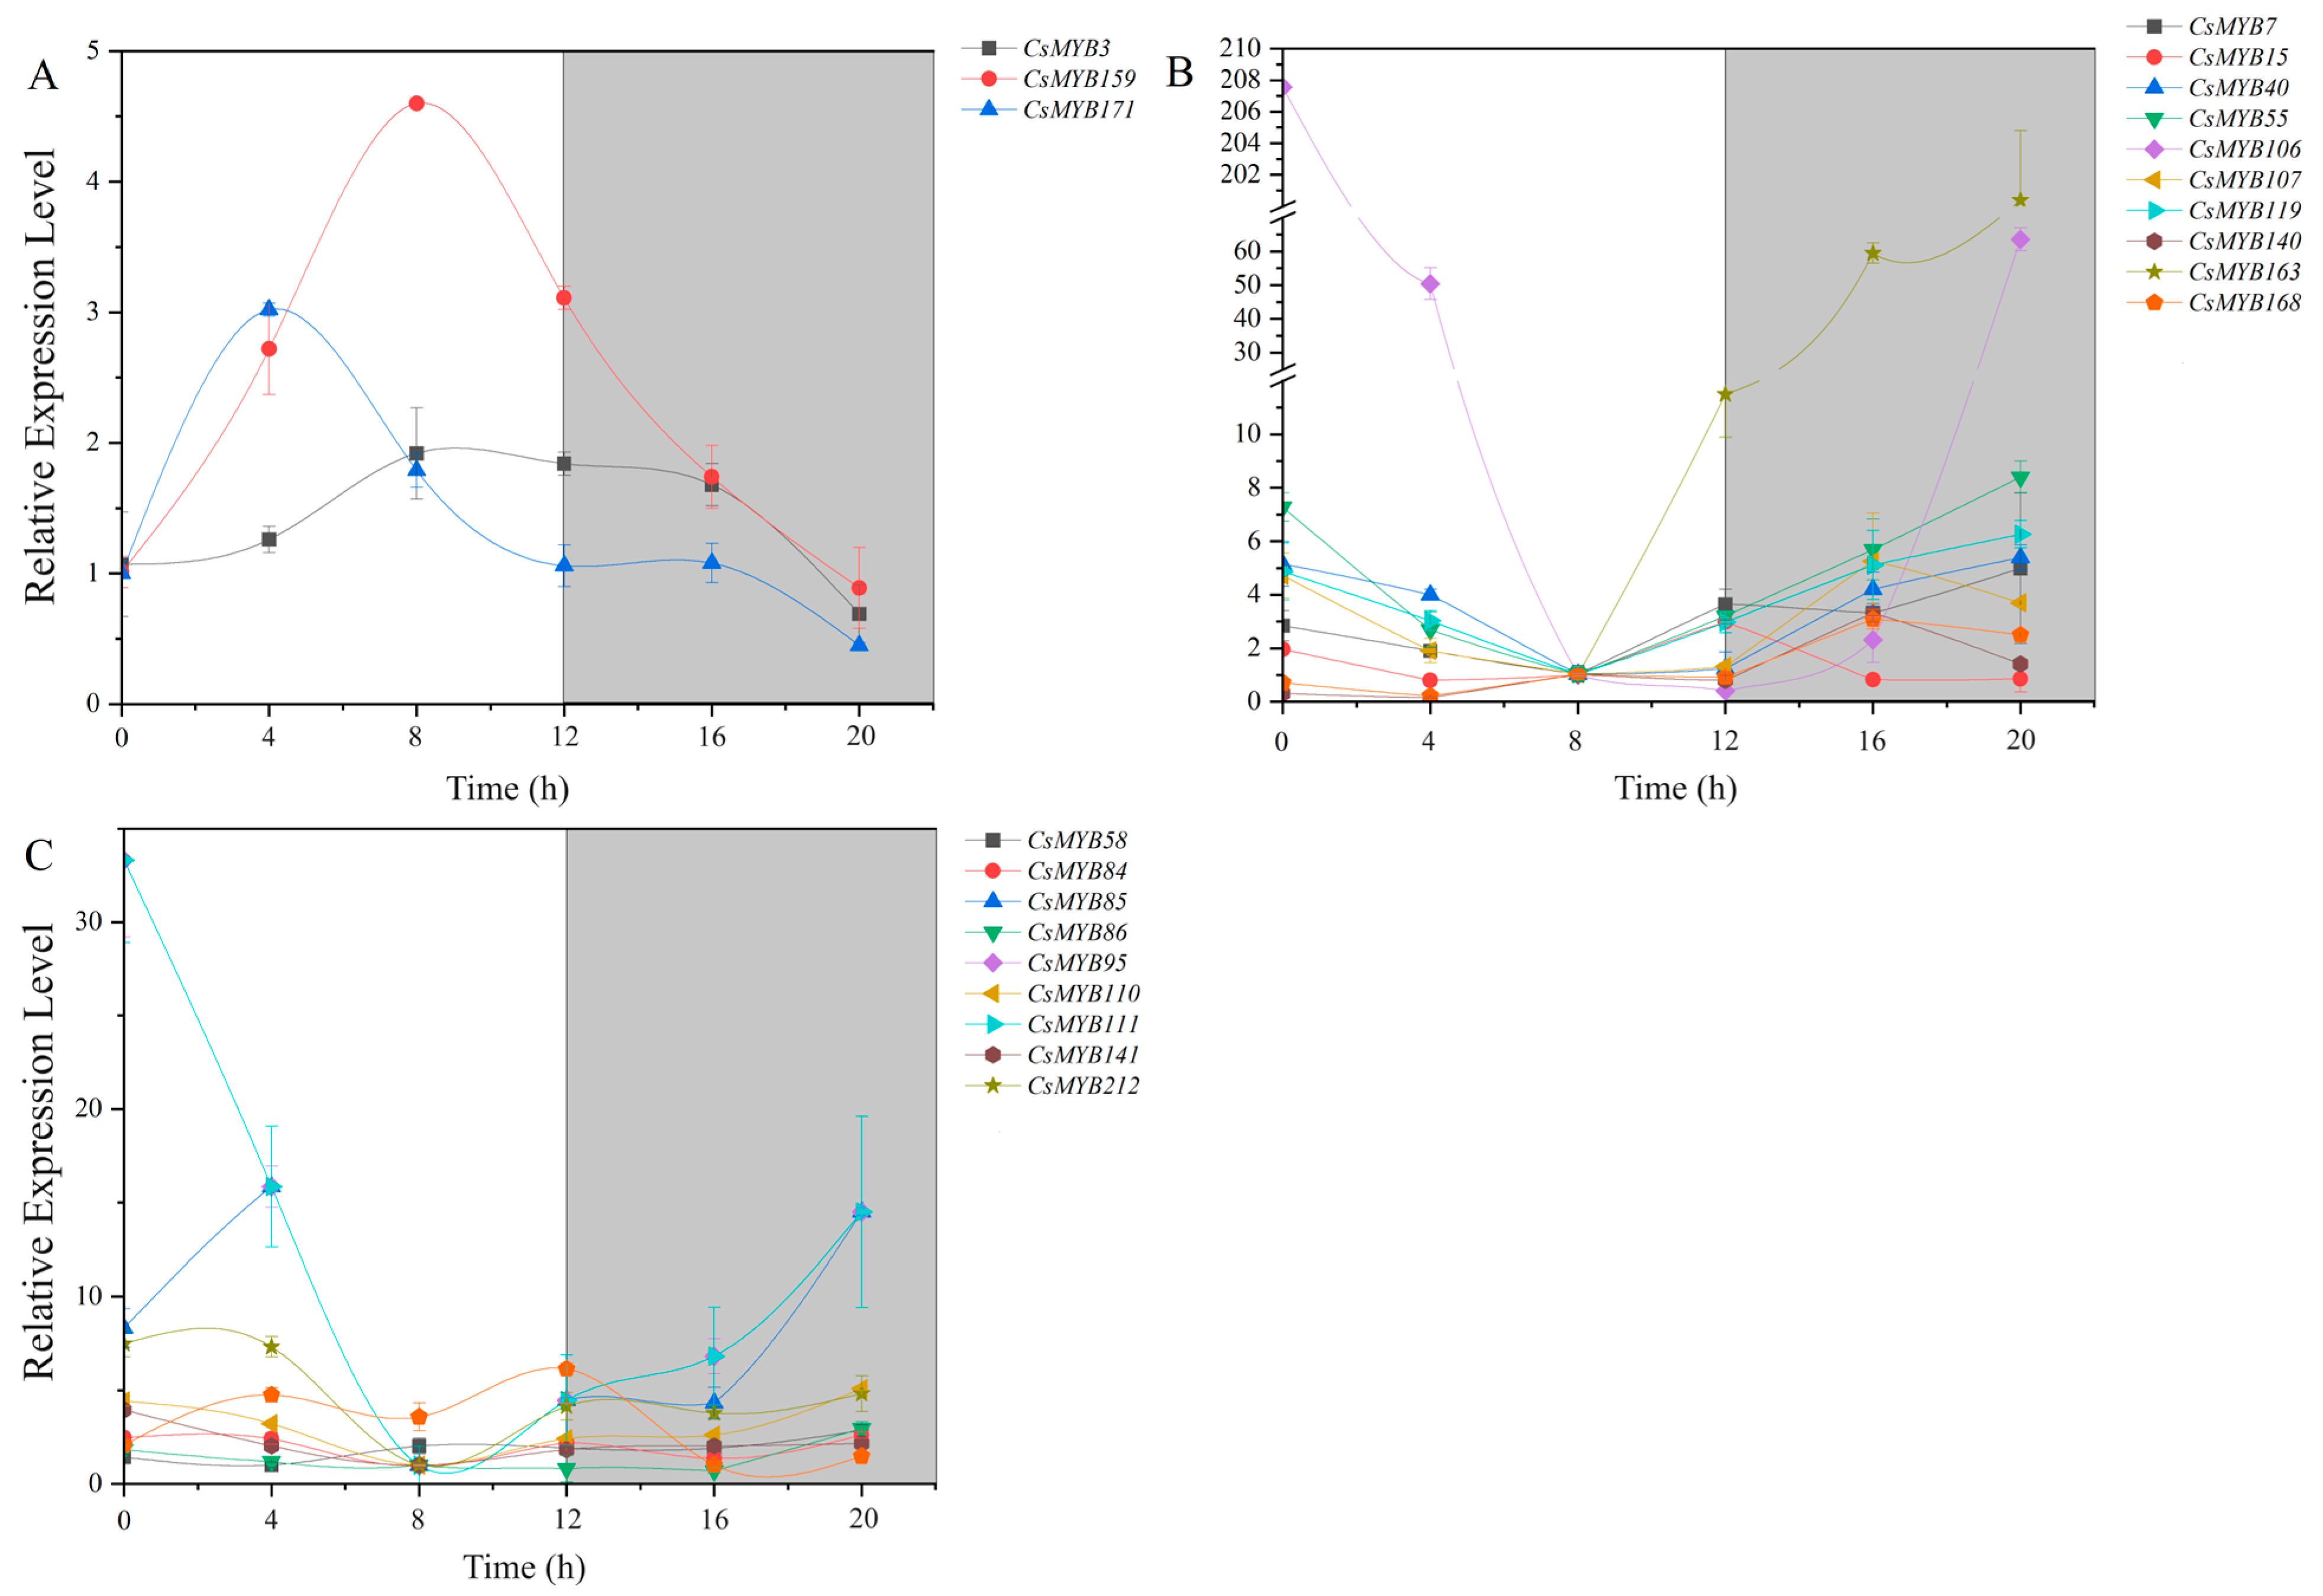
When studying the RPKM (Figure 9A) and quantitative RT-PCR (Figure 9B) results, it was found that the expression levels of MYB3, MYB159 and MYB171 gene transcripts were high in the day and low at night. The MYB3 and MYB159 gene transcripts reached a peak value at 8 h and the lowest value at 20 h. The expression levels of MYB3 and MYB159 at the peak value were 2.78 and 5.17 times higher than that of the lowest value, respectively. The MYB171 transcript reached its peak value at 4 h and reached its lowest value at 20 h, which was 6.71 times higher. The expression level of MYB171 at the peak value was 6.71 times higher than that at the lowest value. The transcript levels of MYB3, MYB159 and MYB171 first increased and then decreased, which had a certain regularity (Figure 10A).

2.10.2. Low Expression Level in the Day and High Expression Level at Night

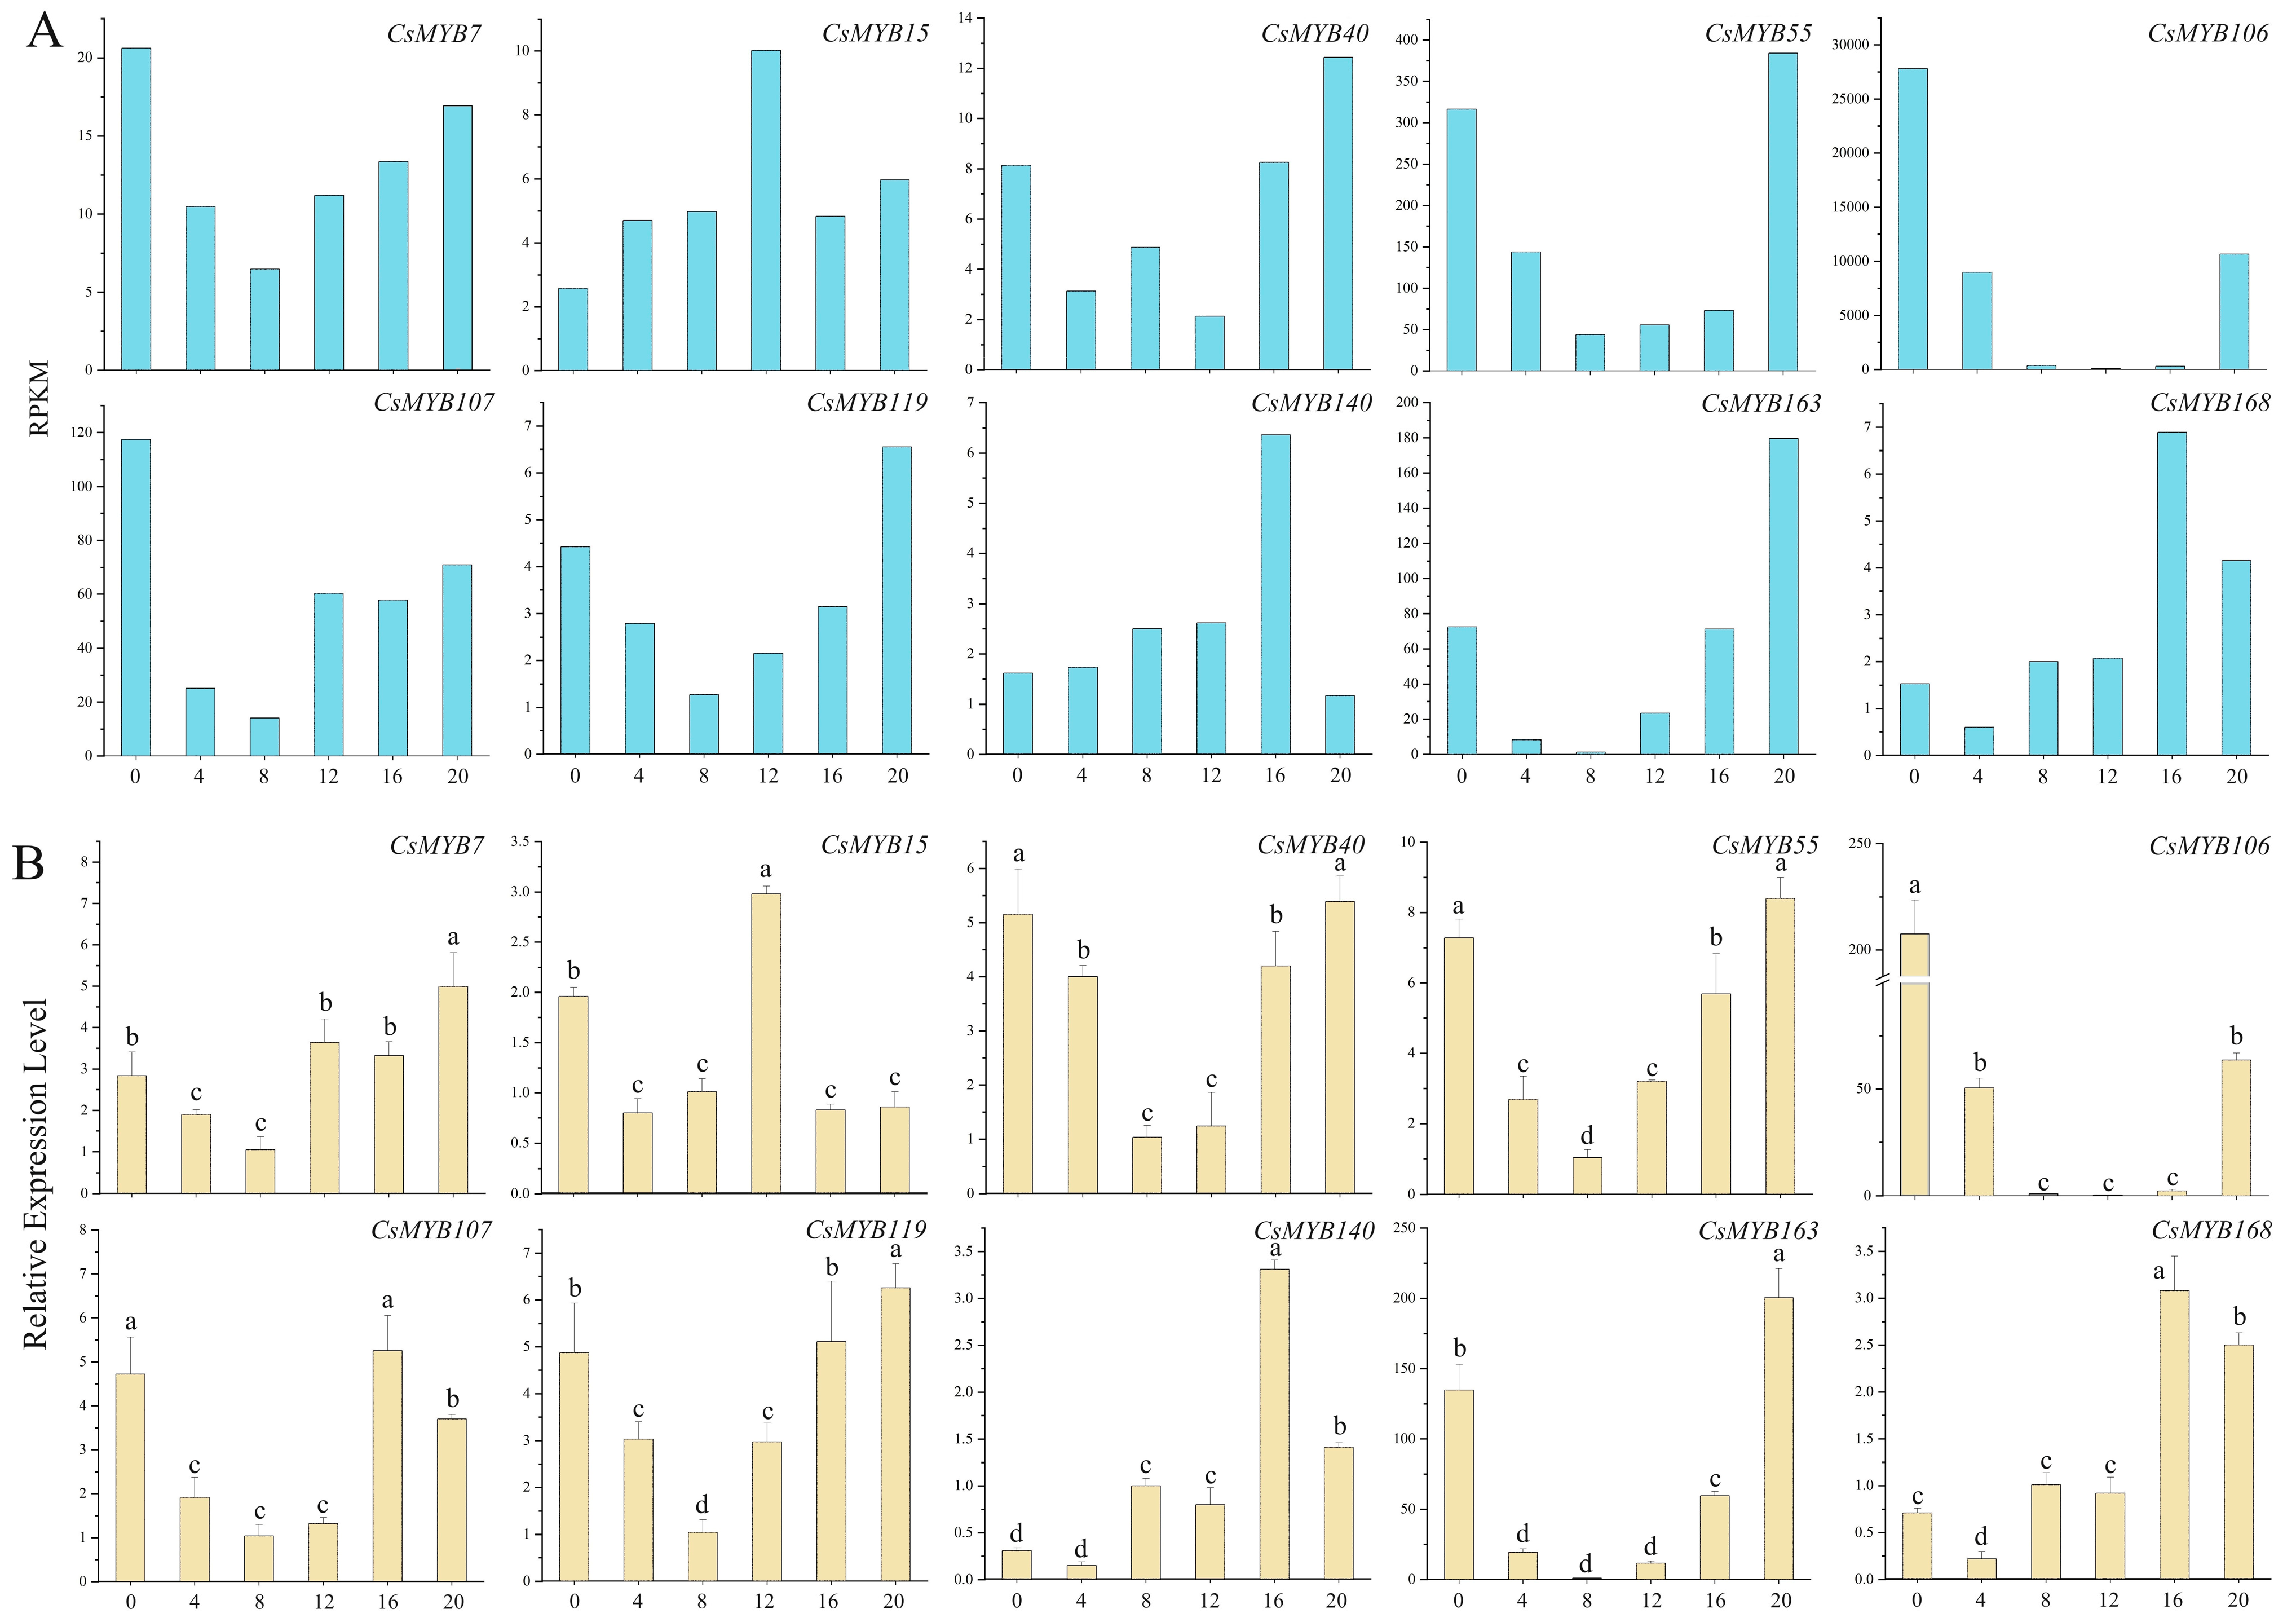
The expression levels of MYB7, MYB15, MYB40, MYB55, MYB106 (LHY), MYB107, MYB119, MYB140, MYB163 (RVE1) and MYB168 were high at night and low in the day based on the results of the RPKM method (Figure 11A). MYB106 (LHY) and MYB163 (RVE1) are the core genes of the circadian rhythm. The expression level of the LHY transcript was the highest at 0 h and 20 h, when the expression level was up to 207.57 and 63.57 times that at 8 h, respectively. The expression level of the RVE1 transcript increased gradually from 12 h to 20 h, while the expression level was low during the day. The expression level of the RVE1 transcript decreased gradually from 0 h to 8 h. The peak expression levels were more than 200 times higher than the trough levels (Figure 11B). The expression levels of these MYB gene transcripts showed a trend of first decreasing and then increasing (Figure 10B).

2.10.3. The Expression Level Irregularity and Little Change

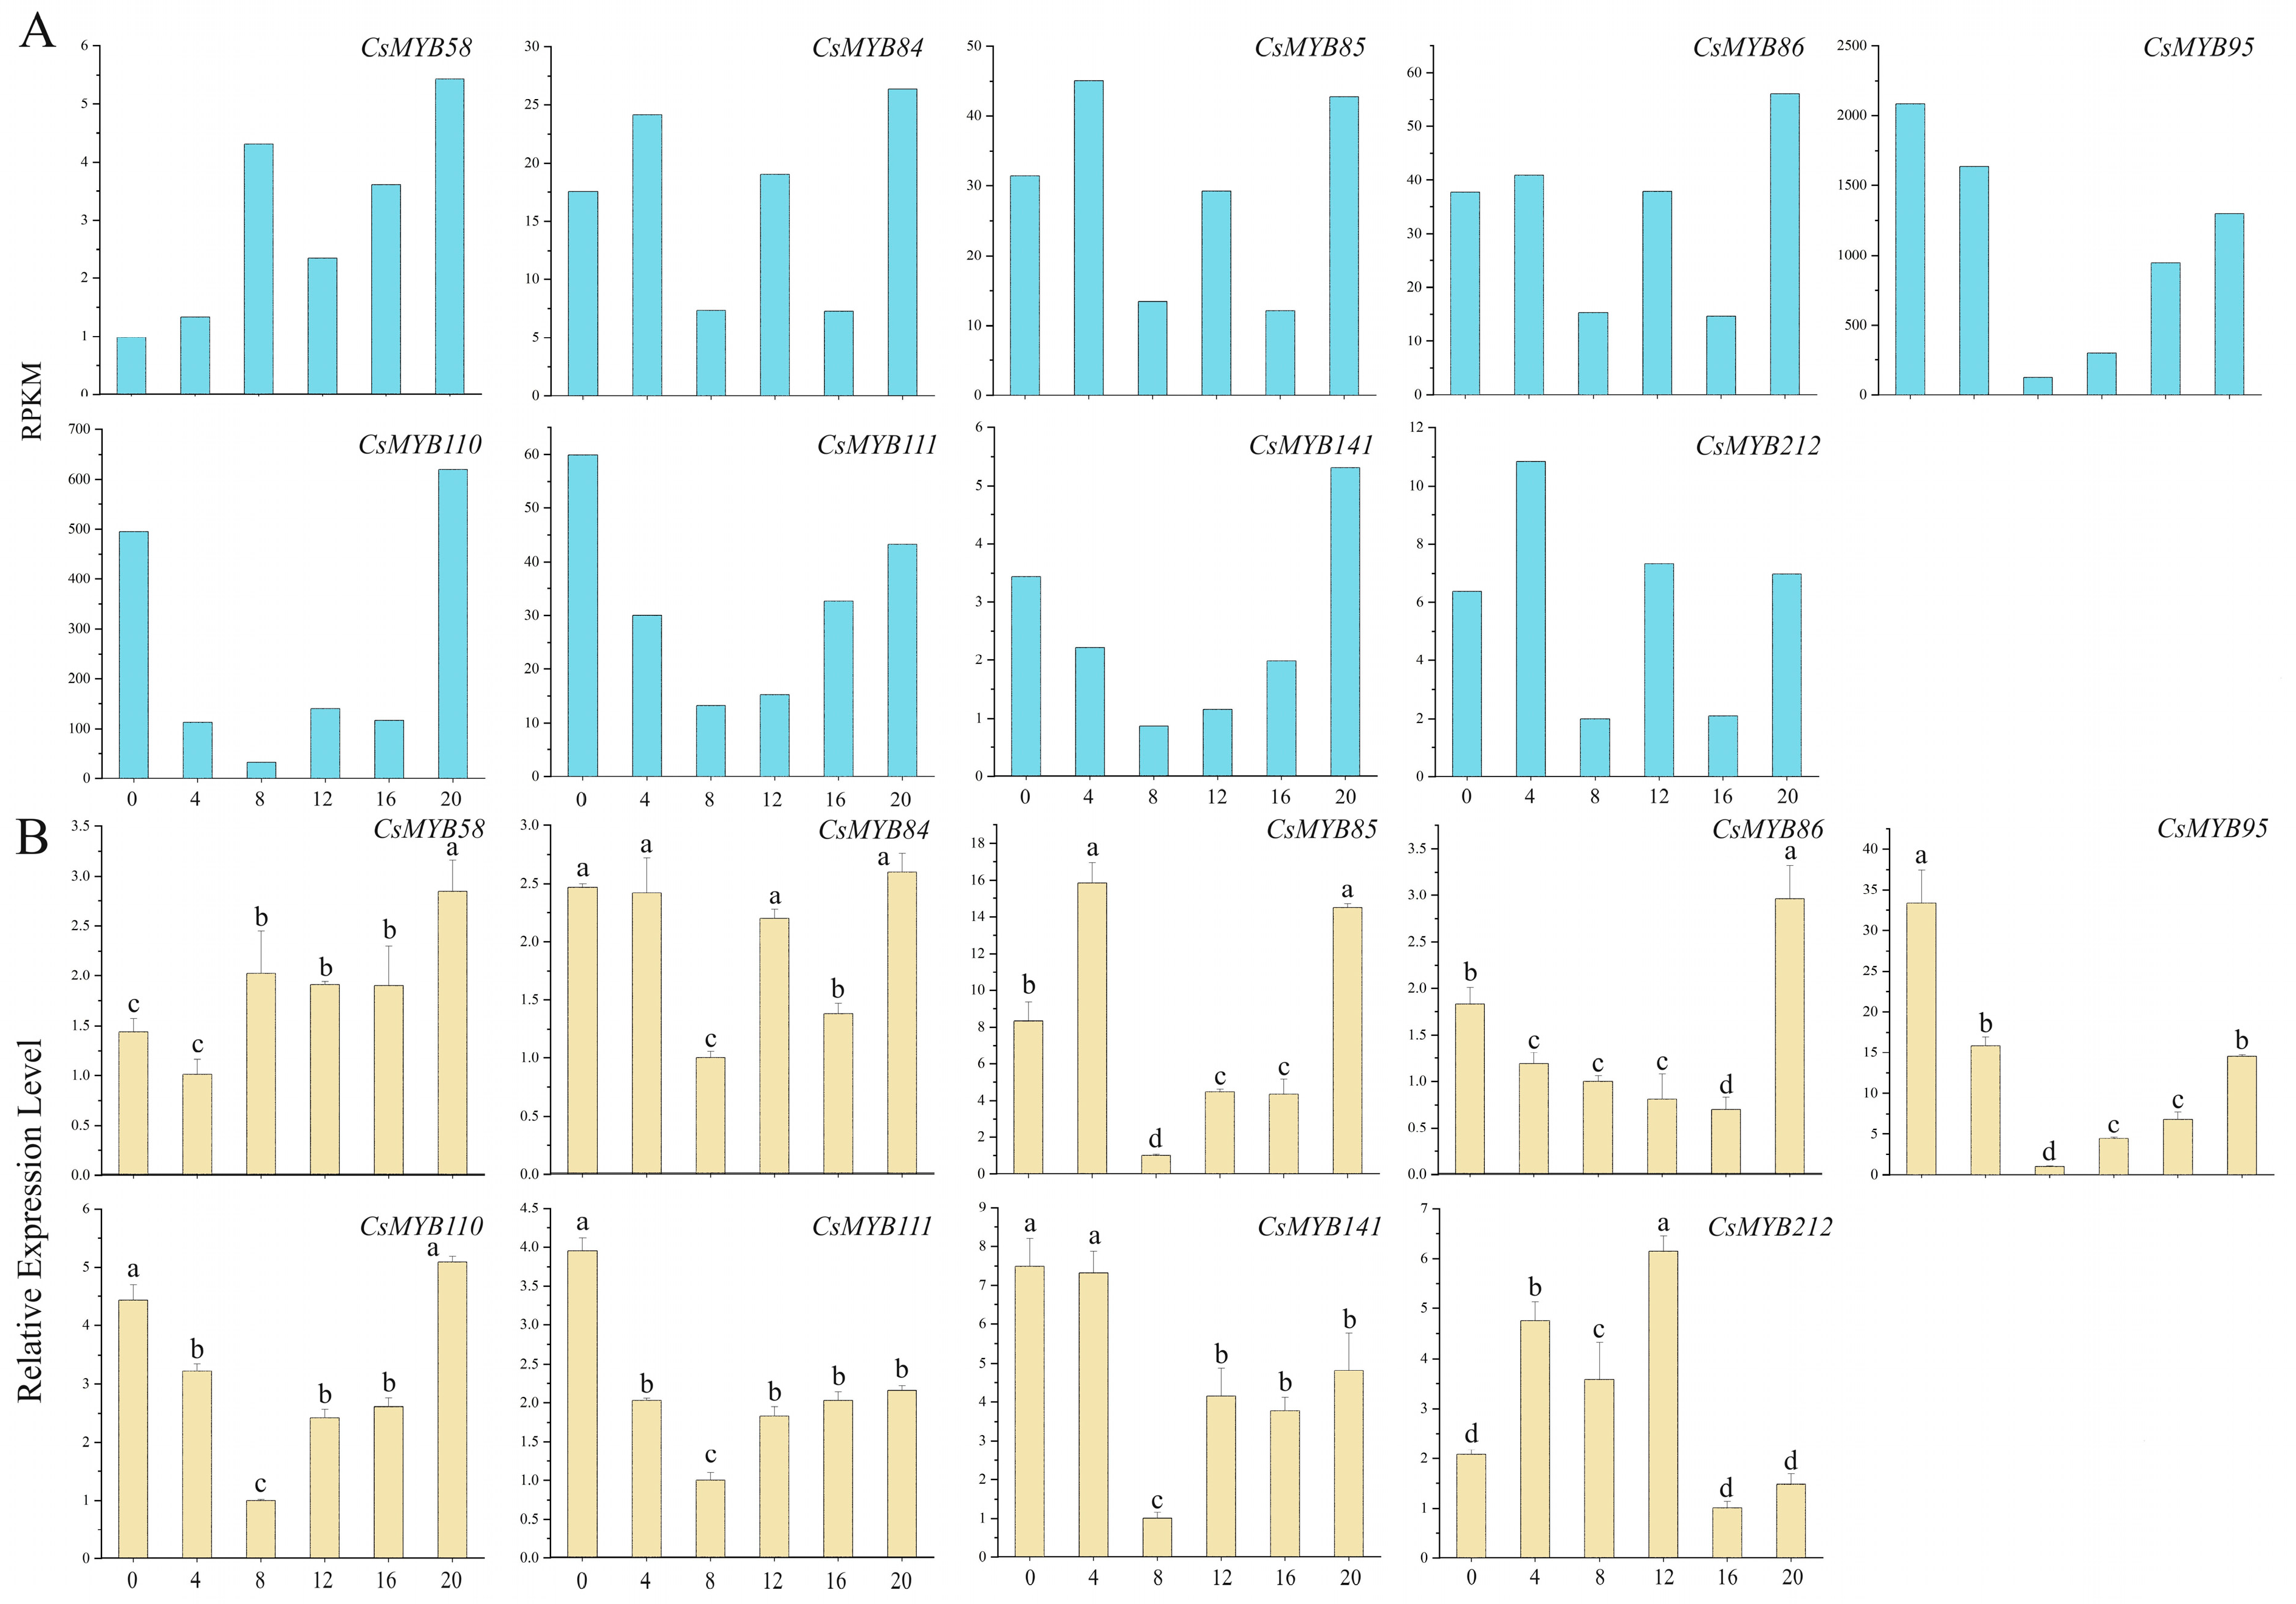
A total of 222 MYB transcription factor transcripts were found in the tea plant database. Through transcriptome identification and screening, it was estimated that the expression levels of the other 200 MYB gene transcripts showed little change during the photoperiod (24 h) (Figure 10C). The genes of MYB84, MYB85, MYB86 and MYB141 were highly expressed during both the day and night (Figure 12A,B).

3. Discussion

Tea plants are typically woody crops with rich genetic diversity during long-term natural growth [57]. In tea plants, the accumulation of secondary metabolites is inconsistent during the day and night and is affected by various factors, including the circadian rhythm [58]. At present, research on the circadian rhythm is mainly concentrated on Arabidopsis model plants, which are also the most in-depth plants in terms of photoperiod regulatory mechanisms [5,6]. Research of the circadian rhythm of horticultural plants has just started, mainly involving tomatoes [6], garlic [59], cabbage [60], etc.
At present, 58 transcription factor families have been identified in plants, among which AP2/ERF, MYB, GRAS, WRKY and NAC are the transcription factor families studied in-depth [61,62]. The MYB family of genes exhibits differential expression patterns in plant tissues and performs specific physiological regulatory functions [63]. The MYB family is one of the largest families of transcription factors in plants and plays a crucial role in the regulation of plant biochemical and physiological processes. Syntenic analysis demonstrated that tandem duplication contributed to its evolution. It has also been shown that the main drivers of peanut R2R3-MYB gene amplification are polyploidy and tandem and single repetition [64,65]. Chen et al. identified a total of 122 CsR2R3-MYB genes based on the chromosome-level genome of tea plants. CsMYB12, CsMYB17, CsMYB25 and CsMYB47 genes exhibited high expression in the tea plant leaves under PEG stress, but low expression under cold stress. At the same time, they found that CsMYB17 enhanced anthocyanin accumulation in tea plants [43]. CsMYB42 played a crucial role in activating the expression of CsGS1c and might be involved in the biosynthesis of theanine in albino tea leaves [66]. Li et al. predicted that CsMYB8 and CsMYB99 were involved in the biosynthesis of flavonoids (including catechins, anthocyanins and flavanols), while CsMYB9 and CsMYB49 were associated with theanine synthesis, as well as the MYB TFs that were likely involved in hormone-signaling-mediated environmental stress and defense responses [58]. A total of 222 transcripts of the MYB transcription factor are found in tea plants [57]. MYB transcription factors also play key roles in the regulation of the growth and development of tea plants [16]. In this study, information about MYB transcription factors was based on data provided by Li et al. [58]. According to the TPIA database, MYB transcription factors were systematically named CsMYB1–CsMYB221. The corresponding MYB transcription factor names were obtained through BLAST comparison (Table S4). RT-qPCR primers were designed using Primer Premier 6.0 software.
Nearly one-third of Arabidopsis genes are regulated by the circadian rhythm, with their expression peaking at different times of the photoperiod [67,68]. In plants, the proteins encoded by CCA1 and LHY are important components in maintaining the diurnal cycle in the central oscillator of the biological clock system of higher plants and regulating the circadian rhythm [30,34]. The LCL5 (RVE8) and CCA1 gene sequences were homologous. However, these two transcription factors have opposite regulatory effects on the circadian rhythm expression of the Arabidopsis TOC1 gene [69]. CCA1 and its closely related homolog LHY encode a single MYB transcription factor that regulates the circadian rhythm of genes expressed in the morning and evening. The morning cycle is composed of CCA1, LHY, PRR7 (PSEUDO-RESPONSE REGULATOR 7) and PRR9 (PSEUDO-RESPONSE REGULATOR 9), in which CCA1 and LHY can promote the transcription and expression of PRR7 and PRR9. However, PRR7 and PRR9 can reverse the inhibition of CCA1 and LHY [70]. The abundance of CCA1 and LHY mRNA transcripts oscillates rhythmically, with peak expression at dawn and trough expression at dusk [71,72]. Similar to the expression patterns of CCA1 and LHY, the expression of RVE1, RVE2 and RVE7 is clock-regulated, with peak transcriptional abundance near subjective dawn, suggesting that these genes may play an important role in clock regulation during the morning phase [73], which is also consistent with the results of this study. In addition, CCA1 and LHY play crucial roles in flowering. Flowering marks the transition from vegetative to reproductive growth, and proper flowering timing is critical for reproduction [74]. CCA1 and LHY participate in the regulation of photoperiodic flowering by regulating the GI-CO-FT pathway [75].
The MYB transcription factor is closely related to the circadian rhythm. By screening the DETs with transcription factor annotation information, a total of 22 MYB and MYB-related transcription factors related to the circadian rhythm of tea plants were obtained, including the typical circadian rhythm genes LHY (MYB106), RVE1 (MYB163) and RVE8 (MYB95). REVEILLE1 (RVE1), which is homologous to LHY and CCA1, is an MYB-like transcription factor. Another member of the RVE family, RVE8, is an MYB transcription factor. RVE8 interacts with the transcriptional coactivators LNK1 and LNK2 to promote the expression of night clock genes [36]. RVE1 regulates auxin biosynthetic genes to connect the circadian clock and auxin pathways [35]. RVE8 regulates anthocyanin biosynthesis by promoting the expression of anthocyanin genes [76]. GmMYB133 is a soybean RVE homologous gene involved in the biosynthesis of soybean isoflavones [77]. Transient overexpression of PbRVE1b can increase the anthocyanin content in birch peels [78]. These results support the importance of the RVE protein in plant development. All PbRVE genes in Pyrus bretschneideri leaves under a light/dark cycle exhibited a circadian rhythm. The four PbRVE genes also exhibited robust rhythms under constant light conditions [79]. In plants, Arabidopsis and Oenanthe javanica grow under various photoperiodic conditions, and the expression of the clock gene Lhcb always decreases from peak levels before dusk and increases from trough levels before dawn. This also suggests that the significance of circadian clock adaptation may be partly due to its regulation of light responses to photosynthesis and photoprotection mechanisms [80,81,82]. The circadian oscillator may contain multiple circuits that mediate positive and negative feedback, respectively. Interlocked feedback loops have been described in the circadian rhythm in Drosophila, tomatoes, fungi, etc. [7,83,84].
PbRVE expression patterns differed in different tissues of P. bretschneideri, suggesting that PbRVEs may have a potential function in plant development. PbLHY and PbRVE8 are highly expressed in leaves, which is consistent with the previously reported cognates of poplar [85] and rice [86]. In addition, transcripts of RVE genes, such as PbRVE3b and PbREVE6b, show higher levels in the root of P. bretschneideri. Recently, transcriptome analysis of walnuts and alfalfa revealed that RVE genes may be involved in nitrogen metabolic pathways.
We measured expression patterns in different tissues of tea plants and further explored the function of MYB transcription factors in the following directions. Since the circadian rhythm in tea plants has not yet been reported, we are still in the preliminary stage of research. Changing the circadian rhythm of the tea plants and determining whether the growth state of the tea plant can be changed is also a good research direction.

4. Materials and Methods

4.1. Plant Materials

Cutting seedlings of two-year-old ‘Baiyeyihao’ (C. sinensis cv. Baiyeyihao) were planted in the growth chamber at the Tea Science Research Institute of Nanjing Agricultural University (Nanjing, China, 188.84° E, 32.04° N). Tea seedlings were planted in sandy loam with good drainage, an organic matter content over 1–2% and a pH value of 6.0. Tea seedlings with healthy growth were selected and cultured in a light incubator (temperature 25 ± 2 °C, photocycle 12 h light/12 h dark, light intensity 240 μmol·m−2·s−1, humidity 70 ± 10%) for one week. Plants were adjusted daily to ensure well-rounded lighting and watered daily early and late in the day. According to literature reports, the circadian rhythm time scheme was experimentally assessed with 4 h intervals [87]. A photocycle of 12 h/12 h is the normal growth time of the plant. Therefore, in order to better understand the influence of the circadian rhythm on the tea plants, we divided 24 h into 6 segments. At 9:00, the illumination began (the initial time was denoted as 0 h) and the first sample was taken. Then, healthy tea seedlings were selected at 4, 8, 12, 16 and 20 h, respectively. Horizontal coordinates 0 h, 4 h and 8 h belonged to the daytime period (9:00~17:00), while 12 h, 16 h and 20 h belonged to the night period (21:00~5:00). An individual sample containing one bud and two leaves was picked from one tea plant, quickly frozen with liquid nitrogen and stored at −80 °C. Three biological replicates were performed for each sample.

4.2. RNA Extraction

Extraction of total RNA from tea leaves was performed using a reference RNA extraction kit (RNA simple total RNA Kit, Beijing Tiangen Company, Beijing, China). The concentration of RNA samples was determined using micro ultraviolet detector Nanodrop ND-1000 (Shanghai Spectrometer, Shanghai, China). The RNA quality was detected via 1.2% agarose gel electrophoresis.

4.3. cDNA Library Construction and High-Throughput Sequencing

Six groups of RNA samples were sent to Bena Technology Co., Ltd. (Wuhan, China) for construction and sequencing of the cDNA library. mRNA was enriched using oligo (dT) magnetic beads. Interrupt reagent was added to the enriched mRNA to fragment the mRNA. The interrupted mRNA was synthesized into one-strand cDNA and two-strand cDNA according to the corresponding procedure. After terminal repair, adding an A tail, adding a sequencing joint, purification, PCR amplification and product cyclization were among the steps were followed to complete the preparation of the library. We did so using the MGIEasy RNA Library Prep Kit (Huada intelligent manufacturing Technology Co., Ltd., Shenzhen, China). After qualified library detection, the high-throughput sequencing platform DNBSEQ was used for sequencing.

4.4. RNA-Seq Data and Enrichment Analysis of Differentially Expressed Transcripts

The transcription factors were predicted through the database, and the top 20 transcription factors were selected for analysis. In this study, we focused on MYB transcription factors involved in the response to the circadian rhythm. According to the transcription factor annotation results, after removing duplicate transcription factors, 22 transcripts of the MYB transcription factor were obtained. Since the original sequencing data may contain low-quality sequences, joint sequences, etc., in order to ensure the reliability of the information analysis results, the original sequencing data should be filtered to obtain clean reads. After quality control in FastQC (version: 0.11.9; Parameter: default) [88], the transcriptome samples were trimmed using Trim Galore [89]. The sequenced reads were mapped to the reference genome of tea plants using HISAT2 [90]. The reads for each gene were counted using Subread-featureCounts with default parameters [91]. The number of reads from each sample to each transcript was obtained using RSEM (RNA-Seq by Expectation Maximization) and converted using FPKM (Fragments Per Kilobase per Million bases) [92]. Paired-end reads from the same fragment were counted as one fragment to obtain the gene and transcript expression levels. Furthermore, differentially expressed gene transcripts (DETs) were identified using the edgeR package with FDR < 0.05 and |logFC| > 1.5. If the number of significantly different transcripts is too small, the screening threshold is p-value < 0.05 and |logFC| > 1.5. FDR values were used for significant difference filtering in this analysis [93]. This code is provided in Supplementary File S2.

4.5. Functional Annotation

In order to obtain comprehensive functional information of the new transcripts, the obtained Unigene sequences were BLAST analyzed against Nr, SwissProt, GO, KEGG, COG and other databases for protein functional annotation and classification of tea plant genes. KEGG annotations were associated with KEGG ORTHOLOGY and PATHWAY using KOBAS (version: 3.0). The Uniprot [52] database records the correspondence between each protein family and functional nodes in Gene Ontology [54]. This system predicts the biological functions of the protein sequence encoded by a transcript.

4.6. Differential Genes Were Verified Using qRT-PCR

Real-time quantitative PCR (qRT-PCR) was used to detect the expression levels of the 22 selected MYB gene transcripts related to the circadian rhythm in tea plants. Detection primers were designed using Primer Premier 5.0 software. The SYBR Premix Ex Taq kit (TaKaRa, Dalian, China) was used for qRT-PCR on the Bio-Rad IQ5 fluorescence quantitative PCR platform. The total RNA extracted from tea leaves was reverse-transcribed into cDNA using a reverse transcription kit (TaKaRa Biotech Co., Ltd., Dalian, China). The cDNA was diluted 18-fold with nuclease-free deionized water, and 2 μL of each sample was extracted as a template added to the reaction mixture (20 μL). Each cDNA required 1 μg of RNA. In this study, the CsGAPDH gene was selected as the internal reference gene in qRT-PCR analysis, and the amplification primers were CsGAPDH-F and CsGAPDH-R [48]. It has been reported that the stability of the GAPDH gene is high in Coffea arabica [94]. Wu et al. showed that CsGAPDH has a reasonable expression abundance (19 < Cq < 30) and can be used in the calculation of gene standardization in tea plants [48]. The cDNA of ‘Baiyeyihao’ was selected at intervals of 4 h within one photoperiod (24 h). The systems used for amplification were 20 μL: 10 μL SYBR Green I mix, 0.4 μL forward and reverse fluorescent quantitative primers, 2.0 μL cDNA, 7.2 μL ddH2O [95]. The amplification program was set at 95 °C for 5 min, denatured at 95 °C for 10 s, annealed at 54 °C for 30 s and extended at 65 °C for 15 s, for a total of 40 cycles. The final concentration of primers in the reaction mix was 0.2 μM. Three biological replicates were performed, and 2−ΔΔCT was used to calculate relative gene expression levels [96]. Primers for RT-qPCR of MYB gene transcripts and the internal reference gene are listed in Table S2.

4.7. Data Processing and Analysis

Microsoft Excel 2019 software was used for data sorting. The significance of differences was analyzed using IBM SPSS Statistics 25.0, and Origin 8.0 software was used to complete the graph production. Heat maps were perpared using TBtools software (Version: 1.045) [97].

5. Conclusions

In this study, to explore the differential response of MYB transcription factors to the circadian rhythm of tea plants, the transcriptome of the tea plant ‘Baiyeyihao’ was sequenced at intervals of 4 h within one photoperiod (24 h). Then, 22 DETs encoding MYB and MYB-related transcription factors were identified, including three core oscillator genes (LHY, RVE1 and RVE8). There are four types of circadian expression patterns of MYB transcription factors within a photoperiod in tea plants. Among them, the expression levels of the core oscillator genes LHY and RVE1 were high at night and low during the day. The regulatory mechanism of the tea plant circadian rhythm is complex and is affected by various environmental factors. This study provides potential basic data for further research on the relevant regulatory mechanism of MYB gene transcripts in response to the circadian rhythm in tea plants.

Supplementary Materials

The following supporting information can be downloaded at: https://www.mdpi.com/article/10.3390/ijms25010657/s1.

Author Contributions

Conceptualization, J.Z., Z.H. and A.X.; methodology, Z.H., N.Z. and Z.Q.; investigation, Z.H., N.Z., Z.Q., J.L., N.Y., Y.C., J.K. and W.L.; data curation, Z.H.; writing—original draft preparation, Z.H.; writing—review and editing, Z.H., J.Z. and A.X. All authors have read and agreed to the published version of the manuscript.

Funding

This research was supported by the National Natural Science Foundation of China (31870681), the Provincial Policy Guidance Program North Jiangsu Science and Technology Special Project (SZ-LYG202126), the Collection and Creation of Horticultural Crop Germplasm Resources of Jiangsu (JSFEM-202212) and the Priority Academic Program Development of Jiangsu Higher Education Institutions Project (PAPD).

Institutional Review Board Statement

Not applicable.

Informed Consent Statement

Not applicable.

Data Availability Statement

Raw RNA-Seq reads can be found in the Genome Sequence Archive database (https://bigd.big.ac.cn/gsa/browse/CRA013441, accessed on 14 November 2023) with Bio Project ID CRA013441; the expression data (FPKM) are on Dryad (https://datadryad.org/stash/share/IJVErepIxRijiJis_wFRaBaIsS8BtDaT1oM5wy3yQX0, accessed on 22 December 2023).

Conflicts of Interest

The authors declare no conflicts of interest.

References

  1. Mori, T.; Johnson, C.H. Circadian programming in cyanobacteria. Semin. Cell Dev. Biol. 2001, 12, 271–278. [Google Scholar] [CrossRef] [PubMed]
  2. Chow, B.Y.; Kay, S.A. Global approaches for telling time: Omics and the Arabidopsis circadian clock. Semin. Cell Dev. Biol. 2013, 24, 383–392. [Google Scholar] [CrossRef] [PubMed]
  3. Wang, W.; Barnaby, J.Y.; Tada, Y.; Li, H.; Tör, M.; Caldelari, D.; Lee, D.U.; Fu, X.D.; Dong, X. Timing of plant immune responses by a central circadian regulator. Nature 2011, 470, 110–114. [Google Scholar] [CrossRef] [PubMed]
  4. Inoue, K.; Araki, T.; Endo, M. Circadian clock during plant development. J. Plant Res. 2018, 131, 59–66. [Google Scholar] [CrossRef] [PubMed]
  5. Song, Y.H.; Ito, S.; Imaizumi, T. Flowering time regulation: Photoperiod-and temperature-sensing in leaves. Trends Plant Sci. 2013, 18, 575–583. [Google Scholar] [CrossRef] [PubMed]
  6. Xiang, Y.; Sapir, T.; Rouillard, P.; Ferrand, M.; Jiménez-Gómez, J.M. Interaction between photoperiod and variation in circadian rhythms in tomato. BMC Plant Biol. 2022, 22, 187. [Google Scholar] [CrossRef] [PubMed]
  7. Huang, T.; Liu, H.; Tao, J.P.; Zhang, J.Q.; Zhao, T.M.; Hou, X.L.; Xiong, A.S.; You, X. Low light intensity elongates period and defers peak time of photosynthesis: A computational approach to circadian-clock-controlled photosynthesis in tomato. Hortic. Res. 2023, 25, 077. [Google Scholar] [CrossRef] [PubMed]
  8. Song, Y.H.; Ito, S.; Imaizumi, T. Similarities in the circadian clock and photoperiodism in plants. Curr. Opin. Plant Biol. 2010, 13, 594–603. [Google Scholar] [CrossRef]
  9. Zhu, C.; Peng, Q.; Fu, D.; Zhuang, D.; Yu, Y.; Duan, M.; Xie, W.; Cai, Y.; Ouyang, Y.; Lian, X.; et al. The E3 Ubiquitin Ligase HAF1 Modulates Circadian Accumulation of EARLY FLOWERING3 to Control Heading Date in Rice under Long-Day Conditions. Plant Cell 2018, 30, 2352–2367. [Google Scholar] [CrossRef]
  10. Nozue, K.; Maloof, J.N. Diurnal regulation of plant growth. Plant Cell Environ. 2006, 29, 396–408. [Google Scholar] [CrossRef]
  11. Yakir, E.; Hilman, D.; Harir, Y.; Green, R.M. Regulation of output from the plant circadian. FEBS J. 2007, 274, 335–345. [Google Scholar] [CrossRef] [PubMed]
  12. Dodd, A.N.; Salathia, N.; Hall, A.; Kévei, E.; Tóth, R.; Nagy, F.; Hibberd, J.M.; Millar, A.J.; Webb, A.A. Plant circadian clocks increase photosynthesis, growth, survival, and competitive advantage. Science 2005, 309, 630–633. [Google Scholar] [CrossRef] [PubMed]
  13. Litthauer, S.; Battle, M.W.; Lawson, T.; Jones, M.A. Phototropins maintain robust circadian oscillation of PSII operating efficiency under blue light. Plant J. 2015, 83, 1034–1045. [Google Scholar] [CrossRef] [PubMed]
  14. Du, H.; Zhang, L.; Liu, L.; Tang, X.F.; Yang, W.J.; Wu, Y.M.; Huang, Y.B.; Tang, Y.X. Biochemical and molecular characterization of plant MYB transcription factor family. Biochemistry 2009, 74, 1–11. [Google Scholar] [CrossRef] [PubMed]
  15. Lippold, F.; Sanchez, D.H.; Musialak, M.; Schlereth, A.; Scheible, W.R.; Hincha, D.K.; Udvardi, M.K. AtMyb41 regulates transcriptional and metabolic responses to osmotic stress in Arabidopsis. Plant Physiol. 2009, 149, 1761–1772. [Google Scholar] [CrossRef] [PubMed]
  16. Stracke, R.; Werber, M.; Weisshaar, B. The R2R3-MYB gene family in Arabidopsis thaliana. Curr. Opin. Plant Biol. 2001, 4, 447–456. [Google Scholar] [CrossRef] [PubMed]
  17. Dubos, C.; Stracke, R.; Grotewold, E.; Weisshaar, B.; Martin, C.; Lepiniec, L. MYB transcription factors in Arabidopsis. Trends Plant Sci. 2010, 15, 573–581. [Google Scholar] [CrossRef]
  18. Xu, Z.S.; Yang, Q.Q.; Feng, K.; Xiong, A.S. Changing Carrot Color: Insertions in DcMYB7 Alter the Regulation of Anthocyanin Biosynthesis and Modification. Plant Physiol. 2019, 181, 195–207. [Google Scholar] [CrossRef]
  19. Duan, A.Q.; Deng, Y.J.; Tan, S.S.; Xu, Z.S.; Xiong, A.S. A MYB activator, DcMYB11c, regulates carrot anthocyanins accumulation in petiole but not taproot. Plant Cell Environ. 2023, 46, 2794–2809. [Google Scholar] [CrossRef]
  20. Duan, A.Q.; Tan, S.S.; Deng, Y.J.; Xu, Z.S.; Xiong, A.S. Genome-Wide Identification and Evolution Analysis of R2R3-MYB Gene Family Reveals S6 Subfamily R2R3-MYB Transcription Factors Involved in Anthocyanin Biosynthesis in Carrot. Int. J. Mol. Sci. 2022, 23, 11859. [Google Scholar] [CrossRef]
  21. Li, M.Y.; Xu, Z.S.; Huang, Y.; Tian, C.; Wang, F.; Xiong, A.S. Genome-wide analysis of AP2/ERF transcription factors in carrot (Daucus carota L.) reveals evolution and expression profiles under abiotic stress. Mol. Genet. Genom. 2015, 290, 2049–2061. [Google Scholar] [CrossRef]
  22. Wang, X.; Niu, Y.; Zheng, Y. Multiple Functions of MYB Transcription Factors in Abiotic Stress Responses. Int. J. Mol. Sci. 2021, 22, 6125. [Google Scholar] [CrossRef] [PubMed]
  23. Baldoni, E.; Genga, A.; Cominelli, E. Plant MYB Transcription Factors: Their Role in Drought Response Mechanisms. Int. J. Mol. Sci. 2015, 6, 15811–15851. [Google Scholar] [CrossRef] [PubMed]
  24. Feng, K.; Xu, Z.S.; Que, F.; Liu, J.X.; Wang, F.; Xiong, A.S. An R2R3-MYB transcription factor, OjMYB1, functions in anthocyanin biosynthesis in Oenanthe javanica. Planta 2018, 247, 301–315. [Google Scholar] [CrossRef]
  25. Wu, W.; Zhu, S.; Zhu, L.; Wang, D.; Liu, Y.; Liu, S.; Zhang, J.; Hao, Z.; Lu, Y.; Cheng, T.; et al. Characterization of the Liriodendron Chinense MYB Gene Family and Its Role in Abiotic Stress Response. Front. Plant Sci. 2021, 12, 641280. [Google Scholar] [CrossRef] [PubMed]
  26. Wang, W.L.; Wang, Y.X.; Li, H.; Liu, Z.W.; Cui, X.; Zhuang, J. Two MYB transcription factors (CsMYB2 and CsMYB26) are involved in flavonoid biosynthesis in tea plant [Camellia sinensis (L.) O. Kuntze]. BMC Plant Biol. 2018, 18, 288. [Google Scholar] [CrossRef]
  27. Wang, W.L.; Cui, X.; Wang, Y.X.; Li, Z.W.; Zhuang, J. Members of R2R3-type MYB transcription factors from subgroups 20 and 22 are involved in abiotic stress response in tea plants. Biotechnol. Biotechnol. Equip. 2018, 32, 1141–1153. [Google Scholar] [CrossRef]
  28. Li, M.; Li, Y.; Guo, L.; Gong, N.; Pang, Y.; Jiang, W.; Liu, Y.; Jiang, X.; Zhao, L.; Wang, Y.; et al. Functional Characterization of Tea (Camellia sinensis) MYB4a Transcription Factor Using an Integrative Approach. Front. Plant Sci. 2017, 8, 943. [Google Scholar] [CrossRef]
  29. Katiyar, A.; Smita, S.; Lenka, S.K.; Rajwanshi, R.; Chinnusamy, V.; Bansal, K.C. Genome-wide classification and expression analysis of MYB transcription factor families in rice and Arabidopsis. BMC Genom. 2012, 13, 544. [Google Scholar] [CrossRef]
  30. Carré, I.A.; Kim, J.Y. MYB transcription factors in the Arabidopsis circadian clock. J. Exp. Bot. 2002, 53, 1551–1557. [Google Scholar] [CrossRef]
  31. Ramsay, N.A.; Glover, B.J. MYB-bHLH-WD40 protein complex and the evolution of cellular diversity. Trends Plant Sci. 2005, 10, 63–70. [Google Scholar] [CrossRef] [PubMed]
  32. Duan, M.; Huang, P.; Yuan, X.; Chen, H.; Huang, J.; Zhang, H. CMYB1 encoding a MYB transcriptional activator is involved in abiotic stress and circadian rhythm in rice. Sci. World J. 2014, 2014, 178038. [Google Scholar] [CrossRef] [PubMed]
  33. Farinas, B.; Mas, P. Histone acetylation and the circadian clock: A role for the MYB transcription factor RVE8/LCL5. Plant Signal Behav. 2011, 6, 541–543. [Google Scholar] [CrossRef] [PubMed]
  34. Nakamichi, N.; Kiba, T.; Henriques, R.; Mizuno, T.; Chua, N.H.; Sakakibara, H. PSEUDO-RESPONSE REGULATORS 9, 7, and 5 are transcriptional repressors in the Arabidopsis circadian clock. Plant Cell 2010, 22, 594–605. [Google Scholar] [CrossRef]
  35. Rawat, R.; Schwartz, J.; Jones, M.A.; Sairanen, I.; Cheng, Y.; Andersson, C.R.; Zhao, Y.; Ljung, K.; Harmer, S.L. REVEILLE1, a Myb-like transcription factor, integrates the circadian clock and auxin pathways. Proc. Natl. Acad. Sci. USA 2009, 106, 16883–16888. [Google Scholar] [CrossRef]
  36. Xing, H.; Wang, P.; Cui, X.; Zhang, C.; Wang, L.; Liu, X.; Yuan, L.; Li, Y.; Xie, Q.; Xu, X. LNK1 and LNK2 recruitment to the evening element require morning expressed circadian related MYB-like transcription factors. Plant Signal Behav. 2015, 10, e1010888. [Google Scholar] [CrossRef]
  37. Nusinow, D.A.; Helfer, A.; Hamilton, E.E.; King, J.J.; Imaizumi, T.; Schultz, T.F.; Farré, E.M.; Kay, S.A. The ELF4-ELF3-LUX complex links the circadian clock to diurnal control of hypocotyl growth. Nature 2011, 475, 398–402. [Google Scholar] [CrossRef]
  38. Cai, Y.; Liu, Y.; Fan, Y.; Li, X.; Yang, M.; Xu, D.; Wang, H.; Deng, X.W.; Li, J. MYB112 connects light and circadian clock signals to promote hypocotyl elongation in Arabidopsis. Plant Cell 2023, 35, 3485–3503. [Google Scholar] [CrossRef]
  39. Bendix, C.; Marshall, C.M.; Harmon, F.G. Circadian Clock Genes Universally Control Key Agricultural Traits. Mol. Plant 2015, 8, 1135–1152. [Google Scholar] [CrossRef]
  40. Zhao, X.; Li, P.; Zuo, H.; Peng, A.; Lin, J.; Li, P.; Wang, K.; Tang, Q.; Tadege, M.; Liu, Z.; et al. CsMYBL2 homologs modulate the light and temperature stress-regulated anthocyanin and catechins biosynthesis in tea plants (Camellia sinensis). Plant J. 2023, 115, 1051–1070. [Google Scholar] [CrossRef]
  41. Jiao, T.; Huang, Y.; Wu, Y.L.; Jiang, T.; Li, T.; Liu, Y.; Liu, Y.; Han, Y.; Liu, Y.; Jiang, X.; et al. Functional diversity of subgroup 5 R2R3-MYBs promoting proanthocyanidin biosynthesis and their key residues and motifs in tea plant. Hortic. Res. 2023, 10, uhad135. [Google Scholar] [CrossRef] [PubMed]
  42. Han, M.H.; Yang, N.; Wan, Q.W.; Teng, R.M.; Duan, A.Q.; Wang, Y.H.; Zhuang, J. Exogenous melatonin positively regulates lignin biosynthesis in Camellia sinensis. Int. J. Biol. Macromol. 2021, 179, 485–499. [Google Scholar] [CrossRef]
  43. Chen, X.; Wang, P.; Gu, M.; Lin, X.; Hou, B.; Zheng, Y.; Sun, Y.; Jin, S.; Ye, N. R2R3-MYB transcription factor family in tea plant (Camellia sinensis): Genome-wide characterization, phylogeny, chromosome location, structure and expression patterns. Genomics 2021, 113, 1565–1578. [Google Scholar] [CrossRef] [PubMed]
  44. Bordoni, A.; Hrelia, S.; Angeloni, C.; Giordano, E.; Guarnieri, C.; Caldarera, C.M.; Biagi, P.L. Green tea protection of hypoxia/reoxygenation injury in cultured cardiac cells. J. Nutr. Biochem. 2002, 13, 103–111. [Google Scholar] [CrossRef] [PubMed]
  45. Lambert, J.D.; Hong, J.; Yang, G.Y.; Liao, J.; Yang, C.S. Inhibition of carcinogenesis by polyphenols: Evidence from laboratory investigations. Am. J. Clin. Nutr. 2005, 81, 284–291. [Google Scholar] [CrossRef]
  46. Evans, J.R.; Loreto, F. Acquisition and diffusion of CO2 in higher plant leaves. Photosynth. Physiol. Metab. 2000, 9, 321–351. [Google Scholar]
  47. Zhang, W.; Zhang, Y.; Qiu, H.; Guo, Y.; Wan, H.; Zhang, X.; Scossa, F.; Alseekh, S.; Zhang, Q.; Wang, P.; et al. Genome assembly of wild tea tree DASZ reveals pedigree and selection history of tea varieties. Nat. Commun. 2020, 11, 3719. [Google Scholar] [CrossRef] [PubMed]
  48. Wu, Z.J.; Tian, C.; Jiang, Q.; Li, X.H.; Zhuang, J. Selection of suitable reference genes for qRT-PCR normalization during leaf development and hormonal stimuli in tea plant (Camellia sinensis). Sci. Rep. 2016, 6, 19748. [Google Scholar] [CrossRef]
  49. Xia, E.H.; Li, F.D.; Tong, W.; Li, P.H.; Wu, Q.; Zhao, H.J.; Ge, R.H.; Li, R.P.; Li, Y.Y.; Zhang, Z.Z.; et al. Tea Plant Information Archive: A comprehensive genomics and bioinformatics platform for tea plant. Plant Biotechnol. J. 2019, 17, 1938–1953. [Google Scholar] [CrossRef]
  50. Deng, Y.; Li, J.; Wu, S.; Zhu, Y.; Chen, Y.; He, F. Integrated nr database in protein annotation system and its localization. Comput. Eng. 2006, 32, 71–72. [Google Scholar]
  51. Finn, R.D.; Bateman, A.; Clements, J.; Coggill, P.; Eberhardt, R.Y.; Eddy, S.R.; Heger, A.; Hetherington, K.; Holm, L.; Mistry, J.; et al. Pfam: The protein families database. Nucleic Acids Res. 2014, 42, D222–D230. [Google Scholar] [CrossRef] [PubMed]
  52. Apweiler, R.; Bairoch, A.; Wu, C.H.; Barker, W.C.; Boeckmann, B.; Ferro, S.; Gasteiger, E.; Huang, H.; Lopez, R.; Magrane, M.; et al. UniProt: The Universal Protein knowledgebase. Nucleic Acids Res. 2004, 32, D115–D119. [Google Scholar] [CrossRef]
  53. Kanehisa, M.; Goto, S.; Kawashima, S.; Okuno, Y.; Hattori, M. The KEGG resource for deciphering the genome. Nucleic Acids Res. 2004, 32, D277–D280. [Google Scholar] [CrossRef]
  54. Ashburner, M.; Ball, C.A.; Blake, J.A.; Botstein, D.; Butler, H.; Cherry, J.M.; Davis, A.P.; Dolinski, K.; Dwight, S.S.; Eppig, J.T.; et al. Gene ontology: Tool for the unification of biology. The Gene Ontology Consortium. Nat. Genet. 2000, 25, 25–29. [Google Scholar] [CrossRef] [PubMed]
  55. Tatusov, R.L.; Fedorova, N.D.; Jackson, J.D.; Jacobs, A.R.; Kiryutin, B.; Koonin, E.V.; Krylov, D.M.; Mazumder, R.; Mekhedov, S.L.; Nikolskaya, A.N.; et al. The COG database: An updated version includes eukaryotes. BMC Bioinform. 2003, 4, 41. [Google Scholar] [CrossRef] [PubMed]
  56. Jin, J.; Tian, F.; Yang, D.C.; Meng, Y.Q.; Kong, L.; Luo, J.; Gao, G. PlantTFDB 4.0: Toward a central hub for transcription factors and regulatory interactions in plants. Nucleic Acids Res. 2017, 45, D1040–D1045. [Google Scholar] [CrossRef] [PubMed]
  57. Liu, J.; Hua, W.; Yang, H.L.; Zhan, G.M.; Li, R.J.; Deng, L.B.; Wang, X.F.; Liu, G.H.; Wang, H.Z. The BnGRF2 gene (GRF2-like gene from Brassica napus) enhances seed oil production through regulating cell number and plant photosynthesis. J. Exp. Bot. 2012, 63, 3727–3740. [Google Scholar] [CrossRef]
  58. Li, P.; Xia, E.; Fu, J.; Xu, Y.; Zhao, X.; Tong, W.; Tang, Q.; Tadege, M.; Fernie, A.R.; Zhao, J. Diverse roles of MYB transcription factors in regulating secondary metabolite biosynthesis, shoot development, and stress responses in tea plants (Camellia sinensis). Plant J. 2022, 110, 1144–1165. [Google Scholar] [CrossRef]
  59. Bian, S.C.; Lu, Y.N.; Xu, W.J.; Chen, B.Q.; Wang, G.L.; Xiong, A.S. Garlic Circadian Clock Genes AsRVE1 and AsRVE2 and Their Expression Analysis Under Osmotic Stress. Acta Hortic. Sin. 2021, 48, 1706–1716. [Google Scholar]
  60. Kim, N.S.; Kim, S.J.; Jo, J.S.; Lee, J.G.; Lee, S.I.; Kim, D.H.; Kim, J.A. The BrGI Circadian Clock Gene Is Involved in the Regulation of Glucosinolates in Chinese Cabbage. Genes 2021, 12, 1664. [Google Scholar] [CrossRef]
  61. Vannozzi, A.; Wong, D.C.J.; Höll, J.; Hmmam, I.; Matus, J.T.; Bogs, J.; Ziegler, T.; Dry, I.; Barcaccia, G.; Lucchin, M. Combinatorial Regulation of Stilbene Synthase Genes by WRKY and MYB Transcription Factors in Grapevine (Vitis vinifera L.). Plant Cell Physiol. 2018, 59, 1043–1059. [Google Scholar] [CrossRef] [PubMed]
  62. Cai, H.; Chen, Y.; Zhang, M.; Cai, R.; Cheng, B.; Ma, Q.; Zhao, Y. A novel GRAS transcription factor, ZmGRAS20, regulates starch biosynthesis in rice endosperm. Physiol. Mol. Biol. Plants 2017, 23, 143–154. [Google Scholar] [CrossRef] [PubMed]
  63. Xie, N.; Huang, X.; Zhou, J.; Song, X.; Lin, J.; Yan, M.; Zhu, M.; Li, J.; Wang, K. The R2R3-MYB transcription factor CsMYB42 regulates theanine biosynthesis in albino tea leaves. Plant Sci. 2023, 336, 111850. [Google Scholar] [CrossRef] [PubMed]
  64. Allan, A.C.; Hellens, R.P.; Laing, W.A. MYB transcription factors that colour our fruit. Trends Plant Sci. 2008, 13, 99–102. [Google Scholar] [CrossRef]
  65. Wang, S.; Xu, Z.; Yang, Y.; Ren, W.; Fang, J.; Wan, L. Genome-wide analysis of R2R3-MYB genes in cultivated peanut (Arachis hypogaea L.): Gene duplications, functional conservation, and diversification. Front. Plant Sci. 2023, 14, 1102174. [Google Scholar] [CrossRef]
  66. Zeng, Y.; Li, Z.; Chen, Y.; Li, W.; Wang, H.B.; Shen, Y. Global dissection of R2R3-MYB in Pogostemon cablin uncovers a species-specific R2R3-MYB clade. Genomics 2023, 115, 110643. [Google Scholar] [CrossRef]
  67. Covington, M.F.; Maloof, J.N.; Straume, M.; Kay, S.A.; Harmer, S.L. Global transcriptome analysis reveals circadian regulation of key pathways in plant growth and development. Genome Biol. 2008, 9, R130. [Google Scholar] [CrossRef]
  68. Hazen, S.P.; Naef, F.; Quisel, T.; Gendron, J.M.; Chen, H.; Ecker, J.R.; Borevitz, J.O.; Kay, S.A. Exploring the transcriptional landscape of plant circadian rhythms using genome tiling arrays. Genome Biol. 2009, 10, R17. [Google Scholar] [CrossRef]
  69. Farinas, B.; Mas, P. Functional implication of the MYB transcription factor RVE8/LCL5 in the circadian control of histone acetylation. Plant J. 2011, 66, 318–329. [Google Scholar] [CrossRef]
  70. Harmer, S.L. The circadian system in higher plants. Annu. Rev. Plant Biol. 2009, 60, 357–377. [Google Scholar] [CrossRef]
  71. Schaffer, R.; Ramsay, N.; Samach, A.; Corden, S.; Putterill, J.; Carré, I.A.; Coupland, G. The late elongated hypocotyl mutation of Arabidopsis disrupts circadian rhythms and the photoperiodic control of flowering. Cell 1998, 93, 1219–1229. [Google Scholar] [CrossRef] [PubMed]
  72. Wang, Z.Y.; Tobin, E.M. Constitutive expression of the CIRCADIAN CLOCK ASSOCIATED 1 (CCA1) gene disrupts circadian rhythms and suppresses its own expression. Cell 1998, 93, 1207–1217. [Google Scholar] [CrossRef] [PubMed]
  73. Wang, Z.Y.; Kenigsbuch, D.; Sun, L.; Harel, E.; Ong, M.S.; Tobin, E.M. A Myb-related transcription factor is involved in the phytochrome regulation of an Arabidopsis Lhcb gene. Plant Cell 1997, 9, 491–507. [Google Scholar]
  74. Jung, C.; Muller, A.E. Flowering time control and applications in plant breeding. Trends Plant Sci. 2009, 14, 563–573. [Google Scholar] [CrossRef] [PubMed]
  75. Shim, J.S.; Kubota, A.; Imaizumi, T. Circadian clock and photoperiodic fowering in Arabidopsis: CONSTANS is a hub for signal integration. Plant Physiol. 2017, 173, 5–15. [Google Scholar] [CrossRef]
  76. Pérez-García, P.; Ma, Y.; Yanovsky, M.J.; Mas, P. Time-dependent sequestration of RVE8 by LNK proteins shapes the diurnal oscillation of anthocyanin biosynthesis. Proc. Natl. Acad. Sci. USA 2015, 112, 5249–5253. [Google Scholar] [CrossRef] [PubMed]
  77. Bian, S.; Li, R.; Xia, S.; Liu, Y.; Jin, D.; Xie, X.; Dhaubhadel, S.; Zhai, L.; Wang, J.; Li, X. Soybean CCA1-like MYB transcription factor GmMYB133 modulates isofavonoid biosynthesis. Biochem. Biophys. Res. Commun. 2018, 507, 324–329. [Google Scholar] [CrossRef] [PubMed]
  78. Li, X.; Wu, T.; Liu, H.; Zhai, R.; Wen, Y.; Shi, Q.; Yang, C.; Wang, Z.; Ma, F.; Xu, L. REVEILLE transcription factors contribute to the nighttime accumulation of anthocyanins in ’Red Zaosu’ (Pyrus bretschneideri Rehd.) pear fruit skin. Int. J. Mol. Sci. 2020, 21, 1634. [Google Scholar] [CrossRef]
  79. Liu, Z.; Zhu, X.; Liu, W.; Qi, K.; Xie, Z.; Zhang, S.; Wu, J.; Wang, P. Characterization of the REVEILLE family in Rosaceae and role of PbLHY in flowering time regulation. BMC Genom. 2023, 24, 49. [Google Scholar] [CrossRef]
  80. Millar, A.J.; Kay, S.A. Integration of circadian and phototransduction pathways in the network controlling CAB gene transcription in Arabidopsis. Proc. Natl. Acad. Sci. USA 1996, 93, 15491–15496. [Google Scholar] [CrossRef]
  81. Yarkhunova, Y.; Guadagno, C.R.; Rubin, M.J.; Davis, S.J.; Ewers, B.E.; Weinig, C. Circadian rhythms are associated with variation in photosystem II function and photoprotective mechanisms. Plant Cell Environ. 2018, 41, 2518–2529. [Google Scholar] [CrossRef] [PubMed]
  82. Jiang, Q.; Xu, Z.S.; Wang, F.; Li, M.Y.; Ma, J.; Xiong, A.S. Effects of abiotic stresses on the expression of Lhcb1 gene and photosynthesis of Oenanthe javanica and Apium graveolens. Biol. Plant. 2014, 58, 256–264. [Google Scholar] [CrossRef]
  83. Glossop, N.R.; Lyons, L.C.; Hardin, P.E. Interlocked feedback loops within the Drosophila circadian oscillator. Science 1999, 286, 766–768. [Google Scholar] [CrossRef] [PubMed]
  84. Lee, K.; Loros, J.J.; Dunlap, J.C. Interconnected feedback loops in the Neurospora circadian system. Science 2000, 289, 107–110. [Google Scholar] [CrossRef] [PubMed]
  85. Takata, N.; Saito, S.; Saito, C.T.; Nanjo, T.; Shinohara, K.; Uemura, M. Molecular phylogeny and expression of poplar circadian clock genes, LHY1 and LHY2. New Phytol. 2009, 181, 808–819. [Google Scholar] [CrossRef] [PubMed]
  86. Li, C.; Liu, X.J.; Yan, Y.; Alam, M.S.; Liu, Z.; Yang, Z.K.; Tao, R.F.; Yue, E.K.; Duan, M.H.; Xu, J.H. OsLHY is involved in regulating fowering through the Hd1- and Ehd1- mediated pathways in rice (Oryza sativa L.). Plant Sci. 2022, 315, 111145. [Google Scholar] [CrossRef]
  87. Zhang, Y.; Xu, P.; Xue, W.; Zhu, W.; Yu, X. Diurnal gene oscillations modulated by RNA metabolism in tomato. Plant J. 2023, 116, 728–743. [Google Scholar] [CrossRef]
  88. Davis, E.M.; Sun, Y.; Liu, Y.; Kolekar, P.; Shao, Y.; Szlachta, K.; Mulder, H.L.; Ren, D.; Rice, S.V.; Wang, Z.; et al. SequencErr: Measuring and suppressing sequencer errors in next-generation sequencing data. Genome Biol. 2021, 22, 37. [Google Scholar] [CrossRef]
  89. Brown, J.; Pirrung, M.; Mccue, L.A. FQC Dashboard: Integrates FastQC results into a web-based, interactive, and extensible FASTQ qualaity control tool. Bioinformatics 2017, 33, 3137–3139. [Google Scholar] [CrossRef]
  90. Si, Y.M.; Xing, Y.Q.; Cai, L. Differential splicing event analysis of liver tumor-educated blood platelets RNA-seq data with Hisat2 and MISO. J. Inn. Mong. Univ. Sci. Technol. 2016, 34, 274–279. [Google Scholar]
  91. Liao, Y.; Smyth, G.K.; Shi, W. The Subread aligner: Fast, accurate and scalable read mapping by seed-and-vote. Nucleic Acids Res. 2013, 41, e108. [Google Scholar] [CrossRef] [PubMed]
  92. Li, B.; Dewey, C.N. RSEM: Accurate transcript quantification from RNA-Seq data with or without a reference genome. BMC Bioinform. 2011, 12, 323. [Google Scholar] [CrossRef] [PubMed]
  93. Robinson, M.D.; McCarthy, D.J.; Smyth, G.K. edgeR: A Bioconductor package for differential expression analysis of digital gene expression data. Bioinformatics 2010, 26, 139–140. [Google Scholar] [CrossRef]
  94. Barsalobres-Cavallari, C.F.; Severino, F.E.; Maluf, M.P.; Maia, I.G. Identification of suitable internal control genes for expression studies in Coffea arabica under different experimental conditions. BMC Mol. Biol. 2009, 10, 1. [Google Scholar] [CrossRef] [PubMed]
  95. Dragan, A.I.; Pavlovic, R.; McGivney, J.B.; Casas-Finet, J.R.; Bishop, E.S.; Strouse, R.J.; Schenerman, M.A.; Geddes, C.D. SYBR Green I: Fluorescence properties and interaction with DNA. J. Fluoresc. 2012, 22, 1189–1199. [Google Scholar] [CrossRef]
  96. Pfaffl, M.W. A new mathematical model for relative quantification in real-time RT-PCR. Nucleic Acids Res. 2001, 29, e45. [Google Scholar] [CrossRef]
  97. Chen, C.; Chen, H.; Zhang, Y.; Thomas, H.R.; Frank, M.H.; He, Y.; Xia, R. TBtools: An integrative toolkit developed for interactive analyses of big biological data. Mol. Plant 2020, 13, 1194–1202. [Google Scholar] [CrossRef]
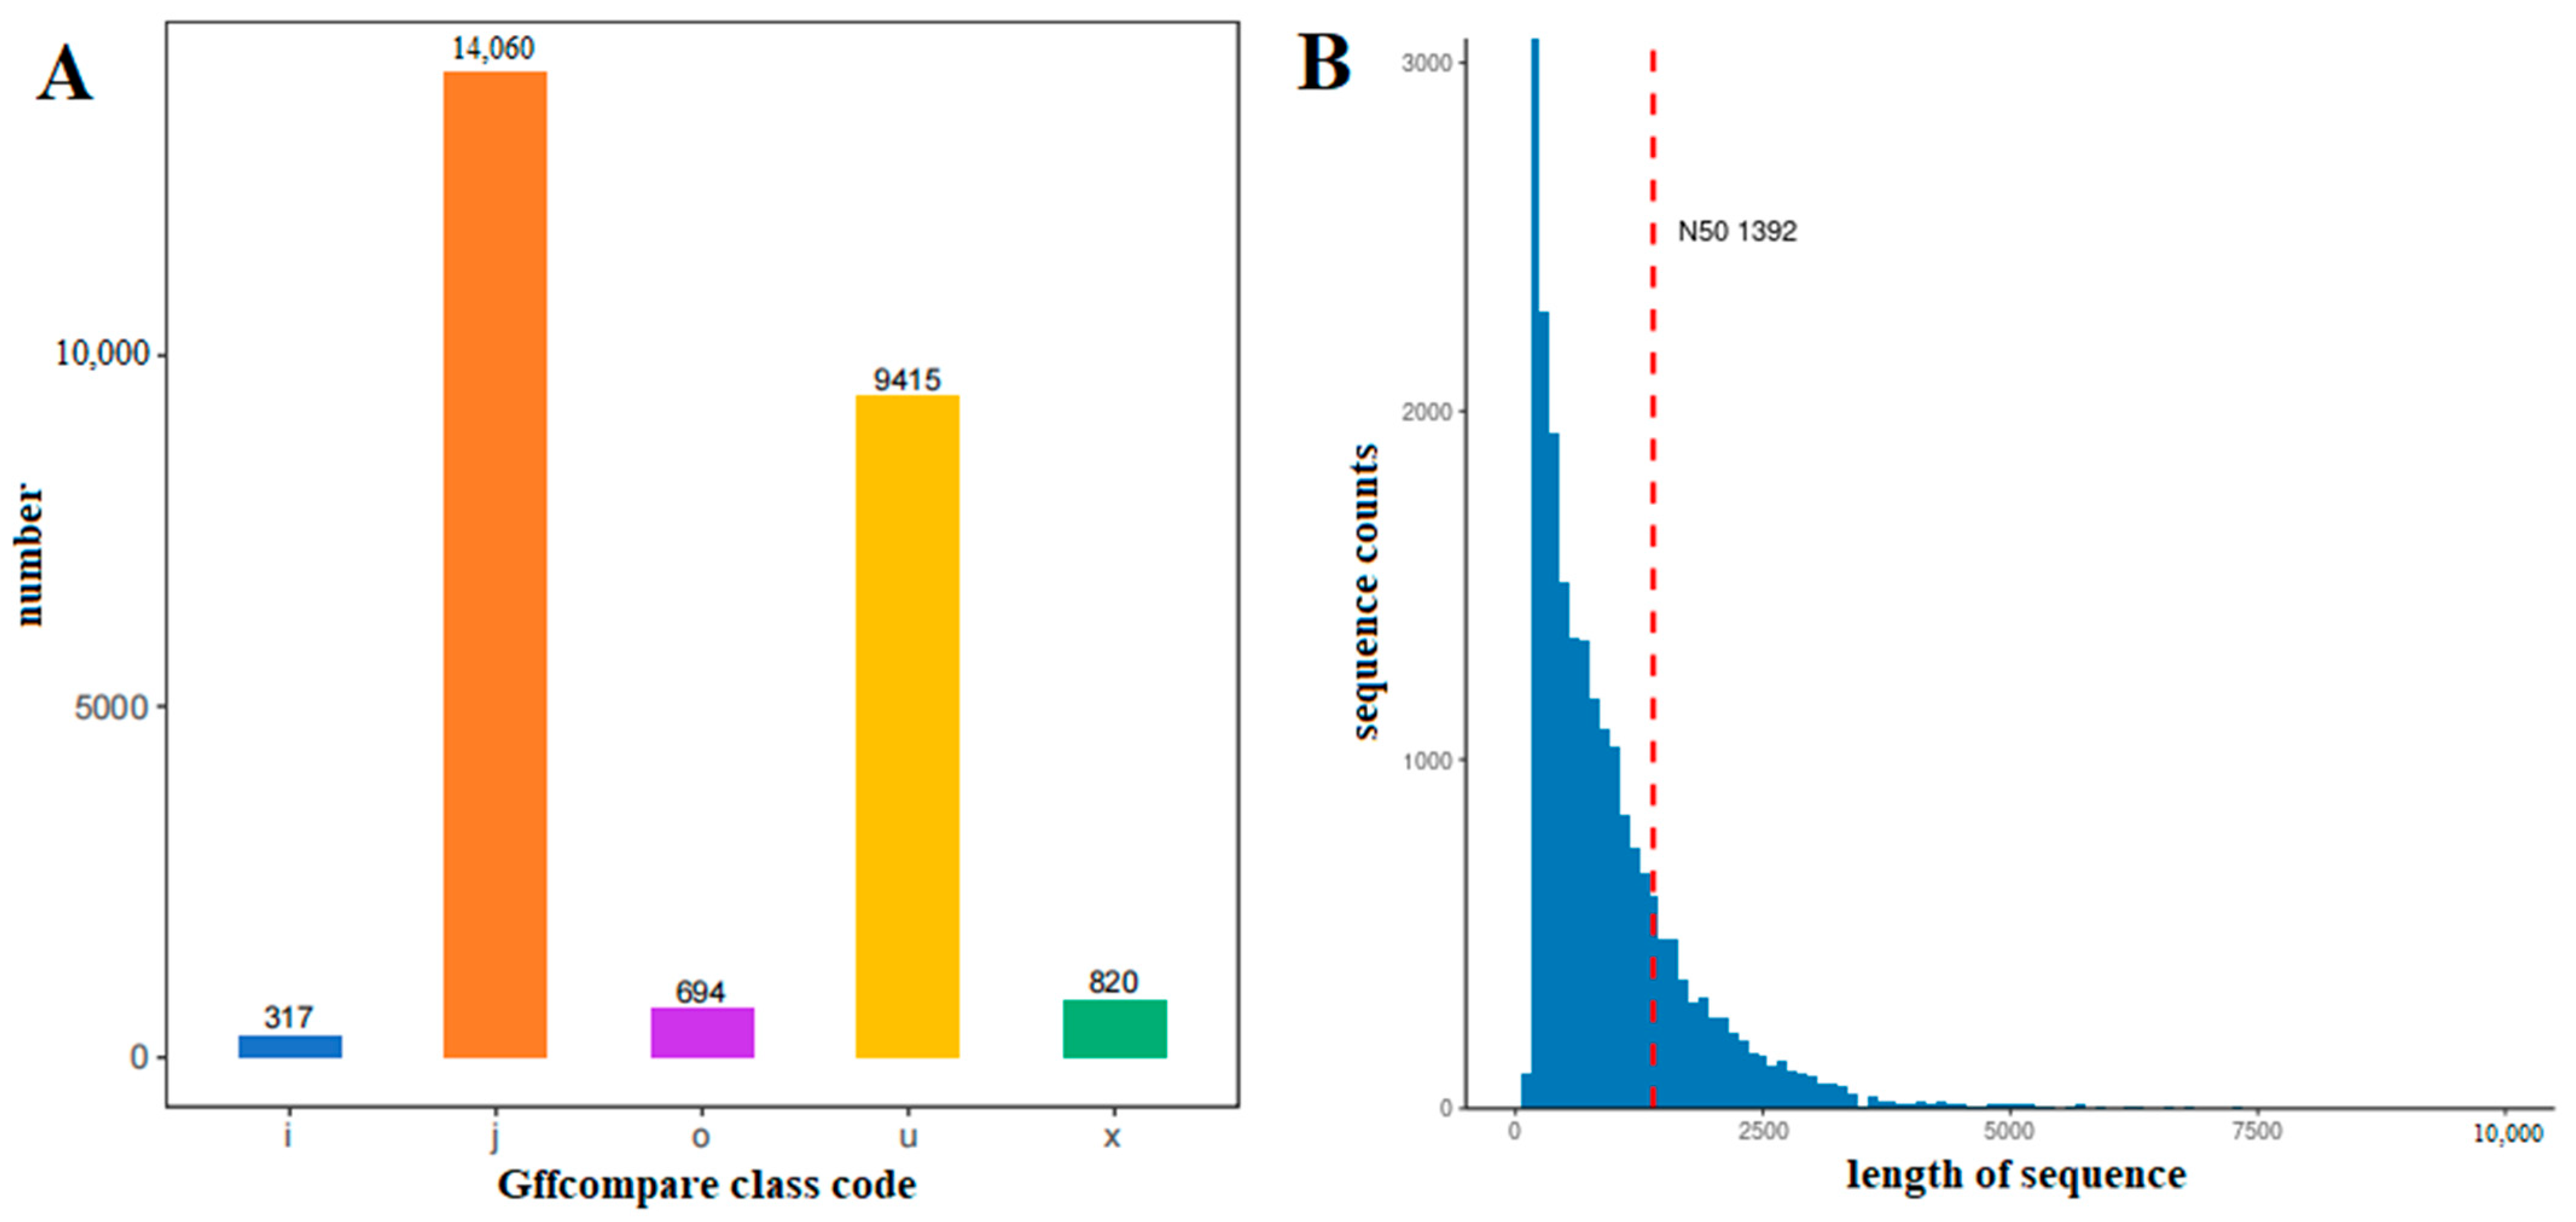
Figure 1. Quantity and differential gene transcript (DET) length distribution of new transcript types in C. sinensis within a photoperiod. (A): Quantity distribution of new transcript types in the sample; ‘o’: other overlapped parts of the same chain with reference exons; ‘j’: multiple exons with at least one match; ‘x’: exon overlap on the antichain; ‘i’: completely contained in the intron of the reference transcript; ‘u’: unknown new transcripts. (B): Differential gene transcript length distribution of new transcripts. The abscissa indicates the length of reads. The ordinate indicates the number of reads in that length range, where the red dotted line indicates the length of N50.
Ijms 25 00657 g001
Figure 2. Nr annotated species distribution map in C. sinensis. The top 10 species with the most comparisons were counted, and the numbers represent the numbers of different species in the Nr database, while different colors represent different species. The species distribution of BLAST hits for each unigene was determined with a cut-off of 1 × 10⁻⁵.
Ijms 25 00657 g002
Figure 3. GO annotation of functional genes in C. sinensis. We selected the top 20 most annotated GOslim under each classification, and each unigene was classified into at least one GO term. All unigenes were grouped into three categories: molecular function, cellular component and biological process.
Ijms 25 00657 g003
Figure 4. KEGG metabolism pathway categories in C. sinensis. Different colors represent the five classes involved in the KEGG metabolic pathway, and numbers represent the numbers of DETs in different classes.
Ijms 25 00657 g004
Figure 5. Volcano map of differentially expressed gene transcripts. Each point represents a transcript, and the horizontal coordinate is logFC, which represents the base −2 pair value of the expression difference multiple of a certain transcript in the two samples. The ordinate represents the base 10 pair value of PValue (too few differential transcripts) or error detection rate FDR multiplied by −1.
Ijms 25 00657 g005
Figure 6. Analysis of transcription factor families in C. sinensis. Different colors represent different families of transcription factors, and the numbers in brackets indicate the proportions to the total differential transcription factors.
Ijms 25 00657 g006
Figure 7. Evolutionary tree analysis of MYB transcription factor family in C. sinensis. Arrows represent 22 differentially expressed MYB transcription factors associated with circadian rhythm. Different colors indicate different subfamilies, and red circles indicate similarity.
Ijms 25 00657 g007
Figure 8. Heatmap of expression profiles of MYB transcription factors within a photoperiod. Color scores were normalized by the counts of RPKM values. Red represents high expression. Blue represents low expression.
Ijms 25 00657 g008
Figure 9. The expression levels of CsMYB gene transcripts in C. sinensis within a photoperiod, with profiles that are high in the day and low at night. (A): Reads per kilobase per million mapped reads. (B): Real-time PCR. The standard deviation (SD) is represented by the error bars. Different lowercase letters indicate significant differences at the 0.05 level.
Ijms 25 00657 g009
Figure 10. Dynamic behavior of MYB transcription factor in C. sinensis within a photoperiod. (A). Dynamic behavior of high expression level during the day and low expression level at night. (B). Dynamic behavior of low expression level during the day and high expression level at night. (C). Dynamic behavior of the expression level irregularity and little change. The gray bands denote dark, and the white bands represent light.
Ijms 25 00657 g010
Figure 11. The expression levels of CsMYB gene transcripts in C. sinensis within a photoperiod, with profiles that are low in the day and high at night. (A): Reads per kilobase per million mapped reads. (B): Real-time PCR. The standard deviation (SD) is represented by the error bars; different lowercase letters indicate significant differences at the 0.05 level.
Ijms 25 00657 g011
Figure 12. The expression levels of CsMYB gene transcripts with irregular expression profiles in C. sinensis within a photoperiod. (A): Reads per kilobase per million mapped reads. (B): Real-time PCR. The standard deviation (SD) is represented by the error bars. Different lowercase letters indicate significant differences at the 0.05 level.
Ijms 25 00657 g012
Table 1. Tea plant sequencing data volume statistics in a photoperiod.
SampleClean Reads (n)Clean Bases (bp)Q20 Rate/%Q30 Rate/%GC Content/%
0 h70,014,51410,426,133,45297.20191.62745.046
4 h70,039,11010,436,107,84496.27891.84744.611
8 h70,054,39410,441,015,26696.20691.67644.659
12 h70,005,76810,434,845,98097.42092.27344.157
16 h70,049,57810,445,672,73297.17091.54544.306
20 h70,017,57810,420,595,67496.99791.00144.529
Disclaimer/Publisher’s Note: The statements, opinions and data contained in all publications are solely those of the individual author(s) and contributor(s) and not of MDPI and/or the editor(s). MDPI and/or the editor(s) disclaim responsibility for any injury to people or property resulting from any ideas, methods, instructions or products referred to in the content.