Article

Large-Sample Genome-Wide Association Study of Resistance to Retained Placenta in U.S. Holstein Cows

1
Department of Animal Science, University of Minnesota, Saint Paul, MN 55108, USA
2
Animal Genomics and Improvement Laboratory, Agricultural Research Service, United States Department of Agriculture, Beltsville, MD 20705, USA
*
Author to whom correspondence should be addressed.
Int. J. Mol. Sci. 2024, 25(10), 5551; https://doi.org/10.3390/ijms25105551
Submission received: 2 May 2024 / Revised: 18 May 2024 / Accepted: 18 May 2024 / Published: 20 May 2024
(This article belongs to the Special Issue Physiology and Pathophysiology of Placenta)

Abstract

:
A genome-wide association study of resistance to retained placenta (RETP) using 632,212 Holstein cows and 74,747 SNPs identified 200 additive effects with p-values < 10−8 on thirteen chromosomes but no dominance effect was statistically significant. The regions of 87.61–88.74 Mb of Chr09 about 1.13 Mb in size had the most significant effect in LOC112448080 and other highly significant effects in CCDC170 and ESR1, and in or near RMND1 and AKAP12. Four non-ESR1 genes in this region were reported to be involved in ESR1 fusions in humans. Chr23 had the largest number of significant effects that peaked in SLC17A1, which was involved in urate metabolism and transport that could contribute to kidney disease. The PKHD1 gene contained seven significant effects and was downstream of another six significant effects. The ACOT13 gene also had a highly significant effect. Both PKHD1 and ACOT13 were associated with kidney disease. Another highly significant effect was upstream of BOLA-DQA2. The KITLG gene of Chr05 that acts in utero in germ cell and neural cell development, and hematopoiesis was upstream of a highly significant effect, contained a significant effect, and was between another two significant effects. The results of this study provided a new understanding of genetic factors underlying RETP in U.S. Holstein cows.

1. Introduction

Retained placenta in dairy cattle refers to the failure of timely separation of the placenta from the dam after calving. This disease creates a number of problems in health and fertility including inflammation, fever, decreased milk yield, longer calving intervals, higher incidence of metritis and lower conception rate [1]. In U.S. Holstein cows, retained placenta has an incidence rate of 3.6%, and is a low-heritability trait with 1% heritability [2]. In humans, retained placenta was found to have inherited risk where the mother’s having retained placenta increased the risk of this disease in the next generation [3]. Only limited research was available on the association between retained placenta and genetic variants. A genome-wide association study (GWAS) using U.S. Holstein bulls and single nucleotide polymorphism (SNP) markers included retained placenta but found no significant effects [4]. Another study on retained placenta using Canadian Holstein bulls identified several chromosome regions with higher heritability estimates than in other chromosome regions [5]. Starting in 2018, national genetic and genomic evaluations for resistance to retained placenta (RETP) started for U.S. Holstein cattle [6] and have since accumulated a large sample of Holstein cows with RETP phenotypic observations and genotypes of genome-wide SNPs, providing a unique opportunity with unprecedented statistical power for identifying genetic variants associated with RETP. Using this large sample, this study aimed to identify genetic variants and chromosome regions affecting RETP in U.S. Holstein cows using a GWAS approach.

2. Results and Discussion

2.1. Overview of GWAS Results

The GWAS of RETP using 614,035 first-lactation Holstein cows and 74,747 SNPs identified 200 additive effects and no dominance effects with log10(1/p) > 8 (Figure 1a, Table S1). The 200 significant additive effects were distributed on twelve chromosomes (Figure 1a): 5, 6, 7, 9, 10, 15, 17, 19, 24, 25, 29 and 31, where Chr31 is the X-Y nonrecombining region of the X chromosome. Allelic effects of the 200 SNPs (Figure 1b) showed that negative allelic effects had larger effect sizes than the positive effect sizes for most chromosomes. The average of the negative allelic effects was −0.089 and the average of the positive allelic effects was 0.077. Chr05 had the most positive allelic effect in C5H12orf75, and the X-Y nonrecombining region of the X chromosome (Chr31) had the most negative allelic effect between MAGED1 and MAGED4B. The detailed descriptions of candidate genes of the significant effects will use gene symbols for most genes and the full gene names are provided in Table S2.

2.2. Additive Effects of Chr09

Chr09 had twenty-three significant effects including the #1 effect in LOC112448080, #2 upstream of AKAP12, #3 in CCDC170, and #5 in RMND1 (Table 1 and Table S1, Figure 2a). These effects were in the 87.61–88.73 Mb region about 1.12 Mb in size. An interesting aspect of this region was the estrogen receptor 1 (ESR1) gene fusions observed in humans. This region had PLEKHG1, MTHFD1L, AKAP12, RMND1, and CCDC170 genes upstream of ESR1 (Table 1), and four of these five upstream genes were involved in ESR1 fusions associated with human breast cancer, ESR1-CCDC170, ESR1-AKAP12, ESR1-MTHFD1, and ESR1-PLEKHG1 fusions [7,8,9,10]. In addition, ESR1 had gene fusions with multiple other genes [7]. These human ESR1 fusions indicated the potential involvement of ESR1 fusions in RETP of Holstein cows. The protein encoded by ESR1 regulates the transcription of many estrogen-inducible genes that play a role in growth, metabolism, sexual development, gestation, and other reproductive functions; and is expressed in many non-reproductive tissues [11]. An SNP in ESR1 had a significant dominance effect on daughter pregnancy rate in Holstein cows [12]. The well-documented ESR1 functions including ESR1 fusions pointed to the possible involvement of ESR1 in the significant effects of RETP in the 87.61–88.73 Mb region of Chr09.

2.3. Additive Effects of Chr23

Chr23 had fifty-two significant effects, the largest number of significant effects among all chromosomes. These effects except one were distributed in the 21.29–35.47 Mb region, about 14 Mb in size (Table S1), but the most interesting region was the 23.70–33.08 Mb region about 9.4 Mb in size due to the genes potentially contributing to or known to be associated with kidney disease (Table 2, Figure 2b). The most significant effect of this chromosome (#4 overall) was in SLC17A1, followed by SNPs in or near MRPS18B, PPT2, and the region of ELOVL5 to BOLA-DQA2 (Table 2). SLC17A1 with the most significant effect was involved in urate metabolic process and urate transport [13] and elevated serum urate concentrations could contribute to kidney disease [14]. The PKHD1 gene had six significant effects and was downstream of another five significant effects (Table S1). This gene was associated with a severe form of polycystic kidney disease named autosomal recessive polycystic kidney disease (ARPKD) that presents primarily in infancy and childhood [15,16]. The ACOT13 gene had a significant effect (#16 overall) and was also reported as a candidate gene for ARPKD kidney disease [17]. It was interesting that the two genes known to be associated with kidney disease, PKHD1 and ACOT13, were near the two ends of the Chr23 region with significant RETP effects (Table 2, Figure 2b). BOLA-DQA2 is a bovine MHC class II gene [18] and MHC class II molecules are critical for the initiation of the antigen-specific immune response [19]. The last significant effect at the very downstream end of the Chr23 region with significant RETP effects was between PRL and HDGFL1, where PRL is the prolactin gene and is essential for lactation [20].

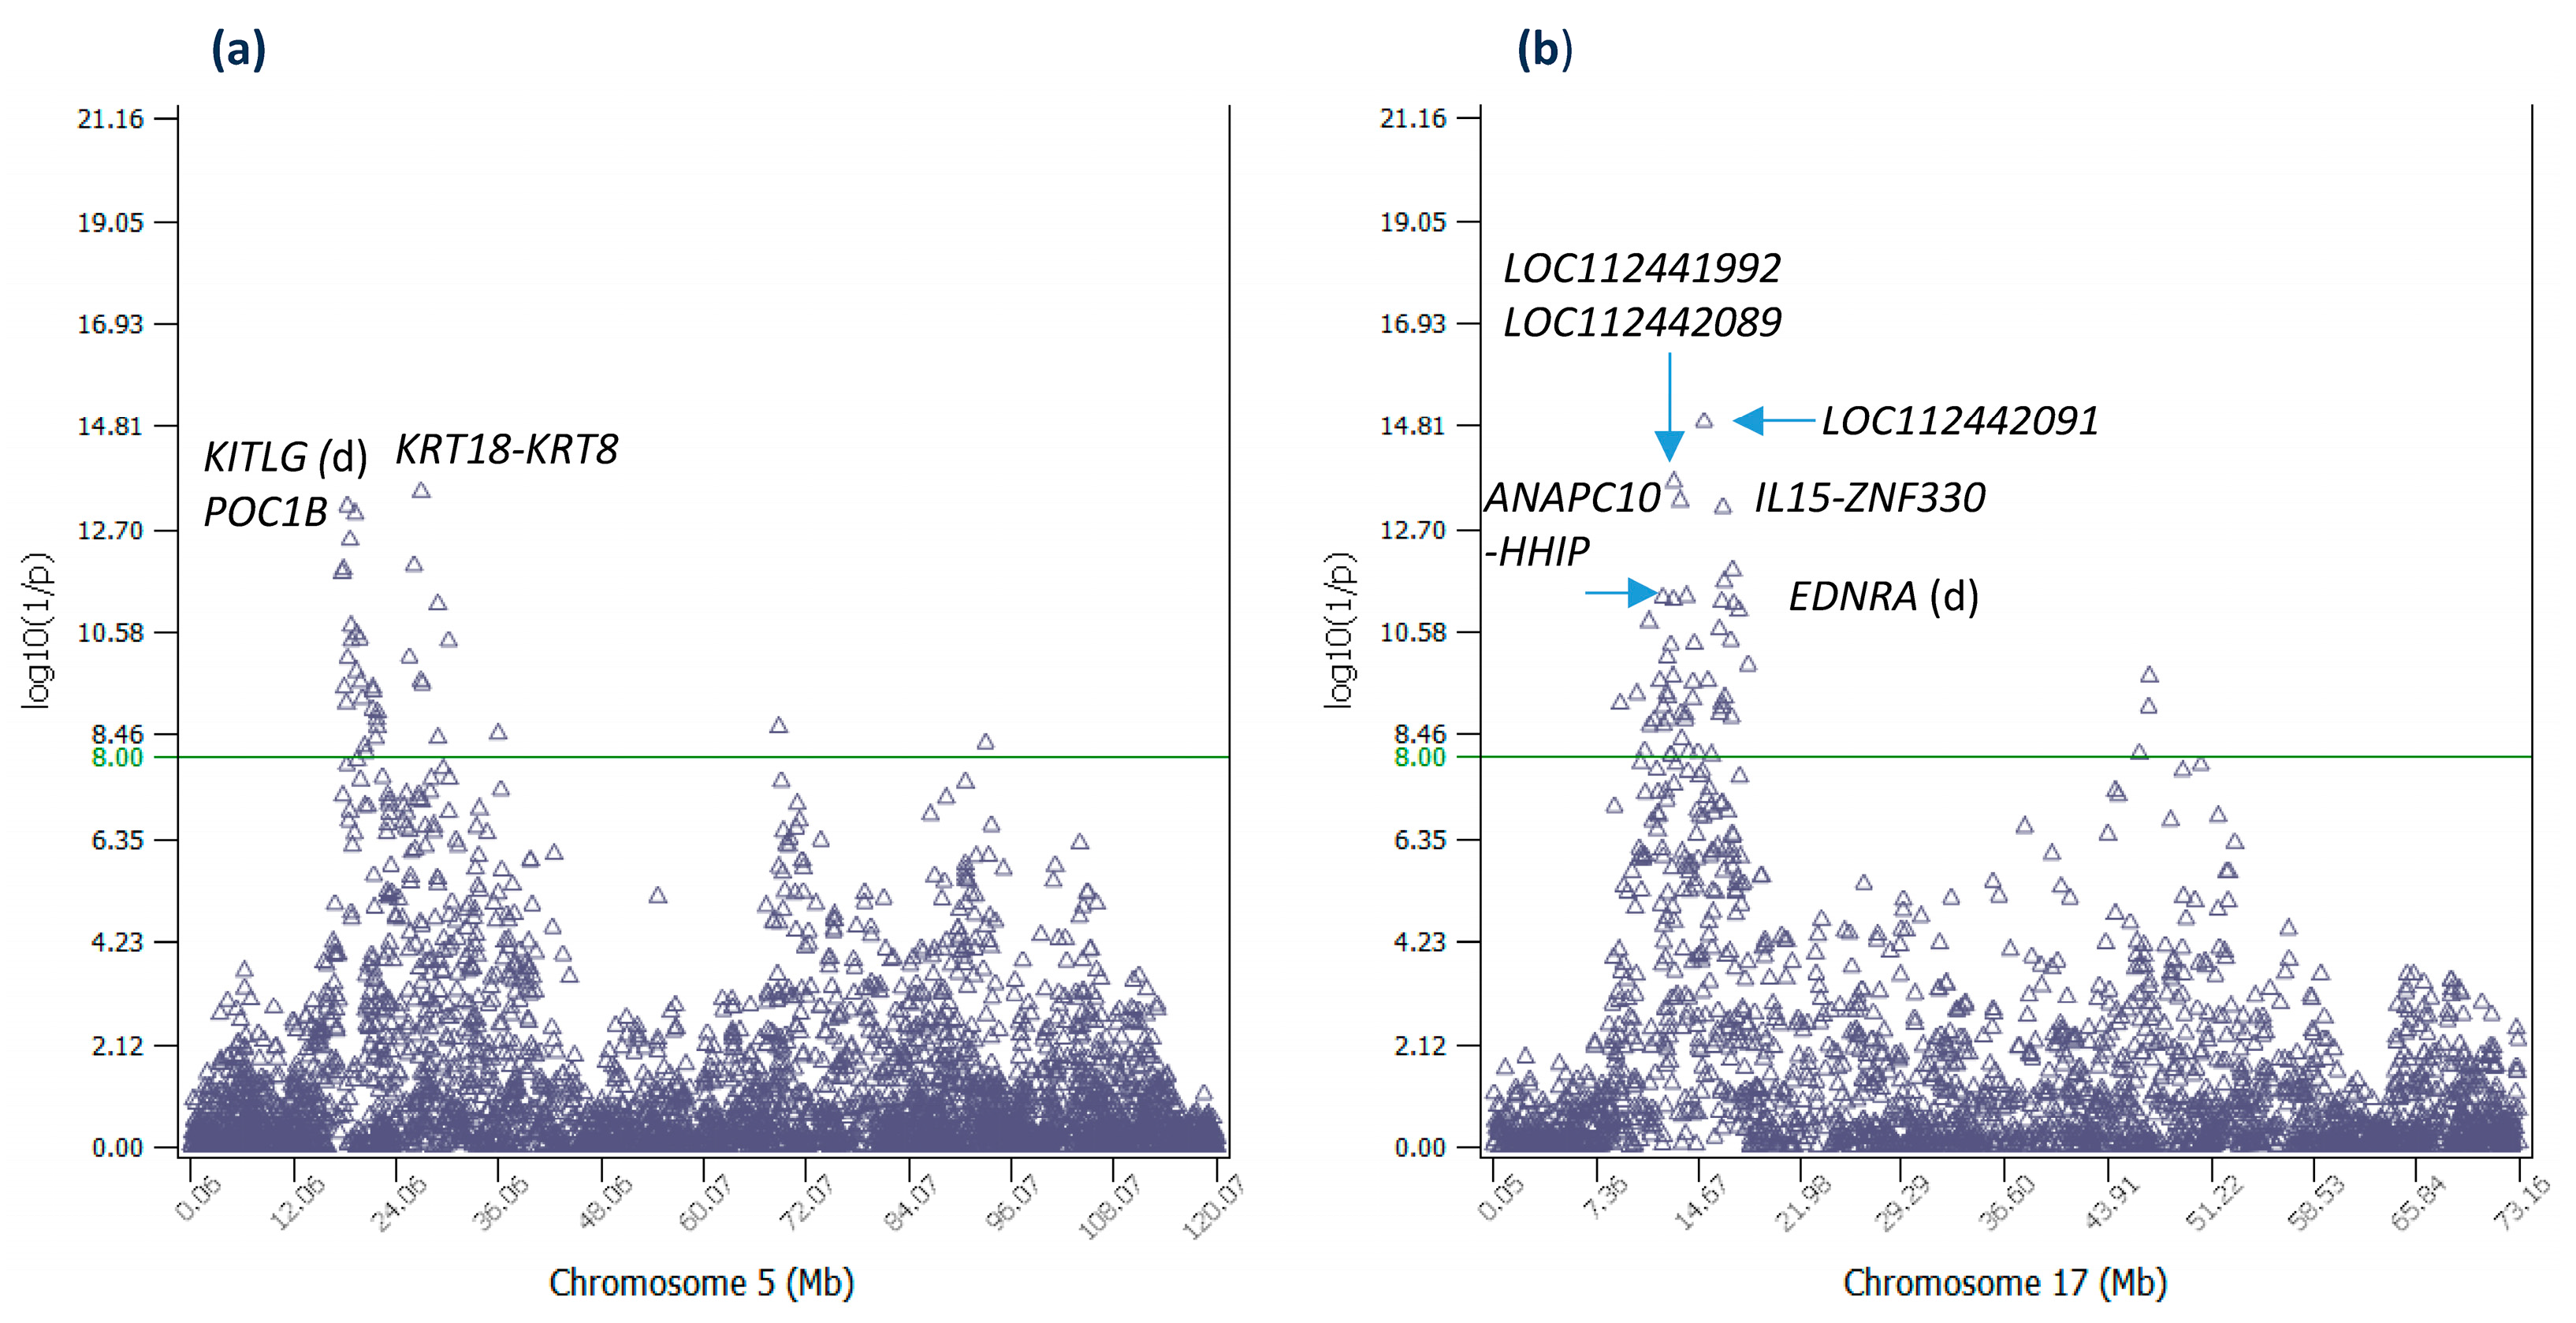
2.4. Additive Effects of Chr05 and Chr17

Chr05 had thirty-five significant additive effects (Table S1). The most significant effect of Chr05 (#17 overall) was at 27,005,657 bp between the KRT18 and KRT8 genes, 3394 bp downstream of KRT18 and 34,610 bp upstream of KRT8, noting that neither KRT18 nor KRT8 had any SNP inside the gene. Gene Ontology (GO) analysis showed that KRT8 was involved in embryonic placenta development (Table S3), and this biological function could be directly relevant to retained placenta. A SNP upstream of KRT18 (in EIF4B-KRT18) at 26,984,066 bp was also significant (#97 overall). It should be noted that another SNP in EIF4B-KRT18 at 26,964,045 bp had a sharply negative recessive genotype for age at first calving (AFC) [21]. The effects in or near KITLG were also interesting due to KITLG’s known biological functions. KITLG was upstream of the second-most significant effect of Chr05 (#25 overall), contained a significant effect and was between another two significant effects (Table 3, Figure 3a). The KITLG gene encodes the ligand of the tyrosine-kinase receptor encoded by the KIT locus, and this ligand is a pleiotropic factor that acts in utero in germ cell and neural cell development, and hematopoiesis [22]. The ‘in utero’ biological functions of KITLG could be directly relevant to RETP. The POC1B gene had the third most significant effect of Chr05 (#28 overall). This gene has an important role in basal body and cilia formation [23].
Chr17 had fifty-one significant effects (Table S1). The most significant effect of Chr17 (#6 overall) was in LOC112442091, and the second-most significant effect of Chr17 (#16 overall) was between LOC112441992 and LOC112442089. All the above three genes had unknown biological functions. The third-most significant effect of Chr17 was between ANAPC10 and HHIP. A 388,434 bp region between IL15 and ZNF330, 31,334 bp downstream of IL15 and 1245 bp upstream of ZNF330, had the fourth-most significant effect of Chr17 (#26 overall) and seven other significant effects (Table 3, Figure 3b). IL15 is a cytokine that regulates T and natural killer cell activation and proliferation [24], and ZNF330 is predicted to enable zinc ion binding activity [25].

2.5. Additive Effects of Other Chromosomes

For the remaining nine chromosomes with significant additive effects, only Chr15 and Chr24 had substantial numbers of significant effects, fifteen effects for Chr15 and eleven effects for Chr24, whereas chromosomes 6, 7, 10, 19, 25, 29 and 31 each had 1–3 effects. Examples of these effects are summarized in Table 4, whereas effects not discussed in the main text can be found in Table S1.
The fifteen effects of Chr15 were distributed over the 26–67 Mb region and the four most significant effects of Chr15 were in SLC1A2 (#48), IL10RA (#89), SPON1 (#90), and downstream of DCDC1 ($95) covering a large distance of the 26–67 Mb region (Figure 4a). SLC1A2 encodes a membrane-bound protein as the principal transporter that clears the excitatory neurotransmitter glutamate and glutamate clearance is necessary for proper synaptic activation and to prevent neuronal damage from excessive activation of glutamate receptors [26]. IL10RA encodes a protein that is a receptor for interleukin 10, and is structurally related to interferon receptors [27]. SPON1 is predicted to be an extracellular matrix structural constituent and to be involved in cell adhesion [28]. The four most significant effects of Chr24 were in a narrow 30.38–31.01 Mb region about 0.63 Mb in size (Figure 4b), downstream of SS18, in TAF4B (2 effects) and upstream of TAF4B with overall rankings of #15, #18, #33 and #37, respectively, where SS18 is involved in positive regulation of transcription by RNA polymerase II [29], and TAF4B is involved in initiation of transcription of genes by RNA polymerase II [30]. Chr31, the X-Y nonrecombining region of the X-chromosome, had three significant effects (Figure 4c). The top two effects of this chromosome were in MAGED1-MAGED4B (#73) and downstream of NUDT11 (#75). The SNP in MAGED1-MAGED4B had the most negative allelic effect among all SNPs with a low allele frequency of 0.07. Chr06 had three significant effects (#104, #108 and #175 overall) in the SLC4A4-GC-NPFFR2 region (Figure 4d), which had been reported to have highly significant effects on milk yield, fertility and somatic cell score [12,31]. Chr10 had two significant effects slightly above the log10(1/p) = 8 cutoff value for declaring significance, one in RASGRP1, which activates the Erk/MAP kinase cascade and regulates T-cells and B-cells development, homeostasis and differentiation [32], and one in LIPC which Enables phospholipase A1 activity and triglyceride lipase activity [33]. Chr07 had one significant effect (#78 overall) downstream of OR7A5. Olfactory receptors interact with odorant molecules in the nose, to initiate a neuronal response that triggers the perception of a smell. Chr19 had two significant effects, one in ABCA10 (#96 overall) and one in ABCA9 (#125 overall).

2.6. Gene Ontology Analysis

Gene Ontology (GO) analysis was conducted to understand the potential biological functions of candidate coding genes of the 200 significant additive effects, and the results are summarized in Table S3 and Figure S1. The GO results provided many more details about the biological functions of the candidate genes than described thus far in this article, e.g., ESR1 and KITLG each had over one hundred biological functions (Table S3). The GO results also identified a few genes involved in embryonic placenta development, including KRT8 of Chr05 downstream of the #17 effect (Table 2), EDNRA of Chr17 upstream of the #61 effect, GCM1 of Chr23 upstream of the #157 and #168 effects, and MAP3K4 of Chr09 with the #155 effect (Table S1). However, the GO results did not include some of the information we collected from journal articles and the National Center for Biotechnology Information (NCBI), e.g., the ESR1 fusions, the in utero biological functions of KITLG, and the association of PKHD1 and ACOT13 with kidney disease. Although the GO analysis identified over 2000 biological functions of the candidate genes (Table S3), none of those biological functions was identified to have a direct effect on retained placenta. In contrast, the GWAS results of this study provided Holstein-specific and high-confidence evidence for the potential associations between the candidate genes and RETP. The combination of the GWAS results of this study with the GO results as well as the biological information of the candidate genes collected elsewhere should provide useful functional annotations of the candidate genes and indications of the potential genetic mechanisms of the significant SNP effects affecting RETL in Holstein cows.

3. Materials and Methods

3.1. Holstein Population and SNP Data

The Holstein population in this study had 632,212 cows with RETP phenotypic observations and 78,964 original and imputed SNPs. With the requirement of 0.05 minor allele frequency, 74,747 SNPs were used in the GWAS analysis. The SNP positions were those from the ARS-UCD1.3 cattle genome assembly. Genes containing or in proximity to highly significant SNP effects were identified as candidate genes affecting RETP. The RETP phenotypic values used in the GWAS analysis were the phenotypic residuals after removing fixed nongenetic effects available from the December 2023 U.S. Holstein genomic evaluation data.

3.2. GWAS Analysis

The GWAS analysis used an approximate generalized least squares (AGLS) method. The AGLS method combines the least squares (LS) tests implemented by EPISNP1mpi [34,35] with the estimated breeding values from a routine genetic evaluation using the entire U.S. Holstein population. The statistical model was:
y = μ I + X g g + Z a + e = X b + Z a + e
where y = column vector of phenotypic deviation after removing fixed nongenetic effects such as heard-year-season (termed as ‘yield deviation’ for any trait) using a standard procedure for the CDCB/USDA genetic and genomic evaluation; µ = common mean; I = identity matrix; g = column vector of genotypic values; X g = model matrix of g; b = ( μ ,   g ) , X = ( I ,   X g ) ; a = column vector of additive polygenic values; Z = model matrix of a; and e = column vector of random residuals. The first and second moments of Equation (1) are: E ( y ) = X b and var ( y ) = V = Z G Z + R = σ a 2 Z A Z + σ e 2 I , where σ a 2 = additive variance, A = additive relationship matrix, and σ e 2 = residual variance. The problem of estimating the b vector that includes SNP genotypic values in Equation (1) is the requirement of inverting the V if the generalized least squares (GLS) method is used, or solving the mixed model equations (MME) [36]. Either the GLS or MME method for each of the genome-wide SNPs is computationally demanding for our sample size. To avoid these computing difficulties, the GWAS used the method of approximate GLS (AGLS) that replaces the polygenic additive values (a) with the best linear unbiased prediction based on pedigree relationships [12,21,31,37]. The significance tests for additive and dominance SNP effects used the t-tests of the additive and dominance contrasts of the estimated SNP genotypic values [34,38]. The t-statistic of the AGLS was calculated as:
t j = | L j | var ( L j ) = | s j g ^ | v s j ( X X ) gg s j ,     j = a , d
where L j = additive or dominance contrast; var ( L j ) = standard deviation of the additive or dominance contrast; s a = row vector of additive contrast coefficients = [ P 11 / p 1 0 . 5 P 12 ( p 2 p 1 ) / ( p 1 p 2 ) P 22 / p 2 ] ; s d = row vector of dominance contrast coefficients = [ 0.5 1 0.5 ] ; v 2 = ( y X b ^ ) ( y X b ^ ) / ( n k ) = estimated residual variance; g ^ = column vector of the AGLS estimates of the three SNP genotypic effects of g 11 , g 12 , and g 22 from Equation (4); ( X X ) gg = submatrix of ( X X ) corresponding to g ^ ; and where p 1 = frequency of A 1 allele, p 2 = frequency of A 2 allele of the SNP, P 11 = frequency of A 1 A 1 genotype, P 12 = frequency of A 1 A 2 genotype, P 22 = frequency of A 2 A 2 genotype, n = number of observations and k = rank of X.
Additive effects of each SNP were estimated using three measures, the average effect of gene substitution, allelic mean, and allelic effect of each allele based on quantitative genetics definitions [38,39]. The allelic mean ( μ i ), the population mean of all genotypic values of the SNP (μ), the allelic effect ( a i ), and the average effect of gene substitution of the SNP (α) are:
μ 1 = P 11 . 1 g 11 +   0 . 5 P 12 . 1 g 12
μ 2 = 0 . 5 P 12 . 2 g 12 +   P 22 . 2 g 22
μ = i = 1 2 p i μ i
a i   =   μ i μ , i = 1 , 2
α     =   L a = s a g ^   =   a 1 a 2 =     μ 1 μ 2
where P 11 . 1 = P 11 / p 1 , P 12 . 1 = P 12 / p 1 , P 12 . 2 = P 12 / p 2 , and P 22 . 2 = P 22 / p 2 . The additive effect measured by the average effect of gene substitution of Equation (7) is the distance between the two allelic means or effects of the same SNP, and is the fundamental measure for detecting SNP additive effects as shown by the t-statistic of Equation (2). However, the allelic effect of Equation (7) is not comparable across SNPs because the allelic effect is affected by the genotypic mean of the SNP defined by Equation (6). To compare allelic effects across SNPs, we replaced the SNP genotypic mean (μ) in Equation (6) with the average of all SNP genotypic means ( μ all ):
a i   =   μ i μ all , i = 1 , 2
Equation (8) was used only for the purpose of graphical display of allelic effects.

3.3. Gene Ontology (GO) Analysis

To understand the potential functions of selected candidate genes, the Gene Ontology (GO) analysis was performed using the OmicShare platform (www.omicshare.com/tools, accessed on 15 May 2024).

4. Conclusions

The GWAS results in this study indicated that RETP in U.S. Holstein cows was affected by multiple genetic variants with additive effects. Although the exact genetic mechanism underlying RETP remained unknown, these significant effects involved genes with a variety of biological functions reported elsewhere including ESR1 gene fusions, immunity, genetic effects on fertility, health and milk production, kidney disease, lactation, KIT ligand in utero, and basal body and cilia formation. The SNP effects detected in this study along with known biological functions of genes with or near the SNP effects provided a new understanding of genetic factors underlying RETP in U.S. Holstein cows and provided comparative information about the genetic mechanism of retained placenta in other species.

Supplementary Materials

The supporting information can be downloaded at: https://www.mdpi.com/article/10.3390/ijms25105551/s1.

Author Contributions

Y.D. conceived this study. D.P. and Z.L. conducted the data analysis. H.B.Z., P.M.V. and C.P.V.T. contributed to data work and manuscript reviews. Y.D., D.P. and Z.L. prepared the manuscript. All authors have read and agreed to the published version of the manuscript.

Funding

This research was supported by the National Institutes of Health’s National Human Genome Research Institute, grant R01HG012425 as part of the NSF/NIH Enabling Discovery through GEnomics (EDGE) Program; grant 2020-67015-31133 from the USDA National Institute of Food and Agriculture; and project MIN-16-144 of the Agricultural Experiment Station at the University of Minnesota. The use of the USDA-ARS computers in this research was supported by USDA-ARS projects 8042-31000-002-00-D and 8042-31000-001-00-D. The funders had no role in the study design, data collection and analysis, decision to publish, or preparation of the manuscript.

Institutional Review Board Statement

Ethical review and approval were waived because this study used existing data only and did not involve the use of live animals.

Informed Consent Statement

Not applicable.

Data Availability Statement

The original genotype data are owned by third parties and maintained by the Council on Dairy Cattle Breeding (CDCB). A request to CDCB is necessary for getting data access on research, which may be sent to: João Dürr, CDCB Chief Executive Officer ([email protected]). All other relevant data are available in the manuscript and Supplementary Materials.

Acknowledgments

Members of the Council on Dairy Cattle Breeding (CDCB) and the Cooperative Dairy DNA Repository (CDDR) are acknowledged for providing the dairy genomic evaluation data. The Ceres and Atlas high-performance computing systems of USDA-ARS were used for the data analysis. Paul VanRaden, Steven Schroeder, and Ransom Baldwin are acknowledged for help with the use of the CDCB data and USDA-ARS computing facilities.

Conflicts of Interest

The authors declare no conflict of interest.

References

  1. Jemal, J.Y. A review on retention of placenta in dairy cattles. Int. J. Vet. Sci. 2016, 5, 200–207. [Google Scholar]
  2. Amin, Y.A.; Hussein, H.A. Latest update on predictive indicators, risk factors and ‘Omic’technologies research of retained placenta in dairy cattle–A review. Reprod. Domest. Anim. 2022, 57, 687–700. [Google Scholar] [CrossRef] [PubMed]
  3. Endler, M.; Cnattingius, S.; Granfors, M.; Wikström, A.K. The inherited risk of retained placenta: A population based cohort study. BJOG Int. J. Obstet. Gynaecol. 2018, 125, 737–744. [Google Scholar] [CrossRef] [PubMed]
  4. Freebern, E.; Santos, D.J.; Fang, L.; Jiang, J.; Parker Gaddis, K.L.; Liu, G.E.; VanRaden, P.M.; Maltecca, C.; Cole, J.B.; Ma, L. GWAS and fine-mapping of livability and six disease traits in Holstein cattle. BMC Genom. 2020, 21, 41. [Google Scholar] [CrossRef] [PubMed]
  5. Guarini, A.; Lourenco, D.; Brito, L.; Sargolzaei, M.; Baes, C.F.; Miglior, F.; Misztal, I.; Schenkel, F. Genetics and genomics of reproductive disorders in Canadian Holstein cattle. J. Dairy Sci. 2019, 102, 1341–1353. [Google Scholar] [CrossRef] [PubMed]
  6. CDCB. Resistance to Retained Placenta (RETP). 2018. Available online: https://uscdcb.com/wp-content/uploads/2018/03/CDCB-Reference-Sheet-RETP-03_2018.pdf (accessed on 2 May 2024).
  7. Nagy, Z.; Jeselsohn, R. ESR1 fusions and therapeutic resistance in metastatic breast cancer. Front. Oncol. 2023, 12, 1037531. [Google Scholar] [CrossRef] [PubMed]
  8. Brett, J.O.; Ritterhouse, L.L.; Newman, E.T.; Irwin, K.E.; Dawson, M.; Ryan, L.Y.; Spring, L.M.; Rivera, M.N.; Lennerz, J.K.; Dias-Santagata, D. Clinical Implications and Treatment Strategies for ESR1 Fusions in Hormone Receptor-Positive Metastatic Breast Cancer: A Case Series. Oncologist 2023, 28, 172–179. [Google Scholar] [CrossRef] [PubMed]
  9. Li, L.; Lin, L.; Veeraraghavan, J.; Hu, Y.; Wang, X.; Lee, S.; Tan, Y.; Schiff, R.; Wang, X.-S. Therapeutic role of recurrent ESR1-CCDC170 gene fusions in breast cancer endocrine resistance. Breast Cancer Res. 2020, 22, 84. [Google Scholar] [CrossRef]
  10. Vitale, S.R.; Ruigrok-Ritstier, K.; Timmermans, A.M.; Foekens, R.; Trapman-Jansen, A.M.; Beaufort, C.M.; Vigneri, P.; Sleijfer, S.; Martens, J.W.; Sieuwerts, A.M. The prognostic and predictive value of ESR1 fusion gene transcripts in primary breast cancer. BMC Cancer 2022, 22, 165. [Google Scholar] [CrossRef]
  11. ESR1 Estrogen Receptor 1. The National Center for Biotechnology Information. Available online: https://www.ncbi.nlm.nih.gov/gene/2099 (accessed on 2 May 2024).
  12. Liang, Z.; Prakapenka, D.; VanRaden, P.M.; Jiang, J.; Ma, L.; Da, Y. A Million-cow genome-wide association study of three fertility traits in US Holstein cows. Int. J. Mol. Sci. 2023, 24, 10496. [Google Scholar] [CrossRef]
  13. SLC17A1 Solute Carrier Family 17 Member 1. Available online: https://www.ncbi.nlm.nih.gov/gene/6568 (accessed on 2 May 2024).
  14. Johnson, R.J.; Bakris, G.L.; Borghi, C.; Chonchol, M.B.; Feldman, D.; Lanaspa, M.A.; Merriman, T.R.; Moe, O.W.; Mount, D.B.; Lozada, L.G.S. Hyperuricemia, acute and chronic kidney disease, hypertension, and cardiovascular disease: Report of a scientific workshop organized by the National Kidney Foundation. Am. J. Kidney Dis. 2018, 71, 851–865. [Google Scholar] [CrossRef] [PubMed]
  15. Onuchic, L.F.; Furu, L.; Nagasawa, Y.; Hou, X.; Eggermann, T.; Ren, Z.; Bergmann, C.; Senderek, J.; Esquivel, E.; Zeltner, R. PKHD1, the polycystic kidney and hepatic disease 1 gene, encodes a novel large protein containing multiple immunoglobulin-like plexin-transcription–factor domains and parallel beta-helix 1 repeats. Am. J. Hum. Genet. 2002, 70, 1305–1317. [Google Scholar] [CrossRef] [PubMed]
  16. Bergmann, C.; Senderek, J.; Küpper, F.; Schneider, F.; Dornia, C.; Windelen, E.; Eggermann, T.; Rudnik-Schöneborn, S.; Kirfel, J.; Furu, L. PKHD1 mutations in autosomal recessive polycystic kidney disease (ARPKD). Hum. Mutat. 2004, 23, 453–463. [Google Scholar] [CrossRef] [PubMed]
  17. Du, N.; Dong, D.; Sun, L.; Che, L.; Li, X.; Liu, Y.; Wang, B. Identification of ACOT13 and PTGER2 as novel candidate genes of autosomal dominant polycystic kidney disease through whole exome sequencing. Eur. J. Med. Res. 2021, 26, 142. [Google Scholar] [CrossRef] [PubMed]
  18. Fukunaga, K.; Yamashita, Y.; Yagisawa, T. Copy number variations in BOLA-DQA2, BOLA-DQB, and BOLA-DQA5 show the genomic architecture and haplotype frequency of major histocompatibility complex class II genes in Holstein cows. Hla 2020, 96, 601–609. [Google Scholar] [CrossRef] [PubMed]
  19. Holling, T.M.; Schooten, E.; van Den Elsen, P.J. Function and regulation of MHC class II molecules in T-lymphocytes: Of mice and men. Hum. Immunol. 2004, 65, 282–290. [Google Scholar] [CrossRef] [PubMed]
  20. PRL Prolactin. The National Center for Biotechnology Information. Available online: https://www.ncbi.nlm.nih.gov/gene/5617 (accessed on 2 May 2024).
  21. Prakapenka, D.; Liang, Z.; Da, Y. Genome-wide association study of age at first calving in US Holstein cows. Int. J. Mol. Sci. 2023, 24, 7109. [Google Scholar] [CrossRef] [PubMed]
  22. KITLG KIT Ligand. The National Center for Biotechnology Information. Available online: https://www.ncbi.nlm.nih.gov/gene/4254 (accessed on 2 May 2024).
  23. POC1B POC1 Centriolar Protein B. The National Center for Biotechnology Information. Available online: https://www.ncbi.nlm.nih.gov/gene/83943 (accessed on 2 May 2024).
  24. IL15 Interleukin 15. Available online: https://www.ncbi.nlm.nih.gov/gene/3600 (accessed on 2 May 2024).
  25. ZNF330 Zinc Finger Protein 330. Available online: https://www.ncbi.nlm.nih.gov/gene/27309 (accessed on 2 May 2024).
  26. SLC1A2 Solute Carrier Family 1 Member 2. The National Center for Biotechnology Information. Available online: https://www.ncbi.nlm.nih.gov/gene/6506 (accessed on 2 May 2024).
  27. IL10RA Interleukin 10 Receptor Subunit Alpha. The National Center for Biotechnology Information. Available online: https://www.ncbi.nlm.nih.gov/gene/3587 (accessed on 2 May 2024).
  28. SPON1 Spondin 1. The National Center for Biotechnology Information. Available online: https://www.ncbi.nlm.nih.gov/gene/10418 (accessed on 2 May 2024).
  29. SS18 SS18 Subunit of BAF Chromatin Remodeling Complex. The National Center for Biotechnology Information. Available online: https://www.ncbi.nlm.nih.gov/gene/6760 (accessed on 2 May 2024).
  30. TAF4B TATA-box Binding Protein Associated Factor 4b. The National Center for Biotechnology Information. Available online: https://www.ncbi.nlm.nih.gov/gene/6875 (accessed on 2 May 2024).
  31. Jiang, J.; Ma, L.; Prakapenka, D.; VanRaden, P.M.; Cole, J.B.; Da, Y. A large-scale genome-wide association study in US Holstein cattle. Front. Genet. 2019, 10, 412. [Google Scholar] [CrossRef]
  32. RASGRP1 RAS Guanyl Releasing Protein 1. Available online: https://www.ncbi.nlm.nih.gov/gene/10125 (accessed on 2 May 2024).
  33. LIPC Lipase C, Hepatic Type. Available online: https://www.ncbi.nlm.nih.gov/gene/3990 (accessed on 2 May 2024).
  34. Ma, L.; Runesha, H.B.; Dvorkin, D.; Garbe, J.; Da, Y. Parallel and serial computing tools for testing single-locus and epistatic SNP effects of quantitative traits in genome-wide association studies. BMC Bioinform. 2008, 9, 315. [Google Scholar] [CrossRef]
  35. Weeks, N.T.; Luecke, G.R.; Groth, B.M.; Kraeva, M.; Ma, L.; Kramer, L.M.; Koltes, J.E.; Reecy, J.M. High-performance epistasis detection in quantitative trait GWAS. Int. J. High Perform. Comput. Appl. 2016, 32, 1094342016658110. [Google Scholar] [CrossRef]
  36. Henderson, C. Applications of Linear Models in Animal Breeding; University of Guelph: Guelph, ON, Canada, 1984. [Google Scholar]
  37. Prakapenka, D.; Liang, Z.; Zaabza, H.B.; VanRaden, P.M.; Van Tassell, C.P.; Da, Y. A million-cow validation of a chromosome 14 region interacting with all chromosomes for fat percentage in US Holstein cows. Int. J. Mol. Sci. 2024, 25, 674. [Google Scholar] [CrossRef] [PubMed]
  38. Mao, Y.; London, N.R.; Ma, L.; Dvorkin, D.; Da, Y. Detection of SNP epistasis effects of quantitative traits using an extended Kempthorne model. Physiol. Genom. 2006, 28, 46–52. [Google Scholar] [CrossRef] [PubMed]
  39. Falconer, D.S.; Mackay, T.F.C. Introduction to Quantitative Genetics, 4th ed.; Longmans Green: Harlow, UK, 1996. [Google Scholar]
Figure 1. Graphical view of additive effects. (a) Manhattan plot of additive effects of all chromosomes. (b) allelic effects of the 151 significant SNPs. ‘u’ indicates the SNP is upstream of the gene. ‘d’ indicates the SNP is downstream of the gene.
Ijms 25 05551 g001
Figure 2. Additive effects of Chr09 and Chr23. (a) Statistical significance of additive effects of Chr09 SNPs. (b) Statistical significance of additive effects of Chr23 SNPs. ‘u’ indicates the SNP is upstream of the gene.
Ijms 25 05551 g002
Figure 3. Additive effects of Chr05 and Chr17. (a) Statistical significance of additive effects of Chr05 SNPs. (b) Statistical significance of additive effects of Chr17 SNPs. ‘d’ indicates the SNP is downstream of the gene.
Ijms 25 05551 g003
Figure 4. Additive effects of Chr15, Chr24, Chr31 and Chr06. (a) Statistical significance of additive effects of Chr15 SNPs. (b) Statistical significance of additive effects of Chr24 SNPs. (c) Statistical significance of additive effects of Chr31 SNPs. (d) Statistical significance of additive effects of Chr06 SNPs. ‘u’ indicates the SNP is upstream of the gene. ‘d’ indicates the SNP is downstream of the gene.
Ijms 25 05551 g004
Table 1. Significant additive effects of Chr09 for RETP.
SNPPositionCandidate GeneEffectLog10(1/p)al+ae+f_al+al−ae−f_al−
rs4202692687610236PLEKHG1 (u)0.18313.7410.0800.5642−0.1030.436
rs4202691487634273PLEKHG1 (u)0.15810.7510.0750.5262−0.08330.474
rs4361560988220932MTHFD1L (d)0.17511.8010.0620.6442−0.1120.356
rs4361554488254314AKAP12 (u)−0.21015.9620.0620.7061−0.1480.294
rs4361298388482928RMND10.19715.1010.0700.6432−0.1270.357
rs4361171988519048LOC112448080−0.24621.1620.0710.711−0.1750.29
rs4361171088529494CCDC170−0.19915.7620.0700.6461−0.1280.354
rs4361170188540232CCDC170−0.18214.3320.0810.5561−0.1020.444
rs4361053988598336CCDC170−0.18913.1320.0570.6991−0.1320.301
rs4360856788684552ESR1−0.17712.7020.0630.6421−0.1140.358
rs342329786588722921ESR10.18813.4610.0680.6412−0.120.359
rs4376710888739977ESR10.18813.4810.0680.6412−0.1210.359
‘u’ indicates the SNP is upstream of the gene. ‘d’ indicates the SNP is downstream of the gene. ‘effect’ is the additive effect of the SNP as the difference between allelic effects of ‘allele 1’ and ‘allele 2’ (Equation (6)). ‘al+’ is the positive allele, ‘al–’ is the negative allele, ‘ae+’ is the allelic effect of the positive allele, and ‘ae−’ is the allelic effect of the negative allele (Equation (7)). ‘f_al+’ is the frequency of the positive allele. ‘f_al−’ is the frequency of the negative allele.
Table 2. Top-20 significant additive effects of Chr23 for RETP.
SNPPositionCandidate GeneEffectLog10(1/p)al+ae+f_al+al−ae−f_al−
rs11055613523704336PKHD1 (u)0.22413.3310.0420.8132−0.1820.187
rs4356175523750046PKHD1 (u)−0.21611.7520.0390.8191−0.1770.181
BTA-81662-no-rs23890370PKHD1 (u)−0.16611.3020.0620.6291−0.1040.371
rs4167020924060064PKHD1 (u)−0.18311.8820.0520.7181−0.1310.282
rs13618178624252119PKHD1−0.18011.9420.0580.681−0.1230.32
rs13776210825024407LOC112443711-LOC112443751−0.19912.6520.0510.7461−0.1480.254
rs13583237825119540GSTA1 (u)0.18613.9510.0730.6092−0.1130.391
rs11014457525142236GSTA50.21811.5410.0390.8212−0.1790.179
rs11004319925175265LOC1124437300.21912.1410.0390.822−0.1800.18
rs13514607625491332ELOVL5, BOLA-DQA2−0.19014.4820.0670.6451−0.1230.355
rs13317732927122907ENSBTAG000000483040.17212.1510.1050.3882−0.0670.612
rs11035820327231641PPT2−0.19214.5120.1240.3531−0.0680.647
rs11027746228345983DHX160.18613.7210.1210.3512−0.0650.649
rs342350451528367574MRPS18B0.19314.7810.1260.352−0.0680.65
rs342351403128777609LOC7858730.18313.5010.1150.3732−0.0680.627
rs342349410528783122TRIM260.19312.4810.0510.7372−0.1420.263
rs342349887831063056TRNAF-GAA_18,
TRNAI-UAU_6
−0.16511.7520.0850.4861−0.0800.514
rs10982190432057953SLC17A1−0.19615.5020.1250.3631−0.0710.637
rs13469846332498379CARMIL1−0.17813.4620.0860.5141−0.0910.486
rs342350940433077628ACOT13−0.17713.6520.0850.5171−0.0910.483
‘u’ indicates the SNP is upstream of the gene. ‘effect’ is the additive effect of the SNP as the difference between allelic effects of ‘allele 1’ and ‘allele 2’ (Equation (6)). ‘al+’ is the positive allele, ‘al–‘ is the negative allele, ‘ae+’ is the allelic effect of the positive allele, and ‘ae−’ is the allelic effect of the negative allele (Equation (7)). ‘f_al+’ is the frequency of the positive allele. ‘f_al−’ is the frequency of the negative allele.
Table 3. Significant additive effects of Chr05 and Chr17 for RETP.
SNPChrPositionCandidate GeneEffectLog10(1/p)al+ae+f_al+al−ae−f_al−
rs110165899527005657KRT18-KRT80.18413.5110.1180.3582−0.0660.642
rs41587994518367350KITLG (d)0.19813.2210.1470.2582−0.0510.742
rs41603721519295836POC1B−0.18713.0620.1290.3071−0.0570.693
rs29012239518679362LOC104972350-
LOC104972370
0.18512.5110.1310.2922−0.0540.708
rs135127542526178969CALCOCO1 (u)−0.17811.9920.1220.3131−0.0560.687
rs136124246517909902CEP2900.17611.9110.1170.3322−0.0580.668
rs110506590517780338C5H12orf50 (u)0.17511.8410.1170.3322−0.0580.668
rs137107793528970729HIGD1C0.16211.1910.0700.5642−0.0910.436
rs137455368518799786LOC104972350-
LOC104972370
0.16110.7510.1010.3732−0.0600.627
rs109747382519468540ATP2B1 (u)−0.15910.5820.0990.3761−0.0600.624
rs1107394491715056547LOC112442091−0.18714.9420.0790.5751−0.1070.425
rs1359124161712902838LOC112441992-
LOC112442089
−0.18013.7020.0920.4871−0.0880.513
rs1372190131713350634ANAPC10-HHIP0.17613.3110.0780.5592−0.0980.441
rs1095721611716399921IL15-ZNF330−0.17413.1820.0790.5461−0.0950.454
rs1094867881717090817TBC1D90.16911.8810.0770.5432−0.0920.457
rs1089731451716489833IL15-ZNF330−0.16411.6420.0720.5611−0.0920.439
rs1375045121713801294TRNAC-GCA_189,
TRNAG-UCC_41
−0.16311.3420.0810.5031−0.0820.497
rs418387121712116917REELD10.16811.3210.1020.3942−0.0660.606
rs415996011712866447LOC1124419920.16011.2810.0750.5312−0.0850.469
‘u’ indicates the SNP is upstream of the gene. ‘d’ indicates the SNP is downstream of the gene. ‘effect’ is the additive effect of the SNP as the difference between allelic effects of ‘allele 1’ and ‘allele 2’ (Equation (6)). ‘al+’ is the positive allele, ‘al–’ is the negative allele, ‘ae+’ is the allelic effect of the positive allele, and ‘ae−’ is the allelic effect of the negative allele (Equation (7)). ‘f_al+’ is the frequency of the positive allele. ‘f_al−’ is the frequency of the negative allele.
Table 4. Significant additive effects of seven selected chromosomes for RETP.
SNPChrPositionCandidate GeneEffectLog10(1/p)al+ae+f_al+al−ae−f_al−
rs109034709687316810NPFFR2−0.1529.5320.0570.6281−0.0960.372
rs110434046687184768GC-NPFFR2−0.1529.4720.0560.6281−0.0950.372
rs137664040686795926SLC4A4−0.1438.4520.0570.6031−0.0860.397
rs342322482478274451OR7A5 (d)−0.17410.1820.1280.2641−0.0460.736
rs1097181301034176744RASGRP1−0.1508.4120.0470.6891−0.1040.311
rs436269661051788612LIPC0.1668.2310.0360.7852−0.1300.215
rs1332964291565887087SLC1A20.16311.4610.0720.562−0.0910.440
rs1102223191528670668IL10RA0.2009.8810.0350.8272−0.1650.173
rs1334811541538458720SPON10.1989.8310.0350.8232−0.1630.177
rs1102359301961387218ABCA10−0.1539.6220.0570.6251−0.0960.375
rs419323131961518347ABCA9−0.1799.2420.0380.7881−0.1410.212
rs437727362430783746SS18 (d)0.17813.6810.0780.5592−0.0990.441
rs1361033422430564828TAF4B−0.17913.5120.0760.5791−0.1040.421
rs2077304782430578431TAF4B−0.17012.4720.0720.5791−0.0990.421
rs1101900492430486009KCTD1-TAF4B−0.16711.9520.0700.5791−0.0970.421
rs1333769883189494444MAGED1-MAGED4B0.29910.4110.0220.9272−0.2770.073
rs1362682233189068436NUDT11 (d)−0.18410.3620.0420.7721−0.1420.228
rs1376834003189839370LOC100297099−0.2269.3220.0270.8831−0.2000.117
‘d’ indicates the SNP is downstream of the gene. ‘effect’ is the additive effect of the SNP as the difference between allelic effects of ‘allele 1’ and ‘allele 2’ (Equation (6)). ‘al+’ is the positive allele, ‘al–’ is the negative allele, ‘ae+’ is the allelic effect of the positive allele, and ‘ae−’ is the allelic effect of the negative allele (Equation (7)). ‘f_al+’ is the frequency of the positive allele. ‘f_al−’ is the frequency of the negative allele.
Disclaimer/Publisher’s Note: The statements, opinions and data contained in all publications are solely those of the individual author(s) and contributor(s) and not of MDPI and/or the editor(s). MDPI and/or the editor(s) disclaim responsibility for any injury to people or property resulting from any ideas, methods, instructions or products referred to in the content.

