Article

Identification and Functional Analysis of KH Family Genes Associated with Salt Stress in Rice

1
Zhejiang Provincial Key Laboratory for Genetic Improvement and Quality Control of Medicinal Plants, College of Life and Environmental Science, Hangzhou Normal University, Hangzhou 311121, China
2
Institute of Crop and Nuclear Technology Utilization, Zhejiang Academy of Agricultural Sciences, Hangzhou 310021, China
*
Author to whom correspondence should be addressed.
Int. J. Mol. Sci. 2024, 25(11), 5950; https://doi.org/10.3390/ijms25115950
Submission received: 17 March 2024 / Revised: 22 May 2024 / Accepted: 23 May 2024 / Published: 29 May 2024
(This article belongs to the Special Issue Advance in Plant Abiotic Stress)

Abstract

:
Salinity stress has a great impact on crop growth and productivity and is one of the major factors responsible for crop yield losses. The K-homologous (KH) family proteins play vital roles in regulating plant development and responding to abiotic stress in plants. However, the systematic characterization of the KH family in rice is still lacking. In this study, we performed genome-wide identification and functional analysis of KH family genes and identified a total of 31 KH genes in rice. According to the homologs of KH genes in Arabidopsis thaliana, we constructed a phylogenetic tree with 61 KH genes containing 31 KH genes in Oryza sativa and 30 KH genes in Arabidopsis thaliana and separated them into three major groups. In silico tissue expression analysis showed that the OsKH genes are constitutively expressed. The qRT-PCR results revealed that eight OsKH genes responded strongly to salt stresses, and OsKH12 exhibited the strongest decrease in expression level, which was selected for further study. We generated the Oskh12-knockout mutant via the CRISPR/Cas9 genome-editing method. Further stress treatment and biochemical assays confirmed that Oskh12 mutant was more salt-sensitive than Nip and the expression of several key salt-tolerant genes in Oskh12 was significantly reduced. Taken together, our results shed light on the understanding of the KH family and provide a theoretical basis for future abiotic stress studies in rice.

1. Introduction

The K-homologous (KH) family proteins belong to DNA/RNA-binding proteins containing the conserved KH domain. The KH domain was first identified in human heterogeneous nuclear ribonucleoprotein K (hnRNPK) [1], which consists of approximately 70 amino acids that can be folded into two completely different ways, named type Ⅰ and type Ⅱ folding, respectively [2,3]. The KH family genes play important biological functions in animals. For example, HRPK-1, a KH domain protein, controls Caenorhabditis elegance development by affecting miRNA processing and enhancing miRNA/miRISC gene regulatory activity [4]. KHSPR (KH-type splicing regulatory protein) provided a potential link with human diseases [5]. SAM68 (also known as KH-domain-containing, RNA-binding, signal-transduction-associated 1 (KHDRBS1)) plays vital roles in human cancers including lung adenocarcinoma [6], hepatic gluconeogenesis [7], and breast cancer [8].
In addition to their important functions in animals, KH family genes also play an important role in plants, which have been shown to participate in plant growth, development, and hormone-related processes, and adapt to environmental stresses. Several members of the KH family were reported to be involved in flowering time. For instance, FLK, GRP7, GRP8, KHZ1, and KHZ2 function as flowering promoters, while PEPPER, FLY, and HEN4 function as flowering suppressors in Arabidopsis thaliana [9,10,11,12,13,14,15,16]. In rice, SPIN1, a KH protein ubiquitinated by the E3 ubiquitin ligase SPL11, delays flowering independently of day length [17]. Recent studies have shown that AtKH9 (At2g38610) and AtKH29 (At5g56140) can respond to abscisic acid (ABA) and salicylic acid (SA) in Arabidopsis thaliana [18]. ABA plays an important role in plant adaptation to abiotic stress. KH proteins are involved in the process of abiotic stress in plants. KH domain protein REGULATOR OF CBF GENE EXPRESSION 3 (RCF3) negatively regulates heat stress by impacting the expression of heat stress factors in Arabidopsis thaliana [19]. HOS5 (High Osmotic Stress Gene Expression 5) and AtSIEK (stress-induced protein with EXD1-like domain and KH domain) are both K homology (KH)-domain RNA-binding proteins that interact with FRY2/CPL1 whose mutants exhibit both ABA and salt-sensitive phenotypes [20,21,22,23]. The KH family genes have been widely identified and studied in Arabidopsis. However, the functional analysis of the KH family genes in rice was seldom reported.
Rice (Oryza sativa) is one of the most important crops in the world, and salinity stress is rated as one of the major abiotic stresses [24]. Soil saline–alkalization is a major abiotic stressor on the world’s agriculture, causing considerable damage to crop growth and resulting in serious losses in crop production [25,26,27]. The salt overly sensitive (SOS) signaling pathway plays a central role in exporting Na+ from the cytosol to the apoplast and conferring salt tolerance in plants [28,29,30,31,32]. Moreover, the salt tolerance of plants is also regulated by hormones such as ABA. ABA, as a signal molecule, regulates salt tolerance by mediating the expression of salt stress genes. Many genes regulating salt stress tolerance in rice have been identified. SOS1, AKT1, NHX2, HKT2;1, and SKC1(HKT1;5) are key regulators that positively modulate rice salt tolerance by maintaining homeostasis of K+/Na+ [29,33]. The core of ABA regulating plant salt tolerance is the activation and transcriptional regulation of SnRK2 protein kinase on multiple downstream target genes, thereby directly or indirectly regulating plant salt tolerance [34,35]. For example, the rice zinc finger protein OsbZIP23, containing ABRE elements in the promoter region, increases the susceptibility to salt and ABA in rice [36]. GmSIN1 (SALT INDUCED NAC1) is induced by ABA and promotes root growth and salt tolerance in Glycine max, and the GmSIN1 transcription factor directly binds to the SIN1BM element on the promoters of salt tolerance genes, thereby regulating the response to salt stress [37]. Despite numerous genes that have been identified regulating salt stress in rice, the function of KH family genes in responding to salt stress remains unknown.
In this study, we systematically performed genome-wide identification and analysis of the KH family genes in rice, which bridges the research gap for KH gene family studies in rice. A total of 31 KH genes were identified, which were uniformly distributed in 12 chromosomes. The phylogeny and evolutionary relationships, conserved motifs, gene expression, and cis-element of KH family genes were comprehensively performed. The gene expression profiling revealed that all OsKH genes are constitutively expressed in various rice tissues. Furthermore, qRT-PCR analysis showed that the expressions of OsKH1, OsKH10, OsKH12, OsKH13, OsKH18, OsKH27, and OsKH29 are significantly affected under salt stress. To elucidate the function of OsKH12 in salt responses, with the highest decrease in expression level, we generated the Oskh12 CRISPR knockout mutant. Further molecular experiments confirmed that Oskh12 decreased tolerance to salt stress and the expression of several key salt-tolerant genes in Oskh12 was significantly reduced, indicating that the Oskh12 mutant was more salt-sensitive than Nip. In conclusion, this study systematically analyzed the response of the KH family genes in response to salt stress in rice for the first time and provided new genetic resources for rice breeding.

2. Results

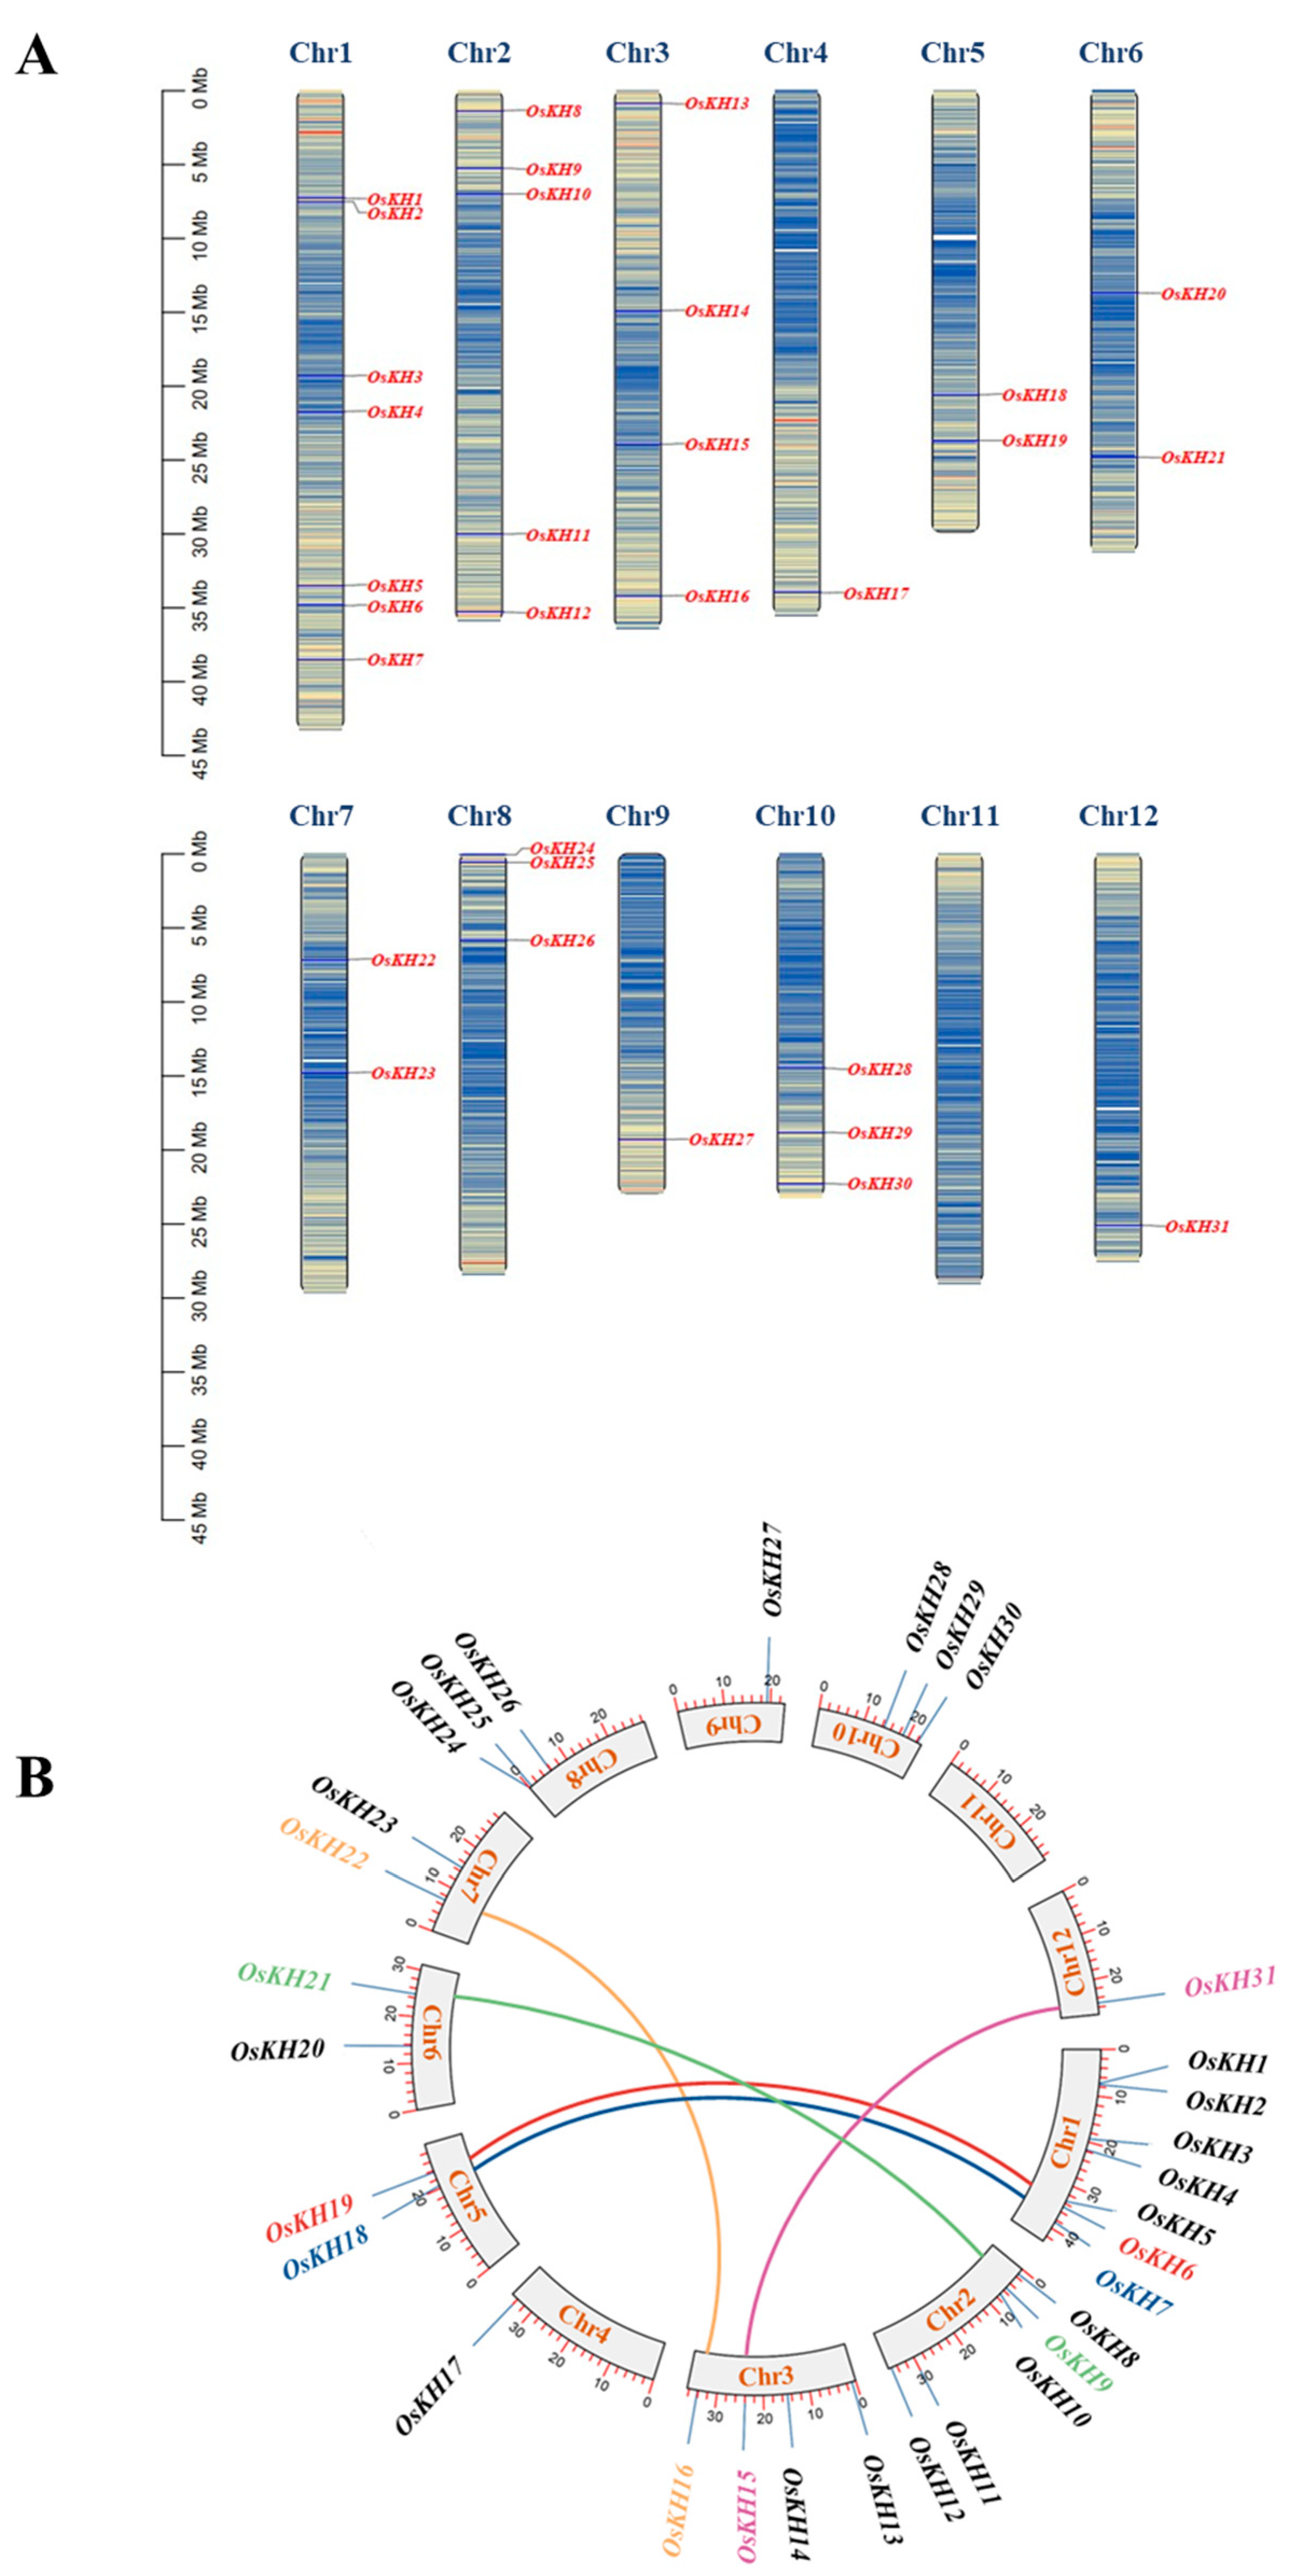
2.1. Identification and Chromosomal Location of KH Family Genes in Rice

To identify the KH family members in rice, the CDSs of KH genes in rice were downloaded from the Phytozome website (https://phytozome-next.jgi.doe.gov/, accessed on 4 January 2024). A total of 31 KH family genes were finally screened and identified in rice. To understand the distribution characteristics of OsKH genes on chromosomes, the chromosomal locations of OsKH genes were analyzed by TBtools and results revealed that the 31 OsKH genes, not the gene clusters, were distributed on almost all twelve chromosomes, except for chromosome 11, and chromosome 1 has the most OsKH genes with seven (Figure 1A). These KH genes were named according to their position on the chromosome, in the order of OsKH1 to OsKH31. Gene duplication analysis predicted five OsKH gene pairs in the rice genome, making a total of ten duplicated genes, including OsKH6/OsKH19, OsKH7/OsKH18, OsKH9/OsKH21, OsKH15/OsKH31, and OsKH16/OsKH22 (Figure 1B). The duplication of rice KH genes was analyzed by the Advanced Circos of TBtools software v2.096. Amino acid sequence alignment showed that the KH domain of these genes has the highest similarity (Figure S1). These results demonstrated that several KH genes may appear in the course of gene duplication, and the segmental duplication events may be responsible for the expansion of KH genes in rice.
To explore the potential functions of the KH family genes, the CDSs of identified KH genes were downloaded from the Tair website (https://www.arabidopsis.org/, accessed on 4 January 2024). The comprehensive information of 31 OsKH genes and 30 AtKH genes was analyzed and is summarized in Table 1, including the number of amino acids, molecular weight (MW), theoretical PI, instability index, aliphatic index, the grand average of hydropathicity, and the subcellular location. These protein characteristics were analyzed through the Protein Paramter Calc of TBtools software v2.096 and the protein subcellular localization prediction of KH family proteins was analyzed by the PSORT website (https://wolfpsort.hgc.jp/, accessed on 4 January 2024). Among them, AtKH30 encoded the largest protein, containing 866 amino acids, while OsKH3 encoded the smallest protein, consisting of 133 amino acids. The protein molecular weight (MW) and isoelectric point (PI) of these proteins range from 14.7 (OsKH3) to 94.7 kDa (AtKH30), and 4.16 (AtKH5) to 10.07 (OsKH3), respectively. According to the analysis of the grand average of hydropathicity, the KH family proteins are generally hydrophilic (Table 1). To analyze subcellular localization, all KH proteins were predicted by the PSORT website. The results showed that most KH proteins (50.82%) are located in the nucleus, which is consistent with the localization characteristics of the RNA-binding protein. In addition, 24.6% of proteins are located in the cytoplasm, 14.75% of proteins are likely to be located in the chloroplast, and small partial proteins are separately located in the mitochondria (AtKH7 and OsKH2), cytoskeleton (OsKH5 and OsKH12), and peroxisome (AtKH5), which implies that the KH proteins may also play a function in chloroplast or mitochondria (Table 1).

2.2. Phylogenetic and Synteny Analysis of KH Genes in Arabidopsis thaliana and Oryza sativa

To investigate the genetic phylogenetic relationship of the KH family genes, the protein sequences of Arabidopsis thaliana (30 members) and Oryza sativa (31 members) were downloaded from the Phytozome website (https://phytozome-next.jgi.doe.gov/, accessed on 4 January 2024) and the Tair website (https://www.arabidopsis.org/, accessed on 4 January 2024), respectively, and were used to construct phylogenetic trees by MEGA7 using the neighbor-joining method. According to the phylogenetic tree, the 61 KH genes were classified into three groups: Group 1, Group 2, and Group 3. Group 1 consisted of the largest number of KH members, with 28 genes, followed by Group 2 with 23 genes, while Group 3 had the smallest with only 10 genes. Group 1 contained 13 and 15 KH genes in rice and Arabidopsis, respectively; Group 2 contained 12 and 11 KH genes in rice and Arabidopsis, respectively; and Group 3 contained 6 and 4 KH genes in rice and Arabidopsis, respectively (Figure 2A). Interestingly, the ratio of OsKH to AtKH in each group was almost 1:1, indicating that the KH family genes are conserved between the two species.
To further analyze the evolutionary relationship between KH genes of rice and Arabidopsis, we performed a comparative synteny analysis between Arabidopsis thaliana and Oryza sativa using the Dual Systeny Plot of TBtools software v2.096 (Figure 2B). There was a linear relationship in five pairs of genes, including AtKH3/OsKH25, AtKH9/OsKH6, AtKH11/OsKH6, AtKH11/OsKH19, and AtKH29/OsKH11, between the two species. The coding sequences of the five gene pairs are 850 to 2290 bp (Figure 2B and Table 1). This finding indicated that the KH genes were highly conserved in evolutionary terms.

2.3. Conserved Motif and Domain Analysis of the KH Family Proteins

To explore the potential functions of KH family proteins in detail, the conserved motif and domain of 61 KH proteins were analyzed using the MEME website (Figure 3). A total of 10 conserved motifs were identified and the detail motifs are shown in Figure S2. Notably, the three groups had significantly different compositions of motifs. The proteins of Group 1 contains ten motifs and has the largest number of motifs, and almost all genes in Group 1 contain motif 2, motif 5, motif 6, and motif 7. However, Group 2 mainly contained three motifs and most members of Group 3 contained two motifs (Figure 3A). Interestingly, motif 1 was found in almost all KH proteins in rice and Arabidopsis, while motif 3 and motif 4 were only found in the KH proteins of Group 2.
Conserved domain information was calculated by Batch CD-Search on the NCBI website and then visualized by the Gene Structure View of TBtools software v2.096. Conserved domain analysis revealed that nine domains exist in the KH family and the KH domain was found in entire KH members. In addition, Group 1 members contain the most KH domains, from two to five, and Group 2 members mainly contain both one KH domain and one other domain, such as STAR, ZnF_C3H1, and zf-CCCH (Figure 3B). Furthermore, the members of Group 3 included the KH domains, and most of them had only one KH domain (Figure 3B).

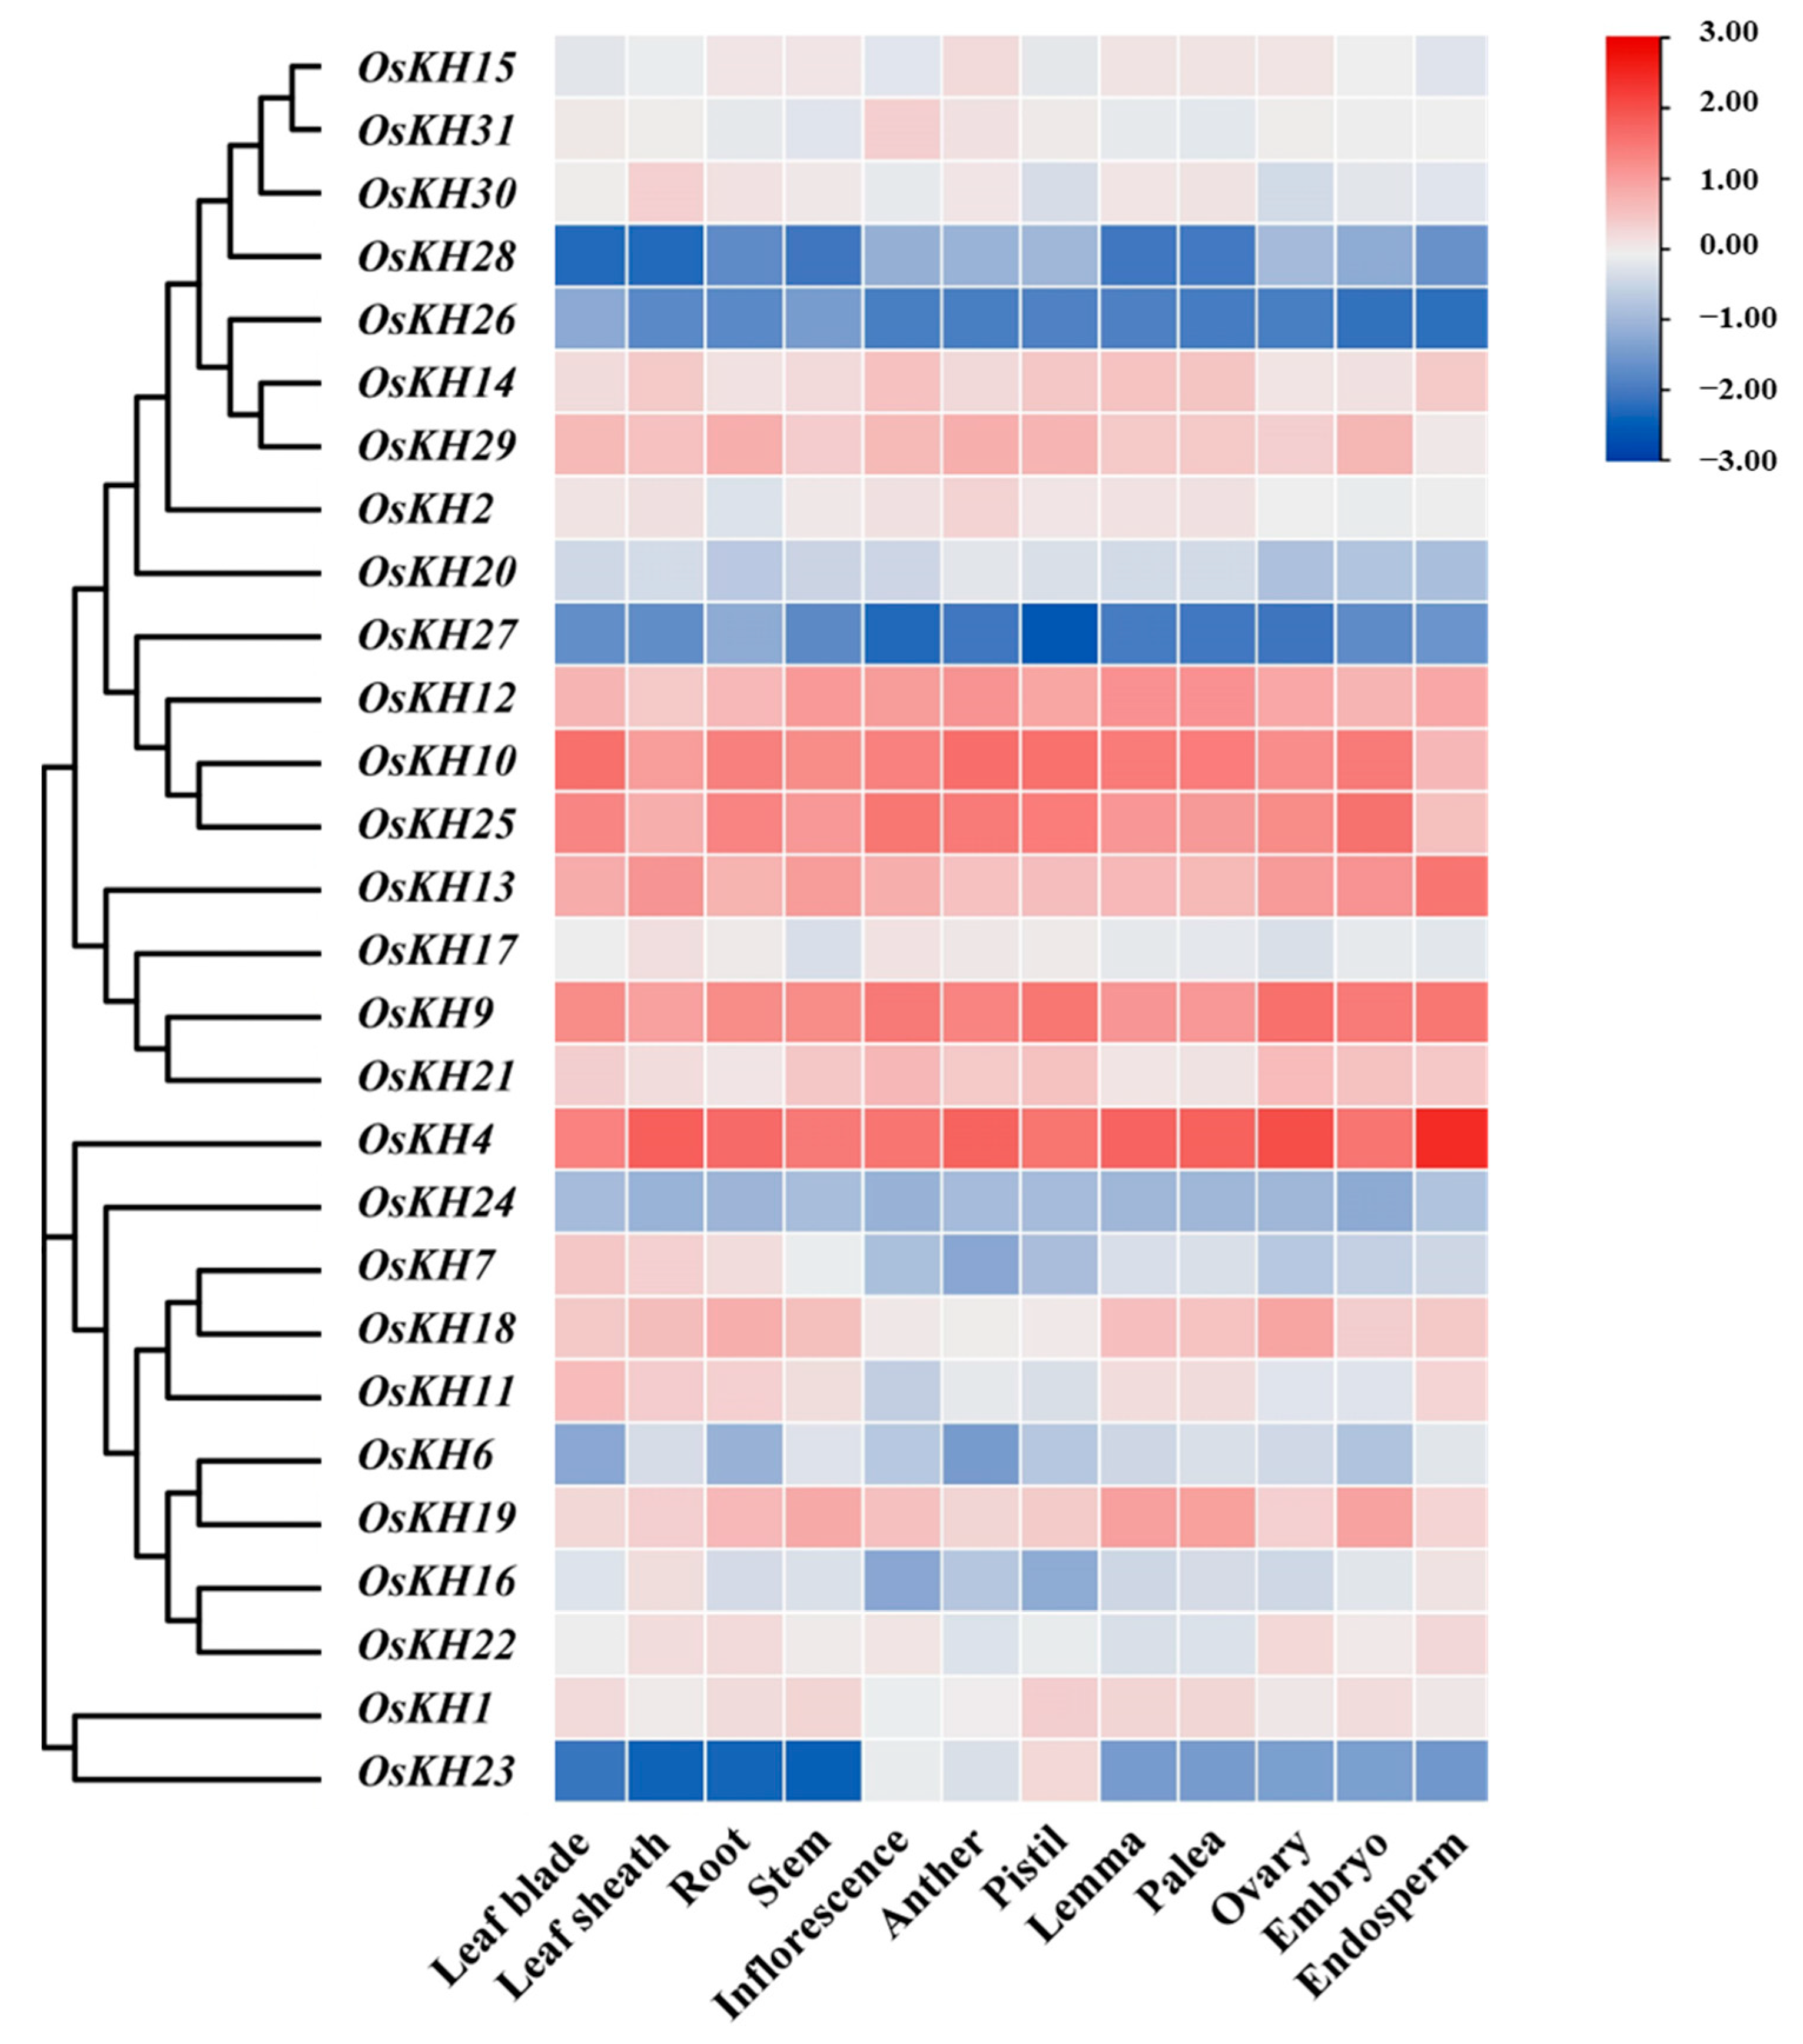
2.4. Tissues Expression Analysis of KH Members in Oryza sativa

The tissue-specific expression patterns of genes reflect their action sites and mechanisms. To analyze the expression profiles of KH genes in different tissues of rice, we screened the expression levels of OsKH genes in 12 rice tissues, including leaf blade, leaf sheath, root, stem, inflorescence, anther, pistil, lemma, palea, ovary, embryo, and endosperm, which were downloaded from the rice public database of RiceXPro (https://ricexpro.dna.affrc.go.jp/, accessed on 6 January 2024) and then visualized by the HeatMap of TBtools software v2.096. According to the expression results, KH genes showed slight differences in tissue expression. In general, most of the OsKH genes such as OsKH4, OsKH9, OsKH12, OsKH13, and OsKH25 are constitutively expressed in these twelve tissues in rice. However, there are also a small number of OsKH genes that are not constitutively expressed. For example, the expressions of OsKH23 in inflorescence, anther, and pistil are significantly higher than other tissues of the twelve tissues (Figure 4). Specifically, OsKH4, OsKH9, OsKH10, OsKH12, OsKH13, and OsKH25 were evolutionarily close and had high expression levels in all rice tissues. On the contrary, OsKH23, OsKH26, OsKH27, and OsKH28 showed low expression levels in the twelve tissues of rice (Figure 4). These results show that the genes that are more evolutionarily closely related have similar expression patterns. In brief, these data indicated that the KH genes may play a key role in the formation and development of different tissues with varied expression levels in rice.

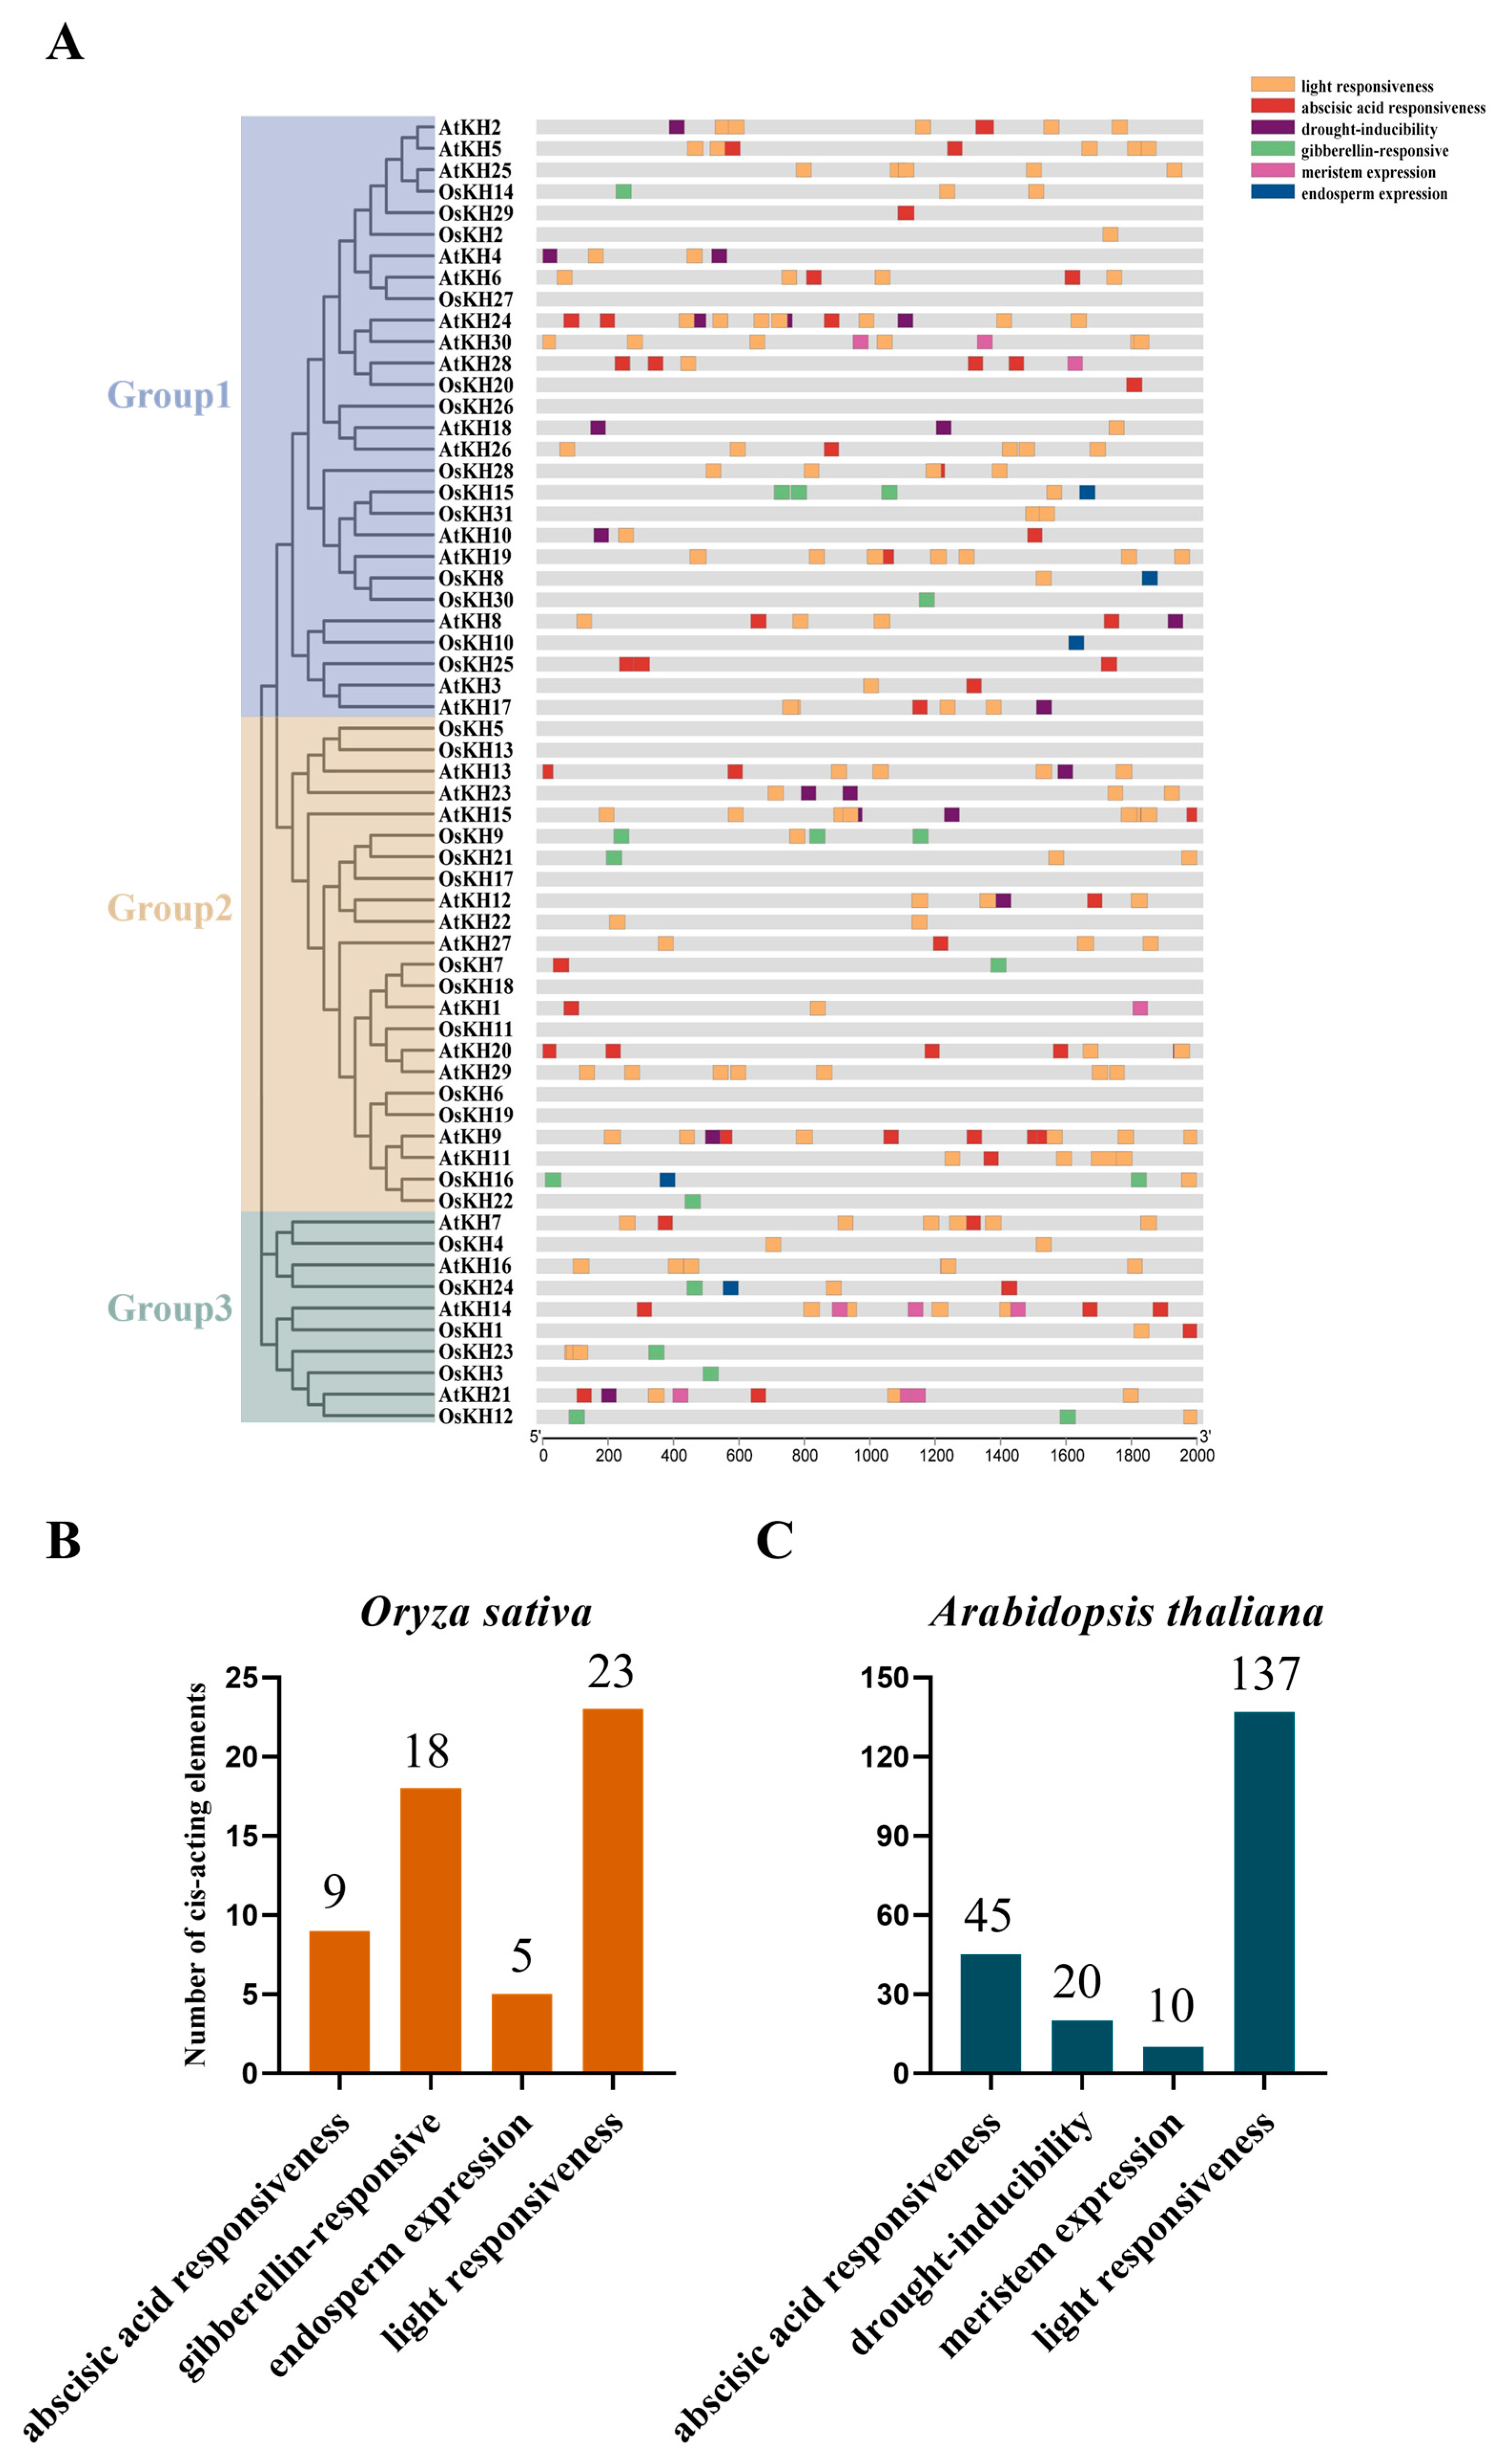
2.5. Cis-Acting Element Analysis of KH Gene Promoters

To explore the potential functions of KH family genes, the 2000 bp upstream sequences of 61 KH genes in Oryza sativa and Arabidopsis thaliana were extracted from the NCBI website (https://www.ncbi.nlm.nih.gov/, accessed on 6 January 2024) to analyze the potential cis-elements using the PlantCARE (https://bioinformatics.psb.ugent.be/webtools/plantcare/html/, accessed on 6 January 2024) website and visualized by the Basic Biosequence View of TBtools software v2.096. The promoter regions of KH genes were analyzed (Figure 5), and six main responsive elements were identified, related to ABA (abscisic acid), GA (gibberellin), drought stress, endosperm, meristem, and light responsiveness. Among them, GA and endosperm expression elements are specific to the KH genes of Oryza sativa in these two species, while drought-inducibility and meristem expression elements are unique to the KH genes of Arabidopsis thaliana compared to rice (Figure 5A). In rice, there are 9 ABA responsiveness elements, 18 GA-responsive elements, and 5 endosperm expression elements (Figure 5B). In Arabidopsis thaliana, there are 45 ABA responsiveness elements, 20 drought-inducibility elements, 10 meristem expression elements, 137 light responsiveness elements, and no GA-responsive and endosperm expression elements (Figure 5C). These results suggest that KH family genes are involved in plant growth and development, and play an important role in plant response to hormone and abiotic stress response.

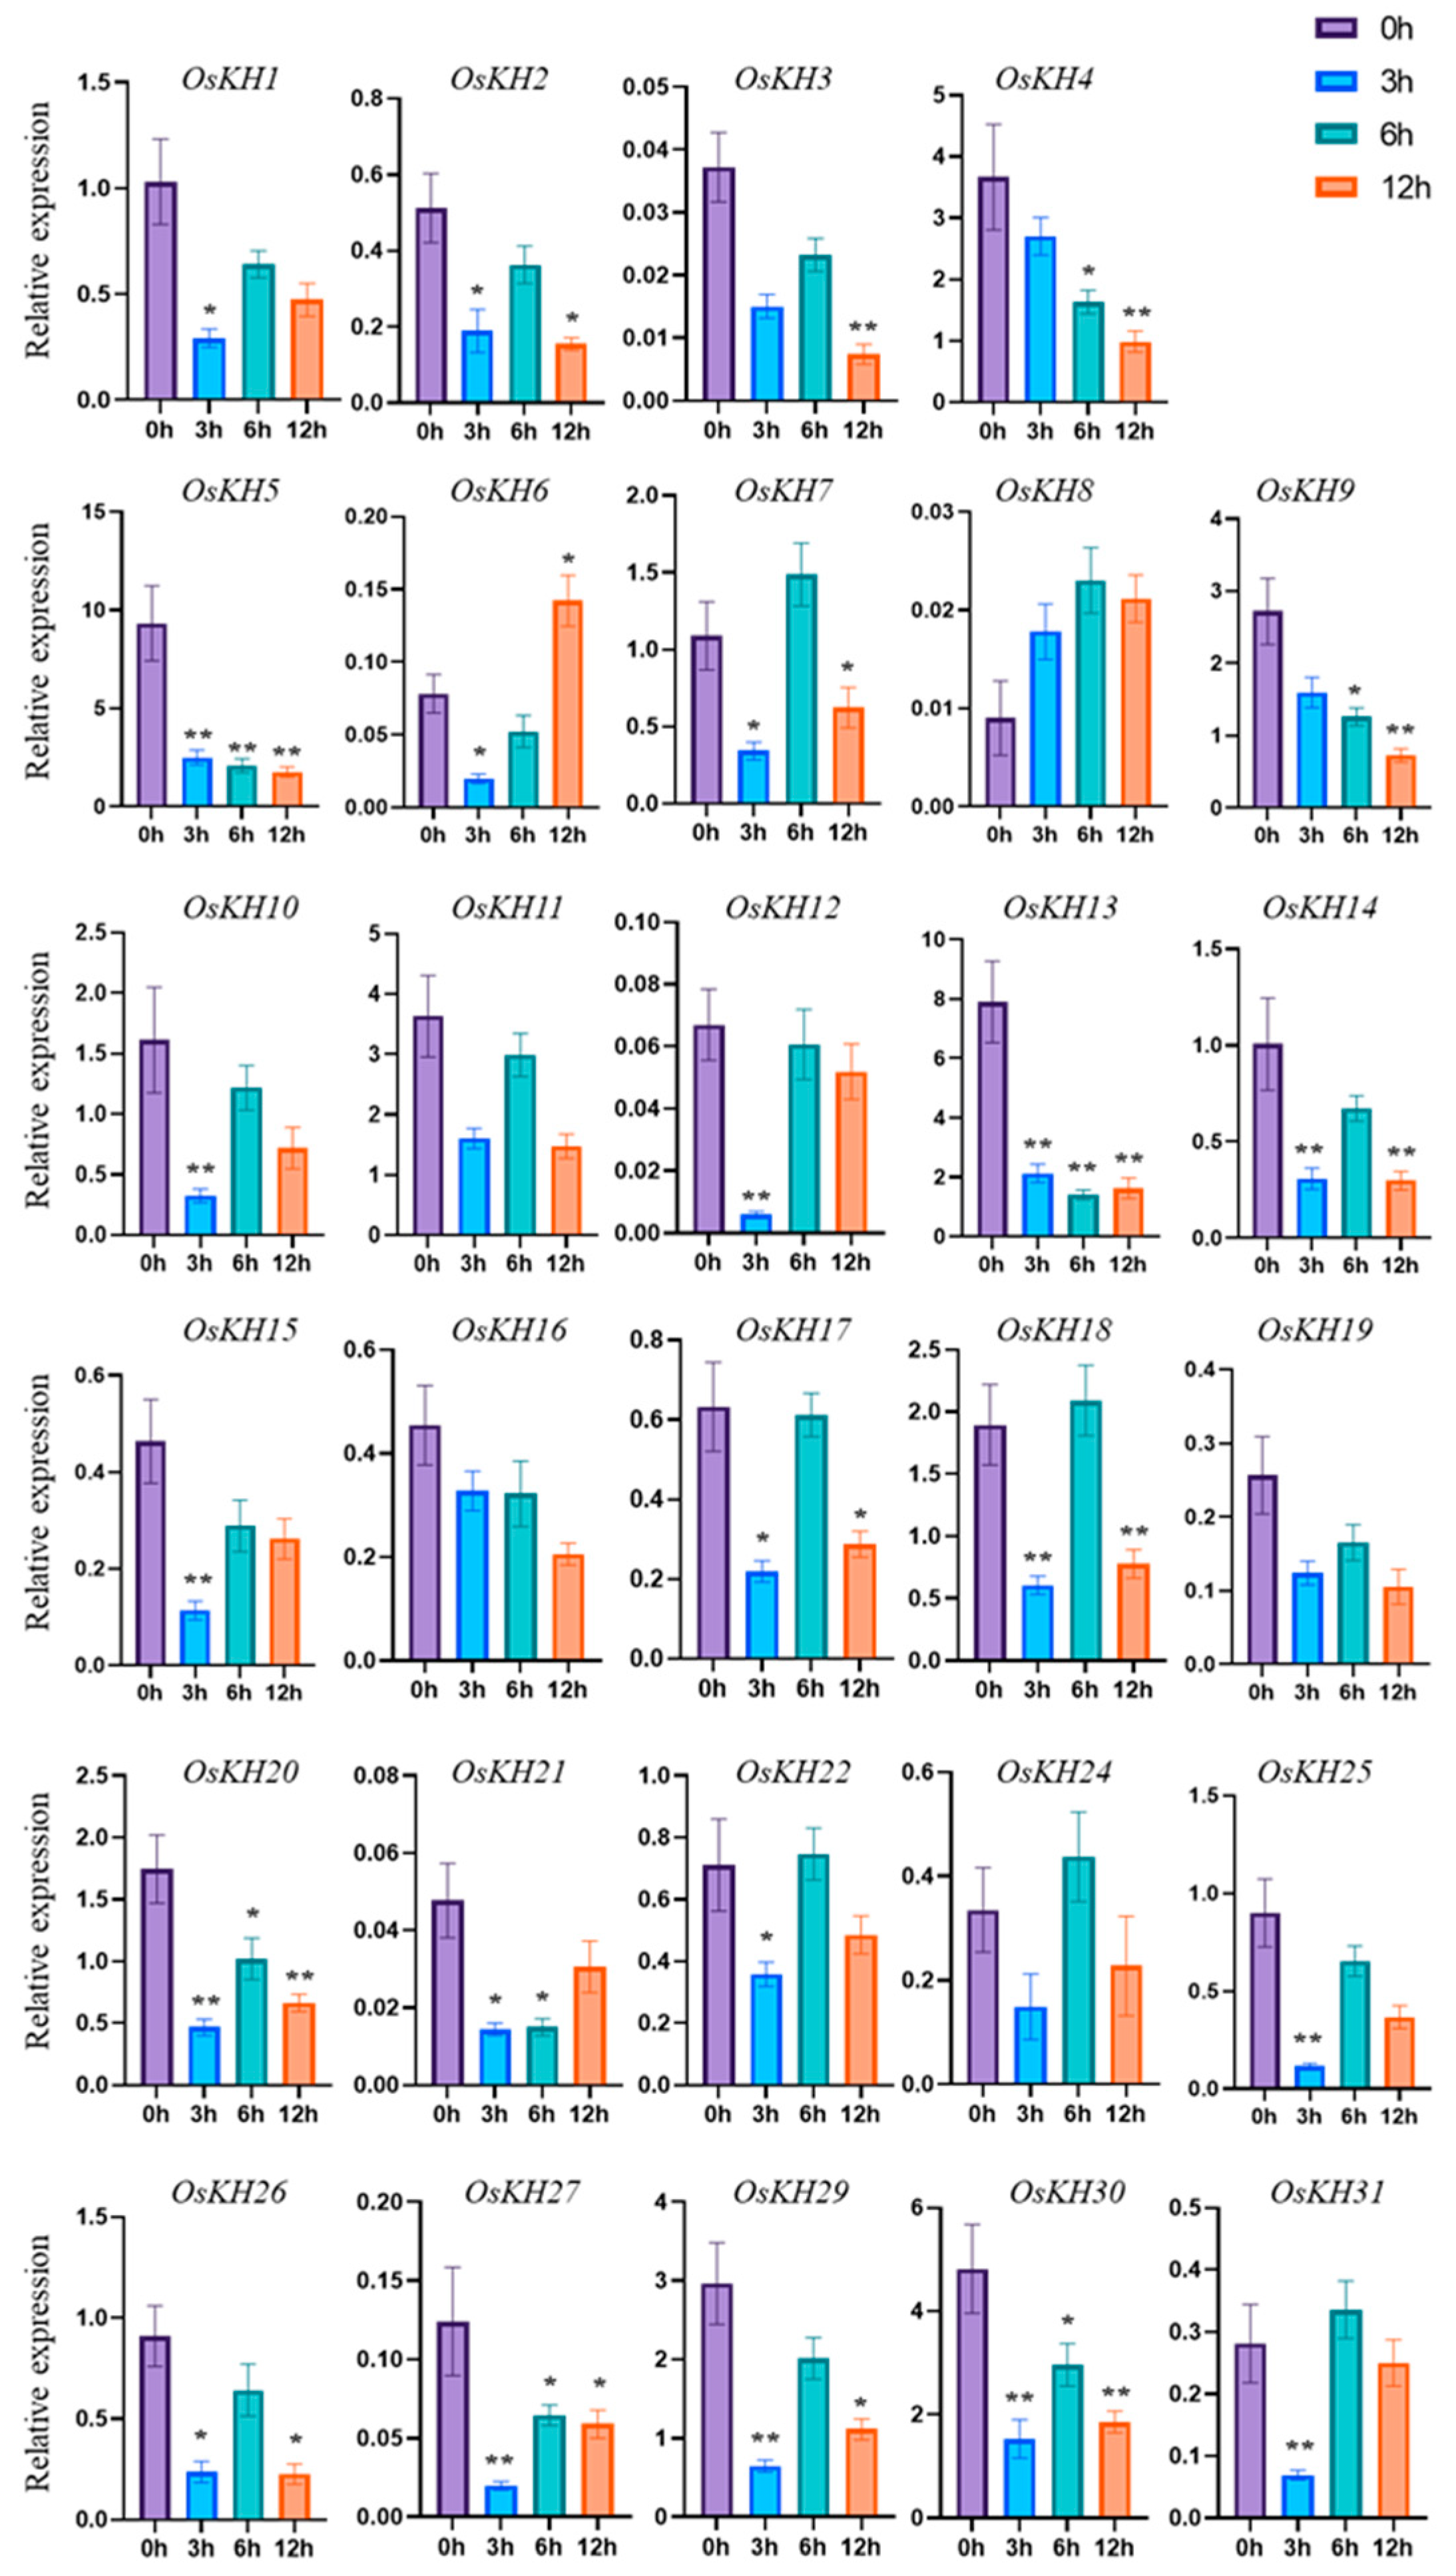
2.6. Expression Pattern Analysis of OsKHs under Salt Stress and ABA Treatment

Cis-acting element analysis of KH genes showed that the KH family genes mainly responded to light and ABA, and the ABA signal was closely related to salt stress. So, the response function of the KH genes to salt stress was mainly studied. To study the possible function of OsKHs in response to salt stress, the transcript level of 31 OsKH genes under the treatment of 300 mM NaCl was analyzed by qRT-PCR. After treatment with 300 mM NaCl for 0 h, 3 h, 6 h, and 12 h, the seedlings were collected for RNA extraction and qRT-PCR analysis. The expression analysis shows that the relative expression levels of OsKH genes in the leaf are more consistent with the tissue expression pattern. The expressions of OsKH4 and OsKH13 in rice leaves are relatively higher, which is consistent with the data in the database of Figure 4. Furthermore, the expressions of OsKH23 and OsKH28 in rice leaves were so low that they could not be detected by qRT-PCR, which further illustrates the authenticity of our quantitative results (Figure 6). The results found that the eight KH genes were strongly repressed from 3 h to 12 h, including OsKH1, OsKH7, OsKH10, OsKH12, OsKH13, OsKH18, OsKH27, and OsKH29. Among these genes, OsKH12 exhibited the strongest decrease in expression level. Three KH genes, OsKH2, OsKH8, and OsKH16 were significantly upregulated at 6 h (Figure 6). Following ABA treatment, the expressions of OsKH5, OsKH13, OsKH20, OsKH27, and OsKH30 were considerably down-regulated at all three time points (Figure 7). Primers used in this assay are listed in Table S1. These findings indicated these genes are possibly related to salt or ABA signaling pathways.

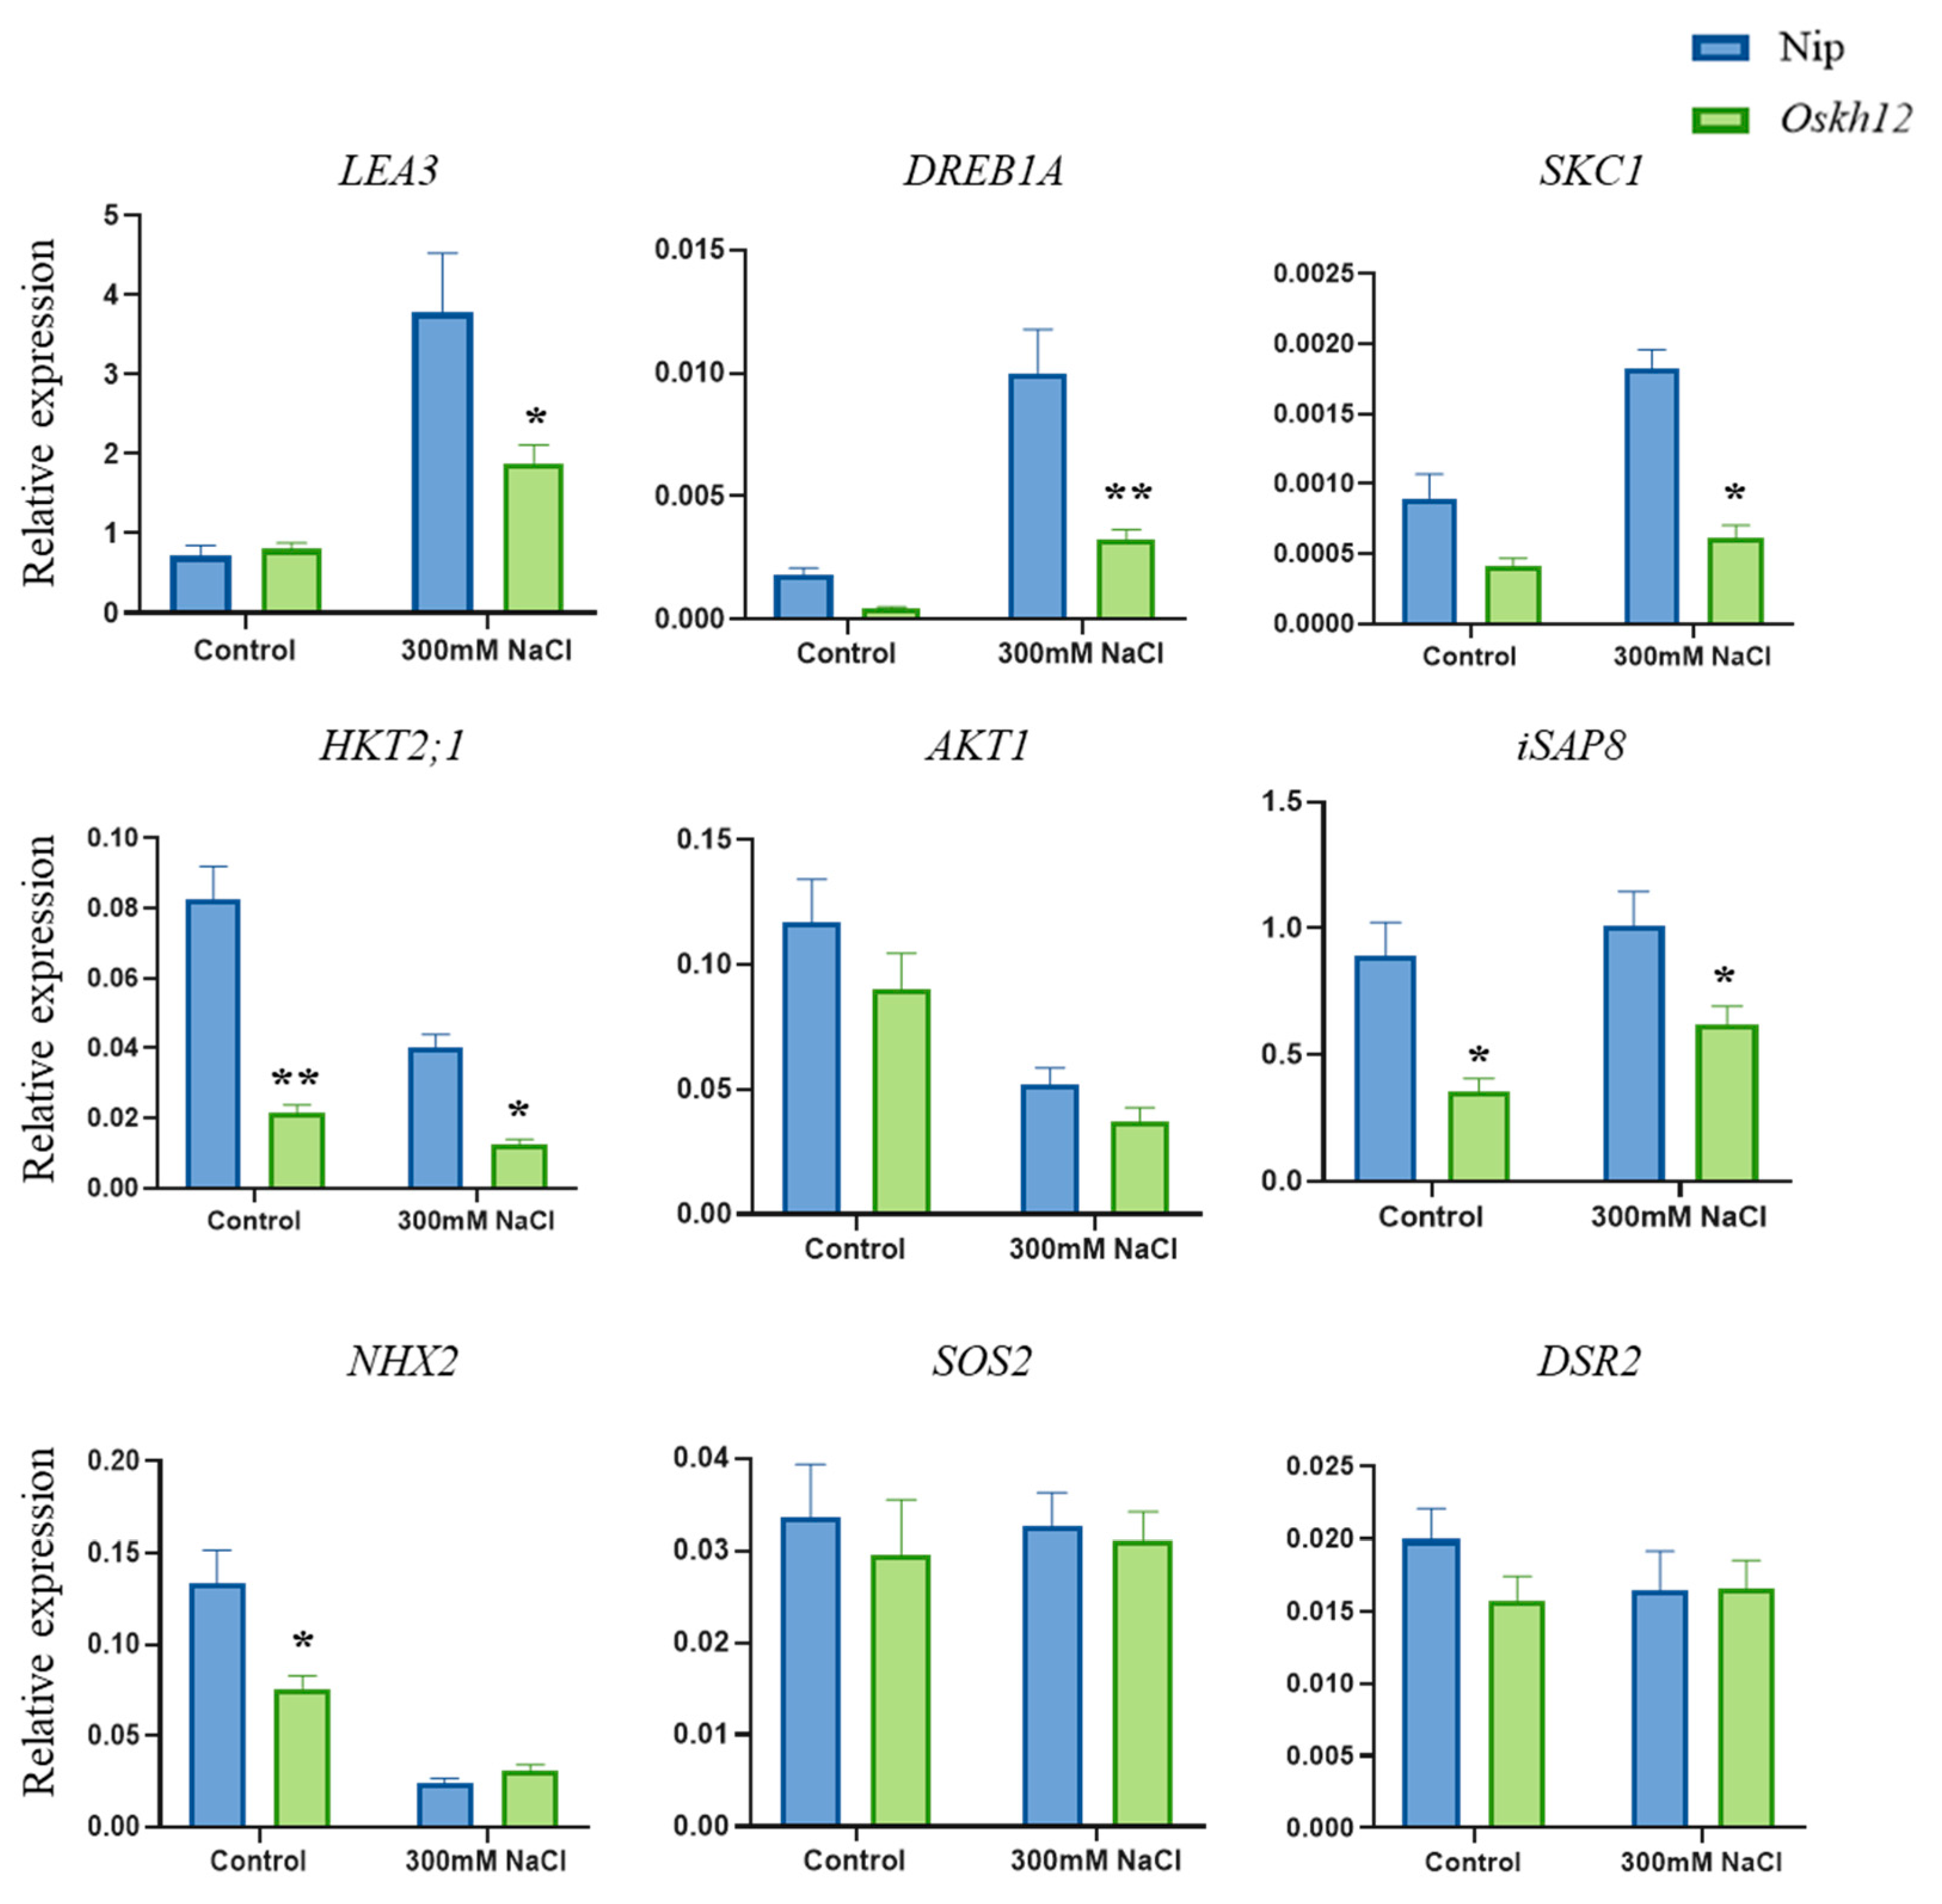
2.7. The Oskh12-Knockout Mutant Decreased Tolerance to Salt Stress in Rice

The expression pattern of KH genes under salt stress showed that OsKH12 responded to salt stress to a large extent, which could be used as a representative of the KH gene family in rice. To elucidate the function of KH genes in response to salt stress, the expression of OsKH12, which was significantly reduced under the treatment of NaCl, was selected to be knocked out in rice using a CRISPR/Cas9 genome-editing approach. Two-week rice seedlings of Nip and homozygous Oskh12 mutant were treated with 150 mM NaCl. The phenotype showed that the Oskh12 mutant exhibited earlier wilted phenotypes and a lower survival rate than Nip (Figure 8A,B). These data confirmed that Oskh12 was more salt-sensitive than Nip. In addition, ROS levels can reflect the extent of damage to the plant. Under salt stress, the damage degree of plants with strong salt tolerance will be lower. ROS staining by NBT displayed that the ROS level of Oskh12 was significantly higher than Nip, which is consistent with the sensitive phenotype of Oskh12. The ROS level of Oskh12 increased to a greater extent than Nip under the 300 mM NaCl treatment compared to the control (Figure 8C,D). These results illustrated that the tolerance of salt stress was decreased in Oskh12.
To investigate the effect of OsKH12 on salt-related genes, the nine key salt-responsive genes (LEA3, DREB1A, SKC1, HKT2;1, AKT1, iSAP8, NHX2, SOS2, and DSR2) were selected for expression analysis under the treatment of NaCl. The expression of LEA3, DREB1A, SKC1, HKT2;1, AKT1, iSAP8, NHX2, SOS2, and DSR2 were all induced by salt stress [38,39]. Overexpression of iSAP8 and DSR2 can enhance the tolerance to salt and drought in rice [40,41]. Also, DREB1A has been discovered to enhance salt tolerance both in Oryza sativa and Arabidopsis thaliana [42]. SKC1, HKT2;1, AKT1, NHX2, and SOS2 were induced by salt stress in rice [43,44,45,46]. The qRT-PCR results showed that, under the treatment of 300 mM NaCl, the expression of LEA3, DREB1A, SKC1, HKT2;1, and iSAP8 was significantly down-regulated in Oskh12 compared to Nip, which was consistent with the phenotype of Oskh12 under the treatment of NaCl (Figure 9). For instance, the expression level of LEA3 was significantly increased in both Nip and Oskh12 under salt treatment conditions. However, the upregulation of LEA3 was markedly lower in Oskh12 compared to Nip (Figure 9). The expression level of SKC1 was significantly upregulated after salt treatment in Nip; in contrast, the expression level of SKC1 did not show a significant change in Oskh12 under salt treatment (Figure 9). Another four genes, including AKT1, NHX2, SOS2, and DSR2 showed no significant differences in expression levels in Oskh12 (Figure 9). Primers used in this assay are listed in Table S2. These results further confirmed that OsKH12 participates in the regulation of salt response and regulates the salt stress response of plants by regulating the expression of salt-responsive genes.

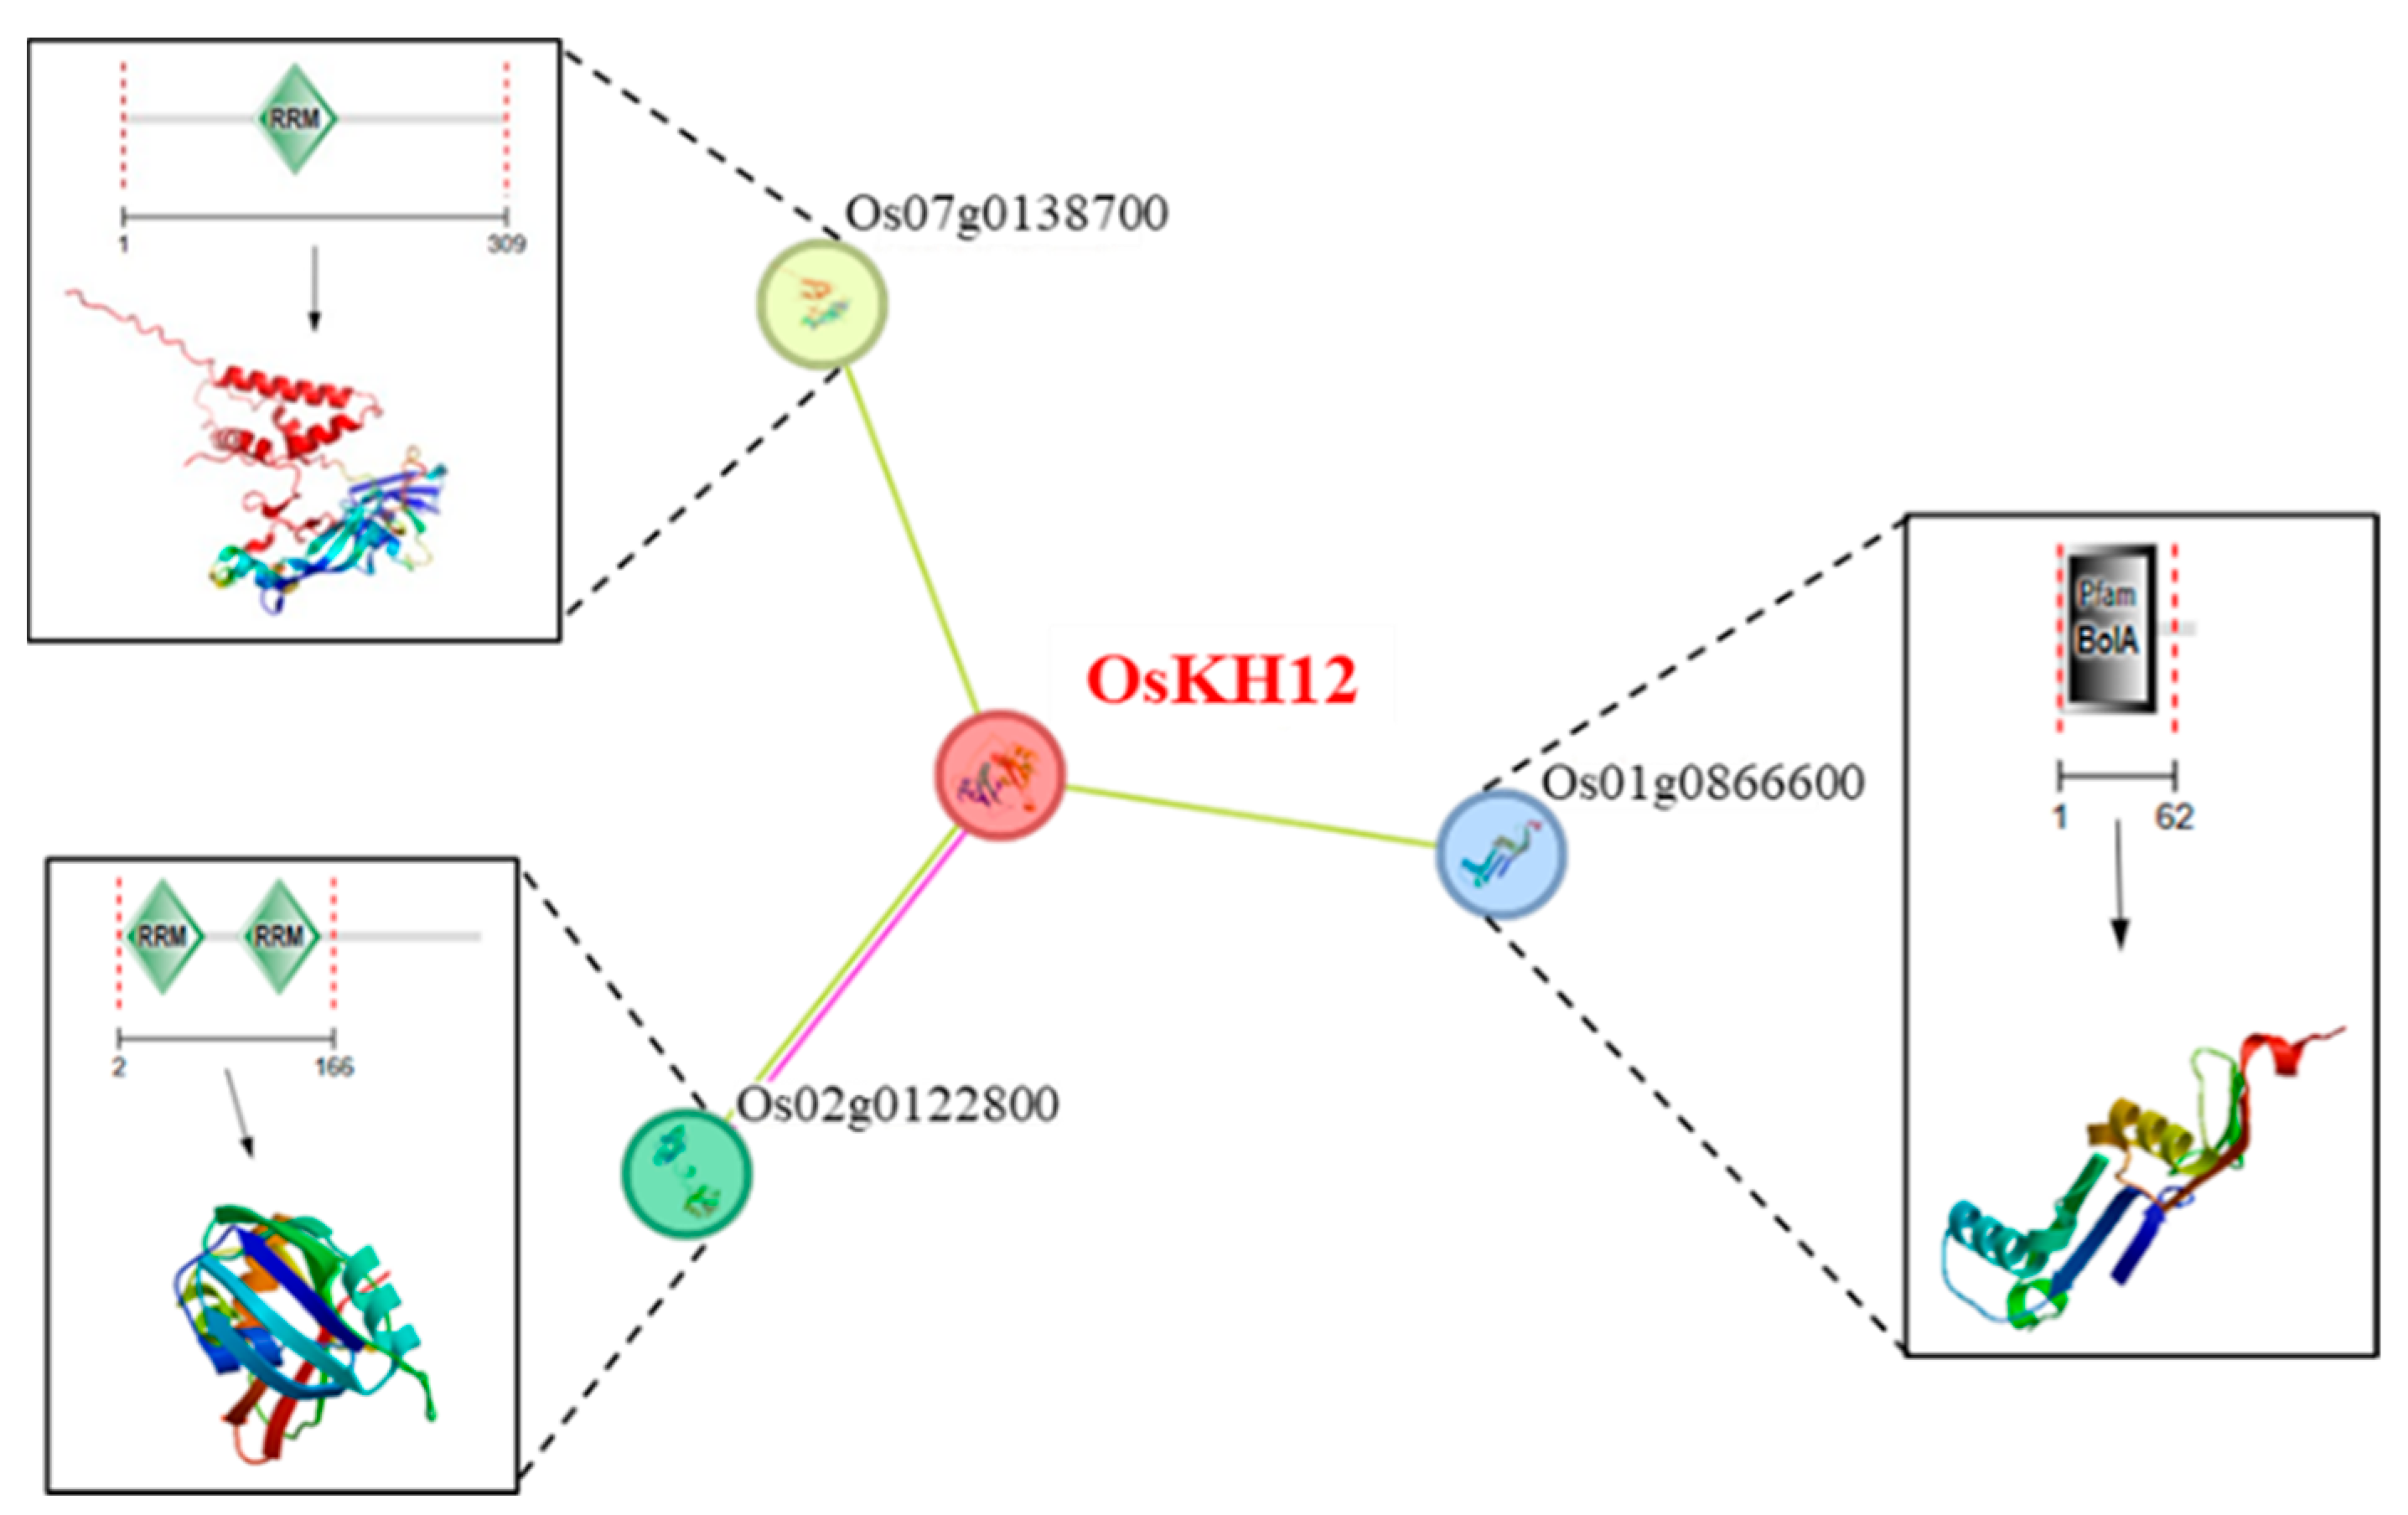
2.8. OsKH12 Is Related to the Proteins Containing the RRM Domain

To further identify the involvement of OsKH12 in the salt stress response, we predicted the proteins to which OsKH12 may bind by the STRING website (https://cn.string-db.org/, accessed on 11 January 2024). The predictions showed the three proteins that OsKH12 was most likely to bind to in rice and the gene IDs encoding these three proteins are Os07g0138700, Os02g0122800, and Os01g0866600 in rice (Figure 10). Among the three proteins, two proteins contain the RRM domain, which is the main RNA-binding domain involved in pre-mRNA splicing (Figure 10).

3. Discussion

The K-homologous (KH) protein is a type of nucleic acid-binding protein containing the KH domain, which plays an important role in the development and abiotic stress response [1,19,47,48]. However, systematic characterization and functions of the KH family in rice are still absent. In this study, we performed genome-wide identification of KH family genes in rice and Arabidopsis, and a total of 31 and 30 KH genes were identified, respectively (Figure 1). The comprehensive information was further analyzed including duplication analysis, protein sequence length, MW and pI, instability index, aliphatic index, grand average of hydropathicity, and subcellular localization. The phylogenetic and synteny analysis indicated that the evolution of KH gene families in the two plants was relatively conservative (Figure 2). We also performed conserved domain analysis of KH proteins and tissue expression of KH family genes to explore the potential function of the KH family, which revealed that all KH proteins contain the KH domain and the OsKH genes expressed in all rice tissues (Figure 3 and Figure 4).
To investigate the potential function of OsKHs in response to salt stress, the expression level of 31 OsKH genes under salt and ABA stress was analyzed by qRT-PCR. We found several key genes that showed obvious changes in response to abiotic stress (Figure 6 and Figure 7). According to the results of qRT-PCR, OsKH12 was selected to investigate the function in response to salt stress including the phenotype analysis and expression of salt-responsive marker genes in Oskh12-crispr mutant. Our results confirmed that OsKH12 participates in the regulation of salt response by regulating the expression of salt-responsive genes (Figure 8 and Figure 9). The salt tolerance phenotypes of KH genes were also reported in other plants, such as AtSIEK [23] and FRY2/CPL1 [21,49]. Moreover, in response to abiotic stress, KH genes also play vital roles in the regulation of plant growth and development. HEN4 containing the KH domain delays flowering time by upregulation of the FLC and MAF4, which are the MADS-box repressor genes in Arabidopsis thaliana [50]. SPIN1 delays the heading date by downregulating the flowering promoter gene Hd3a (Heading date 3a) in short days and by targeting Hd1-independent factors in long days in Oryza sativa [17]. These findings provide clues that the OsKH genes may be involved in the regulation of plant growth and development, such as heading date in rice.
According to the protein properties of KH family proteins, KH proteins function as nucleic acid-binding proteins and mainly regulate various physiological processes by regulating the expression of other genes through post-transcriptional regulation. The KH proteins do not directly regulate the physiological phenotype of plants. To predict the partner proteins of the KH family, we analyzed the possible interaction proteins of OsKH12 and found that the OsKH12 protein is likely to interact with proteins containing the RRM domain (Figure 10). The RRM domain is a type of RNA-binding protein, like the KH domain. There is a study that shows that the plant-specific splicing factor OsRS33 (Os02g0122800) plays a crucial role during plant responses to abiotic stresses including salt stress [51]. Consequently, it is reasonable to speculate that KH proteins can interact with many RNA-binding proteins to regulate abiotic stress response through pre-mRNA splicing in plants. The underlying molecular mechanism of KH proteins regulating physiological processes has great value for future research. In summary, these results suggested that OsKH12 plays an important role in response to salt stress, which explains the significance of the KH genes for salt stress. Our study may provide better help to understand the source and function of KH family genes.

4. Materials and Methods

4.1. Identification of the KH Members in Oryza sativa

To perform genome-wide identification of the KH gene family, the whole genome of Oryza sativa and Arabidopsis thaliana and their annotation information were downloaded from Ensembl Plants (https://plants.ensembl.org/index.html, accessed on 3 January 2024) [52]. To find the KH family sequences in these two species, the hidden Markov model (HMM) with an E value < 10−5 of the KH domain (PF00013) [18] was downloaded from Pfam (http://pfam.xfam.org/, accessed on 3 January 2024) [53].
The KH family members coding sequences (CDSs) and peptide sequences of Oryza sativa and Arabidopsis thaliana were downloaded from the Phytozome website (https://phytozome-next.jgi.doe.gov/, accessed on 4 January 2024) and the Tair website (https://www.arabidopsis.org/, accessed on 4 January 2024), respectively. After removing duplicate transcripts, a total of 61 KH family genes were identified in the two species, named AtKH1 to AtKH30 and OsKH1 to OsKH31. Basic information, such as the molecular weight of proteins, was analyzed by ExPASy (https://www.expasy.org/, accessed on 4 January 2024) [54]. The subcellular localization of KH family proteins was predicted using PSORT (https://www.genscript.com/psort.html, accessed on 4 January 2024).

4.2. Chromosomal Location and Duplication Analysis of KH Genes in Oryza sativa

To identify chromosomal locations, TBtools software v2.096 (https://github.com/CJChen/TBtools, accessed on 4 January 2024) was used to map KH genes on 12 chromosomes in Oryza sativa based on gene annotation information [55]. The data source is based on the Ensembl Plants database [52]. To further analyze gene replication, duplicated events were analyzed using the Advanced Circos of TBtools software v2.096.

4.3. Phylogenetic Tree and Collinearity Analysis of KH Proteins

To investigate the evolutionary relationship between Oryza sativa and Arabidopsis thaliana, the protein sequences of KH members were compared using the ClustalW program. The phylogenetic tree was constructed by MEGA7 using the neighbor-joining method. Tree nodes were evaluated through 1000 repeated bootstrap analyses. The final phylogenetic trees were modified using ITOL (https://itol.embl.de/, accessed on 5 January 2024) [56]. Arabidopsis thaliana and Oryza sativa were selected to analyze the collinearity of the KH family using the multicollinearity scan toolkit.in TBtools.

4.4. Conserved Motif and Domain Analysis of KH Family Proteins

The conserved motif of the full-length KH proteins was analyzed using the online MEME website (https://meme-suite.org/meme/, accessed on 5 January 2024) [57] by the zero or one occurrence per sequence (zoops) strategy and set the number of searchable motifs to 10. Conserved domain information of KH proteins was calculated by Batch CD-Search (https://www.ncbi.nlm.nih.gov/Structure/bwrpsb/bwrpsb.cgi, accessed on 5 January 2024) [58].

4.5. Expression Pattern Analysis of KH Genes in Oryza sativa

The normalized signal intensity data of KH genes in different tissues were downloaded from RiceXPro (https://ricexpro.dna.affrc.go.jp/, accessed on 6 January 2024) [59] to reveal the expression patterns of all KH family genes in Oryza sativa. Differential expression analysis and the heatmap were visualized using TBtools.

4.6. Cis-Regulatory Elements Analysis of KH Gene Promoters

The promoter sequences (2000 bp upstream of KH genes) of the Arabidopsis thaliana and Oryza sativa were downloaded from the NCBI website (https://www.ncbi.nlm.nih.gov/, accessed on 6 January 2024). These promoter sequences were used to predict cis-acting elements by the public website PlantCARE (https://bioinformatics.psb.ugent.be/webtools/plantcare/html/, accessed on 6 January 2024) [60].

4.7. Plant Materials and Methods of Stress Treatment

The Nipponbare was used for rice transformation to construct the Oskh12 CRISPR mutant. The Oskh12 mutant and Nip were used to analyze the responses to abiotic stresses in rice. Rice plants were grown at 32 ± 2 °C, in 1/2 Murashige and Skoog culture medium (MS), under LDs (long day, 14 h light/10 h dark). Two-week-old seedlings of rice were separately processed with 150 mM NaCl, 300 mM NaCl, and 50 µM ABA in 1/2 MS medium. For qRT-PCR analysis, the acute treatment method was adopted, with 300 mM NaCl and 50 µM ABA, and the treatment time was 24 h. Moreover, the phenotypic material was treated chronically, with 150 mM NaCl, and the treatment time was 3 days. After observing the phenotype, the seedlings were then collected for RNA extraction and qRT-PCR analysis.

4.8. RNA Extraction and qRT-PCR Analysis

The leaves of two-week seedlings were used for the extraction of total RNA. The total RNA was extracted using the RNA-easy Isolation Reagent (Vazyme) and then synthesized cDNA with Evo M-MLV RT Mix Kit (Accurate Biology). qRT-PCR analyses were performed in the CFX384 Real-Time System (Bio-Rad) with SYBR Green Premix Pro Taq HS qPCR Kit (Accurate Biology). The Oryza sativa Ubiquitin (UBQ) gene was used as an internal control. Primers used in this assay are listed in Tables S1 and S2.

4.9. ROS Staining

ROS level was measured by nitro tetrazolium blue chloride (NBT). The higher the ROS level, the darker the color and the larger the area of the NBT stain. One-week-old seedlings of Nip and Oskh12 were treated in 300 mM NaCl for 16 h before the seedling staining. The seedlings were incubated in 25 mM HEPES buffer (pH = 7.6) containing 1 mg/mL NBT (HWRK CHEM) for one hour at room temperature for dark staining and then destained in 95% ethanol. The root tips were then photographed using a light microscope.

Supplementary Materials

The following supporting information can be downloaded at: https://www.mdpi.com/article/10.3390/ijms25115950/s1.

Author Contributions

Data curation, Q.X., Y.Z., M.W., Y.C., Y.W., Q.Z., Y.H., S.Z., J.Z., T.C. and M.C.; Formal analysis, Q.X. and Y.Z.; Funding acquisition, M.C.; Writing—original draft, Q.X.; Writing—review and editing, T.C. and M.C. All authors have read and agreed to the published version of the manuscript.

Funding

This work was supported by the National Natural Science Foundation of China (Grant NO. 32201826) and the Zhejiang Provincial Natural Science Foundation of China (Grant NO. LQ22C130001).

Institutional Review Board Statement

Not applicable.

Informed Consent Statement

Not applicable.

Data Availability Statement

The sources of the data for this study are detailed in Section 4.

Conflicts of Interest

The authors declare that they have no known competing financial interests or personal relationships that could have appeared to influence the work reported in this paper.

References

  1. Siomi, H.; Matunis, M.J.; Michael, W.M.; Dreyfuss, G. The pre-mRNA binding K protein contains a novel evolutionary conserved motif. Nucleic Acids Res. 1993, 21, 1193–1198. [Google Scholar] [CrossRef] [PubMed]
  2. Grishin, N.V. KH domain: One motif, two folds. Nucleic Acids Res. 2001, 29, 638–643. [Google Scholar] [CrossRef]
  3. Valverde, R.; Edwards, L.; Regan, L. Structure and function of KH domains. FEBS J. 2008, 275, 2712–2726. [Google Scholar] [CrossRef] [PubMed]
  4. Miska, E.A.; Li, L.; Veksler-Lublinsky, I.; Zinovyeva, A. HRPK-1, a conserved KH-domain protein, modulates microRNA activity during Caenorhabditis elegans development. PLoS Genet. 2019, 15, e1008067. [Google Scholar] [CrossRef] [PubMed]
  5. Briata, P.; Bordo, D.; Puppo, M.; Gorlero, F.; Rossi, M.; Perrone-Bizzozero, N.; Gherzi, R. Diverse roles of the nucleic acid-binding protein KHSRP in cell differentiation and disease. WIREs RNA 2015, 7, 227–240. [Google Scholar] [CrossRef] [PubMed]
  6. Zhu, S.; Chen, W.; Wang, J.; Qi, L.; Pan, H.; Feng, Z.; Tian, D. SAM68 promotes tumorigenesis in lung adenocarcinoma by regulating metabolic conversion via PKM alternative splicing. Theranostics 2021, 11, 3359–3375. [Google Scholar] [CrossRef] [PubMed]
  7. Qiao, A.; Zhou, J.; Xu, S.; Ma, W.; Boriboun, C.; Kim, T.; Yan, B.; Deng, J.; Yang, L.; Zhang, E.; et al. Sam68 promotes hepatic gluconeogenesis via CRTC2. Nat. Commun. 2021, 12, 3340. [Google Scholar] [CrossRef] [PubMed]
  8. Chen, X.; Zhang, L.; Yuan, M.; Kuang, Z.; Zou, Y.; Tang, T.; Zhang, W.; Hu, X.; Xia, T.; Cao, T.; et al. Sam68 Promotes the Progression of Human Breast Cancer through inducing Activation of EphA3. Curr. Cancer Drug Targets 2020, 20, 76–83. [Google Scholar] [CrossRef] [PubMed]
  9. Mockler, T.C.; Yu, X.; Shalitin, D.; Parikh, D.; Michael, T.P.; Liou, J.; Huang, J.; Smith, Z.; Alonso, J.M.; Ecker, J.R.; et al. Regulation of flowering time in Arabidopsis by K homology domain proteins. Proc. Natl. Acad. Sci. USA 2004, 101, 12759–12764. [Google Scholar] [CrossRef]
  10. Ripoll, J.J.; Rodríguez-Cazorla, E.; González-Reig, S.; Andújar, A.; Alonso-Cantabrana, H.; Perez-Amador, M.A.; Carbonell, J.; Martínez-Laborda, A.; Vera, A. Antagonistic interactions between Arabidopsis K-homology domain genes uncover PEPPER as a positive regulator of the central floral repressor FLOWERING LOCUS C. Dev. Biol. 2009, 333, 251–262. [Google Scholar] [CrossRef]
  11. Steffen, A.; Elgner, M.; Staiger, D. Regulation of Flowering Time by the RNA-Binding Proteins AtGRP7 and AtGRP8. Plant Cell Physiol. 2019, 60, 2040–2050. [Google Scholar] [CrossRef] [PubMed]
  12. Wellmer, F.; Han, Y.; Jing, M.; Liu, Y.; Shi, H.; Yan, Z. KHZ1 and KHZ2, novel members of the autonomous pathway, repress the splicing efficiency of FLC pre-mRNA in Arabidopsis. J. Exp. Bot. 2020, 71, 1375–1386. [Google Scholar] [CrossRef] [PubMed]
  13. Yan, Z.; Jia, J.; Yan, X.; Shi, H.; Han, Y. Arabidopsis KHZ1 and KHZ2, two novel non-tandem CCCH zinc-finger and K-homolog domain proteins, have redundant roles in the regulation of flowering and senescence. Plant Mol. Biol. 2017, 95, 549–565. [Google Scholar] [CrossRef] [PubMed]
  14. Fabian, M.; Gao, M.; Zhang, X.N.; Shi, J.; Vrydagh, L.; Kim, S.H.; Patel, P.; Hu, A.R.; Lu, H. The flowering time regulator FLK controls pathogen defense in Arabidopsis thaliana. Plant Physiol. 2023, 191, 2461–2474. [Google Scholar] [CrossRef] [PubMed]
  15. Dai, G.Y.; Chen, D.K.; Sun, Y.P.; Liang, W.Y.; Liu, Y.; Huang, L.Q.; Li, Y.K.; He, J.F.; Yao, N. The Arabidopsis KH-domain protein FLOWERING LOCUS Y delays flowering by upregulating FLOWERING LOCUS C family members. Plant Cell Rep. 2020, 39, 1705–1717. [Google Scholar] [CrossRef]
  16. Amara, U.; Hu, J.; Cai, J.; Kang, H. FLK is an mRNA m6A reader that regulates floral transition by modulating the stability and splicing of FLC in Arabidopsis. Mol. Plant 2023, 16, 919–929. [Google Scholar] [CrossRef]
  17. Vega-Sánchez, M.E.; Zeng, L.; Chen, S.; Leung, H.; Wang, G.L. SPIN1, a K homology domain protein negatively regulated and ubiquitinated by the E3 ubiquitin ligase SPL11, is involved in flowering time control in rice. Plant Cell 2008, 20, 1456–1469. [Google Scholar] [CrossRef]
  18. Zhang, Y.; Ma, Y.; Liu, R.; Li, G. Genome-Wide Characterization and Expression Analysis of KH Family Genes Response to ABA and SA in Arabidopsis thaliana. Int. J. Mol. Sci. 2022, 23, 511. [Google Scholar] [CrossRef] [PubMed]
  19. Guan, Q.; Wen, C.; Zeng, H.; Zhu, J. A KH Domain-Containing Putative RNA-Binding Protein Is Critical for Heat Stress-Responsive Gene Regulation and Thermotolerance in Arabidopsis. Mol. Plant 2013, 6, 386–395. [Google Scholar] [CrossRef]
  20. Chen, T.; Cui, P.; Xiong, L. The RNA-binding protein HOS5 and serine/arginine-rich proteins RS40 and RS41 participate in miRNA biogenesis in Arabidopsis. Nucleic Acids Res. 2015, 43, 8283–8298. [Google Scholar] [CrossRef]
  21. Thatcher, L.F.; Foley, R.; Casarotto, H.J.; Gao, L.-L.; Kamphuis, L.G.; Melser, S.; Singh, K.B. The Arabidopsis RNA Polymerase II Carboxyl Terminal Domain (CTD) Phosphatase-Like1 (CPL1) is a biotic stress susceptibility gene. Sci. Rep. 2018, 8, 13454. [Google Scholar] [CrossRef] [PubMed]
  22. Chen, T.; Cui, P.; Chen, H.; Ali, S.; Zhang, S.; Xiong, L. A KH-domain RNA-binding protein interacts with FIERY2/CTD phosphatase-like 1 and splicing factors and is important for pre-mRNA splicing in Arabidopsis. PLoS Genet. 2013, 9, e1003875. [Google Scholar] [CrossRef]
  23. Zhang, X.; Xie, Q.; Xiang, L.; Lei, Z.; Huang, Q.; Zhang, J.; Cai, M.; Chen, T. AtSIEK, an EXD1-like protein with KH domain, involves in salt stress response by interacting with FRY2/CPL1. Int. J. Biol. Macromol. 2023, 233, 123369. [Google Scholar] [CrossRef] [PubMed]
  24. Ganie, S.A.; Molla, K.A.; Henry, R.J.; Bhat, K.V.; Mondal, T.K. Advances in understanding salt tolerance in rice. Theor. Appl. Genet. 2019, 132, 851–870. [Google Scholar] [CrossRef] [PubMed]
  25. Pascale, S.D.; Maggio, A.; Barbieri, G. Soil salinization affects growth, yield and mineral composition of cauliflower and broccoli. Eur. J. Agron. 2005, 23, 254–264. [Google Scholar] [CrossRef]
  26. Zhang, J.-T.; Mu, C.-S. Effects of saline and alkaline stresses on the germination, growth, photosynthesis, ionic balance and anti-oxidant system in an alkali-tolerant leguminous forage Lathyrus quinquenervius. Soil Sci. Plant Nutr. 2009, 55, 685–697. [Google Scholar] [CrossRef]
  27. Uddin, M.K.; Juraimi, A.S.; Ismail, M.R.; Hossain, M.A.; Othman, R.; Rahim, A.A. Effect of Salinity Stress on Nutrient Uptake and Chlorophyll Content of Tropical Turfgrass Species. Aust. J. Crop Sci. 2011, 5, 620–629. [Google Scholar]
  28. Zhu, J.-K. Abiotic Stress Signaling and Responses in Plants. Cell 2016, 167, 313–324. [Google Scholar] [CrossRef] [PubMed]
  29. Yang, Y.; Guo, Y. Elucidating the molecular mechanisms mediating plant salt-stress responses. New Phytol. 2018, 217, 523–539. [Google Scholar] [CrossRef]
  30. Gong, Z.; Xiong, L.; Shi, H.; Yang, S.; Herrera-Estrella, L.R.; Xu, G.; Chao, D.Y.; Li, J.; Wang, P.Y.; Qin, F.; et al. Plant abiotic stress response and nutrient use efficiency. Sci. China Life Sci. 2020, 63, 635–674. [Google Scholar] [CrossRef]
  31. Xie, Q.; Zhou, Y.; Jiang, X. Structure, Function, and Regulation of the Plasma Membrane Na+/H+ Antiporter Salt Overly Sensitive 1 in Plants. Front. Plant Sci. 2022, 13, 866265. [Google Scholar] [CrossRef]
  32. Zhang, X.Y.; Tang, L.H.; Nie, J.W.; Zhang, C.R.; Han, X.; Li, Q.Y.; Qin, L.; Wang, M.H.; Huang, X.; Yu, F.; et al. Structure and activation mechanism of the rice Salt Overly Sensitive 1 (SOS1) Na+/H+ antiporter. Nat. Plants 2023, 9, 1924–1936. [Google Scholar] [CrossRef] [PubMed]
  33. Chen, R.; Deng, Y.; Ding, Y.; Guo, J.; Qiu, J.; Wang, B.; Wang, C.; Xie, Y.; Zhang, Z.; Chen, J.; et al. Rice functional genomics: Decades’ efforts and roads ahead. Sci. China Life Sci. 2022, 65, 33–92. [Google Scholar] [CrossRef] [PubMed]
  34. de Zelicourt, A.; Colcombet, J.; Hirt, H. The Role of MAPK Modules and ABA during Abiotic Stress Signaling. Trends Plant Sci. 2016, 21, 677–685. [Google Scholar] [CrossRef] [PubMed]
  35. Yoshida, T.; Fujita, Y.; Maruyama, K.; Mogami, J.; Todaka, D.; Shinozaki, K.; Yamaguchi-Shinozaki, K. Four Arabidopsis AREB/ABF transcription factors function predominantly in gene expression downstream of SnRK2 kinases in abscisic acid signalling in response to osmotic stress. Plant Cell Environ. 2015, 38, 35–49. [Google Scholar] [CrossRef] [PubMed]
  36. Xiang, Y.; Tang, N.; Du, H.; Ye, H.; Xiong, L. Characterization of OsbZIP23 as a key player of the basic leucine zipper transcription factor family for conferring abscisic acid sensitivity and salinity and drought tolerance in rice. Plant Physiol. 2008, 148, 1938–1952. [Google Scholar] [CrossRef] [PubMed]
  37. Li, S.; Wang, N.; Ji, D.; Zhang, W.; Wang, Y.; Yu, Y.; Zhao, S.; Lyu, M.; You, J.; Zhang, Y.; et al. A GmSIN1/GmNCED3s/GmRbohBs Feed-Forward Loop Acts as a Signal Amplifier That Regulates Root Growth in Soybean Exposed to Salt Stress. Plant Cell 2019, 31, 2107–2130. [Google Scholar] [CrossRef] [PubMed]
  38. Moons, A.; De Keyser, A.; Van Montagu, M. A group 3 LEA cDNA of rice, responsive to abscisic acid, but not to jasmonic acid, shows variety-specific differences in salt stress response. Gene 1997, 191, 197–204. [Google Scholar] [CrossRef] [PubMed]
  39. Moons, A.; Bauw, G.; Prinsen, E.; Van Montagu, M.; Van der Straeten, D. Molecular and physiological responses to abscisic acid and salts in roots of salt-sensitive and salt-tolerant Indica rice varieties. Plant Physiol. 1995, 107, 177–186. [Google Scholar] [CrossRef]
  40. Kanneganti, V.; Gupta, A.K. Overexpression of OsiSAP8, a member of stress associated protein (SAP) gene family of rice confers tolerance to salt, drought and cold stress in transgenic tobacco and rice. Plant Mol. Biol. 2008, 66, 445–462. [Google Scholar] [CrossRef]
  41. Luo, C.; Guo, C.; Wang, W.; Wang, L.; Chen, L. Overexpression of a new stress-repressive gene OsDSR2 encoding a protein with a DUF966 domain increases salt and simulated drought stress sensitivities and reduces ABA sensitivity in rice. Plant Cell Rep. 2014, 33, 323–336. [Google Scholar] [CrossRef]
  42. Dubouzet, J.G.; Sakuma, Y.; Ito, Y.; Kasuga, M.; Dubouzet, E.G.; Miura, S.; Seki, M.; Shinozaki, K.; Yamaguchi-Shinozaki, K. OsDREB genes in rice, Oryza sativa L., encode transcription activators that function in drought-, high-salt- and cold-responsive gene expression. Plant J. 2003, 33, 751–763. [Google Scholar] [CrossRef] [PubMed]
  43. Wang, J.; Nan, N.; Li, N.; Liu, Y.; Wang, T.J.; Hwang, I.; Liu, B.; Xu, Z.Y. A DNA Methylation Reader-Chaperone Regulator-Transcription Factor Complex Activates OsHKT1;5 Expression during Salinity Stress. Plant Cell 2020, 32, 3535–3558. [Google Scholar] [CrossRef] [PubMed]
  44. Kader, M.A.; Seidel, T.; Golldack, D.; Lindberg, S. Expressions of OsHKT1, OsHKT2, and OsVHA are differentially regulated under NaCl stress in salt-sensitive and salt-tolerant rice (Oryza sativa L.) cultivars. J. Exp. Bot. 2006, 57, 4257–4268. [Google Scholar] [CrossRef] [PubMed]
  45. Fukuda, A.; Nakamura, A.; Hara, N.; Toki, S.; Tanaka, Y. Molecular and functional analyses of rice NHX-type Na+/H+ antiporter genes. Planta 2011, 233, 175–188. [Google Scholar] [CrossRef] [PubMed]
  46. Ishikawa, S.; Hayashi, S.; Abe, T.; Igura, M.; Kuramata, M.; Tanikawa, H.; Iino, M.; Saito, T.; Ono, Y.; Ishikawa, T.; et al. Low-cesium rice: Mutation in OsSOS2 reduces radiocesium in rice grains. Sci. Rep. 2017, 7, 2432. [Google Scholar] [CrossRef]
  47. Mahalingam, R.; Thatcher, L.F.; Kamphuis, L.G.; Hane, J.K.; Oñate-Sánchez, L.; Singh, K.B. The Arabidopsis KH-Domain RNA-Binding Protein ESR1 Functions in Components of Jasmonate Signalling, Unlinking Growth Restraint and Resistance to Stress. PLoS ONE 2015, 10, e0126978. [Google Scholar] [CrossRef] [PubMed]
  48. Rout, A.K.; Singh, H.; Patel, S.; Raghvan, V.; Gautam, S.; Minda, R.; Rao, B.J.; Chary, K.V.R. Structural characterization of a novel KH-domain containing plant chloroplast endonuclease. Sci. Rep. 2018, 8, 13750. [Google Scholar] [CrossRef] [PubMed]
  49. Koiwa, H.; Hausmann, S.; Bang, W.Y.; Ueda, A.; Kondo, N.; Hiraguri, A.; Fukuhara, T.; Bahk, J.D.; Yun, D.J.; Bressan, R.A.; et al. Arabidopsis C-terminal domain phosphatase-like 1 and 2 are essential Ser-5-specific C-terminal domain phosphatases. Proc. Natl. Acad. Sci. USA 2004, 101, 14539–14544. [Google Scholar] [CrossRef]
  50. Ortuño-Miquel, S.; Rodríguez-Cazorla, E.; Zavala-Gonzalez, E.A.; Martínez-Laborda, A.; Vera, A. Arabidopsis HUA ENHANCER 4 delays flowering by upregulating the MADS-box repressor genes FLC and MAF4. Sci. Rep. 2019, 9, 1478. [Google Scholar] [CrossRef]
  51. Butt, H.; Bazin, J.; Prasad, K.V.S.K.; Awad, N.; Crespi, M.; Reddy, A.S.N.; Mahfouz, M.M. The Rice Serine/Arginine Splicing Factor RS33 Regulates Pre-mRNA Splicing during Abiotic Stress Responses. Cells 2022, 11, 1796. [Google Scholar] [CrossRef] [PubMed]
  52. Yates, A.D.; Allen, J.; Amode, R.M.; Azov, A.G.; Barba, M.; Becerra, A.; Bhai, J.; Campbell, L.I.; Carbajo Martinez, M.; Chakiachvili, M.; et al. Ensembl Genomes 2022: An expanding genome resource for non-vertebrates. Nucleic Acids Res. 2022, 50, D996–D1003. [Google Scholar] [CrossRef] [PubMed]
  53. Mistry, J.; Chuguransky, S.; Williams, L.; Qureshi, M.; Salazar, G.A.; Sonnhammer, E.L.L.; Tosatto, S.C.E.; Paladin, L.; Raj, S.; Richardson, L.J.; et al. Pfam: The protein families database in 2021. Nucleic Acids Res. 2021, 49, D412–D419. [Google Scholar] [CrossRef] [PubMed]
  54. Han, Y.; Cai, M.; Zhang, S.; Chai, J.; Sun, M.; Wang, Y.; Xie, Q.; Chen, Y.; Wang, H.; Chen, T. Genome-Wide Identification of AP2/ERF Transcription Factor Family and Functional Analysis of DcAP2/ERF#96 Associated with Abiotic Stress in Dendrobium catenatum. Int. J. Mol. Sci. 2022, 23, 13603. [Google Scholar] [CrossRef] [PubMed]
  55. Sun, M.; Cai, M.; Zeng, Q.; Han, Y.; Zhang, S.; Wang, Y.; Xie, Q.; Chen, Y.; Zeng, Y.; Chen, T. Genome-Wide Identification and Expression Analysis of UBiA Family Genes Associated with Abiotic Stress in Sunflowers (Helianthus annuus L.). Int. J. Mol. Sci. 2023, 24, 1883. [Google Scholar] [CrossRef] [PubMed]
  56. Letunic, I.; Bork, P. Interactive Tree Of Life (iTOL) v5: An online tool for phylogenetic tree display and annotation. Nucleic Acids Res. 2021, 49, W293–W296. [Google Scholar] [CrossRef] [PubMed]
  57. Bailey, T.L.; Johnson, J.; Grant, C.E.; Noble, W.S. The MEME Suite. Nucleic Acids Res. 2015, 43, W39–W49. [Google Scholar] [CrossRef] [PubMed]
  58. Wang, J.; Chitsaz, F.; Derbyshire, M.K.; Gonzales, N.R.; Gwadz, M.; Lu, S.; Marchler, G.H.; Song, J.S.; Thanki, N.; Yamashita, R.A.; et al. The conserved domain database in 2023. Nucleic Acids Res. 2023, 51, D384–D388. [Google Scholar] [CrossRef] [PubMed]
  59. Sato, Y.; Takehisa, H.; Kamatsuki, K.; Minami, H.; Namiki, N.; Ikawa, H.; Ohyanagi, H.; Sugimoto, K.; Antonio, B.A.; Nagamura, Y. RiceXPro Version 3.0: Expanding the informatics resource for rice transcriptome. Nucleic Acids Res. 2013, 41, D1206–D1213. [Google Scholar] [CrossRef]
  60. Lescot, M.; Déhais, P.; Thijs, G.; Marchal, K.; Moreau, Y.; Van de Peer, Y.; Rouzé, P.; Rombauts, S. PlantCARE, a database of plant cis-acting regulatory elements and a portal to tools for in silico analysis of promoter sequences. Nucleic Acids Res. 2002, 30, 325–327. [Google Scholar] [CrossRef]
Figure 1. Chromosomal localization and collinearity analysis of 31 KH family genes in rice. (A) Chromosomal localization of thirty-one KH family genes in rice. The scale bars on the left indicate the length (Mb) of the chromosomes. The blue lines refer to low gene density, and the red lines refer to high gene density. (B) Collinearity analysis among KH family members in rice; the middle ring represents the twelve chromosomes and colored lines show the collinearity of KH family genes.
Ijms 25 05950 g001
Figure 2. The phylogenetic tree and synteny analysis of 61 KH family genes between Oryza sativa and Arabidopsis thaliana. (A) Phylogenetic trees of the two species were constructed using MEGA7 by the neighbor-joining method with 1000 bootstrap replications; each cluster is labeled with different colors. (B) Synteny analysis of KH members between Arabidopsis thaliana and Oryza sativa; the gray lines represent all genes with synteny between the two species, and the red line marks the synteny of KH family genes.
Ijms 25 05950 g002
Figure 3. Conserved motifs and protein domains of 61 KH family members in Oryza sativa and Arabidopsis thaliana. (A) Conserved motifs of sixty-one KH family proteins in the two species were identified through the MEME online tool; ten conserved motifs are represented by different colors. (B) Nine conserved domains of KH family proteins were identified using the NCBI conserved domain database and are displayed in different colors.
Ijms 25 05950 g003
Figure 4. The expression pattern of KH genes in different tissues of rice. The expression analysis of KH family genes in twelve rice tissues; the blue and red squares relatively denote lower and higher expression levels. The data were downloaded from the rice public database (https://ricexpro.dna.affrc.go.jp/, accessed on 6 January 2024).
Ijms 25 05950 g004
Figure 5. Analysis of cis-acting elements of KH family promoters in Oryza sativa and Arabidopsis thaliana. (A) Cis-acting elements analysis of sixty-one KH family gene promoters in the two species; the main six cis-acting elements were identified and are represented by different colors. (B) Quantitative statistics of cis-acting elements of KH family members in Oryza sativa. (C) Quantitative statistics of cis-acting elements of KH family members in Arabidopsis thaliana.
Ijms 25 05950 g005
Figure 6. The expression analysis of OsKH genes in response to salt stress. The expression level of 31 OsKH genes was detected by qRT-PCR. The different colored columns represent different times of Nip seedling treatment. Values are presented as means ± SD (n = 3, * p < 0.05, ** p < 0.01; Student’s t-test).
Ijms 25 05950 g006
Figure 7. OsKH genes response to ABA in rice. Expression analysis of OsKH genes after the treatment of 50 µM ABA, the columns of different colors represent different times of Nip seedling treatment. Values are presented as mean ± SD (n = 3, * p < 0.05, ** p < 0.01, Student’s t-test).
Ijms 25 05950 g007
Figure 8. The Oskh12 mutant displayed salt-sensitive phenotypes in rice. (A) The phenotypes of Nip and Oskh12 under the treatment of 150 mM NaCl. Bars: 2 cm. (B) Survival rate statistics of Nip and Oskh12 under the treatment of 150 mM NaCl. Values are presented as mean ± SD (n = 40, * p < 0.05, Student’s t-test). (C) ROS staining of Nip and Oskh12 by NBT after the treatment of 300 mM NaCl. Bar, 0.5 mm. (D) NBT staining intensity of Nip and Oskh12; the data were calculated by ImageJ software 1.54g. Values are presented as mean ± SD (n = 5, * p < 0.05, Student’s t-test).
Ijms 25 05950 g008
Figure 9. qRT-PCR analysis of salt-responsive genes in Nip and Oskh12. Expression analysis of 9 salt-responsive marker genes in Nip and Oskh12 after the treatment of 300 mM NaCl. Values are presented as means ± SD (n = 3, * p < 0.05, ** p < 0.01; Student’s t-test).
Ijms 25 05950 g009
Figure 10. Functional regulatory network of OsKH12. Protein interactions of OsKH12 proteins were predicted using the STRING website. Red lines indicate protein fusion and yellow lines indicate text mining. The dotted line enlarges the structure of corresponding proteins.
Ijms 25 05950 g010
Table 1. The characteristics of KH family proteins.
IDRenameNumber of Amino AcidsMW (Da)PIInstability IndexAliphatic IndexGrand Average of HydropathicityLocation
At1g09660AtKH129833,687.728.4261.4175.87−0.541Nucleus
At1g14170AtKH247952,540.335.8549.2787.93−0.361Chloroplast
At1g33680AtKH376380,438.614.7153.9647.23−0.96Nucleus
At1g51580AtKH462167,115.015.7450.6575.17−0.363Chloroplast
At2g03110AtKH515317,376.294.1634.4890.39−0.373Peroxisome
At2g22600AtKH663267,754.645.9437.6696.33−0.173Chloroplast
At2g25910AtKH734238,474.695.5349.6594.09−0.125Mitochondria
At2g25970AtKH863264,606.85.3257.9740.32−0.853Nucleus
At2g38610AtKH928631,720.938.9964.0576.36−0.56Chloroplast
At3g04610AtKH1057763,403.924.5751.866.2−0.753Cytoplasm
At3g08620AtKH1128331,500.949.359.9479.93−0.57Nucleus
At3g12130AtKH1224825,952.19.5127.5449.96−0.623Nucleus
At3g13230AtKH1321524,009.029.7127.8288.93−0.284Cytoplasm
At3g16230AtKH1444950,078.639.1739.0388.11−0.275Chloroplast
At3g29390AtKH1557862,535.118.7761.8376.61−0.51Nucleus
At3g32940AtKH1660766,479.769.0147.8269.11−0.546Nucleus
At4g10070AtKH1772577,201.514.6456.6148.36−0.939Nucleus
At4g18375AtKH1860665,760.828.0450.6687.94−0.234Chloroplast
At4g26000AtKH1949554,024.674.9251.4686.28−0.291Cytoplasm
At4g26480AtKH2030833,588.389.0561.0381.66−0.391Nucleus
At5g04430AtKH2133436,018.235.7750.476.86−0.422Nucleus
At5g06770AtKH2224025,367.579.6635.7256.54−0.628Cytoplasm
At5g08420AtKH2339145,323.089.5357.564.83−1.053Nucleus
At5g09560AtKH2461267,9546.6246.7685.16−0.35Nucleus
At5g15270AtKH2554859,712.058.3358.1480.24−0.51Nucleus
At5g46190AtKH2664469,676.848.3545.7286.99−0.283Nucleus
At5g51300AtKH2780487,050.315.8855.5455.11−0.804Nucleus
At5g53060AtKH2865271,3455.7562.682.96−0.478Cytoplasm
At5g56140AtKH2931533,984.667.8762.0680.48−0.378Nucleus
At5g64390AtKH3086694,703.747.247.2181.29−0.395Nucleus
Os01g0231900OsKH148754,345.928.4248.9380.1−0.48Chloroplast
Os01g0235800OsKH270576,040.625.9636.4483.21−0.391Mitochondria
Os01g0533450OsKH313314,786.9410.0731.4895.26−0.236Chloroplast
Os01g0566900OsKH430734,744.415.2543.3595.21−0.096Cytoplasm
Os01g0788950OsKH522024,409.369.7436.7289.64−0.198Cytoskeleton
Os01g0818300OsKH628331,302.837.7343.9483.07−0.451Cytoplasm
Os01g0886300OsKH729032,556.198.7754.6784.31−0.562Nucleus
Os02g0125500OsKH845849,993.265.0442.1891.11−0.352Cytoplasm
Os02g0194200OsKH930031,153.449.5835.748.23−0.532Nucleus
Os02g0224300OsKH1069971,068.15.5661.5939.31−0.887Nucleus
Os02g0722700OsKH1128631,368.769.2746.1683.25−0.43Chloroplast
Os02g0822300OsKH1234336,718.266.1953.3876.82−0.394Cytoskeleton
Os03g0115200OsKH1322724,965.899.7440.1686.43−0.236Cytoplasm
Os03g0376800OsKH1454257,843.616.4144.4980.22−0.395Nucleus
Os03g0627500OsKH1551054,819.894.8153.1165.43−0.624Nucleus
Os03g0815700OsKH1628131,285.469.4863.6172.49−0.617Nucleus
Os04g0665700OsKH1730931,787.89.4841.2147.9−0.544Cytoplasm
Os05g0419500OsKH1829132,510.168.855.7980−0.53Cytoplasm
Os05g0481500OsKH1928231,240.658.6563.4574.04−0.565Nucleus
Os06g0342500OsKH2066272,249.25.9155.7476.18−0.577Nucleus
Os06g0618100OsKH2129530,451.579.5338.849.46−0.479Nucleus
Os07g0227400OsKH2228632,135.569.1656.9970.91−0.685Nucleus
Os07g0439100OsKH2323324,955.94.6128.8879.53−0.344Nucleus
Os08g0100700OsKH2475379,140.089.4361.7266.02−0.504Nucleus
Os08g0110800OsKH2570072,186.114.8860.1741.61−0.95Nucleus
Os08g0200400OsKH2645448,932.736.3942.8894.91−0.207Cytoplasm
Os09g0498600OsKH2761665,484.487.3149.7272.44−0.325Mitochondria
Os10g0414700OsKH2858665,147.675.6859.1380.24−0.336Cytoplasm
Os10g0495000OsKH2976283,489.638.2650.2379.76−0.594Nucleus
Os10g0564000OsKH3045848,410.675.2143.8390.37−0.139Cytoplasm
Os12g0597600OsKH3151754,962.924.8956.5864.35−0.66Cytoplasm
Disclaimer/Publisher’s Note: The statements, opinions and data contained in all publications are solely those of the individual author(s) and contributor(s) and not of MDPI and/or the editor(s). MDPI and/or the editor(s) disclaim responsibility for any injury to people or property resulting from any ideas, methods, instructions or products referred to in the content.

