Abstract
The disruption of circadian rhythms (CRs) has been linked to metabolic disorders, yet the role of hepatic BMAL1, a key circadian regulator, in the whole-body metabolism and the associated lipid metabolic phenotype in the liver remains unclear. Bmal1 floxed (Bmal1f/f) and hepatocyte-specific Bmal1 knockout (Bmal1hep−/−) C57BL/6J mice underwent a regular feeding regimen. Hepatic CR, lipid content, mitochondrial function, and systemic metabolism were assessed at zeitgeber time (ZT) 0 and ZT12. Relevant molecules were examined to elucidate the metabolic phenotype. Hepatocyte-specific knockout of Bmal1 disrupted the expression of rhythmic genes in the liver. Bmal1hep−/− mice exhibited decreased hepatic TG content at ZT0, primarily due to enhanced lipolysis, reduced lipogenesis, and diminished lipid uptake. The β-oxidation function of liver mitochondria decreased at both ZT0 and ZT12. Our findings on the metabolic profile and associated hepatic lipid metabolism in the absence of Bmal1 in hepatocytes provides new insights into metabolic syndromes from the perspective of liver CR disturbances.
1. Introduction
The circadian rhythms (CRs), or biological clock, orchestrates recurring physiological changes over a 24-hour cycle. Governed by a central clock situated in the anterior suprachiasmatic nucleus (SCN) and peripheral clocks in various tissues [1], the peripheral clocks regulate daily gene expression for physiological processes [2,3]. The precise regulation of the biological clock involves a set of rhythmic genes known as clock-controlled genes (CCGs) [4]. CCGs, including the central gene Bmal1 (brain and muscle arnt-like 1), form a feedback loop with Clock, Per, and Cry, collectively regulating the CR [5]. Disruption of the CR, as seen in global Bmal1 knockout mice, leads to loss of rhythm, premature aging, tendon calcification, reduced locomotor activity and body weight, and elevated reactive oxygen species levels [3,6,7,8]. A well-functioning CR is crucial for proper maintenance of physiological processes.
The liver is integral to lipid metabolism, with hepatocytes intricately regulating processes such as fatty acid uptake, oxidation, synthesis, and release under the precise control of CCGs [9]. Bmal1 plays a regulatory role in hepatic lipid synthesis, encompassing lipoprotein synthesis [10,11]. In our previously study, we found that exposure to ambient fine particulate matter (PM2.5) disturbed hepatic Bmal1 circadian oscillations at ZT0 and disrupted hepatic lipid metabolism at ZT12 [12]. Its global deletion has been demonstrated to be involved in glucose homeostasis and lead to dysregulation of the Elovl3 rhythm in the liver [13], indicating an association between hepatic lipid metabolism stability and precise CR regulation. Previous studies on the impact of BMAL1 on liver metabolism have mostly focused on external zeitgebers (such as restricted feeding) [14,15] or non-alcoholic fatty liver disease (NAFLD) induced by a high-fat diet (HFD) [7,8,11]. There is a scarcity of comprehensive research on the effects of BMAL1 on liver metabolism under normal physiological conditions (unrestricted access to food and water with a standard chow diet).
This study provides the metabolic profile by employing a hepatocyte-specific Bmal1 knockout (Bmal1hep−/−) mouse model and examines the specific role of clock gene Bmal1 in hepatic lipid metabolism.
2. Results
2.1. Construction of Hepatocyte-Specific Bmal1 Knockout Mice and the CCG Profile in the Liver
In our previously study, we found that exposure to PM2.5 disturbed Bmal1 circadian oscillations at ZT0 and disrupted hepatic lipid metabolism at ZT12 [12]. To build upon our previous findings, we generated Bmal1hep−/− mice by crossing Bmal1f/f mice with Alb-Cre mice (Figure 1A). In Bmal1hep−/− mice, Bmal1 expression was markedly reduced and abolished in liver tissue (Figure 1B,C).
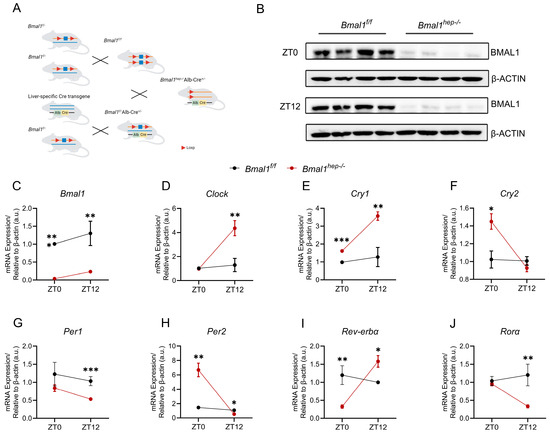
Figure 1.
Hepatocyte-specific Bmal1 knockout disrupted CR of hepatic CCGs. (A). The CRISPR/Cas9 strategy employed is depicted schematically. (B). Western blot analysis of BMAL1 in the liver tissue of Bmal1f/f and Bmal1hep−/− mice ZT0 and ZT12. β-Actin was used as a loading control. Quantification of the results was performed from three independent experiments. (C–J). Diurnal changes in expression of Bmal1, Clock, Cry1, Cry2, Per1, Per2, Rev-erbα, and Rorα in the liver tissue of Bmal1f/f and Bmal1hep−/− mice. The values are presented as mean ± SEM. Bmal1f/f mice, n = 11; Bmal1hep−/− mice, n = 12. * p < 0.05, ** p < 0.01, *** p < 0.001.
We examined the expression of core CCGs in the liver of mice at ZT0 and ZT12. At ZT0, Bmal1hep−/− mice displayed a significant upregulation of Cry1, Cry2, and Per2, with a significant downregulation of Rev-erbα. At ZT12, Bmal1hep−/− mice exhibited a significant upregulation of Clock, Cry1, and Rev-erbα, while Per1, Per2, and Rorα were significantly downregulated (Figure 1D–J). These findings collectively indicated substantial alterations in hepatic CCGs resulting from hepatocyte-specific Bmal1 knockout.
2.2. Profiles of Hepatic Lipid Metabolism in Hepatocyte-Specific Bmal1 Knockout Mice
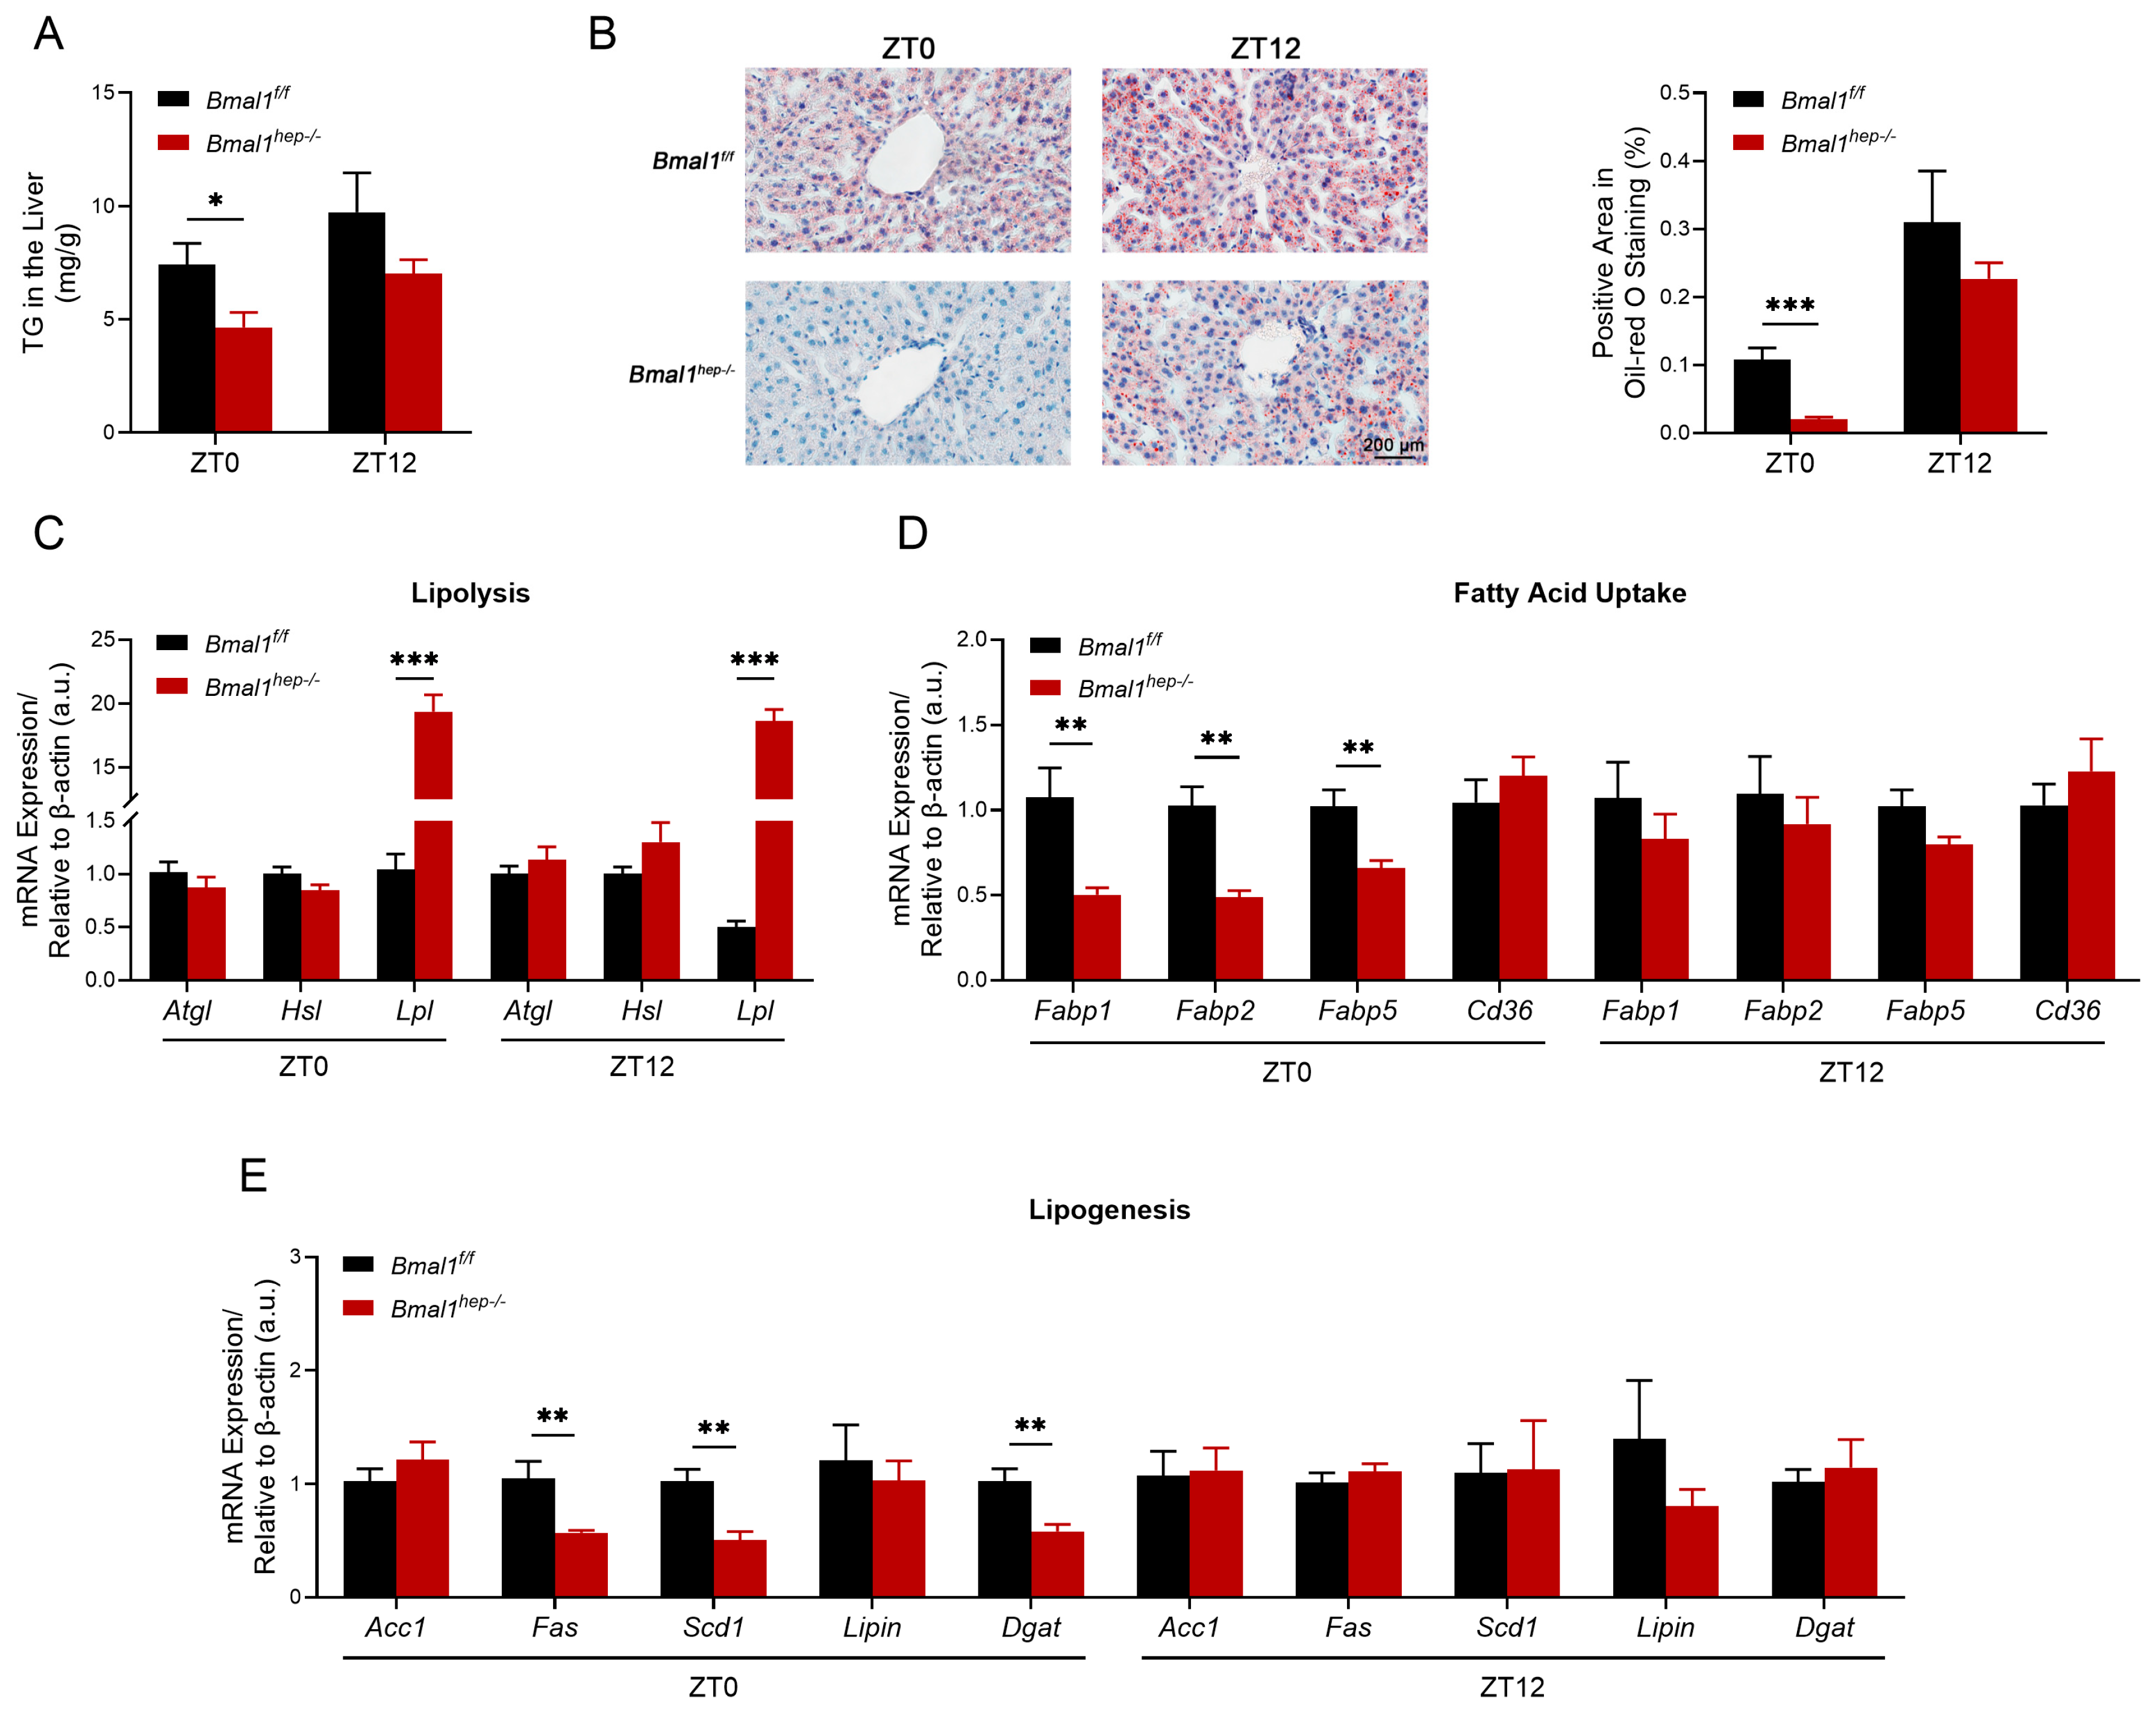
Liver-clock mutant mice exhibit impaired lipid homeostasis, which is partially regulated by BMAL1/LIPIN/DGAT signaling [16,17]. Combined with our previous research findings, we investigated hepatic lipid metabolism in Bmal1hep−/− mice, focusing on changes in lipolysis, lipid uptake, and synthesis. At ZT0, the level of TG was significantly lower in Bmal1hep−/− mice (Figure 2A), and this finding was confirmed by Oil Red O staining (Figure 2B). The expression of enzymes for lipolysis (Lpl but not Atgl or Hsl) significantly increased (Figure 2C), while the expression of fatty acid uptake receptors (Fabp1, Fabp2, and Fabp5) (Figure 2D) and lipogenic enzymes (Fas, Scd1, and Dgat) (Figure 2E) significantly decreased. At ZT12, the expression of Lpl still exhibited a significant increase in Bmal1hep−/− mice (Figure 2C) with no change in the level of TG (Figure 2A,B), while other genes that previously exhibited changes at ZT0 did not show significant differences (Figure 2D,E). No significant difference was observed in lipid export genes (Mttp and Apob) between Bmal1f/f and Bmal1hep−/− mice (Supplementary Figure S1). Based on the findings, the decrease in hepatic TG levels at ZT12 in the 24th week could be attributed to heightened lipolysis, diminished lipogenesis, and decreased expression of lipid receptors resulting from the deletion of Bmal1.

Figure 2.
The measurement of TG in the liver and the diurnal changes of corresponding lipid metabolism enzyme genes. (A). Total TG levels in the hepatic lipid extracts at ZT0 and ZT12. (B). Representative pictures of Oil Red O staining and the corresponding area analysis at ZT0 and ZT12. The black scale bar represents 200 μm. (C–E). mRNA levels of enzymes involved in hepatic lipolysis (C), fatty acid uptake (D), and lipogenesis (E) at ZT0 and ZT12. Bmal1f/f mice, n = 6; Bmal1hep−/− mice, n = 6. * p < 0.05, ** p < 0.01, *** p < 0.001.
2.3. Profiles of Hepatic Mitochondrial Function in Hepatocyte-Specific Bmal1 Knockout Mice
The rhythmic metabolism of liver lipids is closely related to mitochondrial beta-oxidation involving molecules such as PPAR-α, CPT1, DBP1, and PGC1 [18,19]. Considering the enhanced lipolysis in Bmal1hep−/− mice, we conducted assays on mitochondrial function at ZT12 (end of light phase) using mitochondria isolated from mouse livers. At the Leak state (using glutamate and malate for Leak state respiration), respiration in both groups was unaffected by Bmal1 deletion. In the CI-linked OXPHOS and CI&II-linked OXPHOS states, Bmal1hep−/− mice showed a decrease of 43.3% and 32.5%, respectively, compared to Bmal1f/f mice, indicating a reduction in ATP production through oxidative phosphorylation. To assess the maximal capacity of the electron transfer system (ETS), uncoupler CCCP was added to reach the maximum capacity. Uncoupled respiration demonstrated that Bmal1hep−/− caused a reduction of CII-linked ETS capacity by 34.6%. CIV-driven respiration was decreased by 12.1% in Bmal1hep−/− mice compared to Bmal1f/f mice (Figure 3A). However, further analysis of mitochondrial function throughout the entire process from CI-Leak to CIV state revealed that deletion of Bmal1 led to a decline in mitochondrial function, but no statistically significant difference was observed between groups (Figure 3B). Accordingly, Bmal1hep−/− mice exhibited a significant downregulation of Acox1, Ppara, and Pgc1β at ZT12 (Figure 3C), whereas Cpt1α, Ppara, Dbp1, Pgc1α, Pgc1β, and Pparγ were significantly downregulated at ZT0 (Figure 3D).
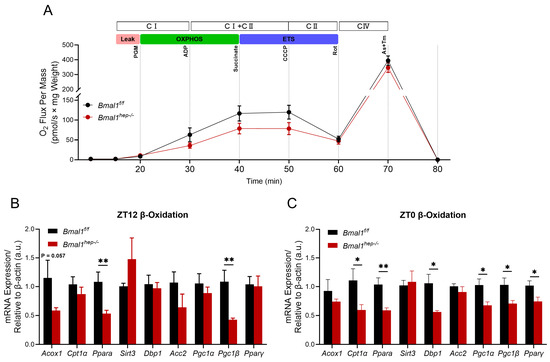
Figure 3.
Combined determination of oxygen flux by O2k-Fluorometry in isolated hepatic mitochondria and expression of β-oxidation-related genes. (A). Oxygen flux changes relative to the liver weight. Bmal1f/f mice, n = 3; Bmal1hep−/− mice, n = 5. (B,C). Diurnal changes in expression of Acox1, Cpt1α, Ppara, Sirt3, Dbp1, Acc2, Pgc1α, Pgc1β, and Pparγ in the liver tissue of Bmal1f/f and Bmal1hep−/− mice. The values are presented as mean ± SEM. Bmal1f/f mice, n = 6; Bmal1hep−/− mice, n = 6. * p < 0.05, ** p < 0.01.
Considering the impact of BMAL1 on mitochondrial respiratory substrates, we utilized a Promethion Core Metabolic System to assess the respiratory exchange ratio during the 14th week of the experiment (at 22 weeks of age in mice). The Bmal1f/f mice had a respiratory exchange ratio of 0.89643, while the Bmal1hep−/− mice had a respiratory exchange ratio of 0.902038 (Supplementary Figure S2), indicating no significant difference between the two groups. These results suggested that glucose was the primary substrate for aerobic respiration and that liver-specific BMAL1 knockout does not affect the overall aerobic respiratory substrates in the body.
Taken together, these results indicated decreased hepatic mitochondrial function due to Bmal1 deletion at both ZT0 and ZT12.
2.4. Profiles of Systemic Metabolism in Hepatocyte-Specific Bmal1 Knockout Mice
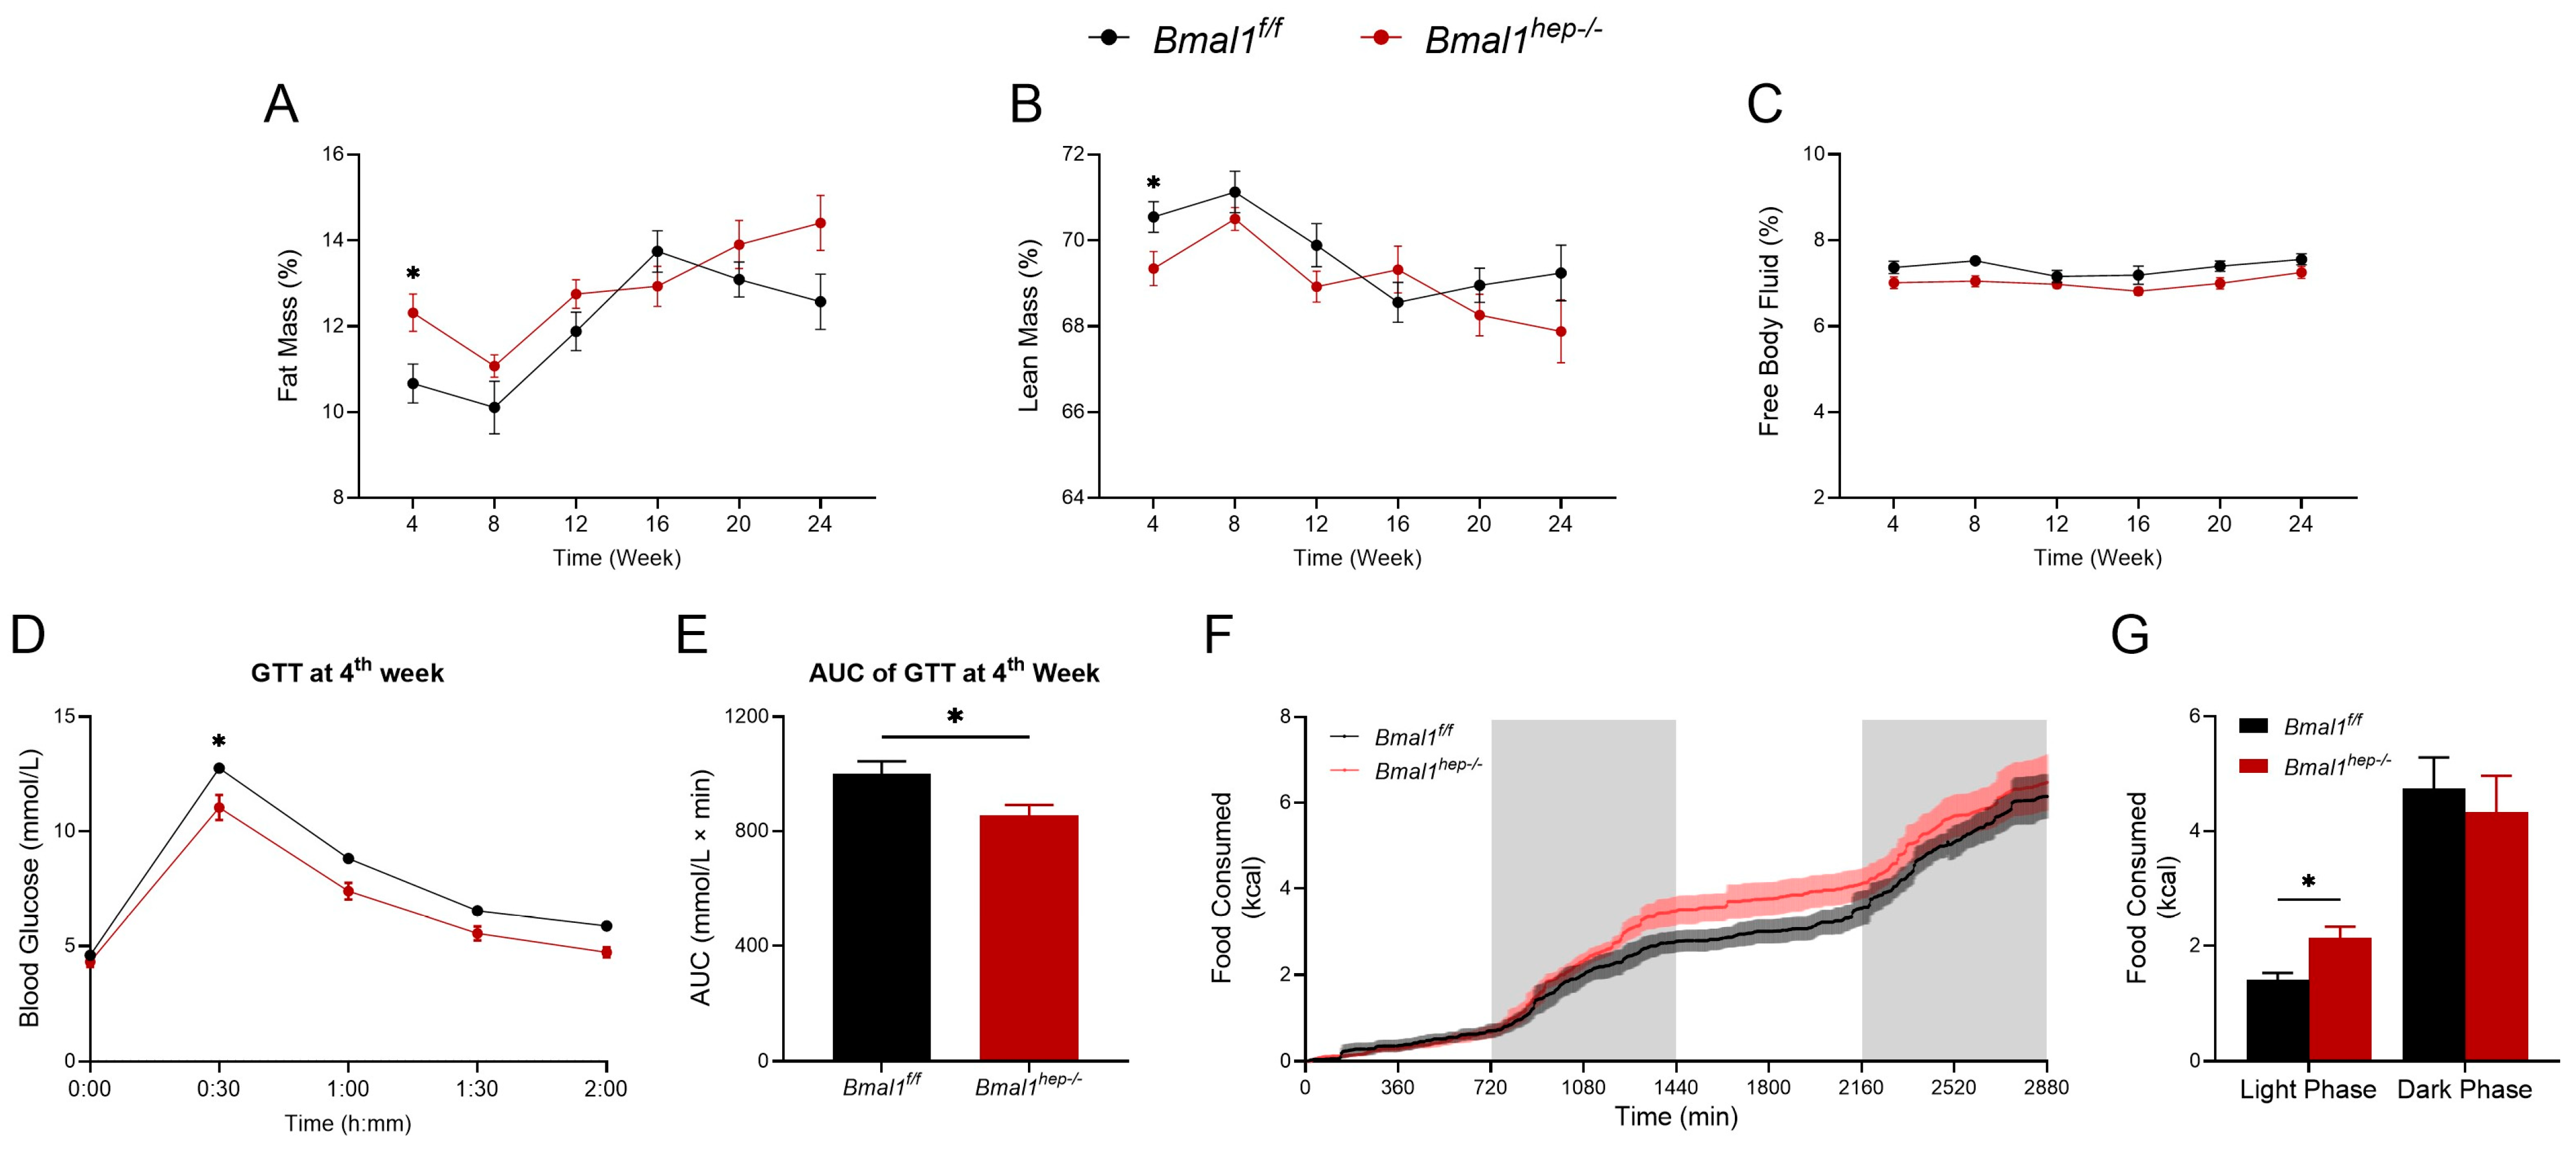
At the 4th week, Bmal1hep−/− mice showed a higher fat mass percentage and a lower lean mass percentage compared to the Bmal1f/f mice (Figure 4A,B). Additionally, at the 4th week, GTT revealed that Bmal1hep−/− mice demonstrated enhanced glucose tolerance compared to Bmal1f/f mice at the 30-min mark (Figure 4D). This observation was confirmed by the area under the curve (AUC) of GTT at the 4th week (Figure 4E). Throughout the experimental period, no discernible differences were observed in body weight, food intake, and free body fluid between Bmal1f/f and Bmal1hep−/− mice (Figure 4C and Supplementary Figure S3A,B). No other differences were noted in GTT and ITT examination between Bmal1f/f and Bmal1hep−/− mice throughout the experimental period (Supplementary Figure S3C–P).
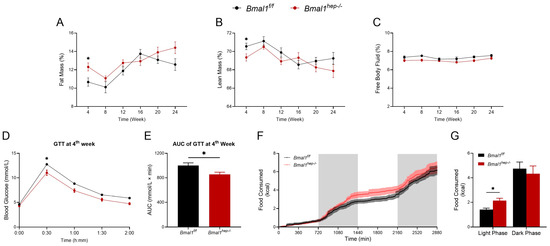
Figure 4.
Profiles of systemic metabolism in hepatocyte-specific Bmal1 knockout mice. (A–C). Fat mass (A), lean mass (B), and free body fluid (C) for different time points during the experiment in Bmal1f/f mice and Bmal1hep−/− mice. (D,E). Glycemic levels during GTT (D) and AUC analyses of GTT (E) at the 4th week during the experiment in Bmal1f/f mice and Bmal1hep−/− mice. (F–G). Metabolic cage measurements of cumulative food consumption at the 14th week during the experiment in Bmal1f/f mice and Bmal1hep−/− mice. The values are presented as mean ± SEM. Bmal1f/f mice, n = 11; Bmal1hep−/− mice, n = 12. * p < 0.05.
Considering the impact of BMAL1 on feeding rhythms, we utilized a Promethion Core Metabolic System to assess the impact of hepatocyte-specific Bmal1 deletion on whole-body metabolism during the 14th week of the experiment (mice at 22 weeks of age). During the light phase (ZT0–ZT12), Bmal1hep−/− mice consumed more food compared to Bmal1f/f mice (Figure 4G). No significant differences were noted in cumulative water consumption, pedestrian distance, or intra-cage distance (Supplementary Figure S4).
3. Discussion
In this study, we employed Bmal1hep−/− mice to provide a detailed profile of metabolism and novel insights into the impact of Bmal1 on hepatic lipid metabolism. The main findings are summarized as follows: (1) Hepatocyte-specific knockout of Bmal1 disrupted the expression of CCGs in the liver. (2) Under conditions of unrestricted access to food and water with a standard chow diet, liver-specific knockout mice exhibited a decrease in liver TG levels at ZT0, primarily due to enhanced lipolysis, reduced lipogenesis, and diminished lipid uptake. (3) The β-oxidation function of liver mitochondria decreased at both ZT0 and ZT12.
BMAL1 is a crucial component of the CR system, acting as a core transcriptional activator that initiates and sustains the expression of rhythmic genes within cells. This study built upon our previous research, which demonstrated that exposure to PM2.5 led to increased expression of Bmal1 at ZT0/24, while key liver lipid metabolism enzymes, ACL and FAS, exhibited the most significant changes at ZT12 [12]. Consequently, we conducted a more comprehensive metabolic analysis of Bmal1hep−/− mice focusing on the critical time points ZT0 and ZT12. The findings of Lamia et al. [3] also indicated that Bmal1 function in the liver was required for systemic glucose homeostasis in a time-of-day-dependent manner. Unlike that study, our research involved mice in a state of ad libitum feeding rather than restricted feeding. Notably, in the absence of external zeitgebers such as restricted feeding, the effects of BMAL1 deletion might be driven by E26 transformation-specific (ETS) factors (another class of transcription factors regulating CR), leading to more pronounced expression rhythms in LKO mouse livers compared to control mice [20]. In this study, we confirmed the establishment of a BMAL1 conditional gene knockout mouse model at both mRNA and protein levels. In Bmal1hep−/− mice, there was a significant increase in Clock mRNA levels at ZT12, indicating a compensatory or feedback mechanism within liver CCGs at this time point. Conversely, the expressions of Cry2 and Per2 were diametrically opposed to Clock and Bmal1, suggesting the primary regulatory role of BMAL1 in CCGs within the Bmal1hep−/− mouse liver. REV-ERB functions as a negative regulator of BMAL1, while ROR serves as a positive regulator [21]. The rhythmic expression patterns of both genes in Bmal1hep−/− mice were completely reversed compared to those in Bmal1f/f mice, providing further confirmation of hepatic Bmal1 deletion. Thus, peripheral BMAL1 controls the CR in the peripheral organ of liver.
Hepatic deletion of Bmal1 induced an imbalance in the lipid metabolism by enhancing the catabolism and inhibiting the anabolism in the liver. Bmal1 depletion has been shown to result in the inability to activate downstream PPARα, leading to a decrease in de novo lipid synthesis [22], which was consistent with the decreased expression of enzymes for lipid synthesis. In contrast, Lpl, the enzyme for lipolysis, increased significantly upon bmal1 ablation. Consistently, Bmal1 deletion did protect against obesity and non-alcoholic fatty liver disease induced by a high-fat diet [23,24]. However, Pparγ is a target gene of BMAL1/CLOCK, and Bmal1 deletion or Clock mutations in mice lead to a reduction in the expression of Pparγ [25]. Pparγ engages various transcriptional coactivators, such as PGC-1α, fostering a complex formation that binds to PPAR response elements (PPREs) within target gene promoters [26]. Our findings revealed a significant decrease in the expression of PPARγ and Pgc1α in the Bmal1-/- mice at ZT0. Similarly, FABPs, the proteins which bind with fatty acids for further oxidation, were downregulated as well. Thus, Bmal1 deletion may shift the cell towards the breakdown of stored lipids rather than engaging in new lipid synthesis and fatty acid oxidation. The study by Shimba et al. used a high-fat diet [24], while Chaix et al. employed a time-restricted feeding method [14]. These different dietary patterns resulted in distinct overall metabolic phenotypes. Therefore, the impact of hepatic BMAL1 deletion on lipid synthesis requires further investigation.
Although we observed no significant difference in energy production in the presence or absence of hepatic BMAL1, the diminished expression of Bmal1 in the hepatocytes exerted a decline in mitochondrial function. BMAL1, through its circadian regulation (DBP) [27], coordinates the expression of various metabolic genes, integrating lipid metabolism (PPARs, CPT1α, and ACC2) [12], mitochondrial function (PGC1) [28], and overall energy homeostasis. Mitochondrial dynamics, particularly fission and mitophagy, as well as biogenesis, are transcriptional targets of BMAL1 [29]. Loss of BMAL1 function resulted in swollen mitochondria, diminished respiration, and elevated oxidative stress. Restoration of hepatic BMAL1 activity in high-fat-fed mice improved metabolic outcomes and rescued the morphological and metabolic defects of BMAL1-deficient mitochondria [7]. Further research is needed to understand the impact of BMAL1 loss on mitochondrial function under normal dietary conditions.
With CR disorder being recognized in metabolic diseases, BMAL1 has attracted increasing attention, and animals with global or conditional knockout of BMAL1 are ideal models for metabolism investigation. Interestingly, Bmal1hep−/− mice exhibited dynamic fluctuation in metabolism, higher fat mass composition, lower lean mass composition, and improved glucose tolerance at the 4th week, but not other ages (8, 12, or 20 weeks of age). In addition, cerebral BMAL1 knockout mice exhibited reduced time on the rotarod, calorie consumption, and food and water intake [30], whereas Bmal1hep−/− mice demonstrated an increased proportion of food consumption during the daytime and no significant changes in other parameters. Recently, uninterrupted rodents underwent unlimited period measurements of breathing patterns, revealing a close correlation between circadian fluctuations and O2 inhalation, CO2 exhalation, and body temperature changes, predominantly dictated by central rhythms [31]. Thus, central BMAL1 is likely the primary regulator of more comprehensive activities, while hepatic BMAL1 may be limitedly involved in the regulation of dietary behavior [14]. Additionally, more observations were shown at ZT0 but not ZT12, indicating ZT0 may be an appropriate time point for investigation into hepatic lipid metabolism in the context of CCGs. These findings provide an important basis for guiding experiment design, including animal age selection and zeitgeber time selection.
This study has certain limitations. Firstly, a more extensive sampling approach capturing additional ZT points across the circadian cycle would enhance the characterization of rhythmic variations. Secondly, the phenotype for male mice was not assessed, and it is important to recognize potential sex differences in metabolism in response to hepatic BMAL1 deletion. Addressing these limitations in future research will contribute to a more comprehensive understanding of the CR’s role in maintaining liver lipid homeostasis.
4. Materials and Methods
4.1. Reagents and Antibodies
The chemicals used in this study included EGTA (103777-10G), lactobionic acid (153516), taurine (T0625-25G), HEPES (H7523-50G), D-sucrose (84097), BSA (SRE0098-10G), pyruvate (P2256-5G), glutamate (49621-250G), malate (M1125-5G), ADP (A2754-1G), cytochrome c (C7752-50MG), succinate (S9637-100G), CCCP (C2759-250MG), rotenone (R8875-1G), antimycin A (A8674-25MG), ascorbate (PHR1279-1G), and TMPD (T3134-5G), all of which were procured from MilliporeSigma Canada Ltd. (Oakville, ON, Canada). MgCl2·6H2O (S24121-500G) was obtained from Shanghai YuanYe Biotechnology Co., Ltd (Shanghai, China). KH2PO4 (A501211-0500) was sourced from Sangon Biotech Co., Ltd (Shanghai, China). Humulin (human regular insulin) was acquired from Lilly (Indianapolis, IN, USA). Rabbit anti-mouse antibodies against BMAL1 (ab231793) were obtained from abcam Inc. (Cambridge, UK). Mouse anti-mouse antibodies against β-ACTIN (Catalog #66009-1) were obtained from Proteintech Group, Inc. (Wuhan, China).
4.2. Hepatocyte-Specific Bmal1 Knockout Mouse Model
All mice of the C57BL/6J background were used in this study. Bmal1 floxed (Bmal1f/f) mice were bred by Gem Pharmatech (Gem Pharmatech Co., Ltd., NanJing, China). Hepatocyte-specific Bmal1 knockout (Bmal1hep−/−) mice were generated by crossing Bmal1f/f mice with Alb-Cre transgenic mice (Figure 1A). Seven-week-old female Bmal1f/f and Bmal1hep−/− mice were separately housed in cages with ad libitum access to a normal chow diet and water under a 12/12-h light/dark cycle at a temperature of 22 ± 2 °C. After a one-week acclimation, all mice received the same feeding regimen. ZT0 was set as 6 a.m., when the lights were turned on, and ZT12 was set as 6 p.m., when the lights were turned off. To build upon our previous findings that exposure to PM2.5 increases Bmal1 expression at ZT0/24 and significantly affects the liver lipid metabolism enzymes ACL and FAS at ZT12 [12], we focused our comprehensive metabolic analysis on Bmal1hep−/− mice at the critical time points of ZT0 and ZT12. At the end of the 24th week, mice were anesthetized with pentobarbital sodium (20 mg/kg, intraperitoneal injection) and liver tissues were obtained at ZT0 or ZT12 time points. The animal experiment protocol was reviewed and approved by the Animal Care and Use Committee of Zhejiang Chinese Medical University (animal use grant NO. 202107-0403).
4.3. Protein Extraction and Immunoblotting
At the end of the 24-week experiment (32 weeks of age in mice), an appropriate amount of liver tissue was added to the radioimmunoprecipitation assay (RIPA) lysis and centrifuged to extract the supernatant. Protein samples were prepared by quantifying the protein concentration with the bicinchoninic acid (BCA) method. Equal amounts of protein were loaded onto 8% or 10% homemade gels and then transferred to polyvinylidene fluoride (PVDF) membranes. After blocking with 5% skim milk for 90 min at room temperature, membranes were washed three times with 1 × tris-buffered saline-tween (TBST) for 10 min each time and then incubated with the corresponding primary antibodies overnight at 4 °C. After washing three times for 10 min, membranes were incubated for 1 h with the corresponding secondary antibody at ambient temperature. Immunoreactive protein levels were analyzed using a chemiluminescence imaging system (Bio-Rad, USA), and β-actin was used as an internal reference correction. Grayscale values of the protein were analyzed quantitatively with the ImageJ software (Version 1.54f, NIH, Bethesda, MD, USA).
4.4. RNA Extraction and Quantitative RT-PCR Analysis
At the end of the 24-week experiment (32 weeks of age in mice), RT-PCR analysis was conducted using RNA isolated from liver tissues. Total RNA extraction was performed using the Trizol reagent (TaKaRa, Shiga, Japan). Subsequently, cDNA was synthesized from the RNA using the PrimeScript RT Master Mix (TaKaRa, Shiga, Japan) following the manufacturer’s protocol. Gene expression levels were assessed using the QuantStudio Q7 system (Applied Biosystems, Carlsbad, CA, USA). The relative gene expression was calculated using the 2−△△Ct method normalized to the expression of the β-actin gene. Details of the primer sequences are provided in Table 1.

Table 1.
Primers used for real-time PCR.
4.5. Measurement of Hepatic TG
At the end of the 24-week experiment (32 weeks of age in mice), the experimental setup followed the guidelines provided by the TG test kits (DiaSys Diagnostics, Frankfurt, Germany) and was conducted in a 96-well plate. Approximately 100 mg of liver tissue was homogenized in the reaction buffer. Following the incubation period, absorbance readings were obtained using a Varioscan Flash microplate reader (Thermo Fisher Scientific, Waltham, MA, USA). The obtained data were subsequently normalized to the corresponding body weight.
4.6. Liver Oil Red O Staining
At the end of the 24-week experiment (32 weeks of age in mice), the liver tissues of mice were fixed and embedded in an optimal cutting temperature (OCT) compound (Servicebio, Wuhan, China). The embedded specimens were sectioned into 5 μm thick slices for subsequent staining with Oil Red O. A 5 μm thick slice was immersed in a freshly prepared Oil Red O working solution and kept in the dark for 8–10 min. Afterward, the slices were removed, allowed to stand for 3 s, and sequentially immersed in two containers of 60% isopropanol for differentiation for either 3 or 5 s. Subsequently, the slices were immersed in two containers of pure water for 10 s each. Hematoxylin staining was performed followed by microscopic examination of the staining effect and final sealing. The histopathological changes in the liver were observed using a Nano Zoomer S60 imaging system (Hamamatsu, Hamamatsu City, Japan). The percentage of positive areas in the liver Oil Red O staining was quantified using ImageJ software (Version 1.54f, NIH, Bethesda, MD, USA).
4.7. Mitochondrial Function Assays (O2K)
At ZT12 at the end of the 24-week experiment (32 weeks of age in mice), the mice were euthanized, and 2 mg of liver tissue was mechanically homogenized in a respiration medium, namely MIR05 buffer. The composition of the MIR05 buffer included 0.5 mM EGTA, 3 mM MgCl2·6H2O, 60 mM lactobionic acid, 20 mM taurine, 10 mM KH2PO4, 20 mM HEPES, 110 mM D-sucrose, and 1 g/L essentially fatty-acid-free BSA, with the pH adjusted to 7.1 at 37 °C. The liver tissue suspension was loaded into the chamber of the Oroboros 2K oxygraph system (Oroboros Instruments, Innsbruck, Austria), which was filled with the MIR05 buffer. The measurement of oxygen consumption rates proceeded with the sequential addition of substrates and specific inhibitors:
- (1)
- Substrates of complex I (2 M pyruvate, 2 M glutamate, and 0.4 M malate, i.e., PGM) were added to maintain stable respiratory values and obtained the leak value of complex I (CI leak).
- (2)
- Substrates of complex I-driven phosphorylating respiration (CI OXPHOS and 2.5 mM ADP) were added to maintain stable respiratory values.
- (3)
- The intactness of the mitochondrial outer membrane was assessed by addition of exogenous 10 uM cytochrome c.
- (4)
- Substrates of complex I- and complex II-driven phosphorylating respiration (CI+CII OXPHOS and 10 mM succinate) were added to maintain stable respiratory values.
- (5)
- Titrating concentrations of the mitochondrial uncoupler 0.1 Mm CCCP was added to reach the maximal, uncoupled respiration (CI+CII electron transfer system, ETS).
- (6)
- To fully inhibit complex I-driven respiration, 1 mM rotenone was added, and complex II-driven uncoupled respiration (CII electron transfer system, CII ETS) was measured.
- (7)
- To block mitochondrial respiration at the level of complex III, 5 mM antimycin A was added.
- (8)
- To measure cytochrome c oxidase (CIV or COX)-driven respiration, 0.8 mM ascorbate and 0.2 Mm TMPD were added.
4.8. Whole-Body Composition Analysis
At weeks 4, 8, 12, 16, 20, and 24 of the experiment (12, 16, 20, 24, 28, and 32 weeks of age in mice), the whole-body composition analysis was conducted. During the analysis procedure, the mice remained awake and were placed in an acrylic cylinder. The Bruker TD-NMR system (minispec LF50, Bruker, Billerica, MA, USA) was used to measure the whole-body composition. The magnetic field was set at 0.17 T and 7.5 MHz frequency pulse. The measurements of fat, lean mass, and fluid were recorded, and mice were returned to their home cage in 1 min. Data were normalized to body weight [32].
4.9. Evaluation of Glucose Homeostasis
At weeks 4, 8, 12, and 20 of the experiment (12, 16, 20, and 28 weeks of age in mice), the glucose homeostasis was evaluated. Mice were fasted for 12 h for intraperitoneal glucose tolerance testing (IPGTT) and were subsequently intraperitoneally injected with dextrose (2 mg/g body weight). Blood was drawn from the tail vein at 0, 30, 60, 90, and 120 min, and glucose concentration was determined using a FreeStyle glucometer (Abbott Diabetes Care Inc., Alameda, CA, USA). For insulin tolerance testing (ITT), mice were fasted for 4.5 h and then injected intraperitoneally with insulin (0.5 U/kg body weight), and blood glucose was measured at 0, 30, 60, 90, and 120 min [33]. IPGTT and ITT were performed at the 4th, 8th, 12th, and 20th weeks.
4.10. Metabolic Assessment
At the 14th week of the experiment (22 weeks of age in mice), the Promethion Core Metabolic System (Sable Systems International, North Las Vegas, NV, USA) was used to measure a series of metabolic parameters, including food consumption, water consumption, locomotor activity, oxygen consumption (VO2), carbon dioxide exhalation (VCO2), respiratory exchange ratio (RER), and energy expenditure (heat production). Mice were housed in individual monitoring cages of the Promethion Core Metabolic System and acclimated for 48 h before recording. Light and feeding conditions were kept the same as in the home cages. The concentrations of O2 and CO2 were measured by calculating the air entering and leaving the chambers. The respiratory exchange ratio is the ratio of CO2 production to O2 consumption. Data were normalized to body weight [34].
4.11. Statistical Analysis
All data were expressed as the mean ± standard error of the mean (S.E.M) unless otherwise indicated. The analyses were performed using Graphpad Prism software (Version 10.0.0, GraphPad Software, Boston, MA, USA). For the analysis, the t-test was used when comparing the Bmal1f/f group with the Bmal1hep−/− group. A p-value of <0.05 was considered statistically significant.
5. Conclusions
In summary, our research unveils the metabolic profiles of liver-specific Bmal1 knockout in mice. Upon disrupting hepatic CR, hepatic deletion of Bmal1 enhanced lipid catabolism and suppressed lipid anabolism and fatty acid oxidation. The present study provides direct basis for adopting liver-specific Bmal1-deleted animals for metabolic investigation.
Supplementary Materials
The following supporting information can be downloaded at: https://www.mdpi.com/article/10.3390/ijms25116070/s1.
Author Contributions
Conceptualization, W.G. and C.L.; formal analysis, R.C.; investigation, W.G., T.L., Y.H., R.W., L.Z., and R.L.; writing—original draft preparation, W.G. and T.L.; writing—review and editing, C.L.; supervision, C.L.; project administration, C.L.; funding acquisition, C.L., W.G. and Y.H. All authors have read and agreed to the published version of the manuscript.
Funding
This research was funded by the National Natural Science Foundation of China (grant numbers 81973001 and 82273590 to Cuiqing Liu and 81904027 to Weijia Gu), Medical Health Science and Technology Project of Zhejiang Provincial Health Commission (grant number 2019KY471 to Lu Zhang and 2019KY472 to Weijia Gu), Zhejiang Provincial College Student Science and Technology Innovation Projects (grant number 2023R410030 to Yuxin Huang), and 2023 College Student Innovation and Entrepreneurship Training Program (grant number 202310344030 to Yuxin Huang).
Institutional Review Board Statement
All experiments and animal handling were performed following the National Institute of Health guidelines for experimental animal use, and approval was obtained from the Care of Animals and Ethical Committee for Animal Research of the Zhejiang Chinese Medical University (animal use grant NO. 202107-0403).
Informed Consent Statement
Not applicable.
Data Availability Statement
The data that support the findings of this study are available in the methods and/or Supplementary Material of this article.
Conflicts of Interest
Authors Weijia Gu, Lu Zhang, Rucheng Chen, Ran Li and Cuiqing Liu were employed by Zhejiang International Science and Technology Cooperation Base of Air Pollution and Health. The funders had no role in the design of the study; in the collection, analyses, or interpretation of data; in the writing of the manuscript; or in the decision to publish the results.
References
- Barclay, J.L.; Tsang, A.H.; Oster, H. Interaction of central and peripheral clocks in physiological regulation. Prog. Brain Res. 2012, 199, 163–181. [Google Scholar]
- Richards, J.; Gumz, M.L. Advances in understanding the peripheral circadian clocks. FASEB J. 2012, 26, 3602–3613. [Google Scholar] [CrossRef]
- Lamia, K.A.; Storch, K.F.; Weitz, C.J. Physiological significance of a peripheral tissue circadian clock. Proc. Natl. Acad. Sci. USA 2008, 105, 15172–15177. [Google Scholar] [CrossRef]
- Oosterman, J.E.; Kalsbeek, A.; la Fleur, S.E.; Belsham, D.D. Impact of nutrients on circadian rhythmicity. Am. J. Physiol. Regul. Integr. Comp. Physiol. 2015, 308, R337–R350. [Google Scholar] [CrossRef]
- Mohawk, J.A.; Green, C.B.; Takahashi, J.S. Central and peripheral circadian clocks in mammals. Annu. Rev. Neurosci. 2012, 35, 445–462. [Google Scholar] [CrossRef]
- Yu, E.A.; Weaver, D.R. Disrupting the circadian clock: Gene-specific effects on aging, cancer, and other phenotypes. Aging 2011, 3, 479–493. [Google Scholar] [CrossRef]
- Jacobi, D.; Liu, S.H.; Burkewitz, K.; Kory, N.; Knudsen, N.H.; Alexander, R.K.; Unluturk, U.; Li, X.B.; Kong, X.H.; Hyde, A.L.; et al. Hepatic Bmal1 Regulates Rhythmic Mitochondrial Dynamics and Promotes Metabolic Fitness. Cell Metab. 2015, 22, 709–720. [Google Scholar] [CrossRef] [PubMed]
- Jouffe, C.; Weger, B.D.; Martin, E.; Atger, F.; Weger, M.; Gobet, C.; Ramnath, D.; Charpagne, A.; Morin-Rivron, D.; Powell, E.E.; et al. Disruption of the circadian clock component BMAL1 elicits an endocrine adaption impacting on insulin sensitivity and liver disease. Proc. Natl. Acad. Sci. USA 2022, 119, e2200083119. [Google Scholar] [CrossRef]
- Guan, D.; Lazar, M.A. Interconnections between circadian clocks and metabolism. J. Clin. Investig. 2021, 131, e148278. [Google Scholar] [CrossRef]
- Pan, X.; Bradfield, C.A.; Hussain, M.M. Global and hepatocyte-specific ablation of Bmal1 induces hyperlipidaemia and enhances atherosclerosis. Nat. Commun. 2016, 7, 13011. [Google Scholar] [CrossRef]
- Lu, Z.; Li, X.; Wang, M.; Zhang, X.; Zhuang, R.; Wu, F.; Li, W.; Zhu, W.; Zhang, B. Liver-Specific Bmal1 Depletion Reverses the Beneficial Effects of Nobiletin on Liver Cholesterol Homeostasis in Mice Fed with High-Fat Diet. Nutrients 2023, 15, 2547. [Google Scholar] [CrossRef] [PubMed]
- Li, R.; Wang, Y.; Chen, R.; Gu, W.; Zhang, L.; Gu, J.; Wang, Z.; Liu, Y.; Sun, Q.; Zhang, K.; et al. Ambient fine particulate matter disrupts hepatic circadian oscillation and lipid metabolism in a mouse model. Environ. Pollut. 2020, 262, 114179. [Google Scholar] [CrossRef] [PubMed]
- Rudic, R.D.; McNamara, P.; Curtis, A.M.; Boston, R.C.; Panda, S.; Hogenesch, J.B.; Fitzgerald, G.A. BMAL1 and CLOCK, two essential components of the circadian clock, are involved in glucose homeostasis. PLoS Biol. 2004, 2, e377. [Google Scholar] [CrossRef] [PubMed]
- Chaix, A.; Lin, T.; Le, H.D.; Chang, M.W.; Panda, S. Time-Restricted Feeding Prevents Obesity and Metabolic Syndrome in Mice Lacking a Circadian Clock. Cell Metab. 2019, 29, 303–319.e4. [Google Scholar] [CrossRef] [PubMed]
- Zhang, D.; Tong, X.; Arthurs, B.; Guha, A.; Rui, L.; Kamath, A.; Inoki, K.; Yin, L. Liver clock protein BMAL1 promotes de novo lipogenesis through insulin-mTORC2-AKT signaling. J. Biol. Chem. 2014, 289, 25925–25935. [Google Scholar] [CrossRef] [PubMed]
- Manella, G.; Sabath, E.; Aviram, R.; Dandavate, V.; Ezagouri, S.; Golik, M.; Adamovich, Y.; Asher, G. The liver-clock coordinates rhythmicity of peripheral tissues in response to feeding. Nat. Metab. 2021, 3, 829–842. [Google Scholar] [CrossRef] [PubMed]
- Valcin, J.A.; Udoh, U.S.; Swain, T.M.; Andringa, K.K.; Patel, C.R.; Al Diffalha, S.; Baker, P.R.S.; Gamble, K.L.; Bailey, S.M. Alcohol and Liver Clock Disruption Increase Small Droplet Macrosteatosis, Alter Lipid Metabolism and Clock Gene mRNA Rhythms, and Remodel the Triglyceride Lipidome in Mouse Liver. Front. Physiol. 2020, 11, 1048. [Google Scholar] [CrossRef] [PubMed]
- Reddy, J.K.; Rao, M.S. Lipid metabolism and liver inflammation. II. Fatty liver disease and fatty acid oxidation. Am. J. Physiol. Gastrointest. Liver Physiol. 2006, 290, G852–G858. [Google Scholar] [CrossRef]
- Sinturel, F.; Spaleniak, W.; Dibner, C. Circadian rhythm of lipid metabolism. Biochem. Soc. Trans. 2022, 50, 1191–1204. [Google Scholar] [CrossRef] [PubMed]
- Ray, S.; Valekunja, U.K.; Stangherlin, A.; Howell, S.A.; Snijders, A.P.; Damodaran, G.; Reddy, A.B. Circadian rhythms in the absence of the clock gene Bmal1. Science 2020, 367, 800–806. [Google Scholar] [CrossRef]
- Adlanmerini, M.; Lazar, M.A. The REV-ERB Nuclear Receptors: Timekeepers for the Core Clock Period and Metabolism. Endocrinology 2023, 164, bqad069. [Google Scholar] [CrossRef] [PubMed]
- Zhang, D.; Tong, X.; Nelson, B.B.; Jin, E.; Sit, J.; Charney, N.; Yang, M.; Omary, M.B.; Yin, L. The hepatic BMAL1/AKT/lipogenesis axis protects against alcoholic liver disease in mice via promoting PPARα pathway. Hepatology 2018, 68, 883–896. [Google Scholar] [CrossRef]
- Zhan, C.; Chen, H.; Zhang, Z.; Shao, Y.; Xu, B.; Hua, R.; Yao, Q.; Liu, W.; Shen, Q. BMAL1 deletion protects against obesity and non-alcoholic fatty liver disease induced by a high-fat diet. Int. J. Obes. 2024, 48, 469–476. [Google Scholar] [CrossRef] [PubMed]
- Shimba, S.; Ogawa, T.; Hitosugi, S.; Ichihashi, Y.; Nakadaira, Y.; Kobayashi, M.; Tezuka, M.; Kosuge, Y.; Ishige, K.; Ito, Y.; et al. Deficient of a clock gene, brain and muscle Arnt-like protein-1 (BMAL1), induces dyslipidemia and ectopic fat formation. PLoS ONE 2011, 6, e25231. [Google Scholar] [CrossRef] [PubMed]
- Li, J.; Wei, L.; Zhao, C.; Li, J.; Liu, Z.; Zhang, M.; Wang, Y. Resveratrol Maintains Lipid Metabolism Homeostasis via One of the Mechanisms Associated with the Key Circadian Regulator Bmal1. Molecules 2019, 24, 2916. [Google Scholar] [CrossRef]
- Christofides, A.; Konstantinidou, E.; Jani, C.; Boussiotis, V.A. The role of peroxisome proliferator-activated receptors (PPAR) in immune responses. Metabolism 2021, 114, 154338. [Google Scholar] [CrossRef] [PubMed]
- Morishita, Y.; Miura, D.; Kida, S. PI3K regulates BMAL1/CLOCK-mediated circadian transcription from the Dbp promoter. Biosci. Biotechnol. Biochem. 2016, 80, 1131–1140. [Google Scholar] [CrossRef] [PubMed]
- Liu, C.; Li, S.; Liu, T.; Borjigin, J.; Lin, J.D. Transcriptional coactivator PGC-1alpha integrates the mammalian clock and energy metabolism. Nature 2007, 447, 477–481. [Google Scholar] [CrossRef] [PubMed]
- Ye, P.; Li, W.; Huang, X.; Zhao, S.; Chen, W.; Xia, Y.; Yu, W.; Rao, T.; Ning, J.; Zhou, X.; et al. BMAL1 regulates mitochondrial homeostasis in renal ischaemia-reperfusion injury by mediating the SIRT1/PGC-1α axis. J. Cell Mol. Med. 2022, 26, 1994–2009. [Google Scholar] [CrossRef]
- Liu, W.W.; Wei, S.Z.; Huang, G.D.; Liu, L.B.; Gu, C.; Shen, Y.; Wang, X.H.; Xia, S.T.; Xie, A.M.; Hu, L.F.; et al. BMAL1 regulation of microglia-mediated neuroinflammation in MPTP-induced Parkinson’s disease mouse model. FASEB J. 2020, 34, 6570–6581. [Google Scholar] [CrossRef]
- Mortola, J.P. Breathing around the clock: An overview of the circadian pattern of respiration. Eur. J. Appl. Physiol. 2004, 91, 119–129. [Google Scholar] [CrossRef] [PubMed]
- Gordon, C.J.; Phillips, P.M.; Johnstone, A.F. A noninvasive method to study regulation of extracellular fluid volume in rats using nuclear magnetic resonance. Am. J. Physiol. Ren. Physiol. 2016, 310, F426–F431. [Google Scholar] [CrossRef] [PubMed]
- Hu, R.; Zhang, L.; Qin, L.; Ding, H.; Li, R.; Gu, W.; Chen, R.; Zhang, Y.; Rajagoplan, S.; Zhang, K.; et al. Airborne PM2.5 pollution: A double-edged sword modulating hepatic lipid metabolism in middle-aged male mice. Environ. Pollut. 2023, 324, 121347. [Google Scholar] [CrossRef] [PubMed]
- Liu, C.; Fonken, L.K.; Wang, A.; Maiseyeu, A.; Bai, Y.; Wang, T.Y.; Maurya, S.; Ko, Y.A.; Periasamy, M.; Dvonch, T.; et al. Central IKKβ inhibition prevents air pollution mediated peripheral inflammation and exaggeration of type II diabetes. Part. Fibre Toxicol. 2014, 11, 53. [Google Scholar] [CrossRef] [PubMed]


Disclaimer/Publisher’s Note: The statements, opinions and data contained in all publications are solely those of the individual author(s) and contributor(s) and not of MDPI and/or the editor(s). MDPI and/or the editor(s) disclaim responsibility for any injury to people or property resulting from any ideas, methods, instructions or products referred to in the content. |
© 2024 by the authors. Licensee MDPI, Basel, Switzerland. This article is an open access article distributed under the terms and conditions of the Creative Commons Attribution (CC BY) license (https://creativecommons.org/licenses/by/4.0/).