Article

Genetic Alterations of SMYD4 in Solid Tumors Using Integrative Multi-Platform Analysis

by
Brunna Letícia Olivera Santana
,
Mariana Braccialli de Loyola
,
Ana Cristina Moura Gualberto
and
Fabio Pittella-Silva
*
Laboratory of Molecular Pathology of Cancer, Faculty of Healthy Sciences, University of Brasília, Federal District, Brasília 70910-900, Brazil
*
Author to whom correspondence should be addressed.
Int. J. Mol. Sci. 2024, 25(11), 6097; https://doi.org/10.3390/ijms25116097
Submission received: 30 April 2024 / Revised: 21 May 2024 / Accepted: 22 May 2024 / Published: 31 May 2024
(This article belongs to the Special Issue Epigenetic Dysregulation in Cancers: From Mechanism to Therapy)

Abstract

:
SMYD4 is a member of the SMYD family that has lysine methyltransferase function. Little is known about the roles of SMYD4 in cancer. The aim of this study is to investigate genetic alterations in the SMYD4 gene across the most prevalent solid tumors and determine its potential as a biomarker. We performed an integrative multi-platform analysis of the most common mutations, copy number alterations (CNAs), and mRNA expression levels of the SMYD family genes using cohorts available at the Cancer Genome Atlas (TCGA), cBioPortal, and the Catalogue of Somatic Mutations in Cancer (COSMIC). SMYD genes displayed a lower frequency of mutations across the studied tumors, with none of the SMYD4 mutations detected demonstrating sufficient discriminatory power to serve as a biomarker. In terms of CNAs, SMYD4 consistently exhibited heterozygous loss and downregulation across all tumors evaluated. Moreover, SMYD4 showed low expression in tumor samples compared to normal samples, except for stomach adenocarcinoma. SMYD4 demonstrated a frequent negative correlation with other members of the SMYD family and a positive correlation between CNAs and mRNA expression. Additionally, patients with low SMYD4 expression in STAD and LUAD tumors exhibited significantly poorer overall survival. SMYD4 demonstrated its role as a tumor suppressor in the majority of tumors evaluated. The consistent downregulation of SMYD4, coupled with its association with cancer progression, underscores its potential usefulness as a biomarker.

1. Introduction

Protein methyltransferases (PMTs) are a class of epigenetic modifiers essential for regulating a wide range of biological processes. Their misregulation can contribute to the development of various physiopathological conditions, including cancers. PMTs participate in crucial epigenetic processes by catalyzing the transfer of methyl groups to lysine or arginine residues. Molecular alterations in PMTs due to copy number alterations (CNA) or aberrant mRNA expression can lead to a series of dysfunctional events affecting several physiological conditions. The dysregulation of methylation processes has been linked to various pathological conditions, including cancer development, progression, and increased tumor aggressiveness, as well as metastatic events [1,2].
The SMYD (SET and MYND domain-containing proteins) family is a subgroup of protein methyltransferases that consists of five members (SMYD1-5). These proteins contain the SET domain, responsible for lysine methylation. The SET domain is divided into two segments by the MYND domain (Myeloid, Nervy, and DEAF-1), which is a unique characteristic of the SMYD family that facilitates protein-protein interactions [3]. While SMYD4 has been less studied in carcinogenesis compared to other members of the SMYD family, it has been identified as a potential tumor suppressor due to its observed downregulation in breast cancer [4,5,6]. High expression of SMYD4 has been implicated in the signaling pathways of cancer stem cells (CSCs), contributing to tumor cell transformation [7]. However, a comprehensive understanding of the molecular alterations in SMYD4 within the context of a specific cancer remains largely unexplored.
According to the World Health Organization, the four most prevalent tumors among males in 2022, excluding non-melanoma skin cancer, were lung cancer (15.3%), prostate cancer (14.2%), colorectal cancer (10.4%), and stomach cancer (6.1%). In females, the leading types were breast cancer (23.8%), lung cancer (9.4%), colorectal cancer (8.9%), and cervix cancer (6.8%) [8]. Despite the heterogeneity of these cancer types, classical molecular signatures, such as mutations or alterations in key cell cycle regulators, like TP53, are often described [9]. Whether these cancer types also share common alterations in epigenetic genes is still unknown.
In this study, we conducted an integrative multi-platform analysis using publicly available databases to investigate the prevalent molecular alterations in the genes of the SMYD family, specifically in SMYD4, across eight of the most common tumor types. We analyzed data from breast invasive carcinoma (BRCA), prostate adenocarcinoma (PRAD), colorectal carcinoma (CRC), and stomach adenocarcinoma (STAD), as well as the most common subtypes of lung cancer, namely lung adenocarcinoma (LUAD) and lung squamous cell carcinoma (LUSC). Additionally, we examined uterine corpus endometrial carcinoma (UCEC) and uterine carcinosarcoma (UCS) cohorts from the Cancer Genome Atlas (TCGA) and cBioPortal. We aimed to uncover the potential prognostic values associated with these alterations.

2. Results

2.1. Mutation Profile of SMYD Genes

We initially analyzed mutations in each SMYD family gene across the eight tumor types under examination. We used cohorts available at the cBio Cancer Genomics portal as well as at the Catalogue of Somatic Mutations in Cancer (COSMIC). The mutations in SMYD genes were examined in a total of 9696 patients encompassing all cancer types included in the analysis. Missense mutations were individually analyzed, as they were the most prevalent among the identified mutations, while other non-missense mutation types, such as frameshift, insertions, or deletions, were grouped and analyzed collectively. A total of 240 missense and 64 non-missense mutations were identified across the SMYD genes. The majority of missense mutations were located in non-conserved regions (129), followed by the SET domain (107) and the MYND domain (4). Specifically, SMYD4 exhibited a total of 50 mutations, with 32 located in non-conserved regions, 17 in the SET domain and 1 in the MYND domain (Figure 1).
It was observed that the mutation frequencies within the SMYD family were relatively low, with certain genes exhibiting mutation frequencies higher than 2%. Specifically, SMYD5 exhibited a mutation frequency of 2.3% in colorectal cancer, while SMYD1 demonstrated a mutation frequency of 2.3% in both lung adenocarcinoma and lung squamous cell carcinoma. In endometrial carcinoma, the mutation frequencies were 3.3% for SMYD1, 2.1% for SMYD2, 2.1% for SMYD3, 2.1% for SMYD4, and 2.4% for SMYD5. Moreover, in uterine carcinosarcoma, the mutation frequencies were 5.1% for SMYD1 and 2.5% for SMYD4 (Table 1). These findings indicate that uterine tumors exhibited the highest mutation frequencies among the SMYD genes within the tumors evaluated, with particular emphasis on the mutation frequency of SMYD1 in uterine carcinosarcoma.
However, no specific mutations across the SMYD genes were found to be frequently recurrent among patients with the same tumor type or within different tumors.

2.2. Copy Number Alterations in the SMYD Family Genes

Copy number alteration (CNA) refers to changes in DNA copy numbers occurring at specific locations in the genome. These alterations can lead to the activation of oncogenes or the suppression of tumor suppressor genes. Understanding the functionality of this mechanism is crucial for advancing the development of potential therapeutic and diagnostic markers [10]. We obtained CNA data for the SMYD genes through cBioPortal and analyzed these data using the GISTIC algorithm across all evaluated tumors [11].
SMYD4 exhibited a uniform alteration pattern, marked by a high incidence of heterozygous loss across all examined tumor types. These included colorectal adenocarcinoma (55.5%), stomach adenocarcinoma (37.4%), prostate adenocarcinoma (22.9%), lung squamous cell carcinoma (60.9%), lung adenocarcinoma (47.4%), breast carcinoma (51.3%), endometrial carcinoma (21%), and uterine carcinosarcoma (69.6%) (Figure 2A–H). Importantly, six out of eight tumors had heterozygous loss as the predominant CNA with a frequency of more than 30%. No other gene in the SMYD family exhibited a similar, consistently high level of heterozygous loss across the different tumor types.
In the case of SMYD1, the majority of alterations were observed as low-level gains in colorectal adenocarcinoma (18.5%), stomach adenocarcinoma (16.1%), lung squamous cell carcinoma (43.1%), lung adenocarcinoma (20%), endometrial carcinoma (17.1%), and uterine carcinosarcoma (46.4%). Prostate adenocarcinoma (7.6%) and breast carcinoma (8.2%) exhibited heterozygous loss as the most frequent alteration, although low-level gains exhibited frequencies of 6.2% and 7.9%, respectively (Figure 2A–H).
In all the tumors evaluated, low-level gains emerged as the most common alteration observed in SMYD2 and SMYD3. Notably, in the case of breast carcinoma, the frequency of high-level amplification accounted for 18.6% and 19.2% of the alterations in SMYD2 and SMYD3, respectively (Figure 2A–H). Finally, low-level gain was the most frequent alteration in SMYD5 in colorectal adenocarcinoma (19.5%), stomach adenocarcinoma (19.2%), squamous cell lung cancer (46.3%), lung adenocarcinoma (18.7%), endometrial carcinoma (18.2%), and uterine carcinosarcoma (44.6%) tumors. Prostate adenocarcinoma (10.1%) was characterized by heterozygous loss. Breast carcinoma had similar distributions of low-level gain and heterozygous loss, with frequencies of 8.3% and 8.4%, respectively (Figure 2A–H).

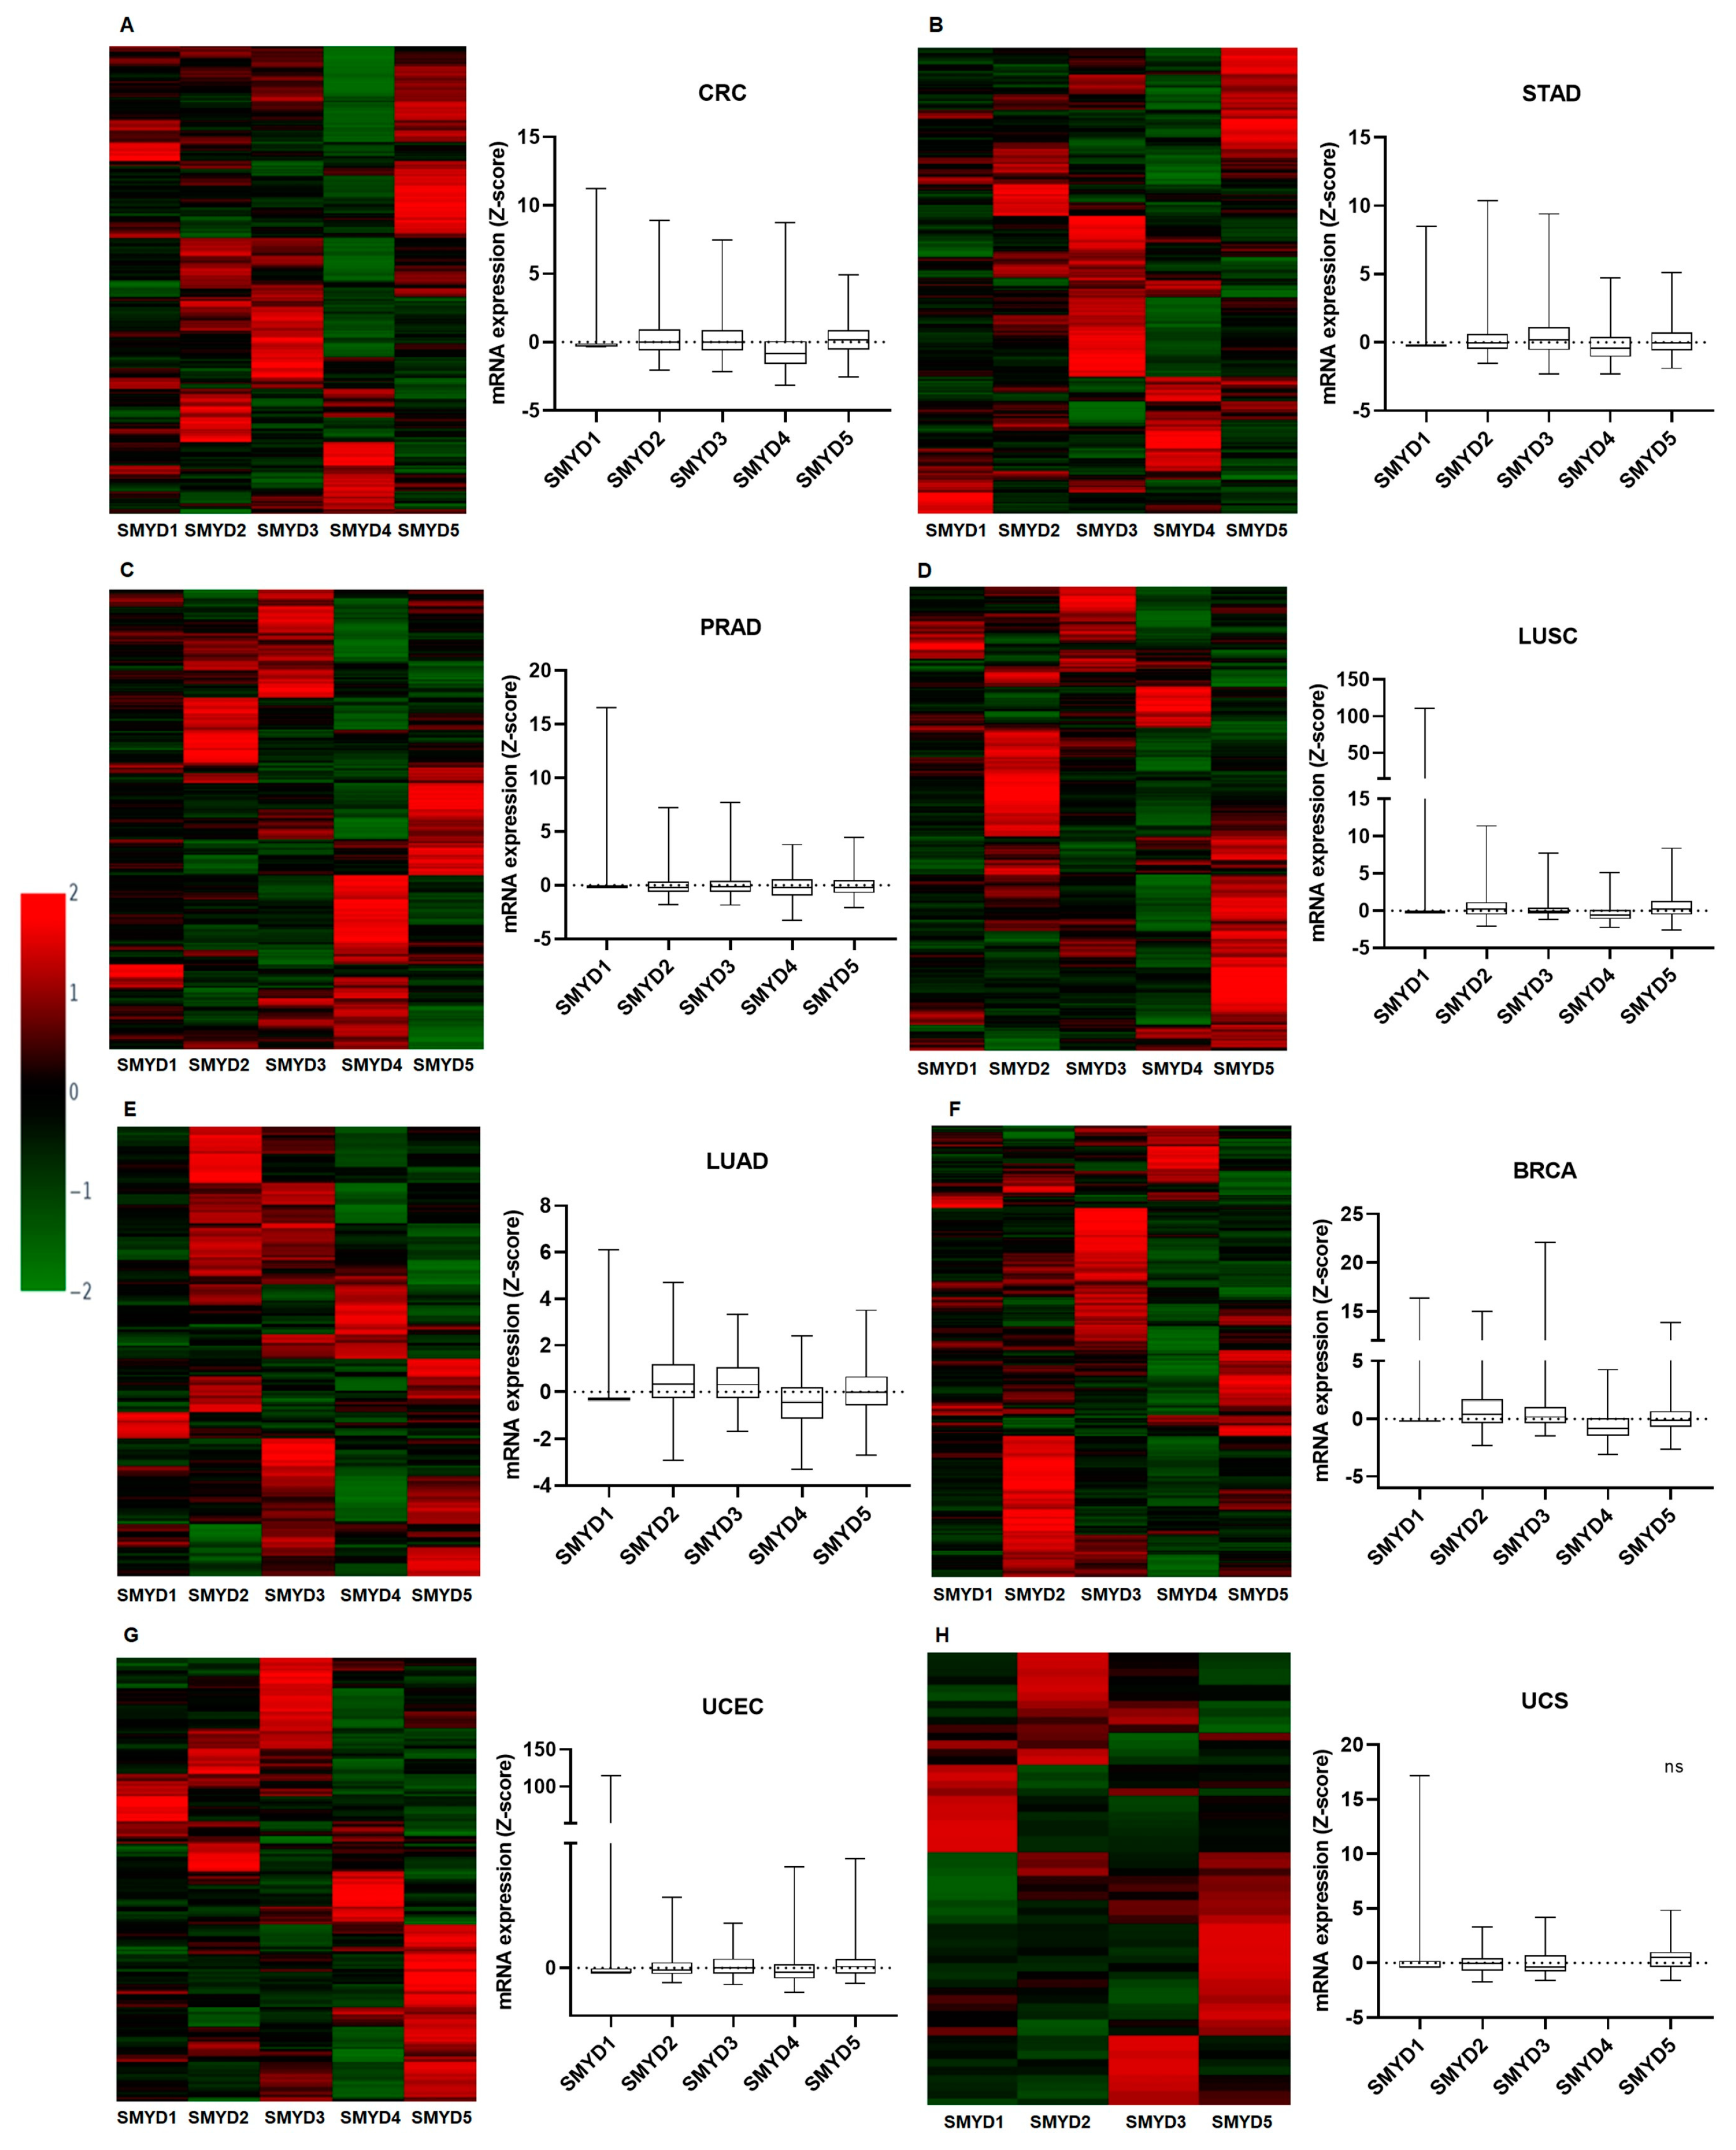
2.3. mRNA Expression Profile

mRNA expression was assessed using Z-scores relative to diploid sample data obtained for each cancer type from cBioPortal. Heatmaps and boxplots were used to assess the expression levels of the SMYD genes in all eight cancer types. In line with previous results observed for CNA, SMYD4 also exhibited a uniform expression pattern in all tumors evaluated. In all tumors cohorts, SMYD4 followed a pattern of downregulation (Figure 3A–H). This result corroborates the CNA findings, which indicated a high frequency of heterozygous loss (Figure 2A–H). These observations are consistent with previous studies suggesting a potential tumor suppressor function for SMYD4 [4,5,6]. Among other SMYD family genes, SMYD4 was the only one with such a consistent downregulation pattern across the different tumor types.
SMYD1 was downregulated in CRC, BRCA, UCEC, and UCS tumors, while its expression was upregulated in STAD, PRAD, LUSC, and LUAD. A similar variation in mRNA expression levels was observed for SMYD2. While its expression was increased in the majority of CRC, STAD, LUSC, LUAD, and BRCA tumors, it was downregulated in patients with PRAD, UCEC and UCS tumors. SMYD3 showed upregulated expression levels in CRC, STAD, LUAD, BRCA, and UCEC, while it was downregulated in the majority of PRAD and UCS patients. SMYD3 remained at basal levels in LUSC (Figure 3A–H). SMYD5 was upregulated in the majority of CRC, STAD, LUSC, LUAD, UCEC, and UCS tumors. In contrast, it was downregulated in PRAD and BRCA patients (Figure 3A–H).
With the exception of SMYD4, which exhibited a consistent downregulated pattern, all the other members of the SMYD family showed a distinct pattern of expression depending on the tumor.

2.4. Correlation Analysis of SMYD4 Expression with Other SMYD Genes

The correlation of SMYD4 expression with other SMYD family genes was assessed using Pearson correlation analysis. The analysis revealed weak negative correlations between SMYD4 and SMYD3 (r = −0.136, p = 0.008) and between SMYD4 and SMYD5 (r = −0.184, p = 3.015 × 10⁻⁴) in CRC (Figure 4A). In STAD, there was no significant correlation between SMYD4 and the other SMYDs (Figure 4B). In PRAD, Pearson’s correlation also showed poor negative correlations between SMYD4 and SMYD2 (r = −0.141, p = 0.002), SMYD4 and SMYD3 (r = −0.249, p = 1.761 × 10⁻⁸), and SMYD4 and SMYD5 (r = −0.268, p = 1.309 × 10⁻⁹) (Figure 4C).
In LUSC, a slightly positive correlation was observed between SMYD4 and SMYD5 (r = 0.125, p = 0.005). A poor negative correlation was observed between SMYD2 and SMYD4 (r = −0.121, p = 0.007) (Figure 4D). In LUAD, a weak negative correlation was also observed between SMYD4 and SMYD5 (r = −0.266, p = 4.666 × 10⁻⁴) (Figure 4E).
There was also a minimal positive correlation between SMYD1 and SMYD4 (r = 0.074, p = 6.045 × 10⁻⁵) and a low negative correlation between SMYD3 and SMYD4 (r = −0.058, p = 4.967 × 10⁻⁵) and between SMYD4 and SMYD5 (r= −0.114, p = 0.002) in BRCA (Figure 4F). In UCEC, a poor positive correlation was observed between SMYD2 and SMYD4 (r = −0.056, p = 0.002) (Figure 4G). In UCS, there was no significant correlation between SMYD4 and the other members of the SMYD family (Figure 4H).

2.5. Comparison of SMYD4 Expression between Normal Samples and Tumor Samples at Different Tumor Stages

SMYD4 exhibited a negative regulation pattern based on mRNA analysis in all the evaluated tumors. To assess the expression of SMYD4 in normal samples and tumor samples at different disease stages, we profiled its mRNA expression using the UALCAN database. In this analysis, colon and rectal tumors were evaluated separately, and it was observed that SMYD4 expression in colon adenocarcinoma was significantly lower in stage 2, 3, and 4 tumors (p = 1.04 × 10⁻³, 5.55 × 10⁻³, and 1.21 × 10⁻², respectively) when compared to normal samples. In rectal adenocarcinoma, significantly low expression of SMYD4 was only observed in stage 2 tumor samples (p = 1.86 × 10⁻²) when compared to normal sample (Figure 5A,B).
The expression of SMYD4 in STAD was noteworthy for the fact that it differed from the other tumors in that its expression was significantly higher in stages 2, 3, and 4 when compared to the normal sample (p = 3.83 × 10⁻³, 2.28 × 10⁻⁵, and 3.37 × 10⁻², respectively). Stage 3 had a statistically significant higher expression of SMYD4 when compared to stage 1 (p = 1.94 × 10⁻²) (Figure 5C). In LUSC, SMYD4 expression was significantly lower in stage 4 compared to normal samples (p = 1.55 × 10⁻³) (Figure 5D). In LUAD, patients with stage 1, 2, and 3 tumors presented low expression when compared to normal samples (p = 1.19 × 10⁻⁶, p = 7.68 × 10⁻⁸, and p = 3.51 × 10⁻⁵, respectively) (Figure 5E). In BRCA, SMYD4 expression was also significantly lower in all tumor stages in comparison with normal samples (p < 1 × 10⁻¹², p = 1.11 × 10⁻¹⁶, p < 1 × 10⁻¹², and p = 1.96 × 10⁻¹² for stages 1, 2, 3, and 4, respectively) (Figure 5F). In UCEC, low expression of SMYD4 was observed in stages 1, 2, 3, and 4 (p = 3.26 × 10⁻¹¹, 7.71 × 10⁻¹⁰, 1.30 × 10⁻⁹, and 7.80 × 10⁻⁴, respectively) when comparing them with normal samples (Figure 5G).

2.6. Correlation Analyses between SMYD4 CNAs and mRNA Expression

A correlation analysis was conducted to ascertain the relationship between SMYD4 copy number alterations (CNAs) and mRNA expression across various tumor types. These included colorectal cancer (CRC), gastric adenocarcinoma (STAD), lung squamous cell carcinoma (LUSC), breast invasive carcinoma (BRCA), and uterine corpus endometrial carcinoma (UCEC). We found a statistically significant positive correlation for all tumors evaluated in this study, indicating that CNAs influenced mRNA expression in these tumors. Specifically, CRC, STAD, LUSC, and BRCA had a Pearson correlation coefficient greater than 0.500. LUSC and UCEC had Spearman correlation coefficient greater than 0.500 (Table 2).

2.7. Overall Patient Survival Based on SMYD4 Expression

To assess whether there is a correlation between the overall survival (OS) of patients and the expression level of SMYD4, we analyzed its mRNA expression using both RNA-Seq data and microarray data (Affymetrix ID 229175_at) available from the Kaplan–Meier plotter database. For each cancer type evaluated, we dichotomized patients based on SMYD4 expression into two groups with high or low expression as previously described [12]. We found that low expression of SMYD4 was significantly linked to a reduced OS in LUAD patients. In a cohort of 504 LUAD patients, those with lower expression of SMYD4 had a median overall survival of 45.2 months compared with an overall survival of 59.2 months of patients with higher expression (HR = 0.72, 95% CI = 0.53–0.97; p = 0.032) (Figure 6A). This difference became even more pronounced in a separate cohort of 1411 LUAD patients, where SMYD4 expression was analyzed using microarrays. Patients exhibiting lower SMYD4 expression had a median overall survival of 47 months. In contrast, patients with higher SMYD4 expression demonstrated a median overall survival of 88.7 months (HR = 0.64, 95% CI = 0.56–0.75; p = 7.2 × 10⁻⁹) (Figure 6A). Similarly, in a cohort of 371 STAD patients, those with higher expression had a median overall survival of 46.9 months, whereas those with lower SMYD4 expression had a median overall survival of 21.1 months (HR = 0.66, 95% CI = 0.47–0.91; p = 0.011) (Figure 6B).
When we analyzed available cohorts of BRCA patients, although SMYD4 expression did not significantly affected OS, it was linked with a worse relapse-free survival (RFS). Patients who had lower expression of SMYD4 demonstrated a median RFS of 28 months compared with the group that had higher expression (median RFS of 59 months, HR = 0.56 95% CI = 0.48–0.65; p = 3.4 × 10⁻¹⁴) (Figure 6C).

3. Discussion

The availability of vast amounts of cancer genomic data in public database repositories has made in silico analysis an indispensable tool for exploring cancer-related vulnerabilities. Analyzing the most predominant genetic alterations in SMYD genes has revealed important distinctions among each member, their relation with cancer progression, and their usefulness as prognostic tools.
In the context of mutations, the missense variant emerges as the most frequently observed mutation across SMYD genes. The conserved SET domain, in particular, harbors a total of 107 missense mutations within the SMYD gene family. However, none of these mutations demonstrate a clear predominance, making it challenging to determine their potential impact on the functional dynamics of the SMYD family.
SMYD4 emerged as a point of interest in our analysis, as all the evaluated tumors displayed a high frequency of heterozygous loss. This observation is consistent with the mRNA findings across all analyzed tumor types, which all showed a trend toward downregulation. This trend may be due to the fact that SMYD4 is located on 17p13.3, a region known to undergo heterozygous loss in various solid tumors and leukemias [4,13,14,15,16]. Although not a rule, copy number alterations can affect gene expression [17]. The correlation analysis between CNAs and mRNA expression in all evaluated tumors showed that both alterations in SMYD4 are correlated.
Intriguingly, Xiao et al. proposed that SMYD4 is accountable for di- and tri-methylation at H3K4 in zebrafish [18]. H3K4me3 is an epigenetic marker recognized for preserving the activity of tumor suppressor genes in normal cells [19]. Thus, if the function of SMYD4 observed in zebrafish is conserved and mirrors its role in humans, SMYD4 could potentially activate tumor suppressors through H3K4me3. Therefore, a loss in SMYD4 function might lead to a corresponding loss of function in other tumor suppressors.
To date, very few studies have examined the role of SMYD4 in cancer. Our analysis confirmed that SMYD4 was downregulated in the majority of BRCA patients examined. Although there was no association with OS, downregulation of SMYD4 significantly affected RFS. Importantly, BRCA patients also presented a significant correlation between CNAs and mRNA expression. This observation supports the findings that propose a tumor suppressor role for SMYD4 in the development of breast cancer, at least partially, by inhibiting platelet-derived growth factor receptor α polypeptide (Pdgrf-α) [4]. Its downregulation also helps in the process of transforming normal mammary cells into tumor cells [5]. In addition, a study by Zhang et al. also found that SMYD4 was downregulated in PRAD tumor tissues, which is also consistent with the findings of our study [20]. We also demonstrated that SMYD4 consistently displayed a pattern of downregulation across a variety of tumor types, implying that its role as a tumor suppressor might be a universal characteristic in diverse oncological contexts.
Importantly, a comparative analysis of SMYD4 expression between samples from normal tissues and samples from tumors at different stages revealed that SMYD4 expression is significantly decreased in cancer samples, regardless of the tumor stage. Despite no association with tumor stage, SMYD4 expression remains significantly reduced during cancer progression. This was observed in almost all cancer types analyzed, including colon and rectal cancers, breast cancer, uterine corpus endometrial carcinoma, and lung squamous cell carcinoma. For patients with lung adenocarcinoma, a decrease in SMYD4 expression also resulted in a lower overall survival rate. This suggests that SMYD4 expression could be explored as a valuable biomarker for predicting a more severe prognosis in this cancer type.
Interestingly, in the examined data from stomach adenocarcinoma, specifically those from stage 2, 3, and 4 tumors, SMYD4 exhibited higher expression levels compared to normal samples in most patients. However, Kaplan–Meier analysis of 371 patients revealed that lower expression of SMYD4 was associated with poorer overall survival, indicating a more unfavorable outcome among those patients with reduced SMYD4 expression. One possible explanation for this intriguing alteration in SMYD4 expression in STAD may be that higher SMYD4 potentiates the expression of the transcription factor Nanog in cancer stem cells [7]. Previous studies have demonstrated a correlation between elevated Nanog expression in gastric tumors and increased tumor aggressiveness, as it enhances cell proliferation, migration and invasion [21,22]. A recent study also reports that SMYD4 is upregulated in hepatocellular carcinoma, forming a positive feedback loop with the arginine methyltransferase PRMT5 [23]. As the role of SMYD4 in cancer becomes more evident, further research is needed to better comprehend its mechanism of action in these tumor types.
The correlation analysis revealed noteworthy findings regarding changes in the expression pattern between SMYD4 and other members of the SMYD family. In general, SMYD4 negatively weak correlates with other SMYD genes. For instance, SMYD3 is known to be upregulated in colorectal cancers [24,25,26,27]. In patients with high expression of SMYD3, SMYD4 is consistently downregulated, exhibiting a clear negative correlation. Interestingly, a similar correlation was found in CRC between SMYD4 and SMYD5, which is a much less studied gene. This negative correlation was also observed in PRAD, where patients with a high expression of SMYD2, SMYD3 [26,28], or SMYD5 showed lower expression of SMYD4. This opposing expression pattern was also observed in LUSC and BRCA, where SMYD4 is downregulated while SMYD5 is upregulated. In BRCA, there was a small negative correlation between SMYD4 and SMYD3, which is expected since SMYD3 upregulation is already known to be associated with breast cancer proliferation [26,27,29,30]. Despite sharing similar conserved domains, the contrasting expression patterns of these genes in cancer may suggest divergent roles.
In conclusion, our study highlights SMYD4 as a tumor suppressor gene across various solid tumors. Our comprehensive analysis of genetic alterations within the SMYD4 gene revealed consistent heterozygous loss and downregulation across all tumors evaluated. Furthermore, SMYD4 exhibited frequent negative correlations with other members of the SMYD family, suggesting distinct functional roles. Importantly, the consistent downregulation of SMYD4 expression and its association with poor overall survival underscores its likely role in tumorigenesis and highlights its potential as a valuable biomarker. Further research into the mechanisms underlying SMYD4’s tumor-suppressive functions is warranted to fully elucidate its clinical potential.

4. Materials and Methods

4.1. Gene Database Analysis

Mutation data were obtained from the cBio Cancer Genomics Portal (www.cbioportal.org) and the Catalogue Of Somatic Mutations In Cancer (COSMIC) “www.cancer.sanger.ac.uk/cosmic (accessed on 31 October 2022)”. Data on copy number alterations and mRNA expression were obtained from the cBio Cancer Genomics Portal “www.cbioportal.org (accessed on 31 July 2022)” and the Cancer Genome Atlas (TCGA) database “www.cancergenome.nih.gov (accessed on 31 June 2022). The frequency of copy number alterations (CNAs) was generated using the algorithm GISTIC (Genomic Identification of Significant Targets in Cancer), and the copy number of each gene in each tumor evaluated was determined, where −2 indicates a homozygous loss, −1 is heterozygous loss, 1 is low-level gain, and 2 indicates amplification. For mRNA expression analysis, data from patient samples relative to diploid samples were used. The value is presented as a standard deviation of the mean expression (Z-score) [20,31]. The UALCAN database “http://ualcan.path.uab.edu (accessed on 31 August 2023)”, which contains data obtained from TCGA [32], was used to evaluate the relative expression of SMYD4 between normal and tumor stage samples in order to identify whether SMYD4 could serve as a potential biomarker in the tumors evaluated in this study. Graphical representations were generated using GraphPad Prism 8 and Rsudio 2023.06.0 software.

4.2. Heatmap

The z-score data related to the mRNA expression of SMYDs in the evaluated cancer types were visualized using heatmap plots generated through the Flaski data analysis and visualization tool “https://flaski.age.mpg.de (accessed on 30 September 2023)”. The data were scaled numerically within a range of ±2. The Ward linkage method with Euclidean distance was employed for clustering. The data were sorted into row clusters.

4.3. Survival Curve

The Kaplan–Meier plotter database “http://kmplot.com/analysis/ (accessed on 30 April 2023)” was used to explore the prognostic significance of alterations in the five SMYD genes. Survival analyses were conducted to determine the correlation between SMYD gene alterations and tumor prognosis. For mRNA expression analysis, the mRNA pan cancer option was selected, and patients were divided based on “high expression” and “low expression” levels as previously described [12]. OS for LUAD and PFS for BRCA were also assessed using data from microarray assays. p value < 0.05 was considered statistically significant.

4.4. Statistics

Statistical analyses were performed using GraphPad Prism 8. The mRNA correlations between SMYD family genes were analyzed using Pearson correlation test, with p < 0.05 serving as the definition of a statistically significant difference.

Author Contributions

Conceptualization, B.L.O.S. and F.P.-S.; methodology, B.L.O.S. and M.B.d.L.; formal analysis, F.P.-S.; investigation, B.L.O.S.; resources, F.P.-S.; data curation, B.L.O.S., M.B.d.L. and F.P.-S.; writing—original draft preparation, B.L.O.S.; writing—review and editing, B.L.O.S., M.B.d.L., A.C.M.G. and F.P.-S.; visualization, B.L.O.S.; supervision, A.C.M.G. and F.P.-S.; project administration, F.P.-S.; funding acquisition, F.P.-S. All authors have read and agreed to the published version of the manuscript.

Funding

The research was supported by Universidade de Brasília, Fundacão de Amparo à Pesquisa do Distrito Federal (FAPDF), and Conselho Nacional de Desenvolvimento Científico e Tecnológico (CNPq). FP-S has received grants from FAPDF (grant numbers 00193-00001029/2021-95 and 00193-00002146/2023-38) and CNPq (grant numbers 440734/2022-3 and 406890/2022-6).

Institutional Review Board Statement

Not applicable.

Informed Consent Statement

Not applicable.

Data Availability Statement

Data is contained within the article.

Acknowledgments

We would like to thank all the members of the Laboratory of Molecular Pathology of Cancer, Faculty of Health Sciences, University of Brasilia.

Conflicts of Interest

The authors declare no conflicts of interest.

References

  1. Albert, M.; Helin, K. Histone methyltransferases in cancer. Semin. Cell Dev. Biol. 2010, 21, 209–220. [Google Scholar] [CrossRef]
  2. Leinhart, K.; Brown, M. SET/MYND Lysine Methyltransferases Regulate Gene Transcription and Protein Activity. Genes 2011, 2, 210–218. [Google Scholar] [CrossRef]
  3. Liu, D.; Wang, X.; Shi, E.; Wang, L.; Nie, M.; Li, L.; Jiang, Q.; Kong, P.; Shi, S.; Wang, C.; et al. Comprehensive Analysis of the Value of SMYD Family Members in the Prognosis and Immune Infiltration of Malignant Digestive System Tumors. Front. Genet. 2021, 12, 699910. [Google Scholar] [CrossRef]
  4. Hu, L.; Zhu, Y.T.; Qi, C.; Zhu, Y.J. Identification of Smyd4 as a potential tumor suppressor gene involved in breast cancer development. Cancer Res. 2009, 69, 4067–4072. [Google Scholar] [CrossRef]
  5. Han, S.; Zou, H.; Lee, J.W.; Han, J.; Kim, H.C.; Cheol, J.J.; Kim, L.S.; Kim, H. miR-1307-3p Stimulates Breast Cancer Development and Progression by Targeting SMYD4. J. Cancer 2019, 10, 441–448. [Google Scholar] [CrossRef]
  6. Aziz, N.; Hong, Y.H.; Kim, H.G.; Kim, J.H.; Cho, J.Y. Tumor-suppressive functions of protein lysine methyltransferases. Exp. Mol. Med. 2023, 55, 2475–2497. [Google Scholar] [CrossRef]
  7. Liu, S.; Cheng, K.; Zhang, H.; Kong, R.; Wang, S.; Mao, C.; Liu, S. Methylation Status of the Nanog Promoter Determines the Switch between Cancer Cells and Cancer Stem Cells. Adv. Sci. 2020, 7, 1903035. [Google Scholar] [CrossRef]
  8. Sung, H.; Ferlay, J.; Siegel, R.L.; Laversanne, M.; Soerjomataram, I.; Jemal, A.; Bray, F. Global Cancer Statistics 2020: GLOBOCAN Estimates of Incidence and Mortality Worldwide for 36 Cancers in 185 Countries. CA Cancer J Clin. 2021, 71, 209–249. [Google Scholar] [CrossRef]
  9. Kastenhuber, E.R.; Lowe, S.W. Putting p53 in Context. Cell 2017, 170, 1062–1078. [Google Scholar] [CrossRef]
  10. Albertson, D.G.; Collins, C.; McCormick, F.; Gray, J.W. Chromosome aberrations in solid tumors. Nat. Genet. 2003, 34, 369–376. [Google Scholar] [CrossRef]
  11. Mermel, C.H.; Schumacher, S.E.; Hill, B.; Meyerson, M.L.; Beroukhim, R.; Getz, G. GISTIC2.0 facilitates sensitive and confident localization of the targets of focal somatic copy-number alteration in human cancers. Genome Biol. 2011, 12, R41. [Google Scholar] [CrossRef]
  12. Lánczky, A.; Győrffy, B. Web-Based Survival Analysis Tool Tailored for Medical Research (KMplot): Development and Implementation. J. Med. Internet Res. 2021, 23, e27633. [Google Scholar] [CrossRef]
  13. Jenal, M.; Britschgi, C.; Fey, M.F.; Tschan, M.P. Inactivation of the hypermethylated in cancer 1 tumour suppressor--not just a question of promoter hypermethylation? Swiss Med. Wkly. 2010, 140, w13106. [Google Scholar] [CrossRef]
  14. Wu, G.J.; Shan, X.N.; Li, M.F.; Shi, S.L.; Zheng, Q.P.; Yu, L.; Zhao, S.Y. Preliminary study on the loss of heterozygosity at 17p13 in gastric and colorectal cancers. World J. Gastroenterol. 1997, 3, 160–162. [Google Scholar] [CrossRef]
  15. Tsuchiya, E.; Tanigami, A.; Ishikawa, Y.; Nishida, K.; Hayashi, M.; Tokuchi, Y.; Hashimoto, T.; Okumura, S.; Tsuchiya, S.; Nakagawa, K. Three New Regions on Chromosome 17p13.3 Distal to p53 with Possible Tumor Suppressor Gene Involvement in Lung Cancer. Jpn. J. Cancer Res. 2000, 91, 589–596. [Google Scholar] [CrossRef]
  16. Park, S.Y.; Kang, Y.S.; Kim, B.G.; Lee, S.H.; Lee, E.D.; Lee, K.H.; Park, K.B.; Lee, J.H. Loss of heterozygosity on the short arm of chromosome 17 in uterine cervical carcinomas. Cancer Genet. Cytogenet. 1995, 79, 74–78. [Google Scholar] [CrossRef]
  17. Bhattacharya, A.; Bense, R.D.; Urzúa-Traslaviña, C.G.; de Vries, E.G.; van Vugt, M.A.; Fehrmann, R.S. Transcriptional effects of copy number alterations in a large set of human cancers. Nat. Commun. 2020, 11, 715. [Google Scholar] [CrossRef]
  18. Xiao, D.; Wang, H.; Hao, L.; Guo, X.; Ma, X.; Qian, Y.; Chen, H.; Ma, J.; Zhang, J.; Sheng, W.; et al. The roles of SMYD4 in epigenetic regulation of cardiac development in zebrafish. PLoS Genet. 2018, 14, e1007578. [Google Scholar] [CrossRef]
  19. Chen, K.; Chen, Z.; Wu, D.; Zhang, L.; Lin, X.; Su, J.; Rodriguez, B.; Xi, Y.; Xia, Z.; Chen, X.; et al. Broad H3K4me3 is associated with increased transcription elongation and enhancer activity at tumor-suppressor genes. Nat. Genet. 2015, 47, 1149–1157. [Google Scholar] [CrossRef]
  20. Zhang, Y.; Yan, L.; Yao, W.; Chen, K.; Xu, H.; Ye, Z. Integrated Analysis of Genetic Abnormalities of the Histone Lysine Methyltransferases in Prostate Cancer. Med. Sci. Monit. 2019, 25, 193–239. [Google Scholar] [CrossRef]
  21. Lin, T.; Ding, Y.Q.; Li, J.M. Overexpression of Nanog protein is associated with poor prognosis in gastric adenocarcinoma. Med. Oncol. 2012, 29, 878–885. [Google Scholar] [CrossRef]
  22. Ma, X.; Wang, B.; Wang, X.; Luo, Y.; Fan, W. NANOGP8 is the key regulator of stemness, EMT, Wnt pathway, chemoresistance, and other malignant phenotypes in gastric cancer cells. PLoS ONE 2018, 13, e0192436. [Google Scholar] [CrossRef]
  23. Zhou, Z.; Chen, Z.; Zhou, Q.; Meng, S.; Shi, J.; Mui, S.; Jiang, H.; Lin, J.; He, G.; Li, W.; et al. SMYD4 monomethylates PRMT5 and forms a positive feedback loop to promote hepatocellular carcinoma progression. Cancer Sci. 2024, 115, 1587–1601. [Google Scholar] [CrossRef]
  24. Hamamoto, R.; Furukawa, Y.; Morita, M.; Iimura, Y.; Silva, F.P.; Li, M.; Yagyu, R.; Nakamura, Y. SMYD3 encodes a histone methyltransferase involved in the proliferation of cancer cells. Nat. Cell Biol. 2004, 6, 731–740. [Google Scholar] [CrossRef]
  25. Liu, N.; Sun, S.; Yang, X. Prognostic significance of stromal SMYD3 expression in colorectal cancer of TNM stage I-III. Int J Clin Exp Pathol. 2017, 10, 8901–8907. [Google Scholar]
  26. Bernard, B.J.; Nigam, N.; Burkitt, K.; Saloura, V. SMYD3: A regulator of epigenetic and signaling pathways in cancer. Clin. Epigenetics 2021, 13, 45. [Google Scholar] [CrossRef]
  27. Bottino, C.; Peserico, A.; Simone, C.; Caretti, G. SMYD3: An Oncogenic Driver Targeting Epigenetic Regulation and Signaling Pathways. Cancers 2020, 12, 142. [Google Scholar] [CrossRef]
  28. Ikram, S.; Rege, A.; Negesse, M.Y.; Casanova, A.G.; Reynoird, N.; Green, E.M. The SMYD3-MAP3K2 Signaling Axis Promotes Tumor Aggressiveness and Metastasis in Prostate Cancer. Sci. Adv. 2023, 9, eadi5921. Available online: https://www.science.org/doi/10.1126/sciadv.adi5921 (accessed on 28 April 2024). [CrossRef]
  29. Hamamoto, R.; Silva, F.P.; Tsuge, M.; Nishidate, T.; Katagiri, T.; Nakamura, Y.; Furukawa, Y. Enhanced SMYD3 expression is essential for the growth of breast cancer cells. Cancer Sci. 2006, 97, 113–118. [Google Scholar] [CrossRef]
  30. Fenizia, C.; Bottino, C.; Corbetta, S.; Fittipaldi, R.; Floris, P.; Gaudenzi, G.; Carra, S.; Cotelli, F.; Vitale, G.; Caretti, G. SMYD3 promotes the epithelial-mesenchymal transition in breast cancer. Nucleic Acids Res. 2019, 47, 1278–1293. [Google Scholar] [CrossRef]
  31. Cerami, E.; Gao, J.; Dogrusoz, U.; Gross, B.E.; Sumer, S.O.; Aksoy, B.A.; Jacobsen, A.; Byrne, C.J.; Heuer, M.L.; Larsson, E.; et al. The cBio cancer genomics portal: An open platform for exploring multidimensional cancer genomics data. Cancer Discov. 2012, 2, 401–404. [Google Scholar] [CrossRef] [PubMed]
  32. Chandrashekar, D.S.; Karthikeyan, S.K.; Korla, P.K.; Patel, H.; Shovon, A.R.; Athar, M.; Netto, G.J.; Qin, Z.S.; Kumar, S.; Manne, U.; et al. UALCAN: An update to the integrated cancer data analysis platform. Neoplasia 2022, 25, 18–27. [Google Scholar] [CrossRef] [PubMed]
Figure 1. Total somatic mutations separated by conserved domains and non-conserved regions. Missense mutations in the SET domain are represented in dark green, and other mutations are noted in light green. Missense mutations in the MYND domain are represented in red, and other mutations are noted in yellow. Missense mutations in non-specific regions are represented in dark blue, and other mutations are noted in light blue.
Ijms 25 06097 g001
Figure 2. Frequency of copy number alterations in SMYD family genes. (A) Colorectal adenocarcinoma: n = 616 for SMYD1, 2, 4, and 5; n = 1943 for SMYD3. (B) Stomach adenocarcinoma: n = 589. (C) Prostate adenocarcinoma: n = 2848 for SMYD1, 2, and 5; n = 3890 for SMYD3; n = 1835 for SMYD4. (D) Lung squamous cell carcinoma: n = 501. (E) Lung adenocarcinoma: n = 1109 for SMYD1, 2, and 4; n = 1973 for SMYD3; n = 1158 for SMYD5. (F) Invasive breast cancer: n = 3469. (G) Endometrial cancer: n = 620. (H) Uterine carcinosarcoma: n = 56. (Amp—high level amplification; Gain—low-level gain; Hetloss—heterozygous deletion; Homdel—homozygous deletion).
Ijms 25 06097 g002
Figure 3. mRNA expression of SMYD family genes in solid tumors. (A) Colorectal cancer (n = 382). (B) Stomach adenocarcinoma (n = 415). (C) Prostate adenocarcinoma (SMYD1, 4, and 5: n = 498; SMYD2: n = 486; SMYD3: n = 493). (D) Lung squamous cell cancer (n = 501). (E) Lung adenocarcinoma (n = 169). (F) Invasive breast cancer (1100). (G) Uterine corpus endometrial carcinoma (n = 177). (H) Uterine carcinosarcoma (n = 57). Low expression was defined as a value below the 50th percentile, and high expression was defined as a value above the 50th percentile. SMYD4 expression data for UCS were not available.
Ijms 25 06097 g003
Figure 4. Correlation of mRNA expression of SMYD family genes in solid tumors. (A) Colorectal cancer (n = 382). (B) Stomach adenocarcinoma (n = 415). (C) Prostate adenocarcinoma (SMYD1, 4, and 5: n = 498; SMYD2: n = 486; SMYD3: n = 493). (D) Lung squamous cell cancer (n = 501). (E) Lung adenocarcinoma (n = 169). (F) Invasive breast cancer (1100). (G) Uterine corpus endometrial carcinoma (n = 177). (H) Uterine carcinosarcoma (n = 57). Pearson correlation test was used for comparison of expression levels among the five genes in each tumor evaluated (p = 0.05). Red represents a negative correlation (r values close to −1). Blue represents a positive correlation (r values close to +1). White represents independent variables with values close to 0.
Ijms 25 06097 g004
Figure 5. SMYD4 expression between normal and tumor stages samples. (A) Colon adenocarcinoma (COAD). (B) Rectum adenocarcinoma (READ). (C) Stomach adenocarcinoma (STAD). (D) Lung squamous cell carcinoma (LUSC). (E) Lung adenocarcinoma (LUAD). (F) Invasive breast cancer (BRCA). (G) Uterine corpus endometrial carcinoma (UCEC). No data were available for normal samples comparison to UCS. (* p < 0.05; ** p < 0.01; *** p < 0.001; **** p < 0.0001 with statistical significance).
Ijms 25 06097 g005
Figure 6. Overall survival (OS) or relapse-free survival (RFS) analysis based on SMYD4 expression levels (Kaplan-Meier plotter). (A) Two distinct cohorts of lung adenocarcinoma patients (LUAD) were analyzed. The left panel shows the OS in a cohort of 371 patients based on RNA-seq data. The right panel shows the OS of a cohort of 1411 patients based on microarray data. (B) OS in a cohort of 371 stomach adenocarcinoma (STAD) patients. (C) RFS in a cohort of 2032 breast cancer patients (n = 2031) was analyzed based on microarray data. Differences in OS or RFS were analyzed with the log-rank test.
Ijms 25 06097 g006
Table 1. Mutation frequency in each SMYD family member among the eight tumor types.
TumorSMYD1SMYD2SMYD3SMYD4SMYD5
CRC1.4%0.9%1.0%0.5%2.3%
STAD1.2%0.9%1.9%0,8%1.1%
BRCA0.3%0.2%0.4%0.4%0.3%
PRAD0.2%0.1%0.2%0.1%0.1%
Lung Cancer
LUAD2.3%0.8%0.7%0.4%0.5%
LUSC2.3%0.8%1.2%0.8%0.4%
Uterine Cancer
UCEC3.3%2.1%2.1%2.1%2.4%
UCS5.1%0.0%0.0%2.5%1.3%
Table 2. Correlation analyses of SMYD4 mRNA and CNA.
TumorsPearsonp ValueSpearmanp ValuePatients (n)
CRC0.568<0.00010.337<0.0001255
STAD0.593<0.00010.465<0.0001190
PRAD0.468<0.00010.2960.001598
LUSC0.615<0.00010.500<0.0001362
LUAD0.488<0.00010.3540.000389
BRCA0.532<0.00010.472<0.0001695
UCEC0.483<0.00010.538<0.000174
Disclaimer/Publisher’s Note: The statements, opinions and data contained in all publications are solely those of the individual author(s) and contributor(s) and not of MDPI and/or the editor(s). MDPI and/or the editor(s) disclaim responsibility for any injury to people or property resulting from any ideas, methods, instructions or products referred to in the content.

