Article

Methionine Sulfoxide Speciation in Mouse Hippocampus Revealed by Global Proteomics Exhibits Age- and Alzheimer’s Disease-Dependent Changes Targeted to Mitochondrial and Glycolytic Pathways

1
Center for Proteomics and Bioinformatics, Department of Nutrition, School of Medicine, Case Western Reserve University, Cleveland, OH 44106, USA
2
Department of Computer and Data Sciences, Case School of Engineering, Case Western Reserve University, Cleveland, OH 44106, USA
3
Center for Mitochondrial Diseases, Department of Physiology & Biophysics, School of Medicine, Case Western Reserve University, Cleveland, OH 44106, USA
4
Department of Computer Science, University of Texas Rio Grande Valley, Edinburg, TX 78539, USA
*
Author to whom correspondence should be addressed.
Int. J. Mol. Sci. 2024, 25(12), 6516; https://doi.org/10.3390/ijms25126516
Submission received: 30 April 2024 / Revised: 7 June 2024 / Accepted: 10 June 2024 / Published: 13 June 2024

Abstract

:
Methionine oxidation to the sulfoxide form (MSox) is a poorly understood post-translational modification of proteins associated with non-specific chemical oxidation from reactive oxygen species (ROS), whose chemistries are linked to various disease pathologies, including neurodegeneration. Emerging evidence shows MSox site occupancy is, in some cases, under enzymatic regulatory control, mediating cellular signaling, including phosphorylation and/or calcium signaling, and raising questions as to the speciation and functional nature of MSox across the proteome. The 5XFAD lineage of the C57BL/6 mouse has well-defined Alzheimer’s and aging states. Using this model, we analyzed age-, sex-, and disease-dependent MSox speciation in the mouse hippocampus. In addition, we explored the chemical stability and statistical variance of oxidized peptide signals to understand the needed power for MSox-based proteome studies. Our results identify mitochondrial and glycolytic pathway targets with increases in MSox with age as well as neuroinflammatory targets accumulating MSox with AD in proteome studies of the mouse hippocampus. Further, this paper establishes a foundation for reproducible and rigorous experimental MSox-omics appropriate for novel target identification in biological discovery and for biomarker analysis in ROS and other oxidation-linked diseases.

1. Introduction

Oxidative stress has long been implicated as a central player in aging, cellular dysfunction, and disease progression [1,2,3,4], and reactive oxygen species (ROS) have traditionally been viewed as toxic byproducts of metabolism that cause non-specific damage to cells. ROS include oxygen ions [singlet oxygen, superoxide (O2−)] or oxygen-containing radicals [e.g., hydrogen peroxide (H2O2)] and related species [5,6]. The propensity of unregulated ROS to modify proteins and DNA can disrupt multiple cellular organelles and processes and disrupt normal physiology [5]. Multiple models of stress and disease across diverse species evidence deleterious ROS signaling [7,8]. Oxidative damage has also been linked to aging [2], as chemical changes to macromolecules will accumulate unless repaired or replaced. Thus, managing the production and consequences of cellular or environmentally generated ROS is critical to maintaining homeostasis in a range of organisms across evolution, including humans [5,9].
The oxidizing equivalents of ROS can modify many cellular targets, but in proteins, sulfur-containing residues—including methionine, which can be oxidized to methionine sulfoxide—are the most susceptible. Methionine oxidation is known to have broad effects on protein structure and function, as oxidation alters methionine’s hydrophobicity and steric bulk [6], which can unfold proteins and expose hydrophobic cores. These kinds of structural changes, if allowed to accumulate, can logically lead to changes in protein functions. Reversal of methionine oxidation can be accomplished by methionine sulfoxide reductases (MsR), which are seen in organisms from bacteria to humans. Oxidation of methionine generates a chiral center and the S and R stereoisomers are reduced by the enzymes MsrA and MsrB, respectively, both using thioredoxin-linked redox cycles [10,11]. This provides a reversible redox-based system to control MSox-mediated changes in protein structure and activity in response to oxidative signaling. CaMKII (Calcium/Calmodulin-dependent Protein Kinase II) exemplifies this concept [12]. Beyond the canonical phosphorylation-based activation mechanisms, CaMKII’s activity is also modulated through the oxidation of specific methionine residues (Met 281 and 282) [13]. This links oxidation with a key control enzyme in cardiovascular and brain development and disease pathology. Actin, as well, has reversible modifications at Met 44 and Met 47, modulating cytoskeletal rearrangements in multiple vertebrate models relevant to cell growth and cancer under the regulation of the MICAL family of enzymes [14,15]. Thus, MSox speciation is a novel regulatory control mechanism potentially operating to connect ROS to other signaling pathways.
Beyond these specific regulatory switches at a global level, methionine oxidation may act as a sensor of cellular stress [1,2,16,17,18,19,20,21,22,23], where protein-incorporated MSox is accumulated, depleted, and regulated by the inducible system of Msr or related enzymes. The biological effects of Msr variation by knock-out or knock-in have showed lifespan variation in flies related to antioxidant defense, but results in mouse were equivocal, showing tissue-specific mouse functions affected [24]. Global proteomics studies to discover and validate both enzymatic and chemical sites of methionine oxidation speciation that would help inform such studies are scarce. Furthermore, quantification of methionine oxidation is considered challenging due to potential instabilities of the modifications during proteomics workups and in the handling and storage of samples. The development of reliable models and workflows to discover, verify, and validate MSox-based regulatory phenomenon will assist connecting MSox to ROS-mediated biology.
As examples, ROS- and oxidation-mediated effects are associated with both disease and aging across a range of models and species [1,2,24,25,26,27,28,29]. For example, Alzheimer’s disease and oxidation are strongly associated with evidence of lipid-, DNA-, and protein-based oxidation via glycation [30]. Further, amyloid peptides can mediate free radical reactions via Met 35 oxidation with enhanced neuronal toxicity [3,31,32]. Specific connections between AD and MSox are suggested by decreased MsrA activity in the AD patient brain [33], while methionine sulfoxide reductase B2 (MsrB2) was inhibited in an AD mouse model. Further, compensation for the loss of MsrB2 in AD cell culture and animal models reverses AD-like pathology [34]. This argues that studies of MSox speciation are needed to better understand ROS-mediated oxidation-linked processes in AD.
Mouse models offer an excellent opportunity to study aging- and AD disease pathology-linked aspects of MSox speciation. 5XFAD mice on a C57BL/6 background co-express five familial AD (FAD) mutations (amyloid precursor protein and presenilin 1 genes) that cause accumulation of amyloidogenic Aβ42, which spreads to cover most of the brain in parallel with astrocytosis and microgliosis by 4 months of age [35]. The mice later develop neuron loss around 9 months of age at the cortex and subiculum. Memory and cognitive impairments are observed in the mice as early as 4 months of age, which correlates with hippocampal synaptic dysfunction and age-dependent behavioral deficits. Metabolomics studies of this model revealed a dysregulation in brain-based glucose and lipid metabolism prior to AD pathogenesis [36]. Proteome studies in the brain revealed temporal and sex-linked variation in proteins related to neuroinflammation [37]. This model is ideal for our initial exploration of MSox speciation.
We examined proteome-wide levels of MSox in the 5XFAD mouse hippocampus at 3, 6, and 9 months for AD and C57BL/6 (wild type) mice, with replicates including a balanced design of males and females, as shown in Figure 1. This provides an examination of MSox variation in the AD model from early Aβ42 deposition to full-blown neuroinflammation [37] and an examination of MSox variation in C57BL/6 from and “end of youth” stage (month 3) through late middle age (month 9) [38]. Thus, this study is designed to achieve the following:
  • Examine the early aging-, sex-, and disease-dependent changes in MSox levels;
  • Identify peptide and protein targets specifically sensitive and resistant to the oxidation of methionine;
  • Validate key changes with peptide-based absolute quantification; and
  • Explore the stability of key MSox sites to handling and storage.
The results form a basis for a rigorous and reproducible MSox-omics for biological discovery of novel links between oxidation and disease biology to drive the development of new therapeutic targets in contexts including neurodegeneration, cancer, and beyond.

2. Results

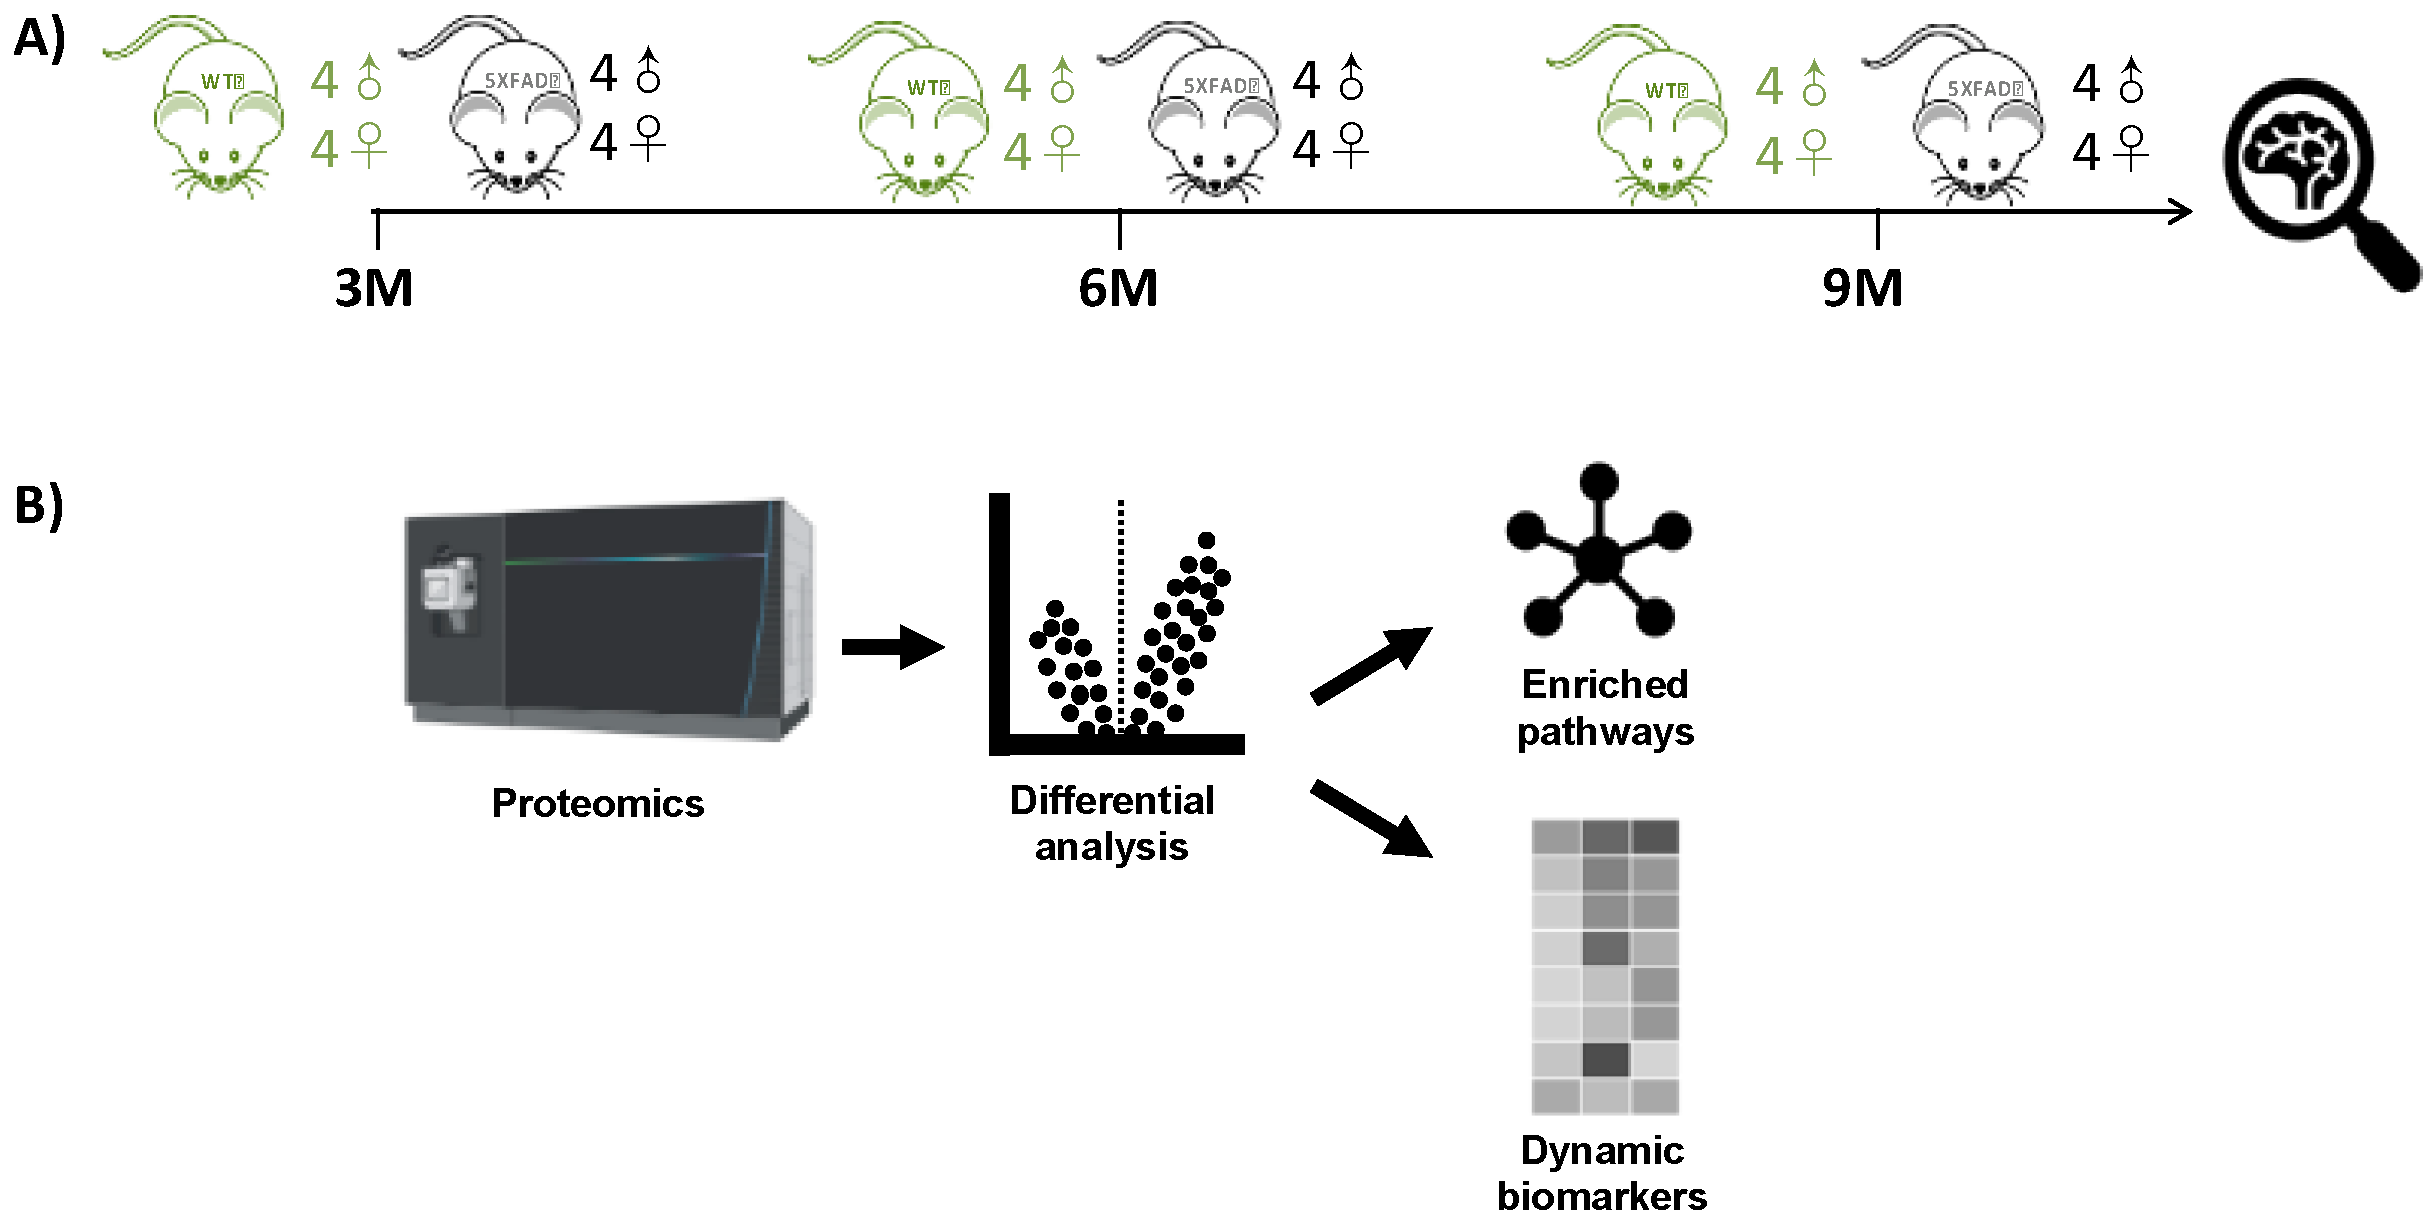
2.1. Experimental Design

Global MSox proteome profiling of the mouse hippocampus was conducted across various time points representing AD hallmarks. The experimental design in Figure 1 involved the collection of hippocampus tissue from 16 mice at each point and then processing the samples immediately for comparisons at that month. At each time point, there were eight WT C57BL/6 mice and eight 5XFAD mice, comprising four male and four female biological replicates. Label-free LC-MS analysis was performed on each set of 16 samples without fractionation.
Statistical analysis in the parent study (Figure 1A) focused on WT versus 5XFAD comparisons, followed by sex-linked analysis at each of the three individual time points. Although processing all samples from a time point shortly after sacrifice in batches offered certain advantages, such as efficiency and sample stability, it posed challenges in comparing individual groups across time points due to difficulties in the absolute standardization of these different batches over time. Thus, in comparisons across time points, we focused on peptide and protein identification similarities and differences at each time point. With that caveat, we filtered peptides from the available data that featured methionine oxidation as a variable modification (Table S1). We the used these data to characterize the MSox-ome, identify differentially expressed MSox-proteins, and identify pathways possibly enriched in these signatures compared to the background mouse brain protein expression patterns.

2.2. Age-Dependent Increase in Global MSox

To characterize the MSox-ome in our cohort, we used Peaks v10.0. This software takes raw LC-MS/MS files and provides peptide sequencing, protein identification, and quantification information. To extract specific MSox data from our raw files, we included methionine oxidation as a variable modification as a PEAKS search parameter. We found 396 total MSox peptides in the 3-month-old mice, both in WT and 5XFAD, 603 and 606 MSox peptides in 6-month-old WT and 5XFAD mice, and 819 and 822 MSox peptides in 9-month-old WT and 5XFAD mice, reaching a total hippocampal MSox coverage of 1095 peptides (Table 1 and Table S1). Differences in the amount of MSox proteins identified in 5XFAD compared to WT are negligible. Overall, the percentage of MSox peptides as a function of the whole proteome increased over time from 3.59% to 4.48% (Table 1), showing that age, and not genetic background, dominates global MSox changes in these mice.

2.3. Pathway Analysis Reveals Distinct Age-Dependent Signatures

To further characterize whether oxidation targets different protein-based methionine residues over time, we analyzed the overlap of each time-specific MSox-ome. The Venn diagram highlights the temporal dynamics of the MSox-ome in 5XFAD mice (Figure 2). Roughly a third of all MSox proteins in this study were detected across all time points (Figure 2). Early time points (3 and 6 months) account for ~80% of the MSox-ome (Figure 2). Moreover, 6%, 13%, and 20% of the MSox-ome are time-specific expression signatures for 3, 6, and 9 months, respectively (Figure 2). Altogether, the data indicate that the MSox-ome can be divided into two groups: constant oxidation targets (~33%) and dynamic targets (~66%).
To further understand whether these MSox dynamics are associated with distinct biological processes, we performed separate enrichment pathway analysis using Reactome and cellular component perspectives to classify the MSox proteins detected at the 3-, 6-, or 9-month time points. Indeed, we found different pathways to be enriched at different times and found those signatures to be distinct from whole proteome signatures (Table 2).
For example, at 3 months, no significant MSox Reactome signatures were observed (at 10−3 or more). However, by six months, the Reactome pathway analysis revealed several significant enriched signatures, including glycolytic metabolism, glucose metabolism, and gluconeogenesis. Further L1CAM interactions, small-molecule transport, and chemical synapse transmission were seen to be significant at 6 months. At 9 months, the MSox Reactome signatures also included innate immune systems and signal transduction as significant, while glucose-related metabolic themes were even more significant. For cellular component enrichments, L1 recycling and neurotransmitter release pathways along with glycolysis were significant for MSox-annotated proteins at 6 months. Altogether, these data highlight that MSox speciation accumulated in different proteins across coherent pathways across time.
Comparing the MSox-ome with the whole-brain proteome-enriched pathways, we found that MSox-enriched pathways are not an artifact of proteome coverage. Indeed, many pathways in bold show a significant enrichment exclusively in the MSox-ome (Table 2). The proteome showed significance in all cellular components; this was expected as our MS approach is a reliable approach to generating global proteome coverage. However, the MSox-ome showed a distinct cellular coverage, notably a lack of coverage in the cytoplasm, cytosol, and organelle (Table 2). On the other hand, the MSox-ome retained coverage of the axon and myelin sheath (Table 2). Altogether, the data highlight the interest of characterizing the MSox-ome as it provides biological insights beyond what the whole proteome provides.

2.4. High-Abundance Proteins Are Susceptible to MSox Accumulation

To complement our analysis of the MSox-ome, we computed the fold changes of specific MSox peptides in WT mice compared to 5XFAD mice; these detailed quantitative comparisons at a specific time point are enabled by the experimental design of the parent study. We found some MSox peptides to be differentially expressed in all time points (Figure 3A). Interestingly, starting at 6 months, the top upregulated peptides annotate to proteins known to be involved in neuroinflammation: GFAP, APOE, and VIME (Figure 3B,C).
At 9 Months, MSox peptides from GFAP (AEM[M]ELNDR, EQLAQQQVHVE[M]DVAKPDLTAALR and TQYEAVATSN[M]QETEEWYR), APOE (LGAD[M]EDLR, NEVT[M]LGSTEEIR and GWFEPIVED[M]HR), and VIME (E[M]EENFALEAANYQDTIGR) are significantly upregulated in 5XFAD (Figure 3). This is not surprising as these same peptides were found to be the most dysregulated in our whole-proteome analysis [37]. However, these results are associated with a pattern of MSox targeting highly expressed proteins (Figure 3).
To further explore the translational potential of the ox-APOE and ox-GFAP peptides as biomarkers, we need to clarify whether the differential expression of GFAP and APOE MSox peptides is an artifact of the differential total protein expression (Figure 4). To do so, we looked at the area under the curve (AUC) summing APOE peptides LGAD[M]EDLR and NEVT[M]LGSTEEIR and GWFEPIVED[M]HR, GFAP peptides AEM[M]ELNDR, EQLAQQQVHVE[M]DVAKPDLTAALR, and TQYEAVATSN[M]QETEEWYR, and their total unoxidized peptide AUC values. No MSox APOE nor MSox GFAP were detected at 3 months. At 6 months, levels close to the lower limit of detection were registered for both MSox APOE (NEVT[M]LGSTEEIR) and MSox GFAP (AEM[M]ELNDR and EQLAQQQVHVE[M]DVAKPDLTAALR) in one sample (Figure 4A,B). At 9 months, there was an increase in the AUC of both unmodified GFAP and APOE by ~14% and~100%, and MSox GFAP and APOE by ~73% and 51%, respectively (Figure 4A,B). To understand whether these increases in MSox levels reflected changes in stoichiometry, we chose to focus our analysis on the APOE protein at 9 months (Figure 4C,D). Therefore, we compared the average MSox-APOE% between WT (n = 8) and 5XFAD (n = 8) mice for the two APOE peptides above. For WT mice, an average of 6.7% APOE oxidation was seen, while for 5XFAD mice, an average of 17.1% oxidation for the two peptides was seen. These results reflect a 4.45 Cohen’s effect size among the two groups (Figure 4C). These data confirm a significant difference in MSox APOE stoichiometry between WT and 5XFAD; thus, MSox speciation targets APOE in this model. To further explore the ability to monitor MSox APOE peptides as biomarkers, we tested whether targeted MS approaches would be adequate to monitor these peptides. The scientific community’s resistance towards MSox being a biologically relevant PTM hinges in part on the fact that MSox can also potentially occur or be removed spontaneously. However, the data here show very reproducible MSox measurements, even on samples analyzed at separate times. Further, to assess whether parallel reaction monitoring (PRM) would be adequate to monitor MSox APOE changes, we decided to track the spontaneous oxidation levels of unmodified APOE peptide standards (LGADMEDLR and NEVHTMLGQSTEEIR) over a 12-month period.
We developed a PRM quantitative assay specific to LGADMEDLR (Table S2) and NEVHTMLGQSTEEIR (Table S2) and their MSox forms LGAD[M]EDLR (Table S2) and NEVHT[M]LGQSTEEIR (Table S2), for which we achieved linearity (R2 of >0.996) in all standard curves, demonstrating the rigor and reproducibility of this assay. Once linearity was established, we measured the oxidation in LGADMEDLR and NEVHTMLGQSTEEIR standards over time. We found average oxidation levels of 1.63% and 4.20%, respectively, with modest variability across the five samplings (Figure 4D, Table S2). Both levels of oxidation registered lower than the MSox levels in both WT and 5XFAD mice (Figure 4C), indicating that PRM is a reliable method to monitor MSox APOE peptides.

3. Discussion

This study analyzed the global MSox proteome of mouse hippocampus across various time points representative of Alzheimer’s disease (AD) hallmarks. To provide context for the functional genomics background of the 5XFAD model, we extracted selected gene expression data from a study like this proteomics study, with slightly different time points, as seen in Figure 5A, where the first time point of 4 months is near the 3-month point in proteomics and data up to 18 months are seen. Examination of the data showed strong evidence of ROS-related activation in the 5XFAD model vs. WT as Nrf2, a classic transcription factor mediating the gene expression of oxidation defense, is upregulated through 12 months (Figure 5B). Attendant oxidation defense proteins like glutathione peroxidases, catalase, and superoxide dismutase also show increased gene expression confirming the signaling landscape (Figure 5B). On the other hand, MsrA levels are trending lower with age and disease. These data drove our interest in specifically measuring MSox speciation across the same time frames.
We identified a total of 1095 MSox peptides in the WT and 5XFAD mouse hippocampus; however, not all MSox peptides were identified across all time points. Indeed, by comparing MSox-omes, we found an accumulation of MSox peptides with the progression of time: 396, 606, and 822 at 3, 6, and 9 months, respectively (Figure 2). We found that only roughly a third of all MSox-annotated proteins are detected at all three time points (Figure 2), which highlights the temporal variation in MSox targets in the mouse brain. Without further study, we cannot directly understand whether temporal effects are driven by accumulating MSox vs. potentially decreased repair or how local speciation influences observed MSox. However, pathway analysis at 3-, 6-, and 9-month intervals revealed transitions between glycolytic metabolism and small-molecule transport and chemical synapse transmission between the 6- and 9-month time points. Comparison with the whole proteome confirmed that MSox-enriched pathways were not mere artifacts, highlighting their specific biological relevance. Furthermore, cellular component analysis revealed unique coverage patterns of the MSox-ome, underscoring its importance for providing insights beyond conventional proteomic analyses.
With a goal to identify MSox candidate biomarkers, we compared MSox levels for selected peptides in WT and 5XFAD mice, which revealed a significant upregulation of selected peptides for GFAP, APOE, and VIME in 5XFAD mice starting at 6 months. This aligns with previous findings identifying these proteins as highly dysregulated in protein expression in 5XFAD. More detailed analysis of MSox APOE showed a significant difference in MSox APOE stoichiometry observed in 9-month mice for 5XFAD vs. WT. Parallel reaction monitoring (PRM) proved reliable for monitoring MSox APOE peptides, as evidenced by low and relatively constant oxidation levels in peptide standards compared to mouse models (Figure 4C,D, Table S2). Our study underscores the potential clinical relevance of MSox peptides in AD pathology and highlights the potential of PRM in clinical biomarker discovery for AD. The identification of APOE as a candidate MSox biomarker is of great importance as it establishes yet another link between APOE and AD. Ever since GWAS studies identified APOE as the strongest AD genetic risk factor [40], a lot of effort has been made to elucidate the role of APOE in AD. Despite the abundance of knowledge, no APOE-based therapy has been effective to date. We hope future research may focus on exploring the functional consequences of MSox APOE alterations and further validating PRM as a diagnostic tool for AD.
The characterization of MSox APOE in 5XFAD could provide a novel angle to be explored in a therapeutical setting.
Future research may focus on exploring the functional consequences of MSox alterations and further validating PRM as a diagnostic tool for AD.

4. Conclusions

Our findings contribute to a growing body of research on the role of senescence and protein oxidation in AD and connect this research to specific MSox speciation. We provide a benchmark for MSox-ome information in mice across time, which includes preferentially targeted MSox proteins and their associated biological pathways. Future research directions may involve investigating the functional implications of the identified MSox-proteins (e.g., MSox APOE), exploring potential therapeutic targets within enriched pathways, and further elucidating the interplay between senescence and protein oxidation in AD pathogenesis. Knock-out studies of Msr mouse models may also help identify specifically regulated MSox sites, while longitudinal studies in human cohorts may provide insights into the development of diagnostic and therapeutic strategies for AD.

5. Materials and Methods

To characterize the temporal changes of MSox expression levels in a mouse model of Alzheimer’s disease, we mined our previously published global proteome profiling data from 5XFAD [37].

5.1. Label-Free Quantitative Proteomic Analysis

Raw LC-MS/MS data were processed using Peaks v10.0 Software (Bioinformatics Solutions, Waterloo, ON, CAN) as described [41,42]. Peptide identification was performed within Peaks using UNIPROT database (UNIPROT_MOUSE_091219, # entries = 17,026). PEAKS search parameters were set to determine the following: mass error tolerance for precursor ions of 10 ppm, mass tolerance for fragment ions of 0.6 Da, trypsin enzyme specificity and included carbamidomethylation as a fixed variation plus methionine oxidation as a variable modification, and one missed cleavage. Label-free peptide identification was performed using default target decoy approach, which included PEAKS peptide score (−10logP) ≥ 15 and FDR threshold of 1%. Individual peptide abundance was determined by the area under the curve. All raw LC-MS/MS files and peptide abundance matrixes used in this article are publicly available at ProteomeXchange [43] and Consortium via the PRIDE [44] partner repository with the dataset identifier PXD030161 and can be found at https://doi.org/10.6019/PXD30161.

5.2. PRM

5.2.1. Sample Preparation for PRM Assay

LGADMEDLR and NEVHTMLGQSTEEIR and their MSox forms LGAD[M]EDLR and NEVHT[M]LGQSTEEIR were synthesized (AQUA Basic-grade, >95% purity, Thermo Fisher Scientific, Waltham, MA, USA) and used as the standard for stability and linearity studies. Synthesized peptides were diluted in water to yield a final concentration of 1 pmol/μL for each standard peptide. Each standard was aliquoted and frozen at −80 °C. Aliquots were thawed for analysis at 0, 1, 2, 6, and 11 months. Dilutions were performed for each standard in 0.1% formic acid to yield a concentration of 50 fmoles/μL. Standard peptides were also diluted in 0.1% formic acid to yield concentrations of 0.1, 0.5, 1, 10, 25, 50, and 100 fmoles/μL for the linearity study.

5.2.2. Development and Analytical Validation of Targeted MS Assays/Measurements

Both the stability and linearity study were analyzed by LC/MS using a Thermo Vanquish Ultra performance liquid chromatography system and an Orbitrap Exploris 480 mass spectrometer (Thermo, Waltham, MA, USA). The platform was operated in the positive nano-LC mode using Easy Spray source. The peptides were first desalted on a reversed-phase C18 trapping column (PepMap Neo Trap column Thermo, Waltham, MA, USA) by washing with 0.1% formic acid at 10 μL/min for 4 min. Subsequent chromatographic separation was performed using a reverse-phase C18 column (PepMap Neo 75 μm × 15 cm, Thermo, Waltham, MA, USA), and peptides were separated using a linear gradient of acetonitrile with 0.1% formic acid from 1% to 5% in 1 min followed by another linear gradient from 5% to 30% over a period of 29 min at a flow rate of 0.30 μL/min. A PRM experiment was employed to detect the standard peptides. The PRM approach was accomplished by specifying the parent mass of each peptide to be quantified for MS/MS fragmentation and then monitoring its fragment ions. AUC values were extracted for each peptide species using manual integration for stability and linearity analysis. The acquired data were processed and analyzed using Xcalibur 4.1.31.9 Quan Browser software (Thermo Fisher Scientific, Waltham, MA, USA). Each peptide was confirmed by comparing its retention time to the synthesized peptide. The % of oxidation for each peptide standard was calculated by following calculation: ((MSox of standard/MSox of standard + standard) × 100). Linear regression was performed for standard curves using Excel.

5.3. Enrichment Pathway Analysis

A PANTHER Overrepresentation Test with Reactome pathways annotation (Fischer’s exact test and FDR correction FDR p < 0.05) was performed on highly upregulated peptides in AD mice (5XFAD/WT Log2FC ≥ 4 and p ≤ 0.1, unpaired t-test) [45].

Supplementary Materials

The following supporting information can be downloaded at: https://www.mdpi.com/article/10.3390/ijms25126516/s1.

Author Contributions

Conceptualization, F.B.T.P.L., D.S., M.A., M.K. and M.R.C.; methodology, F.B.T.P.L., D.S., M.K. and M.R.C.; validation, F.B.T.P.L. and D.S.; formal analysis, F.B.T.P.L., D.S. and M.L.; investigation, F.B.T.P.L., D.S. and R.W.; resources, X.Q. and M.R.C.; data curation, F.B.T.P.L.; writing—original draft preparation, F.B.T.P.L. and M.R.C.; writing—review and editing, F.B.T.P.L., D.S., X.Q., M.A., M.K. and M.R.C.; visualization, F.B.T.P.L., D.S., M.L. and S.Y.; supervision, M.R.C.; project administration, M.R.C.; funding acquisition, M.R.C. All authors have read and agreed to the published version of the manuscript.

Funding

This research was funded by the National Institutes of General Medical Sciences, United States, under R01 GM117208 (M.R.C.) and R01 GM117208-03S1 (M.R.C.); by the Office of the Director, National Institutes of Health, United States, under S10 OD026882-01 (M.R.C.), S10 OD028614-01 (M.R.C.); and the National Institute on Drug Abuse, United States, under P30DA054557 (M.R.C.); in addition to the National Library of Medicine, United States, under R01 LM12980 (M.K.). The content is solely the responsibility of the authors and does not necessarily represent the official views of the National Institutes of Health.

Institutional Review Board Statement

All animal experiments were conducted in accordance with protocol (#2017-0153, 10/31/2020 to 10/31/2026) approved by the Institutional Animal Care and Use Committee of Case Western Reserve University and performed according to the National Institutes of Health Guide for the Care and Use of Laboratory Animals. Sufficient procedures were employed to reduce the pain and discomfort of the mice during the experiments. The mice were mated, bred, and genotyped in the animal facility of Case Western Reserve University. All mice were maintained under a 12 h/12 h light/dark cycle (light on at 6 AM and off at 6 PM). All mice used in this study were maintained on a C57BL/6J background. 5XFAD transgenic mouse [Tg(APPSwFlLon, PSEN1*M146L*L286V)6799Vas, JAX Stock No: 34840] breeders were purchased from Jackson Laboratory.

Data Availability Statement

The mass spectrometry proteomics data relative to the original label free mass spectra have been deposited to the ProteomeXchange [42] Consortium via the PRIDE [43] partner repository with the dataset identifier PXD030161 and can be found at https://doi.org/10.6019/PXD30161.

Conflicts of Interest

The authors declare no conflicts of interest.

References

  1. Levine, R.L.; Moskovitz, J.; Stadtman, E.R. Oxidation of methionine in proteins: Roles in antioxidant defense and cellular regulation. IUBMB Life 2000, 50, 301–307. [Google Scholar] [CrossRef] [PubMed]
  2. Stadtman, E.R.; Van Remmen, H.; Richardson, A.; Wehr, N.B.; Levine, R.L. Methionine oxidation and aging. Biochim. Biophys. Acta 2005, 1703, 135–140. [Google Scholar] [CrossRef] [PubMed]
  3. Schoneich, C. Redox processes of methionine relevant to beta-amyloid oxidation and Alzheimer’s disease. Arch. Biochem. Biophys. 2002, 397, 370–376. [Google Scholar] [CrossRef] [PubMed]
  4. Shringarpure, R.; Davies, K.J. Protein turnover by the proteasome in aging and disease. Free Radic. Biol. Med. 2002, 32, 1084–1089. [Google Scholar] [CrossRef] [PubMed]
  5. Auten, R.L.; Davis, J.M. Oxygen toxicity and reactive oxygen species: The devil is in the details. Pediatr. Res. 2009, 66, 121–127. [Google Scholar] [CrossRef] [PubMed]
  6. Xu, G.; Chance, M.R. Hydroxyl radical-mediated modification of proteins as probes for structural proteomics. Chem. Rev. 2007, 107, 3514–3543. [Google Scholar] [CrossRef] [PubMed]
  7. Chen, X.; Guo, C.; Kong, J. Oxidative stress in neurodegenerative diseases. Neural Regen. Res. 2012, 7, 376–385. [Google Scholar] [CrossRef] [PubMed] [PubMed Central]
  8. Barnham, K.J.; Masters, C.L.; Bush, A.I. Neurodegenerative diseases and oxidative stress. Nat. Rev. Drug Discov. 2004, 3, 205–214. [Google Scholar] [CrossRef] [PubMed]
  9. Sies, H.; Jones, D.P. Reactive oxygen species (ROS) as pleiotropic physiological signalling agents. Nat. Rev. Mol. Cell. Biol. 2020, 21, 363–383. [Google Scholar] [CrossRef] [PubMed]
  10. Taungjaruwinai, W.M.; Bhawan, J.; Keady, M.; Thiele, J.J. Differential expression of the antioxidant repair enzyme methionine sulfoxide reductase (MSRA and MSRB) in human skin. Am. J. Dermatopathol. 2009, 31, 427–431. [Google Scholar] [CrossRef] [PubMed]
  11. Soriani, F.M.; Kress, M.R.; Fagundes de Gouvea, P.; Malavazi, I.; Savoldi, M.; Gallmetzer, A.; Strauss, J.; Goldman, M.H.; Goldman, G.H. Functional characterization of the Aspergillus nidulans methionine sulfoxide reductases (msrA and msrB). Fungal Genet. Biol. 2009, 46, 410–417. [Google Scholar] [CrossRef] [PubMed]
  12. Rocco-Machado, N.; Lai, L.; Kim, G.; He, Y.; Luczak, E.D.; Anderson, M.E.; Levine, R.L. Oxidative stress-induced autonomous activation of the calcium/calmodulin-dependent kinase II involves disulfide formation in the regulatory domain. J. Biol. Chem. 2022, 298, 102579. [Google Scholar] [CrossRef] [PubMed] [PubMed Central]
  13. Luczak, E.D.; Anderson, M.E. CaMKII oxidative activation and the pathogenesis of cardiac disease. J. Mol. Cell. Cardiol. 2014, 73, 112–116. [Google Scholar] [CrossRef] [PubMed] [PubMed Central]
  14. Fremont, S.; Romet-Lemonne, G.; Houdusse, A.; Echard, A. Emerging roles of MICAL family proteins—From actin oxidation to membrane trafficking during cytokinesis. J. Cell Sci. 2017, 130, 1509–1517. [Google Scholar] [CrossRef] [PubMed]
  15. Yoon, J.; Terman, J.R. MICAL redox enzymes and actin remodeling: New links to classical tumorigenic and cancer pathways. Mol. Cell. Oncol. 2018, 5, e1384881. [Google Scholar] [CrossRef] [PubMed] [PubMed Central]
  16. Andrieu, C.; Vergnes, A.; Loiseau, L.; Aussel, L.; Ezraty, B. Characterisation of the periplasmic methionine sulfoxide reductase (MsrP) from Salmonella Typhimurium. Free Radic. Biol. Med. 2020, 160, 506–512. [Google Scholar] [CrossRef] [PubMed]
  17. Arias, D.G.; Cabeza, M.S.; Echarren, M.L.; Faral-Tello, P.; Iglesias, A.A.; Robello, C.; Guerrero, S.A. On the functionality of a methionine sulfoxide reductase B from Trypanosoma cruzi. Free Radic. Biol. Med. 2020, 158, 96–114. [Google Scholar] [CrossRef] [PubMed]
  18. Cha, H.N.; Woo, C.H.; Kim, H.Y.; Park, S.Y. Methionine sulfoxide reductase B3 deficiency inhibits the development of diet-induced insulin resistance in mice. Redox Biol. 2021, 38, 101823. [Google Scholar] [CrossRef] [PubMed] [PubMed Central]
  19. Das, K.; Garnica, O.; Flores, J.; Dhandayuthapani, S. Methionine sulfoxide reductase A (MsrA) modulates cells and protects against Mycoplasma genitalium induced cytotoxicity. Free Radic. Biol. Med. 2020, 152, 323–335. [Google Scholar] [CrossRef] [PubMed]
  20. Javitt, G.; Cao, Z.; Resnick, E.; Gabizon, R.; Bulleid, N.J.; Fass, D. Structure and Electron-Transfer Pathway of the Human Methionine Sulfoxide Reductase MsrB3. Antioxid. Redox Signal. 2020, 33, 665–678. [Google Scholar] [CrossRef] [PubMed] [PubMed Central]
  21. Jiang, B.; Adams, Z.; Moonah, S.; Shi, H.; Maupin-Furlow, J.; Moskovitz, J. The Antioxidant Enzyme Methionine Sulfoxide Reductase A (MsrA) Interacts with Jab1/CSN5 and Regulates Its Function. Antioxidants 2020, 9, 452. [Google Scholar] [CrossRef] [PubMed] [PubMed Central]
  22. Li, H.; Liang, M.; Wang, Z.; Zhang, Y.; Wu, Q.; Yang, L. Rice Protein Exerts Endogenous Antioxidant Capacity via Methionine Sulfoxide Reductase and the Nrf2 Antioxidant System Independent of Age. J. Med. Food 2020, 23, 565–574. [Google Scholar] [CrossRef] [PubMed]
  23. Nasreen, M.; Dhouib, R.; Hosmer, J.; Wijesinghe, H.G.S.; Fletcher, A.; Mahawar, M.; Essilfie, A.T.; Blackall, P.J.; McEwan, A.G.; Kappler, U. Peptide Methionine Sulfoxide Reductase from Haemophilus influenzae Is Required for Protection against HOCl and Affects the Host Response to Infection. ACS Infect Dis. 2020, 6, 1928–1939. [Google Scholar] [CrossRef] [PubMed]
  24. Salmon, A.B.; Kim, G.; Liu, C.; Wren, J.D.; Georgescu, C.; Richardson, A.; Levine, R.L. Effects of transgenic methionine sulfoxide reductase A (MsrA) expression on lifespan and age-dependent changes in metabolic function in mice. Redox Biol. 2016, 10, 251–256. [Google Scholar] [CrossRef] [PubMed] [PubMed Central]
  25. Chevion, M.; Berenshtein, E.; Stadtman, E.R. Human studies related to protein oxidation: Protein carbonyl content as a marker of damage. Free Radic Res. 2000, 33, S99–S108. [Google Scholar] [PubMed]
  26. Lee, B.C.; Lee, Y.K.; Lee, H.J.; Stadtman, E.R.; Lee, K.H.; Chung, N. Cloning and characterization of antioxidant enzyme methionine sulfoxide-S-reductase from Caenorhabditis elegans. Arch. Biochem. Biophys. 2005, 434, 275–281. [Google Scholar] [CrossRef] [PubMed]
  27. Levine, R.L.; Wehr, N.; Williams, J.A.; Stadtman, E.R.; Shacter, E. Determination of carbonyl groups in oxidized proteins. Methods Mol Biol. 2000, 99, 15–24. [Google Scholar] [CrossRef] [PubMed]
  28. Moskovitz, J.; Poston, J.M.; Berlett, B.S.; Nosworthy, N.J.; Szczepanowski, R.; Stadtman, E.R. Identification and characterization of a putative active site for peptide methionine sulfoxide reductase (MsrA) and its substrate stereospecificity. J. Biol. Chem. 2000, 275, 14167–14172. [Google Scholar] [CrossRef] [PubMed]
  29. Stadtman, E.R.; Levine, R.L. Protein oxidation. Ann. N. Y. Acad. Sci. 2000, 899, 191–208. [Google Scholar] [CrossRef] [PubMed]
  30. Gella, A.; Durany, N. Oxidative stress in Alzheimer disease. Cell. Adh. Migr. 2009, 3, 88–93. [Google Scholar] [CrossRef] [PubMed] [PubMed Central]
  31. Varadarajan, S.; Yatin, S.; Kanski, J.; Jahanshahi, F.; Butterfield, D.A. Methionine residue 35 is important in amyloid beta-peptide-associated free radical oxidative stress. Brain Res. Bull. 1999, 50, 133–141. [Google Scholar] [CrossRef] [PubMed]
  32. Schoneich, C. Methionine oxidation by reactive oxygen species: Reaction mechanisms and relevance to Alzheimer’s disease. Biochim. Biophys. Acta 2005, 1703, 111–119. [Google Scholar] [CrossRef] [PubMed]
  33. Gabbita, S.P.; Aksenov, M.Y.; Lovell, M.A.; Markesbery, W.R. Decrease in peptide methionine sulfoxide reductase in Alzheimer’s disease brain. J. Neurochem. 1999, 73, 1660–1666. [Google Scholar] [CrossRef] [PubMed]
  34. Xiang, X.J.; Song, L.; Deng, X.J.; Tang, Y.; Min, Z.; Luo, B.; Wen, Q.X.; Li, K.Y.; Chen, J.; Ma, Y.L.; et al. Mitochondrial methionine sulfoxide reductase B2 links oxidative stress to Alzheimer’s disease-like pathology. Exp. Neurol. 2019, 318, 145–156. [Google Scholar] [CrossRef] [PubMed]
  35. Oblak, A.L.; Lin, P.B.; Kotredes, K.P.; Pandey, R.S.; Garceau, D.; Williams, H.M.; Uyar, A.; O‘Rourke, R.; O‘Rourke, S.; Ingraham, C.; et al. Comprehensive Evaluation of the 5XFAD Mouse Model for Preclinical Testing Applications: A MODEL-AD Study. Front. Aging Neurosci. 2021, 13, 713726. [Google Scholar] [CrossRef] [PubMed] [PubMed Central]
  36. Gurel, B.; Cansev, M.; Koc, C.; Ocalan, B.; Cakir, A.; Aydin, S.; Kahveci, N.; Ulus, I.H.; Sahin, B.; Basar, M.K.; et al. Proteomics Analysis of CA1 Region of the Hippocampus in Pre-, Progression and Pathological Stages in a Mouse Model of the Alzheimer’s Disease. Curr. Alzheimer Res. 2019, 16, 613–621. [Google Scholar] [CrossRef] [PubMed]
  37. Lopes, F.B.T.P.; Schlatzer, D.; Wang, R.; Li, X.; Feng, E.; Koyuturk, M.; Qi, X.; Chance, M.R. Temporal and sex-linked protein expression dynamics in a familial model of Alzheimer’s Disease. Mol. Cell. Proteom. 2022, 21, 100280. [Google Scholar] [CrossRef] [PubMed]
  38. Jackson, S.J.; Andrews, N.; Ball, D.; Bellantuono, I.; Gray, J.; Hachoumi, L.; Holmes, A.; Latcham, J.; Petrie, A.; Potter, P.; et al. Does age matter? The impact of rodent age on study outcomes. Lab. Anim. 2017, 51, 160–169. [Google Scholar] [CrossRef] [PubMed] [PubMed Central]
  39. Forner, S.; Kawauchi, S.; Balderrama-Gutierrez, G.; Kramár, E.A.; Matheos, D.P.; Phan, J.; Javonillo, D.I.; Tran, K.M.; Hingco, E.; Da Cunha, C.; et al. Systematic phenotyping and characterization of the 5xFAD mouse model of Alzheimer’s disease. Sci. Data 2021, 8, 270. [Google Scholar] [CrossRef] [PubMed]
  40. Serrano-Pozo, A.; Das, S.; Hyman, B.T. APOE and Alzheimer’s disease: Advances in genetics, pathophysiology, and therapeutic approaches. Lancet Neurol. 2021, 20, 68–80, Erratum in Lancet Neurol. 2021, 20, e2. [Google Scholar] [CrossRef] [PubMed] [PubMed Central]
  41. Tran, N.H.; Qiao, R.; Xin, L.; Chen, X.; Liu, C.; Zhang, X.; Shan, B.; Ghodsi, A.; Li, M. Deep learning enables de novo peptide sequencing from data-independent-acquisition mass spectrometry. Nat. Methods 2019, 16, 63–66. [Google Scholar] [CrossRef] [PubMed]
  42. Tran, N.H.; Zhang, X.; Xin, L.; Shan, B.; Li, M. De novo peptide sequencing by deep learning. Proc. Natl. Acad. Sci. USA 2017, 114, 8247–8252. [Google Scholar] [CrossRef] [PubMed]
  43. Deutsch, E.W.; Bandeira, N.; Sharma, V.; Perez-Riverol, Y.; Carver, J.J.; Kundu, D.J.; García-Seisdedos, D.; Jarnuczak, A.F.; Hewapathirana, S.; Pullman, B.S.; et al. The ProteomeXchange consortium in 2020: Enabling ‘big data’ approaches in proteomics. Nucleic Acids Res. 2020, 48, D1145–D1152. [Google Scholar] [CrossRef] [PubMed] [PubMed Central]
  44. Perez-Riverol, Y.; Csordas, A.; Bai, J.; Bernal-Llinares, M.; Hewapathirana, S.; Kundu, D.J.; Inuganti, A.; Griss, J.; Mayer, G.; Eisenacher, M.; et al. The PRIDE database and related tools and resources in 2019: Improving support for quantification data. Nucleic Acids Res. 2019, 47, D442–D450. [Google Scholar] [CrossRef] [PubMed] [PubMed Central]
  45. Thomas, P.D.; Campbell, M.J.; Kejariwal, A.; Mi, H.; Karlak, B.; Daverman, R.; Diemer, K.; Muruganujan, A.; Narechania, A. PANTHER: A library of protein families and subfamilies indexed by function. Genome Res. 2003, 13, 2129–2141. [Google Scholar] [CrossRef] [PubMed] [PubMed Central]
Figure 1. Methionine-oxidation characterization of 5XFAD and WT mouse models. (A) Longitudinal protein expression data from hippocampus tissues was extracted from Blasco et al., 2022 [37]. (B) Differential MSox expression levels were extracted from raw LC-MS/MS data; from those signatures, both enriched pathways and candidate biomarkers were identified.
Ijms 25 06516 g001
Figure 2. Global distribution of MSox proteins across time in 5XFAD mice. The Venn diagram shows the number of shared MSox proteins that are significantly expressed (5XFAD/WT 0.5 ≥ fold change ≥ 2 and p ≤ 0.1, unpaired t-test) between all timepoints (3 months—green; 6 months—orange; 9 months—blue).
Ijms 25 06516 g002
Figure 3. Global protein expression patterns highlight increase in upregulated methionine-oxidized peptides in AD. (AC) Significantly upregulated methionine-oxidized peptides in AD mice; volcano plots highlight significantly dysregulated methionine-oxidized peptides in blue (5XFAD/WT 0.5 ≥ fold change ≥ 2 and p ≤ 0.1, unpaired t-test) (3 months, 6 months, and 9 months).
Ijms 25 06516 g003
Figure 4. Analysis of methionine-oxidized APOE and GFAP in a mouse model of AD. (A,B) Tracking of AUC for unmodified and MSox peptides in APOE (A) and GFAP (B) in 5XFAD mice; (C) Cohen’s effect size comparison between AUC (Peaks) measurements of methionine-oxidized APOE between WT and 5XFAD mice at 9 months; (D) bar graph compares the percentage of background oxidation in synthetic unmodified APOE peptides across 12 months, as measured by PRM.
Ijms 25 06516 g004
Figure 5. Functional genomics data for 5XFAD mice [39]. (A) Longitudinal RNAseq expression data from hippocampus tissues of 5XFAD mice at 4, 8, 12, and 18 months was extracted from [39]. (B) The plot shows longitudinal variations in MsrA, nuclear factor erythroid 2–related factor 2 (Nrf2) transcription factor, and antioxidant enzymes.
Ijms 25 06516 g005
Table 1. Global MSox levels do not change with genetic background or sex. The tables summarize the total of detected methionine-oxidized peptides, MSox-annotated proteins, and percentage of MSox: (A) across time (3 months, 6 months, and 9 months) for both WT and 5XFAD mice; (B) in female and male 5XFAD mice.
(A)3 Months6 Months9 Months
WT5XFADWT5XFADWT5XFAD
MSox peptides396396603606819822
MSox proteins228228282285358358
MSox %3.593.594.204.224.484.48
(B)3 Months5XFAD Mice
6 Months
9 Months
FemaleMaleFemaleMaleFemaleMale
MSox peptides396395597602821820
MSox proteins228228283284358357
MSox %3.593.584.164.194.484.47
Table 2. MSox enrichments. The table summarizes the enrichment pathway analysis FDR scores in MSox (all methionine-oxidized proteins detected in each time point) and Proteome (all proteins detected in each time point) for both Reactome pathways and GO Cellular components. Bold values are more significant than 10−3.
MSoxProteome
Enriched Terms3 M6 M9 M3 M6 M9 M
Reactome PathwaysGlucose metabolism1.76 × 10−27.05 × 10−55.92 × 10−51.00 × 1001.00 × 1005.56 × 10−1
Immune system 1.05 × 10−23.90 × 10−39.34 × 10−54.28 × 10−11.76 × 10−51.31 × 10−11
Gluconeogenesis1.31 × 10−23.32 × 10−41.22 × 10−46.58 × 10−11.00 × 1001.00 × 100
Organelle biogen and maintenance1.17 × 10−24.46 × 10−34.07 × 10−41.00 × 1002.99 × 10−17.69 × 10⁻²
Transport of small moleculesns6.46 × 10−44.29 × 10−44.53 × 10−17.23 × 10−11.33 × 10−1
Transmission chemical synapses9.80 × 10−35.43 × 10−46.07 × 10−41.00 × 1007.11 × 10−12.47 × 10⁻²
Innate immune system ns1.49 × 10−28.32 × 10−44.47 × 10−19.58 × 10−61.25 × 10−11
Signal transduction 3.65 × 10−22.43 × 10−28.37 × 10−43.64 × 10−14.04 × 10−12.89 × 10−4
L1CAM interactions 6.47 × 10−36.29 × 10−45.59 × 10−34.64 × 10−21.70 × 10−11.14 × 10−4
Recycling pathway of L11.05 × 10−26.32 × 10−41.27 × 10−32.44 × 10−14.15 × 10−11.15 × 10⁻³
Glycolysis1.18 × 10−27.92 × 10−42.44 × 10−31.00 × 1001.00 × 1008.12 × 10−1
Neurotransmitter release cycle1.03 × 10−28.38 × 10−42.66 × 10−31.00 × 100ns9.68 × 10−2
Cellular ComponentCytoplasmnsnsns1.41 × 10−2151.49 × 10−2439.63 × 10−263
Intracellular anatomical structurensnsns3.51 × 10−1521.19 × 10−1666.39 × 10−186
Cytosolnsnsns8.87 × 10−984.40 × 10−1034.91 × 10−107
Organelle7.42 × 10−3ns5.02 × 10−33.12 × 10−1133.30 × 10−1249.44 × 10−128
Postsynapse3.53 × 10−25.53 × 10−36.98 × 10−32.48 × 10−1125.86 × 10−1174.81 × 10−112
Axon3.05 × 10−92.80 × 10−74.35 × 10−65.43 × 10−582.93 × 10−642.52 × 10−62
Myelin sheath2.94 × 10−291.76 × 10−305.49 × 10−307.26 × 10−792.27 × 10−721.72 × 10−68
Disclaimer/Publisher’s Note: The statements, opinions and data contained in all publications are solely those of the individual author(s) and contributor(s) and not of MDPI and/or the editor(s). MDPI and/or the editor(s) disclaim responsibility for any injury to people or property resulting from any ideas, methods, instructions or products referred to in the content.

