Article

Diagnostic and Prognostic Markers for Pancreatitis and Pancreatic Ductal Adenocarcinoma

by
Havish S. Kantheti
1,2,3,
Michael A. Hale
1,2,4,
Shreoshi Pal Choudhuri
1,5,
Huocong Huang
5,
Xu-dong Wang
6,
Yalda Zolghadri
2,7,
Giulio Innamorati
7,
Sai Prasada Rao Manikonda
8,
Naviya Reddy
2,
Sarthak Reddy
2,
Rahul K. Kollipara
4,
Valbona Lumani
1,2,
Luc Girard
5,
Yakov Bezrukov
9,
Pavel Demenkov
9,
Raymond J. MacDonald
10,
Rolf A. Brekken
5,11,
Yonghao Yu
6,† and
Thomas M. Wilkie
1,2,*
1
Department of Pharmacology, UT Southwestern Medical Center, 6001 Forest Park Drive, Dallas, TX 75390, USA
2
Cancer Discovery (CanDisc) Group, UT Southwestern Medical Center, 6001 Forest Park Drive, Dallas, TX 75390, USA
3
Texas A&M School of Engineering Medicine, 1020 Holcombe Blvd, Houston, TX 77030, USA
4
Department of Neuroscience, UT Southwestern Medical Center, Dallas, TX 75390, USA
5
Hamon Center for Therapeutic Oncology Research, UT Southwestern Medical Center, Dallas, TX 75390, USA
6
Department of Biochemistry, UT Southwestern Medical Center, 5323 Harry Hines Blvd, Dallas, TX 75390, USA
7
Department of Surgical Sciences, Dentistry, Gynecology and Pediatrics, University of Verona, 37126 Verona, Italy
8
Department of Biosciences, Rice University, Houston, TX 77005, USA
9
Cogia AG, Poststr. 2-4, 60329 Frankfurt, Germany
10
Department of Molecular Biology, UT Southwestern Medical Center, Dallas, TX 75390, USA
11
Department of Surgery, UT Southwestern Medical Center, Dallas, TX 75390, USA
*
Author to whom correspondence should be addressed.
Current address: Department of Molecular Pharmacology and Therapeutics, Columbia University Vagelos College of Physicians and Surgeons, New York, NY 10032, USA.
Int. J. Mol. Sci. 2024, 25(12), 6619; https://doi.org/10.3390/ijms25126619
Submission received: 21 April 2024 / Revised: 30 May 2024 / Accepted: 5 June 2024 / Published: 16 June 2024
(This article belongs to the Special Issue Pancreatic Disease: From Molecular Basis to Novel Therapies)

Abstract

:
Diagnostic markers are desperately needed for the early detection of pancreatic ductal adenocarcinoma (PDA). We describe sets of markers expressed in temporal order in mouse models during pancreatitis, PDA initiation and progression. Cell type specificity and the differential expression of PDA markers were identified by screening single cell (sc) RNAseq from tumor samples of a mouse model for PDA (KIC) at early and late stages of PDA progression compared to that of a normal pancreas. Candidate genes were identified from three sources: (1) an unsupervised screening of the genes preferentially expressed in mouse PDA tumors; (2) signaling pathways that drive PDA, including the Ras pathway, calcium signaling, and known cancer genes, or genes encoding proteins that were identified by differential mass spectrometry (MS) of mouse tumors and conditioned media from human cancer cell lines; and (3) genes whose expression is associated with poor or better prognoses (PAAD, oncolnc.org). The developmental progression of PDA was detected in the temporal order of gene expression in the cancer cells of the KIC mice. The earliest diagnostic markers were expressed in epithelial cancer cells in early-stage, but not late-stage, PDA tumors. Other early markers were expressed in the epithelium of both early- and late-state PDA tumors. Markers that were expressed somewhat later were first elevated in the epithelial cancer cells of the late-stage tumors, then in both epithelial and mesenchymal cells, or only in mesenchymal cells. Stromal markers were differentially expressed in early- and/or late-stage PDA neoplasia in fibroblast and hematopoietic cells (lymphocytes and/or macrophages) or broadly expressed in cancer and many stromal cell types. Pancreatitis is a risk factor for PDA in humans. Mouse models of pancreatitis, including caerulein treatment and the acinar-specific homozygous deletion of differentiation transcription factors (dTFs), were screened for the early expression of all PDA markers identified in the KIC neoplasia. Prognostic markers associated with a more rapid decline were identified and showed differential and cell-type-specific expression in PDA, predominately in late-stage epithelial and/or mesenchymal cancer cells. Select markers were validated by immunohistochemistry in mouse and human samples of a normal pancreas and those with early- and late-stage PDA. In total, we present 2165 individual diagnostic and prognostic markers for disease progression to be tested in humans from pancreatitis to late-stage PDA.

1. Introduction

Reliable markers and effective therapeutics are needed for people at risk of developing or already afflicted with pancreatic ductal adenocarcinoma (PDA) [1]. For PDA, surgical intervention is currently the only effective treatment for the extension of lifespan, and only 20% of individuals are diagnosed with pancreatic cancer early enough to be surgical candidates [2,3]. New therapeutics are needed for late-stage patients, but they are the most refractory to treatment. Our approach is to focus initially on personalized medicine for the two classes of patients most likely to benefit at this time: (1) those with PDA who survive resection and are likely to succumb to recurrent cancer without further treatment; and (2) those at a high risk of developing PDA. Risk factors for PDA are pancreatitis (chronic or hereditary), smoking, obesity, and adult-onset type 2 diabetes (T2D), as well as having inherited cancer risk genes [4]. Some of the most effective therapeutics for early-stage disease may also help late-stage patients.
Prior screening of late-stage tumors has been used to analyze bulk mRNA expression of mouse and/or human samples to describe distinct types of PDA and has identified multiple diagnostic markers [5,6]. A comparison of gene expression profiles show that PDA tumors in KIC mice are closely related to about 20% of PDA samples in the TCGA database PAAD (oncolnc.org) and provide a good potential source of markers for at least a subset of patients. KIC mice express oncogenic KrasG12D and inactivate the tumor suppressor Cdnk2a in all pancreatic cell types, including islet, duct, acinar, and cancer cells in PDA. KC mice, which express wildtype Cdnk2a, develop PDA slowly, whereas KIC mice are a particularly aggressive mouse model of PDA [7] and a rich source of potential markers. An advantage of interrogating KIC mice is that early markers can be collected from young mice and late markers from older mice.
To identify diagnostic and prognostic protein markers for all stages of pancreatic disease, we first isolated protein from PDA tumors in the mouse models of PDA, KC and KIC [7] and used mass spectrometry (MS) to identify differentially expressed proteins [8,9]. To enrich our analysis of likely fluid-born protein markers, we specifically used MS to screen for proteins preferentially secreted into conditioned media by PDA cancer cells compared to normal duct cells. We then queried scRNAseq data from KIC mice [10] to identify differentially expressed markers in cancer and associated stromal cell types, particularly focused on candidate approaches that would reveal early-stage markers in transition from benign neoplasia to cancerous lesions.
Because oncogenic Kras is an early driver of 90% of human PDA cases [3], we screened the Ras pathway and cancer-associated genes but found few differentially expressed early markers. Therefore, we expanded our search for early markers in an unsupervised screen of early- versus late-KIC neoplasia and several candidate pathways known to impact initiation and progression in PDA.
As pancreatitis is a risk factor for progression to PDA in the context of oncogenic Kras mutation [11], we screened for pancreatic genes that were differentially expressed in mouse models of pancreatitis, including caerulein treatment of normal mice [12] and the pancreas of knockout mice with the acinar-cell-specific deletion of one of four differentiation transcription factors (dTFs) (Ptf1a, Nr5a2, Foxa2, or Gata4) and the double knockout of Foxa2 + Gata4 [13,14,15]. Caerulein is a mimetic of the Gq-coupled agonist CCK [16] which immediately provokes calcium signaling, followed by the down regulation of the dTFs, dedifferentiation of acinar cells, and AP-1- and NFkB-mediated cytokine signaling during tissue repair [11,12,17,18]. Therefore, we also screened calcium and innate immune pathway genes in scRNAseq samples from early- and late-stage KIC neoplasia and tumors.
Prognostic genes associated with worse or better prognoses in PAAD (the abbreviation for PDA used on oncolnc.org) were identified among the differentially expressed diagnostic markers we obtained from our initial screens. Therefore, we tested all the genes that were significantly associated with either worse or better prognoses in PAAD for differential expression in cancer and stromal cells. In aggregate, we identified 2165 individual diagnostic and prognostic markers (Supplementary Table S1) and devised an approach to validate them in mouse models of PDA (KIC) and human tumor samples.

2. Results

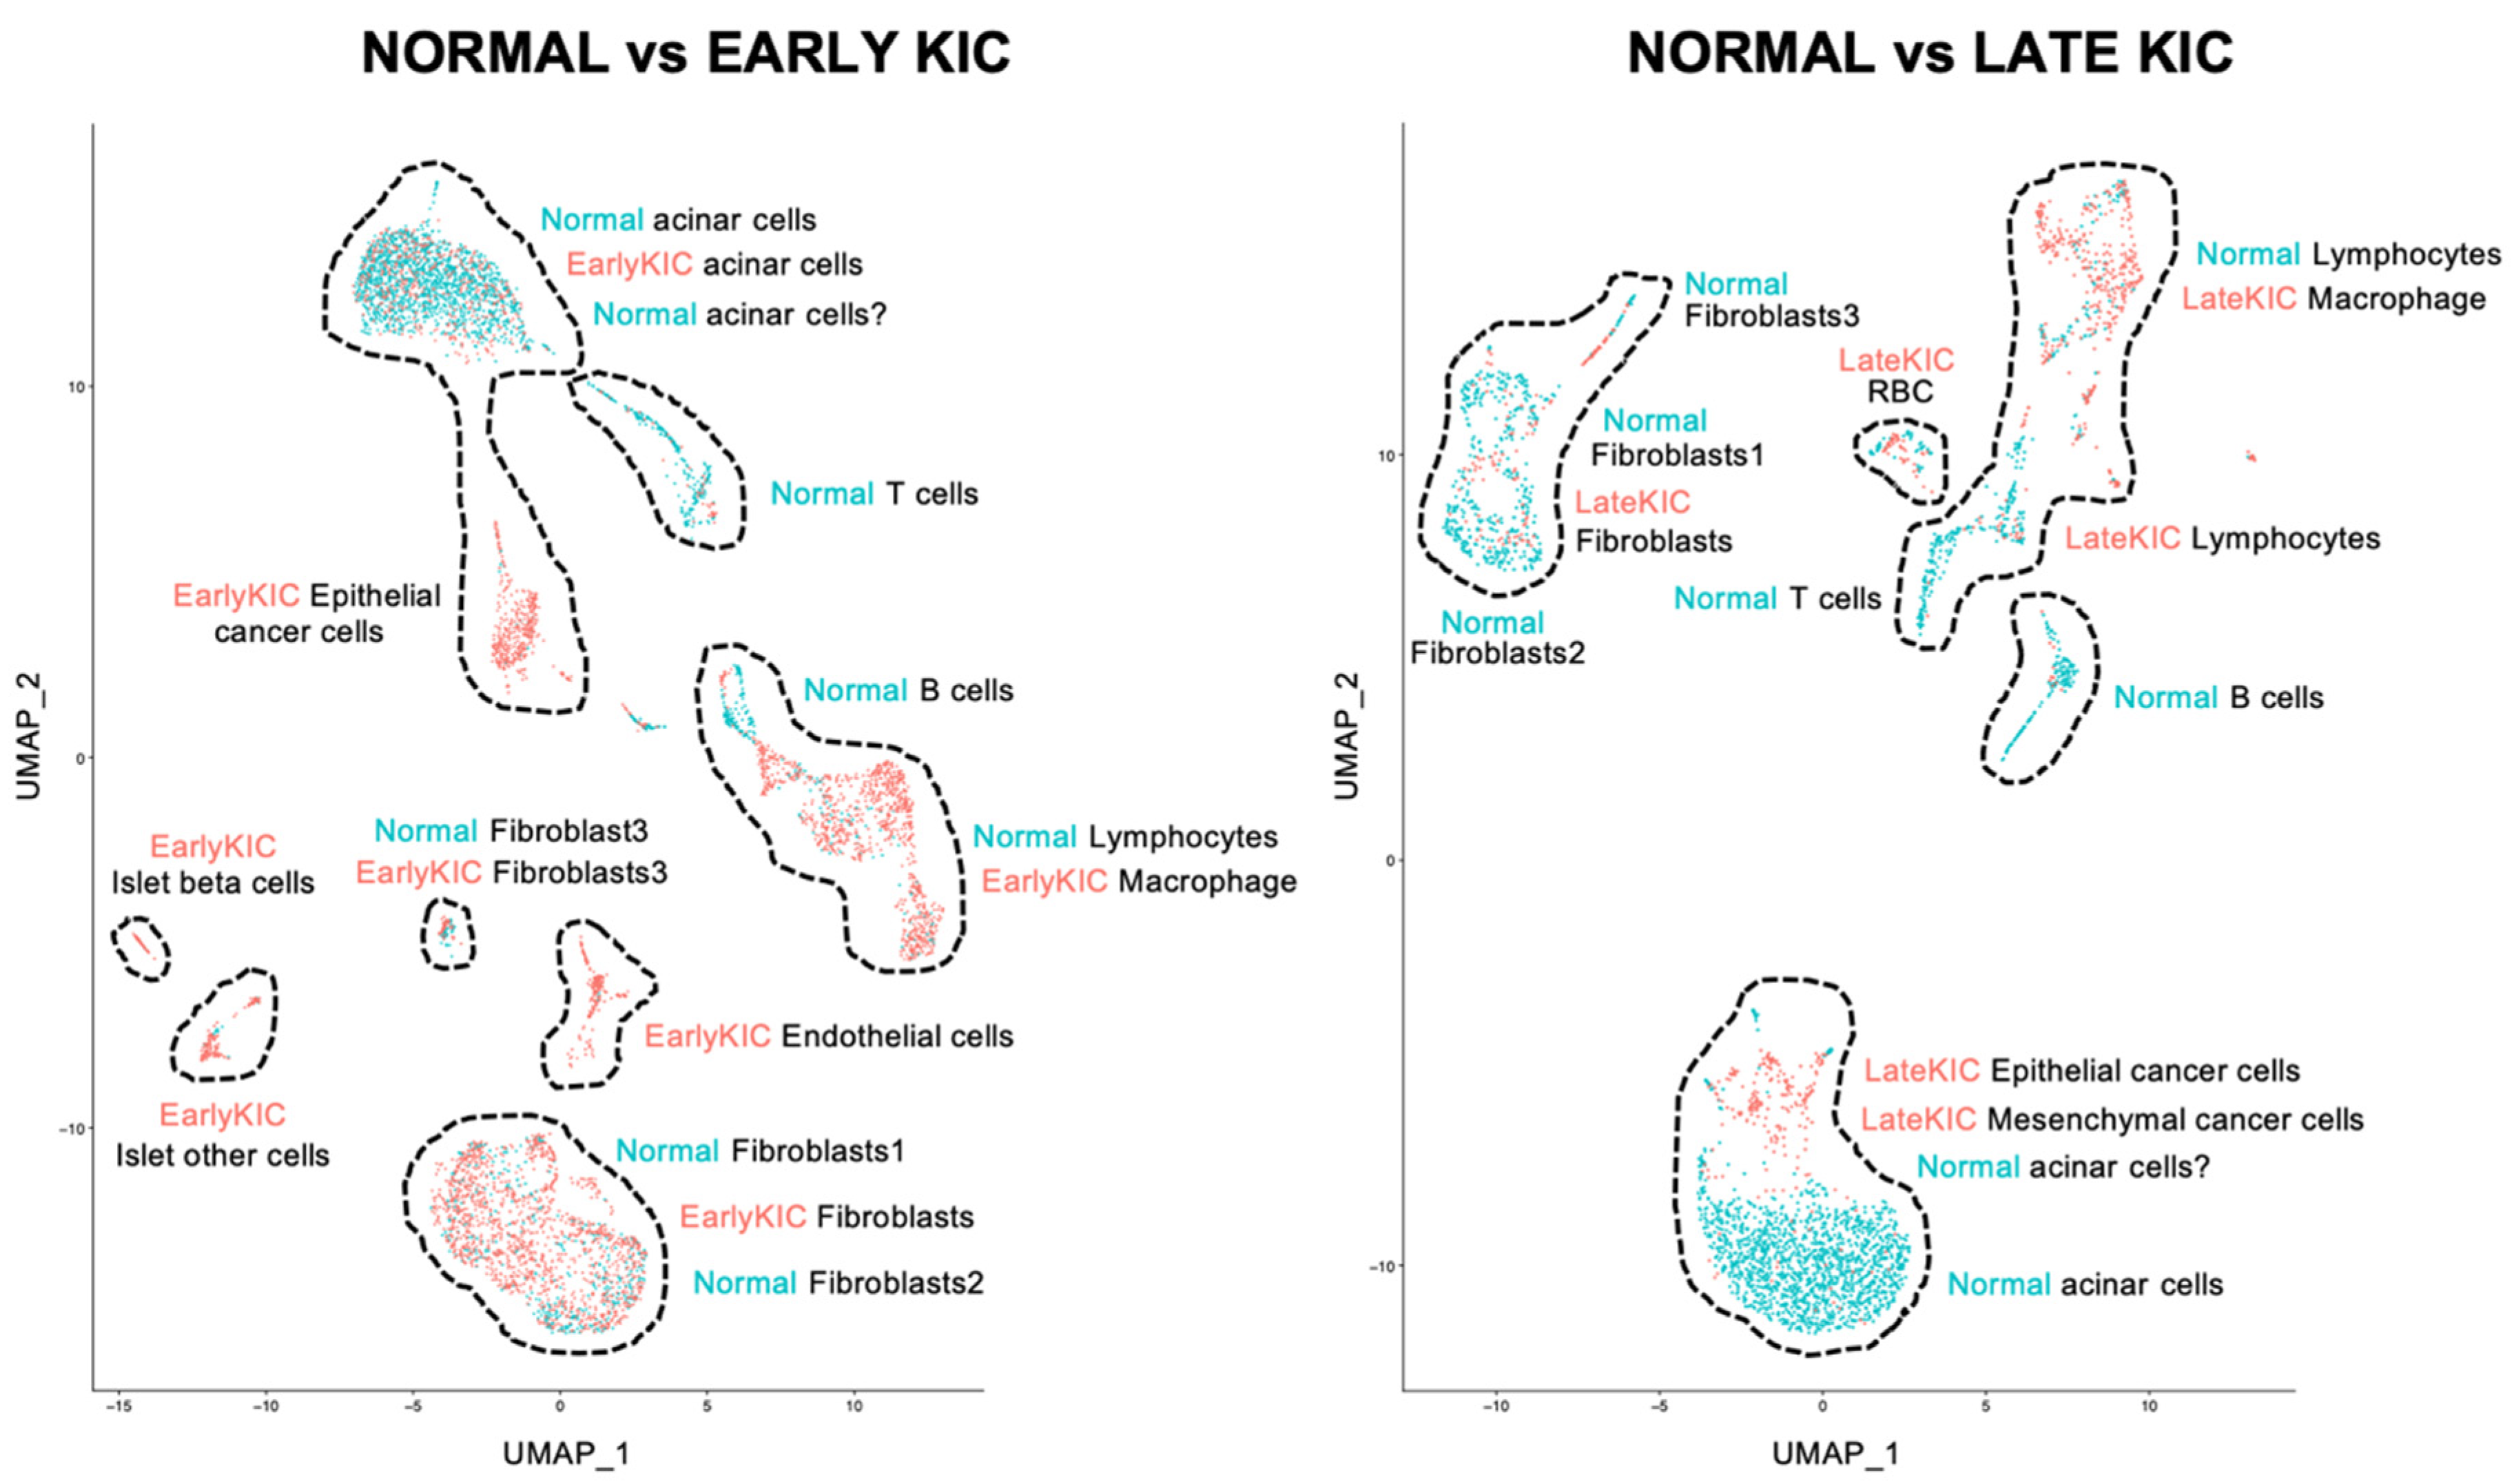
2.1. Single-Cell RNAseq Analysis of PDA in KIC Mice

PDA is among the most lethal cancers because it is detected late, there is no cure, and effective treatments extending patients’ lifespan are lacking. Our initial effort to find new markers for its early detection and diagnosis was to screen for differentially expressed genes in scRNAseq samples from normal pancreata vs. early- or late-stage KIC tumors. scRNAseq datasets (Figure 1 [10]) were used to compare the cell-type identity and relative abundance of the mRNA encoding candidate marker proteins and genes expressed in early-stage PDA (pancreata from 40-day-old KIC mice) or late-stage PDA (pancreatic tumors from 60-day-old KIC mice) vs. a normal mouse pancreas (40 days old). The predominant cell types in the pancreata from the normal and early- and late-stage KIC mice (Figure 1) were identified by cell-type-specific markers described in Hosein et al. [10] (Supplementary Figure S1A) and corroborated by additional pancreatic markers (Supplementary Figure S1B, Supplementary Table S1_Y_Cell ID; 41 genes total).

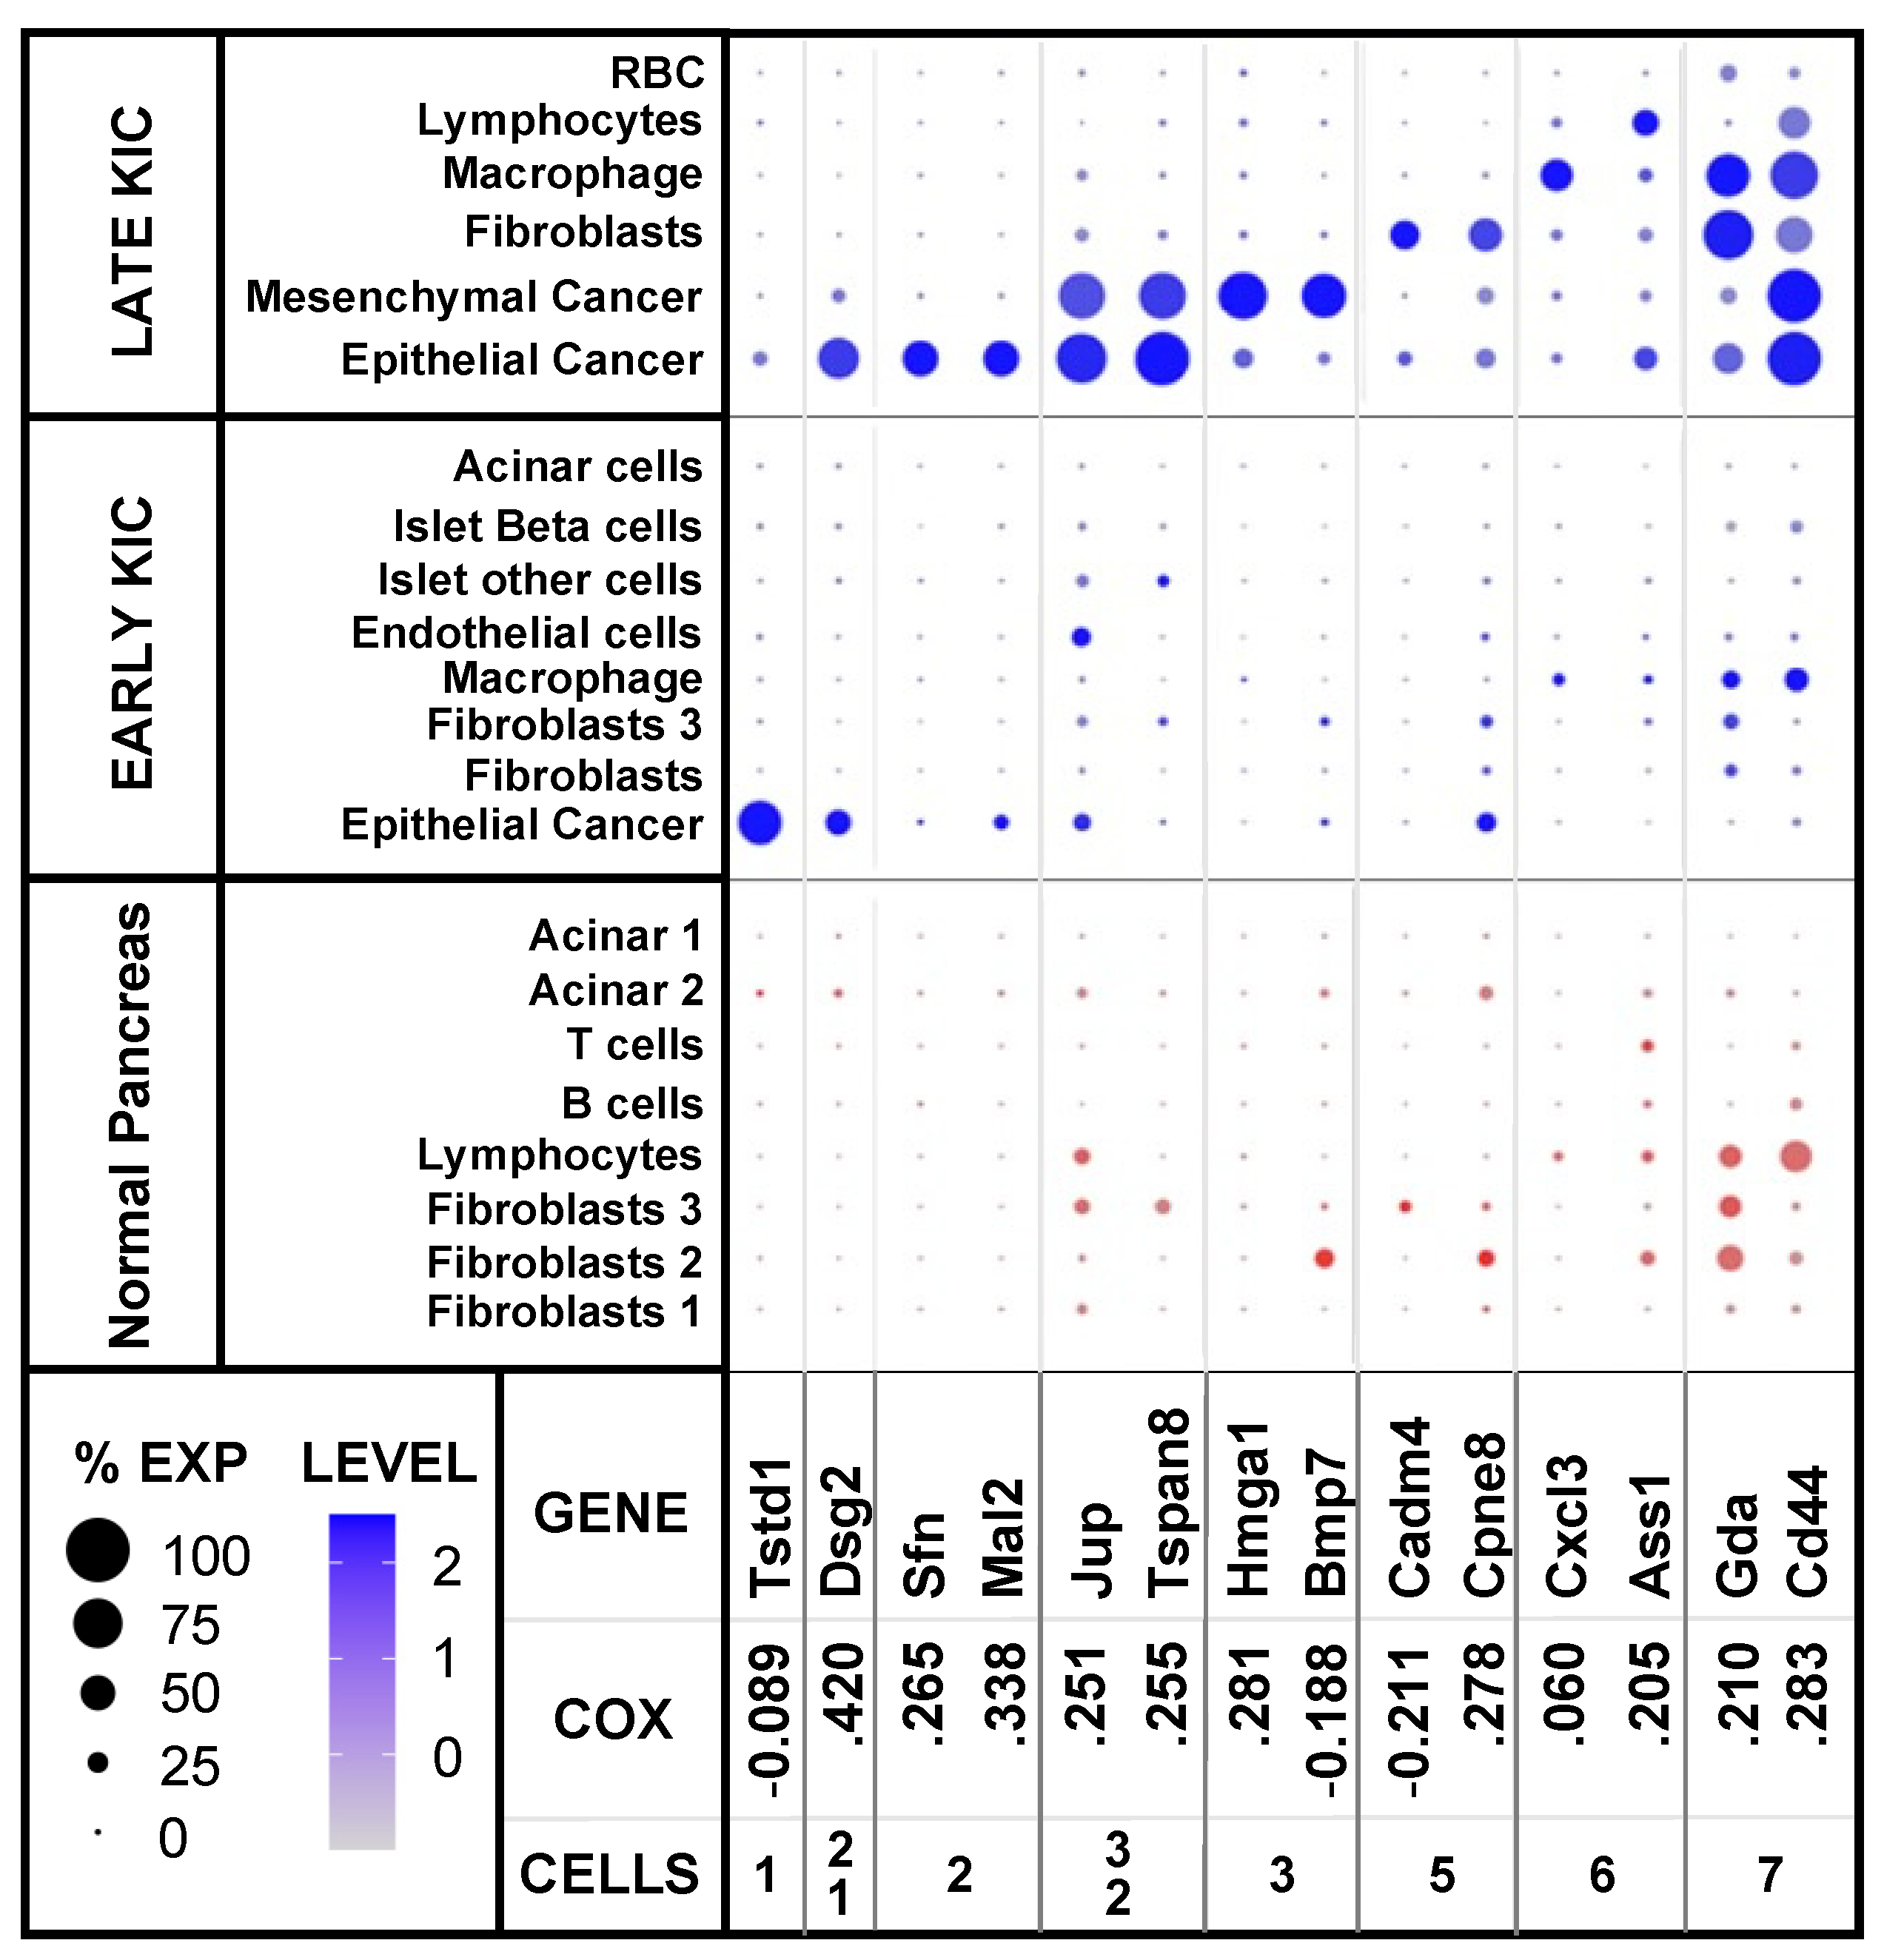
2.2. Cell-Type Expression of Diagnostic PDA Markers

The gene sets of the candidate markers, which are described below, were queried against scRNAseq samples (Figure 1) to identify the cell-type specificity of differentially expressed diagnostic and prognostic genes in PDA. We queried scRNAseq in a normal pancreas compared to early- and late-stage PDA tumors in KIC mice using quantitative dot plots (QDPs) to identify the cell-type expression of candidate genes (listed in Supplementary Table S1). Representative diagnostic markers are shown in Figure 2. The cell-type gene expression identified in our violin plots (Supplementary Figure S2A) and the QDP (Figure 2) were always in agreement (for comparison, see Supplementary Figure S2B, ITGA3).
Six cell types yielded a preponderance of the markers that were preferentially expressed in the cancer and tumor stroma. Differentially expressed genes were specifically expressed in three cancer cell types: epithelial cells in early-stage KIC (Figure 2, Tstd1), and in late-stage KIC epithelial (Figure 2, Sfn and Mal2) and mesenchymal cells (Figure 2, Hmga1 and Bmp7). Additional genes were expressed in the epithelial cells of both early- and late-stage KIC (Figure 2, Dsg2) or in both the epithelial and mesenchymal cells in late-stage KIC (Figure 2, Jup and Tspan8). This suggested the temporal control of cancer gene expression progressing from early epithelial to late mesenchymal cancer cell types. Other genes were preferentially expressed in the stromal cells of late stage-KIC tumors: fibroblasts (Figure 2, Cadm4 and Cpne8), macrophages (Figure 2, Cxcl3) and lymphocytes (Figure 2, Ass1). Some genes were broadly expressed in cancer and stromal cell types in late-stage KIC tumors (Figure 2, Gda and Cd44).
The candidate markers we describe were identified using four approaches: (1) an unsupervised screening of genes preferentially expressed in the mouse PDA tumors (Supplementary Table S1_1C); (2) differential mass spectrometry (MS) to identify proteins of conditioned media from human cancer cell lines or mouse tumors (Supplementary Table S1_2D–2F); (3) signaling pathways that drive PDA, including the Ras pathway, calcium signaling and known cancer genes (Supplementary Table S1_3G–3T); and (4) genes whose expression is associated with poor or better prognoses (PAAD, oncolnc.org; Supplementary Table S1_4U and 4W). The cell-type distribution of 1230 genes preferentially expressed in cancer or tumor stomal cells is in Supplementary Table S1; 33 (3%) of these genes are restricted to early epithelial cancer cells, and 148 (12%) are first expressed here. The complete list of all 2165 differentially expressed genes in cancer and/or stromal cells in the PDA tumors of the early- and late-stage KIC mice is in Supplementary Table S1, column B (ST1_1B, Groups 1-4). These genes exemplify markers for PDA progression from early-stage epithelial to late-stage mesenchymal cancer and stroma.

2.3. Screenings of Pathways and Processes Implicated in PDA

The cell-type expression of candidate marker genes in the early- and late-stage PDA tumors in the KIC mice described below is summarized in Table 1 (gene names and cell-type expression are listed in Supplementary Table S1).

2.4. Candidate Gene Identification

2.4.1. Approach (1): Unsupervised Screening for Differentially Expressed PDA Genes in KIC Mice

The unsupervised screening was conducted for differentially expressed genes in scRNAseq samples from a normal pancreas vs. early-KIC or late-KIC tumors. A total of 503 differentially expressed genes were identified, primarily in epithelial or mesenchymal cancer cells in late-stage KIC tumors (Table 1; gene names are in Supplementary Table S1_1C). To help identify the best candidates for diagnostic markers in patient samples among these 503 genes and to find additional markers, we undertook a series of candidate gene searches among the proteins secreted by the PDA cells and pathways known to impact the initiation and progression of PDA.

2.4.2. Approach (2): Mass Spectrometry Identification of Human and Mouse PDA Proteins

Secreted proteins are more likely than intracellular proteins to be useful markers and can be detected in the blood, stools, or pancreatic juice. To find new markers for early detection and diagnosis that are most likely to be secreted, we used mass spectrometry (MS) [8,9] to identify the proteins that were differentially expressed in conditioned media from five human PDA cell lines (ASPC-1, PANC-1, PL-45, MIA-PaCa-2 and BxPc-3; 3963 unique proteins) compared to a normal duct cell line (HPNE; 3860 proteins). Each PDA cell line expressed distinctive sets of secreted proteins as well as proteins in common with one or more of the other PDA cell lines (Supplementary Figure S3); 847 secreted proteins were expressed ≥4.5× more in human PDA cells than in HPNE cells (Supplementary Table S2), and 187 of these were differentially expressed specific cell types in KIC tumors compared to a normal pancreas (Table 1; gene names are in Supplementary Table S1_2D), but only 16% were expressed in early epithelial cells. There was a correlation of human PDA cell line mRNA and secreted protein abundance, with a few exceptions (Supplementary Figure S4), indicating RNAseq was an informative data set to identify differentially expressed protein markers.
PDA from the solid tumors dissected from the KIC mice (60 days old) and samples for acinar-to-ductal metaplasia and early-stage PDA neoplasia were dissected from KC mice (at 40 days) and compared to normal pancreata from adult mice (60 days). MS identified approximately 3750 proteins in each sample (Supplementary Figure S5). The normal pancreata preferentially expressed digestive enzymes and regulatory pathway proteins that maintain acinar cell identity [19]. In contrast, candidate PDA markers were among the 200 mouse proteins expressed at least 4.5-fold higher in early- or late-stage PDA compared to the normal pancreas (Supplementary Table S3); 53 of these genes were preferentially expressed in specific tumor cell types (Table 1; gene names are in Supplementary Table S1_2E). In total, 1193 mouse PDA proteins were predicted to be secreted in late-stage KIC tumors (Supplementary Table S4); 209 genes were preferentially expressed in specific tumor cell types (Table 1; gene names are in Supplementary Table S1_2F), but their plasma levels are yet to be determined.
The tumor-specific markers among the proteins identified by MS from human PDA cell lines and mouse KIC tumors had few differentially expressed proteins in common, but their general patterns of expression were similar. Most of these proteins were differentially expressed in cancer cells, as well as fibroblasts and/or macrophages in KIC tumors, but those that also had high expression levels in the normal pancreas were set aside because they would probably yield a high rate of false positives in screenings for PDA in the patient samples. In summary, MS of the mouse and human PDA samples identified 50 markers in early epithelial neoplasia (Table 1) and a total of 391 non-redundant candidate markers expressed at various stages of cancer progression, from early epithelial cancer to late epithelial cancer and/or mesenchymal cancer or stromal cells in early- and late-stage tumors.

2.4.3. Approach (3): Pathways of PDA Initiation and Progression

Ras Pathway Genes

Oncogenic Kras mutations are acquired early in PDA progression, but alone, these mutations only destabilize acinar and ductal cell identity [20]. Additional mutations in tumor suppressor genes and chromatin-modifying genes are required for transition into PDA [2]. To assess the expression of other genes important to Ras activity, we surveyed the cell-type expression of Ras pathway genes (https://www.genome.jp/kegg/; accessed on 22 March 2021) [19]. A total of 197 genes were preferentially expressed in specific cell types in PDA tumors but none were uniquely expressed and only eight were expressed in the early epithelium (Table 1; gene names are in Supplementary Table S1_3G). Thus, the Ras pathway primarily comprises markers identifying later stages of PDA.

Mutated Genes

We screened genes associated with genetic alterations in human and mouse PDA in scRNAseq from KIC tumors and a normal pancreas to identify potential diagnostic and stage-specific PDA markers. Numerous genetic mutations are associated with PDA in humans, including missense, gene amplification, and homozygous deletion (as summarized on cBioPortal.org) [21,22,23,24]. Missense and gene amplification events are most frequently found in oncogenes and/or dominant negative mutations in tumor suppressor genes. Homozygous deletions typically occur in tumor suppressor genes. Genetic drivers of PDA were further explored in Sleeping Beauty mutagenesis screenings promoting or inhibiting Kras-dependent transformation in KC mice [25] (Table 1; gene names are in Supplementary Table S1_3H–3K).
We also queried the cell-type expression of mutated cancer gene lists commercially available from Tempus and Foundation Medicine (see company websites). The mutation screening kits from these companies were used to identify new mutations not previously observed in PDA. Of the 688 genes listed, 191 genes were differentially expressed in the PDA cells from the KIC mice (117 genes had not been previously characterized by us) (Table 1; animation time course of expression is in Supplementary Figure S6).
From these five sources of genetic markers, 254 genes were preferentially expressed in the PDA cancer cells and 50 of these were expressed in the early epithelium, with 13 exclusively so (Table 1; gene names and cell-type expression are in Supplementary Table S1_3H–3L).

KEGG Cancer Genes

The KEGG cancer gene set (530 genes) had 66 genes preferentially expressed in the PDA cancer cells, but only one was expressed in early epithelial cancer cells, while 18 genes were preferentially expressed in stromal cell types (fibroblasts, macrophages and/or lymphocytes) (Table 1; gene names and cell-type expression are in Supplementary Table S1_3M).

Pancreatitis Models

Healthy acinar cells resist Kras-dependent PDA initiation and progression [26]. Caerulein stimulates intense calcium signaling evoked by the Gq-coupled CCK receptor [27]. Acute hyperstimulation by caerulein causes the dedifferentiation of acinar cells and provokes an innate immune response initiated by dedifferentiated acinar cells [3,12,18]. In otherwise healthy mice, acinar cells re-differentiate and recover normal activity in about seven days, dependent on the activity of two core differentiation transcription factors (dTFs), Ptf1a and Nr5a2 [13,14,18,19,28]. These dTFs are required for normal embryonic acinar cell development and differentiation, as well as acinar cell maintenance in the pancreata of adult patients [29]. These dTFs oppose Kras-mediated acinar cell transformation in PDA [18,19,30]. However, dTF mRNA and protein expression are transiently expunged during acinar cell dedifferentiation provoked by caerulein, providing an opportunity for oncogenic Kras to drive initial steps towards PDA in caerulein-treated mice.
  • Calcium pathway genes: Among 1750 genes associated with calcium signaling, 138 were preferentially expressed in specific tumor cell types (Table 1; gene names and cell type expression are in Supplementary Table S1_3N).
  • Caerulein: To identify PDA markers that might be differentially expressed in pancreatitis, all candidate PDA marker genes identified above were screened for differential expression in the pancreas of normal mice treated with caerulein; 72 genes were up regulated by the caerulein treatment and 4 genes were down regulated in specific tumor cell types (Table 1; gene names and cell type expression are in Supplementary Table S1_3O and ST1_3P, respectively).
  • Differentiation Transcription Factors (dTFs): A total of 154 and 88 genes that were differentially expressed in KIC tumor cells were also elevated or reduced two-fold, respectively, compared to a normal pancreas in dTF KO mice with the acinar-cell-specific deletion of either Ptf1a or Nr5a2 (Table 1; gene names and cell type expression are in Supplementary Table S1_3Q and ST1_3R, respectively).

Innate Immune Genes

Finally, because acinar-to-ductal metaplasia (ADM) [31] initiates an AP-1- and NFkB-dependent innate immune response [18], we screened the innate immune and NFkB signaling pathways and found 46 genes that were differentially expressed in specific KIC tumor cells compared to in a normal pancreas (Table 1; gene names and cell type expression are in Supplementary Table S1_3S).
Some genes first induced in mouse models of pancreatitis were later expressed in early epithelial cancer cells, and some persisted in mesenchymal cells. These are excellent candidate genes to evaluate as early markers in patients at high risk for progression to PDA. The genes we report partially overlap with early marker genes independently identified by analyzing changes in chromatin accessibility and scRNAseq expression in epithelial cells isolated 48 h post-caerulein treatment in KC mice [32].

2.4.4. Approach (4): Prognostic Markers

Many of the genes that were overexpressed in the epithelial and/or mesenchymal cells of the late-stage KIC tumors (such as Dsg2, Sfn, Mal2, Jup, Tspan, Hmga1 and Cd44; Figure 2) were associated with a poor survival rate in patients (Cox coefficient > 0.250; oncolnc.org). For example, members of the ephrin and Eph receptor gene families with the highest expression in late-stage cancer cells were also the most associated with poor survival, whereas genes with little or no expression in the KIC tumors had little impact on survival (Supplementary Figure S7). Efnb2 is particularly noteworthy, as genetic and pharmacologic studies show it plays a role in cancer cell motility and disease progression [33,34,35,36]. Therefore, we queried the TCGA database of genes associated with worse or better survival in pancreatic ductal adenocarcinoma as a potential resource of both tumor-specific prognostic markers and therapeutic targets (oncolnc.org) [37].
To systematically screen for differentially expressed prognostic markers in PDA, we screened all genes associated with either worse or better survival in human PDA patients (PAAD) for cell-type expression in scRNAseq from KIC and normal mice (representative genes are in Figure 3A,B). We chose a cut-off for Cox coefficient scores greater than 0.250 (1307 genes) or less than −0.250 (2080 genes) because the Kaplan–Meier survival curves of the high and low quartiles began to separate shortly after enrollment, and their separation continued to widen after one and two years (as in Figure 3C,D).
We found 698 and 372 of the genes differentially expressed in the PDA tumors the in early- and late-KIC mice were associated with worse or better prognoses. The cell-type expression of the differentially expressed genes that were identified among the 500 most highly correlated with worse or better survival is reported (Supplementary Table S1_4U and 4W, respectively). The genes associated with worse survival tended to be more highly expressed in cancer cells, whereas the genes associated with better survival tended to have a higher expression in stomal hematopoietic cells. The top and bottom quartiles of Pdcd10 (Cox 0.506) and Pgs1 (Cox −0.465) were associated with dramatically different survival outcomes (Figure 3C,D). Even accounting for the eight long-lived patients with tumors having neuroendocrine features and one control sample in the PAAD dataset, nearly 60% of the patients with low Pdcd10 or high Pgs1 expression survived 8 years past diagnosis. Differentially expressed genes with exceptionally high or low Cox coefficient scores may be excellent therapeutic targets.

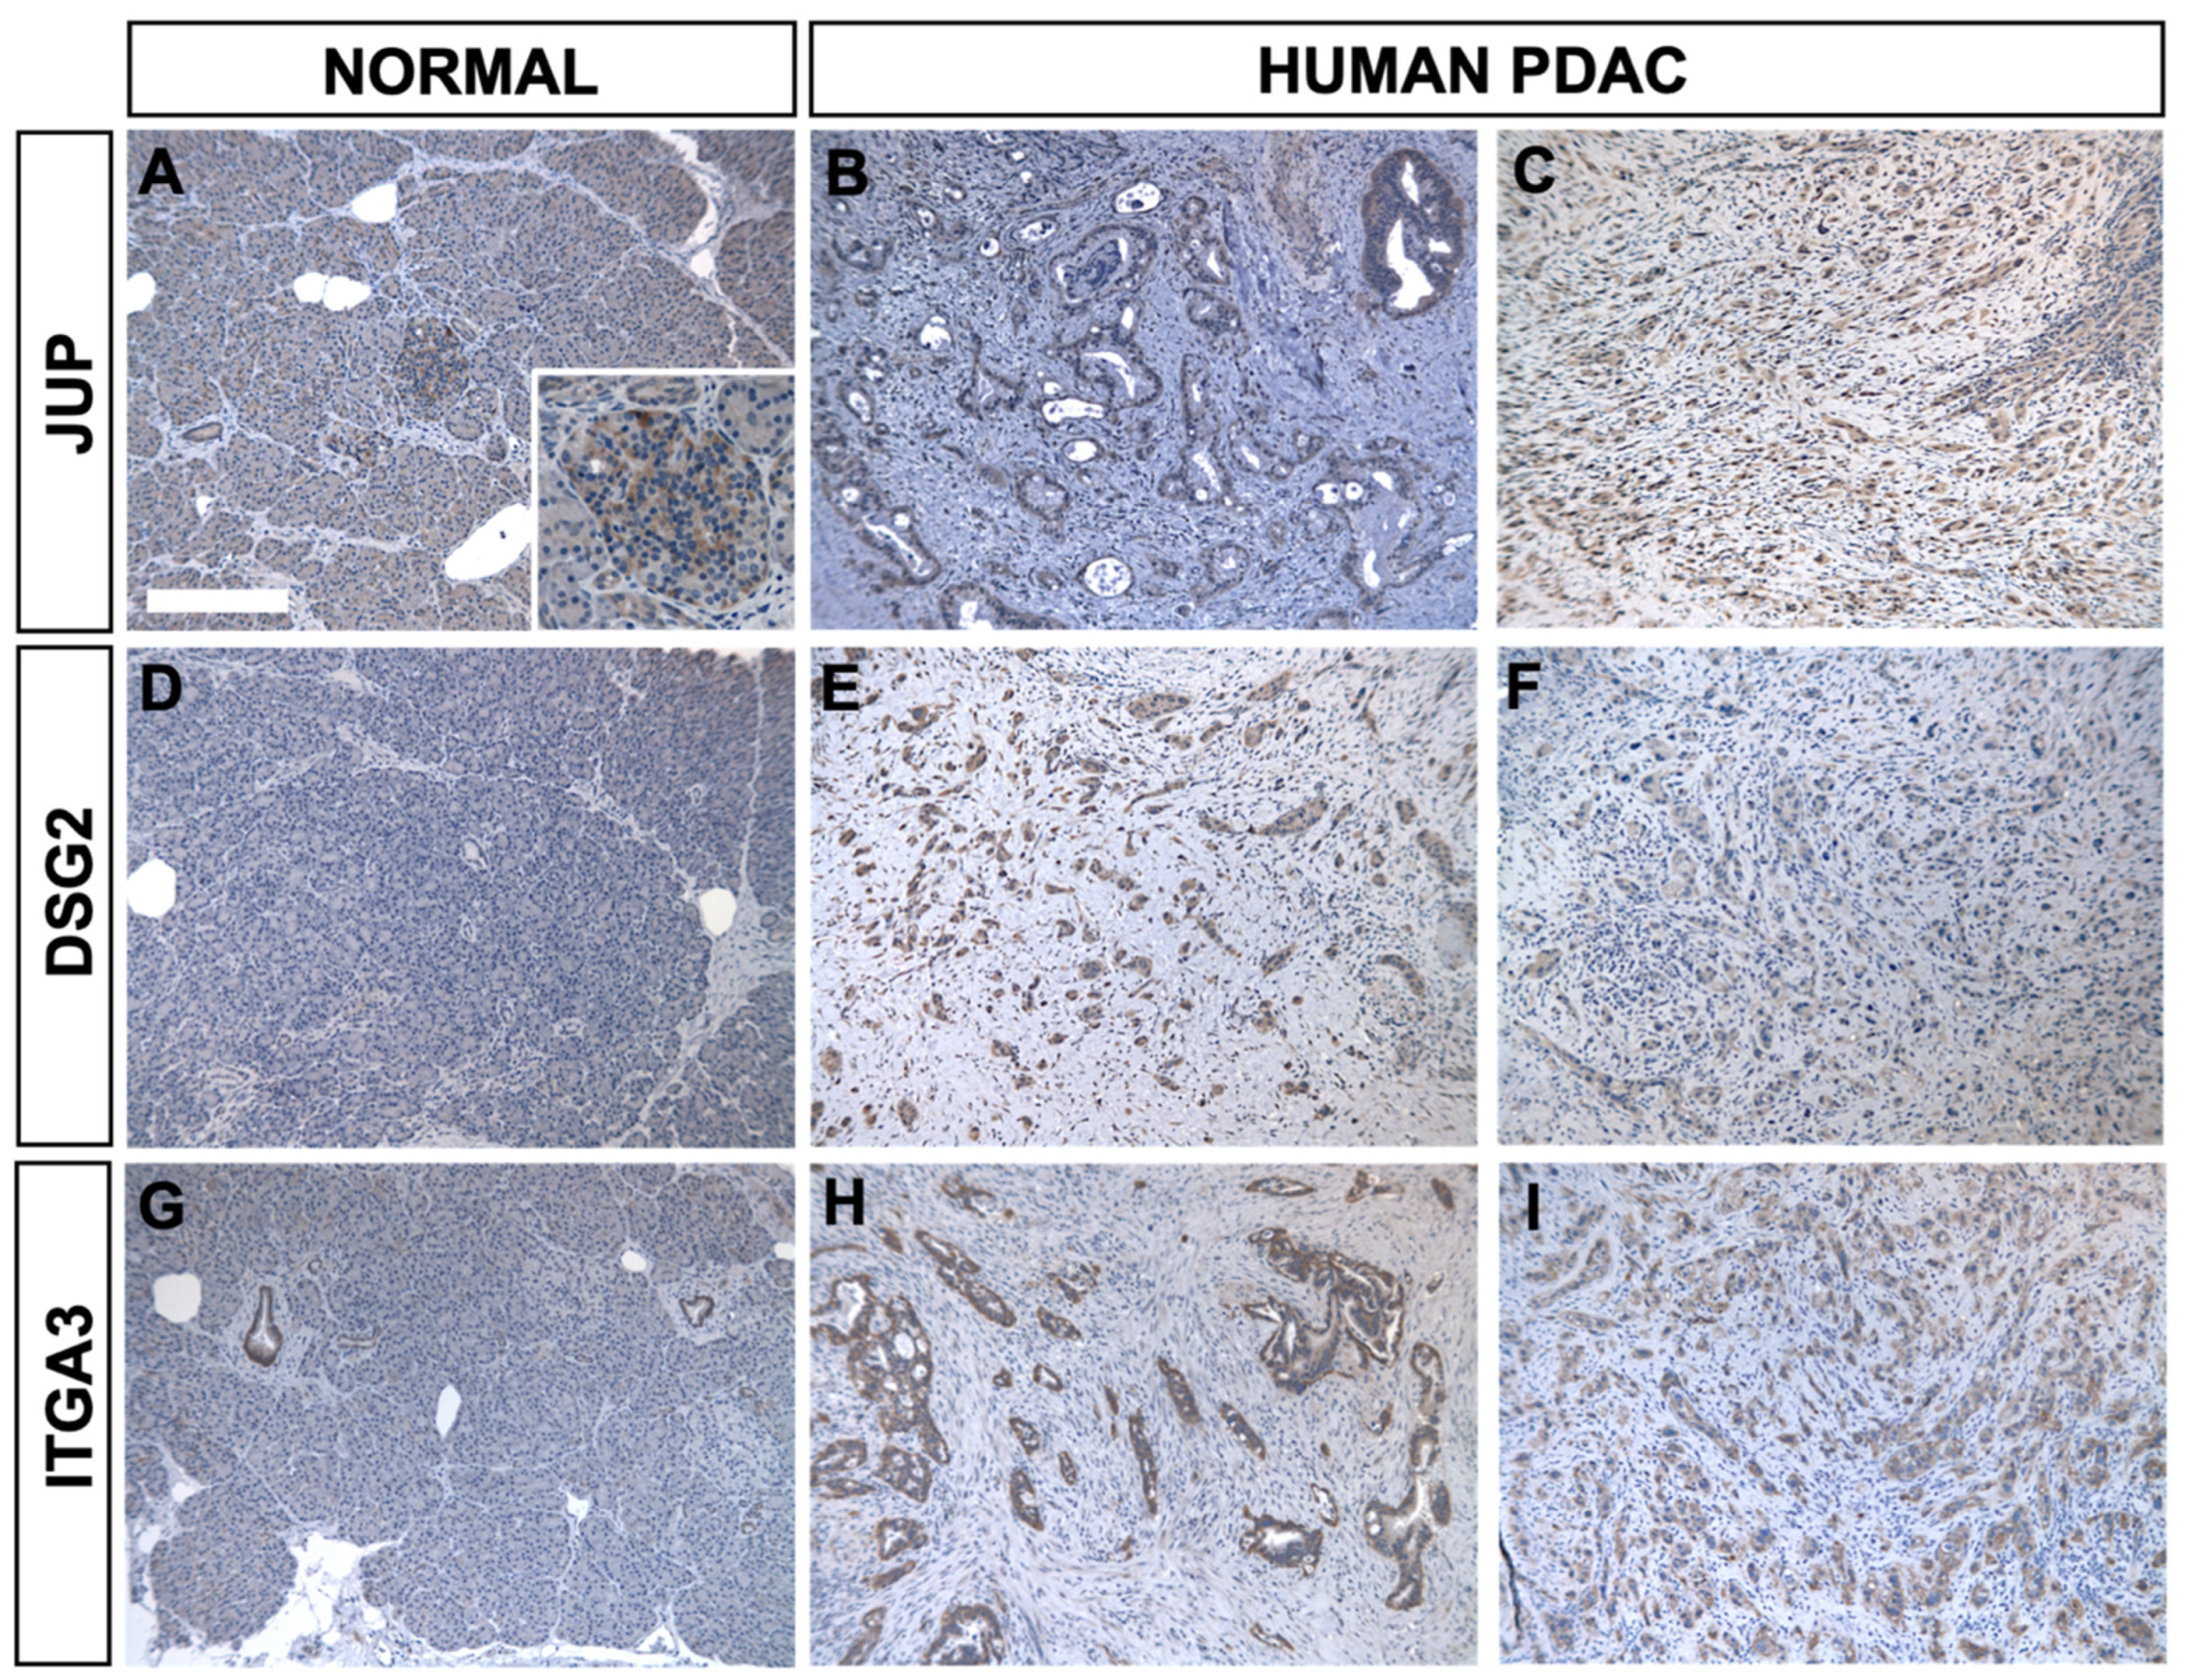
2.5. Immunohistochemistry Validation of PDA Markers

Three exemplary markers identified by mass spectrometry (JUP, DSG2 and ITGA3) and shown to be differentially expressed by scRNAseq from KIC tumors were assayed by immunohistochemistry for their tumor-specific expression in paraffin sections of normal and PDA human (Figure 4) and mice samples (Supplementary Figure S8). Supplementary Table S5A,B list the commercially available antibodies for the candidate markers identified by mass spectrometry in human PDA cell lines and mouse tumors, respectively. The tissue expression patterns of protein assayed by IHC and scRNAseq QDP were internally consistent for each marker tested. Thus, scRNAseq provides a convenient and reliable tool for identifying potential diagnostic and prognostic markers.

2.6. Pathway Analysis

Our KEGG and Wiki pathway analysis indicated the differentially expressed genes identified in the mouse scRNAseq samples from the KIC mice were most closely related to human pancreatic, colorectal, hepatocellular and bladder cancers (Supplementary Figure S9). An Enrichr [38] pathway analysis of 1183 genes identified clusters of differentially expressed genes in several interesting pathways, including epithelial–mesenchymal transition (EMT), PI3K-Akt signaling, hyaluronin, and Toll-like receptor signaling. A Cytoscape pathway analysis of differentially expressed genes from the unsupervised screening identified gene clusters predominately in receptor activity, cell–cell communication, sulfur compound binding and processes involved in cell motility (Supplementary Figure S10).

3. Discussion

Multiple cell-type and stage-specific markers were identified from each of the candidate gene searches for markers preferentially expressed in mouse models of pancreatitis, acinar-to-ductal metaplasia, tumors in KC and KIC mice, or human PDA cancer cell lines (summarized in Table 1). Many genes act in multiple pathways. In total, 2165 non-redundant genes differentially expressed in PDA were identified.
Early markers first expressed in epithelial cancer cells in early-KIC mice were preferentially enriched in the caerulein-treated mice (Caer) and the pancreas-specific knockouts of the two differentiation transcription factors, Ptf1a and Nr5a2 (ko DTF Up/Down). Later stage markers were enriched in genes from pathways known to be involved in PDA initiation and progression and in an unsupervised screening of preferential gene expression in early- vs. late-stage PDA tumors in KIC mice. Another rich source of late-stage markers was identified among the top 1307 genes associated with worse survival in PDA patients (Cox ≥ 0.250, oncolnc PAAD).
The etiology of cancer initiation and progression is difficult to investigate in patients but can be characterized in mouse models of pancreatitis and PDA. We identified candidate diagnostic and prognostic markers expressed in mouse PDA cancer and stromal cells at specific stages of pancreatitis and PDA initiation and progression. Cell-type specific diagnostic markers can be assessed in blood, other body fluids and tissue specimens to validate their utility in identifying early- and later-stage PDA cancer in patients. Some of these proteins are secreted, while others might be concentrated in exosomes, and their mRNA may also be detected in exosomes and/or platelets [38]. The markers that are expressed in mouse models of pancreatitis may be useful for identifying PDA progression in high-risk patients.
Other stage-specific markers are associated with either longer or shorter survival upon diagnosis of PDA and may be excellent targets for stage-specific treatments. An analysis of the cell-type expression of the 1307 genes whose elevated expressions are most highly correlated with poor survival in PAAD (Cox ≥ 0.250, oncolnc.org) yielded 698 (53%) differentially expressed genes, primarily in late-stage cancer cells. By contrast, the 2080 genes associated with better survival in PDA yielded 369 (18%) differentially expressed genes, mostly in stromal cell types. Many of these genes were previously implicated in cancer. For example, EFNB2, EPHA2 and ITGA3, all associated with worse prognoses, are co-expressed in cell motility pathways, and all were highly expressed in late-stage KIC epithelial and mesenchymal cancer (Figure 3A and Figure 4, and Supplementary Figure S7). Genetic and pharmacologic studies indicate EFNB2 plays a role in cell migration but not cell survival [31,32,33,34]. ITGA3 encodes integrin alpha-3, which binds extracellular matrix proteins, and its elevated expression is implicated in metastatic cancer [39]. The adhesion receptor Gpr56 (ADGR1) was identified by MS to be expressed in two human PDA cell lines, AsPC-1 and PL-45, but not BxPC-1, MIA-PaCa-2 or PANC-1, consistent with earlier findings of low protein expression in later cell lines [40]. Gpr56 is co-expressed with Itga3 in late-stage KIC mesenchymal cancer cells, and each interacts with EGFR pathway components that promote PDA (string-db.org) [41,42,43]. The differentially expressed genes in the interactome are listed in Supplementary Table S1_3T.
In summary, we demonstrate the utility of evaluating quantitative dot plots of scRNAseq data from early- and late-stage KIC mice to identify marker gene expression for specific cell types and stages of PDA progression. Using this approach, we characterized 2165 individual genes expressed in various cell types in multiple mouse models of pancreatitis, as well as early- and late-stage PDA, compared to those in a normal pancreas (Supplementary Table S1). The differentially expressed genes are candidates for stage-specific diagnostic markers for patients at risk of progression to PDA, for the staging of PDA patients and for evaluating disease recurrence after surgical resection of PDA tumors. Furthermore, we identified 1067 differentially expressed genes that are associated with either worse (698 genes) or better (369 genes) survival rates for PDA (Cox coefficient ≥ 0.250 or ≤ −0.250, respectively; oncolnc.org). The characterization of these candidate markers in patient samples from clinics throughout the world will help identify definitive sets of stage-specific diagnostic and prognostic markers and constitutes an initial step towards identifying improved therapeutics.

4. Materials and Methods

Mass Spectrometry. Quantitative mass spectrometric LC-MS/MS analysis was performed as described [9].
Cell Lines. Human pancreatic cancer and normal duct cell lines were obtained from ATCC (https://www.atcc.org accessed on 1 December 2012; all cell lines accessed before 2013). PANC-1 (CRL-1469); MIA-PaCa-2 (CRM-CRL-1420); ASPC-1 (CRL-1682); PL-45 (CRL-2558); BxPc-3 (CRL-1687); and hTERT-HPNE (CRL-4023).
Mice. KIC, pancreas-specific expression of KrasG12D and deletion of Cdkn2a (LSL_KrasG12D/+; Cdnk2af/f; Ptf1a::Cre) [7]. KC, pancreas-specific expression of KrasG12D (LSL_KrasG12D/+; Ptf1a::Cre) [7]. Pancreas-specific Ptf1a and Nr5a2 KO [13,19].
Caerulein treatment. Normal mice (12 weeks of age) were treated with caerulein as described [19].
Comparison of RNA and secreted protein expression in human PDA cell lines. Relative levels of RNAseq (Log FPKM; obtained from CCLE, Broad Institute) and secreted protein in conditioned media (quantitative MS; [8,9]) were compared for the cell lines AsPC-1, BxPc-3, MIA-PaCa-2 and PANC-1. Refer to Supplementary Figure S4 for details.
Dot plots and heatmaps. Quantitative dot plots (QDPs) were generated using Seurat v4.0 R package. R version 4.0.3 was used for all computations.
Immunohistochemistry. Paraffin-embedded human PDA tissue sections on glass slides were obtained from the Harold C. Simmons Comprehensive Cancer Center Tissue Management Shared Resource. Mouse PDA samples were from KIC mice [7]. Sections were incubated at 60 °C for 30 min then quickly dipped in ClearRight3 (Richard-Allan Scientific 22-046341; San Diego, CA, USA) for 20 min to deparaffinate. Sections were then rehydrated by dipping in decreasing concentrations of ethanol followed by final 15 min bath in dH2O. Antigen retrieval was performed by incubation in Antigen Unmasking Solution (Vector Labs H3300; Newark, CA, USA) for 10 min followed by high temperature/pressure retrieval (Aptum Biologics RR2100-EU 2100-Retriever; Southampton, UK) for 60 min. Sections were cooled and equilibrated in dH2O for 10 min. Endogenous hydrogen peroxide activity was quenched by incubation in 3% H2O2 for 30 min followed by 10 min rinse in dH2O. Background binding issues were blocked using 5% normal goat serum (Cell Signaling Technology #5425; Danvers, MA, USA) in PBS + 0.05% Tween 20 (PBS-T) for 60 min at RT. Primary antibodies were diluted in 2.5% normal goat serum in PBS-T and incubated on tissue sections O/N at 4 °C in a humid chamber. Sections were washed in PBS-T for 15 min. Sections were incubated with HRP-conjugated secondary antibodies for 60 min RT, then washed in PBS-T for 14 min. Sections were equilibrated in DAB Buffer (DBA Substrate Kit, Thermoscientific #34002; Waltham, MA, USA) for 10 min RT followed by incubation for varying times in 1× DAB substrate in supplied buffer. Reactions were stopped by washing in PBS-T for 15 min. Counterstaining was performed by briefly dipping the sections in Harris hematoxylin (Sigma-Aldrich HHS32; St Louis, MO, USA) followed by extensive washing in warm tap H2O. Coverslips were affixed using Permount Mounting Medium (Fisher SP15-100; Hampton, NH, USA). Images were acquired using a Leica DMRXE microscope (Wetzlar, Germany). Minimal optimization of images was performed using Preview version 8.1.
Primary antibodies were rabbit anti-desmoglein2 (Novus Biologicals NBP1-33374; dilution 1:500; Centennial, CO, USA), rabbit anti-junction plakoglobin (Proteintech 11146-1-AP; dilution 1:50; Rosemont, IL, USA) and mouse anti-Integrin alpha 3 (Proteintech 66070-1-Ig; dilution 1:4000; Rosemont, IL, USA). Secondary antibodies were HRP-conjugated Goat Anti-Rabbit IgG Polymer Detection Kit peroxidase (Immpress MP7451; Vector Labs, Newark, CA, USA) and Goat Anti-Mouse IgG Polymer Detection Kit peroxidase (Immpress MP 7452; Vector Labs, Newark, CA, USA).
Pathway Analysis. Enrichr [38], an online tool for overenrichment analysis (ORA), was used to identify pathways containing the most genes that were differentially expressed in PDA tumors in KIC mice. The set of 1187 markers was queried against four databases (KEGG, WikiPathways, Reactome and MSigDB Hallmarks [44,45,46,47]) to identify biologically relevant pathways. The combined score assessed the magnitude of pathway enrichment considering the ratio of genes in both the query list of 1187 markers and the pathway gene set, the number of genes in the pathway and the statistical significance of inclusion (adjusted p-value < 0.002). Pathways with the highest combined score were plotted using DOSE [48] and ggplot2 packages in R. The color of each dot represents the adjusted p value while the size is proportional to the combined score (magnitude of pathway enrichment in gene list calculated in Enrichr) (see Supplementary Figure S9).
Pathway analysis of the 503 differentially expressed genes identified by an unsupervised comparison of scRNAseq levels in normal pancreas vs. early- and late-stage KIC queried multiple databases (GO:CC—GO cellular component; GO:MF—GO molecular function; GO:BP—GO biological process; KEGG—KEGG pathways; REAC—Reactome pathways; TF—Regulatory motifs for these genes; HPA—Human protein atlas; CORUM—Comprehensive resource of mammalian protein complexes; and HP—Human phenotype ontology (see Supplementary Figures S1–S10, Supplementary Tables S1–S5).

Supplementary Materials

The following supporting information can be downloaded at: https://www.mdpi.com/article/10.3390/ijms25126619/s1.

Author Contributions

Conceptualization, H.S.K., H.H., P.D., R.J.M., R.A.B., Y.Y. and T.M.W.; Data curation, H.S.K., M.A.H., S.P.C., H.H., R.K.K., L.G., Y.B., P.D., R.J.M., R.A.B. and T.M.W.; Formal analysis, H.S.K., M.A.H., H.H., X.-d.W., Y.Z., G.I., S.P.R.M., N.R., S.R., R.K.K., L.G., Y.B., Y.Y. and T.M.W.; Funding acquisition, R.J.M., R.A.B., Y.Y. and T.M.W.; Methodology, H.S.K., M.A.H., H.H., X.-d.W., Y.Z., G.I., S.P.R.M., N.R., S.R., L.G., P.D., R.J.M., R.A.B., Y.Y. and T.M.W.; Project administration, R.J.M., R.A.B., Y.Y. and T.M.W.; Resources, R.J.M., R.A.B., Y.Y. and T.M.W.; Software, H.S.K., R.K.K., L.G., Y.B. and P.D.; Supervision, R.J.M., R.A.B., Y.Y. and T.M.W.; Validation, H.S.K., M.A.H., S.P.C., R.K.K., V.L., L.G. and Y.Y.; Visualization, H.S.K., M.A.H., S.P.C., H.H., X.-d.W., R.K.K., L.G., Y.B., P.D. and T.M.W.; Writing—original draft, H.S.K., M.A.H., S.P.R.M. and T.M.W.; Writing—review & editing, M.A.H., S.P.C., Y.Z., G.I., V.L., L.G., R.J.M. and T.M.W. All authors have read and agreed to the published version of the manuscript.

Funding

We are grateful for the early support provided by Anthony Hayes and Spherix/AiKido for his gift and their research support, respectively (TMW), Cogia AG for partially supporting the salary of HSK, the NIH (R35GM134883 to YY) and the NCI (CA192381 to RAB and TMW).

Institutional Review Board Statement

The animal study protocol was approved by the Institutional Review Board (IACUC Committee) of UT Southwestern Medical Center (protocol code 2016-101480, Approval Date: 14 April 2022).

Informed Consent Statement

Not applicable.

Data Availability Statement

Data is contained within the article, Supplementary Material, or references cited.

Acknowledgments

We would like to thank the Cheryl Lewis and the Simmons Cancer Center Tissue Management Shared Resource Support Grant (NCI P30 CA142543) for the human tissue samples, Jason Toombs for culturing and providing the human PDA cells, Kinza Rizwan and Adaeze Eze for the early data analysis (and support from PVUA&M summer research program) and Jane Johnson for her encouragement and comments on the manuscript.

Conflicts of Interest

Authors YB and PD were employed by the company Cogia AG, and HSK was partially supported by salary from Cogia AG. The remaining authors declare that the research was conducted in the absence of any commercial or financial relationships that could be construed as a potential conflict of interest.

Abbreviations

MS, mass spectrometry; scRNAseq, single cell RNA sequencing; ADM, acinar-to-ductal metaplasia; PDA, pancreatic ductal adenocarcinoma; PAAD, TCGA pancreatic adenocarcinoma; TCGA, the cancer genome atlas; KIC, mouse model of PDA; QDP, quantitative dot plot; dTF, differentiation transcription factors of pancreatic acinar cells (Ptf1a, Nr5a2); T2D, type 2 diabetes; tSNE, t-distributed stochastic neighbor embedding.

References

  1. Principe, D.R.; Underwood, P.W.; Korc, M.; Trevino, J.G.; Munshi, H.G.; Rana, A. The Current Treatment Paradigm for Pancreatic Ductal Adenocarcinoma and Barriers to Therapeutic Efficacy. Front. Oncol. 2021, 11, 688377. [Google Scholar] [CrossRef] [PubMed]
  2. Yachida, S.; Iacobuzio-Donahue, C.A. Evolution and dynamics of pancreatic cancer progression. Oncogene 2013, 32, 5253–5260. [Google Scholar] [CrossRef]
  3. Jones, S.; Zhang, X.; Parsons, D.W.; Lin, J.C.; Leary, R.J.; Angenendt, P.; Mankoo, P.; Carter, H.; Kamiyama, H.; Jimeno, A.; et al. Core signaling pathways in human pancreatic cancers revealed by global genomic analyses. Science 2008, 321, 1801–1806. [Google Scholar] [CrossRef] [PubMed]
  4. McWilliams, R.R.; Maisonneuve, P.; Bamlet, W.R.; Petersen, G.M.; Li, D.; Risch, H.A.; Yu, H.; Fontham, E.T.; Luckett, B.; Bosetti, C.; et al. Risk Factors for Early-Onset and Very-Early-Onset Pancreatic Adenocarcinoma: A Pancreatic Cancer Case-Control Consortium (PanC4) Analysis. Pancreas 2016, 45, 311–316. [Google Scholar] [CrossRef] [PubMed]
  5. Bailey, P.; Chang, D.K.; Nones, K.; Johns, A.L.; Patch, A.M.; Gingras, M.C.; Miller, D.K.; Christ, A.N.; Bruxner, T.J.; Quinn, M.C.; et al. Genomic analyses identify molecular subtypes of pancreatic cancer. Nature 2016, 531, 47–52. [Google Scholar] [CrossRef] [PubMed]
  6. Moffitt, R.A.; Marayati, R.; Flate, E.L.; Volmar, K.E.; Loeza, S.G.; Hoadley, K.A.; Rashid, N.U.; Williams, L.A.; Eaton, S.C.; Chung, A.H.; et al. Virtual microdissection identifies distinct tumor- and stroma-specific subtypes of pancreatic ductal adenocarcinoma. Nat. Genet. 2015, 47, 1168–1178. [Google Scholar] [CrossRef] [PubMed]
  7. Aguirre, A.J.; Bardeesy, N.; Sinha, M.; Lopez, L.; Tuveson, D.A.; Horner, J.; Redston, M.S.; DePinho, R.A. Activated Kras and Ink4a/Arf deficiency cooperate to produce metastatic pancreatic ductal adenocarcinoma. Genes Dev. 2003, 17, 3112–3126. [Google Scholar] [CrossRef] [PubMed]
  8. Ding, M.; Bruick, R.K.; Yu, Y. Secreted IGFBP5 mediates mTORC1-dependent feedback inhibition of IGF-1 signalling. Nat. Cell Biol. 2016, 18, 319–327. [Google Scholar] [CrossRef] [PubMed]
  9. Wang, X.D.; Hu, R.; Ding, Q.; Savage, T.K.; Huffman, K.E.; Williams, N.; Cobb, M.H.; Minna, J.D.; Johnson, J.E.; Yu, Y. Subtype-specific secretomic characterization of pulmonary neuroendocrine tumor cells. Nat. Commun. 2019, 10, 3201. [Google Scholar] [CrossRef] [PubMed]
  10. Hosein, A.N.; Huang, H.; Wang, Z.; Parmar, K.; Du, W.; Huang, J.; Maitra, A.; Olson, E.; Verma, U.; Brekken, R.A. Cellular heterogeneity during mouse pancreatic ductal adenocarcinoma progression at single-cell resolution. JCI Insight 2019, 5, e129212. [Google Scholar] [CrossRef] [PubMed]
  11. Guerra, C.; Collado, M.; Navas, C.; Schuhmacher, A.J.; Hernandez-Porras, I.; Canamero, M.; Rodriguez-Justo, M.; Serrano, M.; Barbacid, M. Pancreatitis-induced inflammation contributes to pancreatic cancer by inhibiting oncogene-induced senescence. Cancer Cell 2011, 19, 728–739. [Google Scholar] [CrossRef] [PubMed]
  12. Guerra, C.; Schuhmacher, A.J.; Canamero, M.; Grippo, P.J.; Verdaguer, L.; Perez-Gallego, L.; Dubus, P.; Sandgren, E.P.; Barbacid, M. Chronic pancreatitis is essential for induction of pancreatic ductal adenocarcinoma by K-Ras oncogenes in adult mice. Cancer Cell 2007, 11, 291–302. [Google Scholar] [CrossRef] [PubMed]
  13. Hale, M.A.; Swift, G.H.; Hoang, C.Q.; Deering, T.G.; Masui, T.; Lee, Y.K.; Xue, J.; MacDonald, R.J. The nuclear hormone receptor family member NR5A2 controls aspects of multipotent progenitor cell formation and acinar differentiation during pancreatic organogenesis. Development 2014, 141, 3123–3133. [Google Scholar] [CrossRef] [PubMed]
  14. Xuan, S.; Borok, M.J.; Decker, K.J.; Battle, M.A.; Duncan, S.A.; Hale, M.A.; Macdonald, R.J.; Sussel, L. Pancreas-specific deletion of mouse Gata4 and Gata6 causes pancreatic agenesis. J. Clin. Investig. 2012, 122, 3516–3528. [Google Scholar] [CrossRef] [PubMed]
  15. Meredith, D.M.; Borromeo, M.D.; Deering, T.G.; Casey, B.H.; Savage, T.K.; Mayer, P.R.; Hoang, C.; Tung, K.C.; Kumar, M.; Shen, C.; et al. Program specificity for Ptf1a in pancreas versus neural tube development correlates with distinct collaborating cofactors and chromatin accessibility. Mol. Cell. Biol. 2013, 33, 3166–3179. [Google Scholar] [CrossRef] [PubMed]
  16. Kim, H. Cerulein pancreatitis: Oxidative stress, inflammation, and apoptosis. Gut Liver 2008, 2, 74–80. [Google Scholar] [CrossRef] [PubMed]
  17. Molero, X.; Vaquero, E.C.; Flandez, M.; Gonzalez, A.M.; Ortiz, M.A.; Cibrian-Uhalte, E.; Servitja, J.M.; Merlos, A.; Juanpere, N.; Massumi, M.; et al. Gene expression dynamics after murine pancreatitis unveils novel roles for Hnf1alpha in acinar cell homeostasis. Gut 2012, 61, 1187–1196. [Google Scholar] [CrossRef] [PubMed]
  18. Cobo, I.; Martinelli, P.; Flandez, M.; Bakiri, L.; Zhang, M.; Carrillo-de-Santa-Pau, E.; Jia, J.; Sanchez-Arevalo Lobo, V.J.; Megias, D.; Felipe, I.; et al. Transcriptional regulation by NR5A2 links differentiation and inflammation in the pancreas. Nature 2018, 554, 533–537. [Google Scholar] [CrossRef]
  19. Krah, N.M.; De La, O.J.; Swift, G.H.; Hoang, C.Q.; Willet, S.G.; Chen Pan, F.; Cash, G.M.; Bronner, M.P.; Wright, C.V.; MacDonald, R.J.; et al. The acinar differentiation determinant PTF1A inhibits initiation of pancreatic ductal adenocarcinoma. Elife 2015, 4, e07125. [Google Scholar] [CrossRef] [PubMed]
  20. Collins, M.A.; Bednar, F.; Zhang, Y.; Brisset, J.C.; Galban, S.; Galban, C.J.; Rakshit, S.; Flannagan, K.S.; Adsay, N.V.; Pasca di Magliano, M. Oncogenic Kras is required for both the initiation and maintenance of pancreatic cancer in mice. J. Clin. Investig. 2012, 122, 639–653. [Google Scholar] [CrossRef] [PubMed]
  21. Singhi, A.D.; McGrath, K.; Brand, R.E.; Khalid, A.; Zeh, H.J.; Chennat, J.S.; Fasanella, K.E.; Papachristou, G.I.; Slivka, A.; Bartlett, D.L.; et al. Preoperative next-generation sequencing of pancreatic cyst fluid is highly accurate in cyst classification and detection of advanced neoplasia. Gut 2018, 67, 2131–2141. [Google Scholar] [CrossRef] [PubMed]
  22. Witkiewicz, A.K.; McMillan, E.A.; Balaji, U.; Baek, G.; Lin, W.C.; Mansour, J.; Mollaee, M.; Wagner, K.U.; Koduru, P.; Yopp, A.; et al. Whole-exome sequencing of pancreatic cancer defines genetic diversity and therapeutic targets. Nat. Commun. 2015, 6, 6744. [Google Scholar] [CrossRef] [PubMed]
  23. Biankin, A.V.; Waddell, N.; Kassahn, K.S.; Gingras, M.C.; Muthuswamy, L.B.; Johns, A.L.; Miller, D.K.; Wilson, P.J.; Patch, A.M.; Wu, J.; et al. Pancreatic cancer genomes reveal aberrations in axon guidance pathway genes. Nature 2012, 491, 399–405. [Google Scholar] [CrossRef] [PubMed]
  24. Roberts, N.J.; Norris, A.L.; Petersen, G.M.; Bondy, M.L.; Brand, R.; Gallinger, S.; Kurtz, R.C.; Olson, S.H.; Rustgi, A.K.; Schwartz, A.G.; et al. Whole Genome Sequencing Defines the Genetic Heterogeneity of Familial Pancreatic Cancer. Cancer Discov. 2016, 6, 166–175. [Google Scholar] [CrossRef] [PubMed]
  25. Mann, K.M.; Ward, J.M.; Yew, C.C.; Kovochich, A.; Dawson, D.W.; Black, M.A.; Brett, B.T.; Sheetz, T.E.; Dupuy, A.J.; Australian Pancreatic Cancer Genome, I.; et al. Sleeping Beauty mutagenesis reveals cooperating mutations and pathways in pancreatic adenocarcinoma. Proc. Natl. Acad. Sci. USA 2012, 109, 5934–5941. [Google Scholar] [CrossRef] [PubMed]
  26. Krah, N.M.; Narayanan, S.M.; Yugawa, D.E.; Straley, J.A.; Wright, C.V.E.; MacDonald, R.J.; Murtaugh, L.C. Prevention and Reversion of Pancreatic Tumorigenesis through a Differentiation-Based Mechanism. Dev. Cell 2019, 50, 744–754 e744. [Google Scholar] [CrossRef]
  27. Petersen, O.H.; Tepikin, A.V. Polarized calcium signaling in exocrine gland cells. Annu. Rev. Physiol. 2008, 70, 273–299. [Google Scholar] [CrossRef]
  28. Flandez, M.; Cendrowski, J.; Canamero, M.; Salas, A.; del Pozo, N.; Schoonjans, K.; Real, F.X. Nr5a2 heterozygosity sensitises to, and cooperates with, inflammation in KRas(G12V)-driven pancreatic tumourigenesis. Gut 2014, 63, 647–655. [Google Scholar] [CrossRef] [PubMed]
  29. Azevedo-Pouly, A.; Hale, M.A.; Swift, G.H.; Hoang, C.Q.; Deering, T.G.; Xue, J.; Wilkie, T.M.; Murtaugh, L.C.; MacDonald, R.J. Key transcriptional effectors of the pancreatic acinar phenotype and oncogenic transformation. PLoS ONE 2023, 18, e0291512. [Google Scholar] [CrossRef] [PubMed]
  30. Cobo, I.; Iglesias, M.; Flandez, M.; Verbeke, C.; Del Pozo, N.; Llorente, M.; Lawlor, R.; Luchini, C.; Rusev, B.; Scarpa, A.; et al. Epithelial Nr5a2 heterozygosity cooperates with mutant Kras in the development of pancreatic cystic lesions. J. Pathol. 2021, 253, 174–185. [Google Scholar] [CrossRef] [PubMed]
  31. Reichert, M.; Rustgi, A.K. Pancreatic ductal cells in development, regeneration, and neoplasia. J. Clin. Investig. 2011, 121, 4572–4578. [Google Scholar] [CrossRef] [PubMed]
  32. Alonso-Curbelo, D.; Ho, Y.J.; Burdziak, C.; Maag, J.L.V.; Morris, J.P.t.; Chandwani, R.; Chen, H.A.; Tsanov, K.M.; Barriga, F.M.; Luan, W.; et al. A gene-environment-induced epigenetic program initiates tumorigenesis. Nature 2021, 590, 642–648. [Google Scholar] [CrossRef] [PubMed]
  33. Chen, P.; Wang, M.; Wang, C. Qingyihuaji formula reverses gemcitabine resistant human pancreatic cancer through regulate lncRNA AB209630/miR-373/EphB2-NANOG signals. Biosci. Rep. 2019, 39, BSR20190610. [Google Scholar] [CrossRef] [PubMed]
  34. Oweida, A.; Bhatia, S.; Hirsch, K.; Calame, D.; Griego, A.; Keysar, S.; Pitts, T.; Sharma, J.; Eckhardt, G.; Jimeno, A.; et al. Ephrin-B2 overexpression predicts for poor prognosis and response to therapy in solid tumors. Mol. Carcinog. 2017, 56, 1189–1196. [Google Scholar] [CrossRef] [PubMed]
  35. Lu, Z.; Zhang, Y.; Li, Z.; Yu, S.; Zhao, G.; Li, M.; Wang, Z.; Wang, Q.; Yang, Y. Overexpression of the B-type Eph and ephrin genes correlates with progression and pain in human pancreatic cancer. Oncol. Lett. 2012, 3, 1207–1212. [Google Scholar] [CrossRef] [PubMed]
  36. Papadakos, S.P.; Dedes, N.; Gkolemi, N.; Machairas, N.; Theocharis, S. The EPH/Ephrin System in Pancreatic Ductal Adenocarcinoma (PDAC): From Pathogenesis to Treatment. Int. J. Mol. Sci. 2023, 24, 3015. [Google Scholar] [CrossRef] [PubMed]
  37. Yachida, S.; White, C.M.; Naito, Y.; Zhong, Y.; Brosnan, J.A.; Macgregor-Das, A.M.; Morgan, R.A.; Saunders, T.; Laheru, D.A.; Herman, J.M.; et al. Clinical significance of the genetic landscape of pancreatic cancer and implications for identification of potential long-term survivors. Clin. Cancer Res. 2012, 18, 6339–6347. [Google Scholar] [CrossRef] [PubMed]
  38. Xie, Z.; Bailey, A.; Kuleshov, M.V.; Clarke, D.J.B.; Evangelista, J.E.; Jenkins, S.L.; Lachmann, A.; Wojciechowicz, M.L.; Kropiwnicki, E.; Jagodnik, K.M.; et al. Gene Set Knowledge Discovery with Enrichr. Curr. Protoc. 2021, 1, e90. [Google Scholar] [CrossRef] [PubMed]
  39. Jiao, Y.; Li, Y.; Liu, S.; Chen, Q.; Liu, Y. ITGA3 serves as a diagnostic and prognostic biomarker for pancreatic cancer. Onco. Targets Ther. 2019, 12, 4141–4152. [Google Scholar] [CrossRef] [PubMed]
  40. Huang, Y.; Fan, J.; Yang, J.; Zhu, G.Z. Characterization of GPR56 protein and its suppressed expression in human pancreatic cancer cells. Mol. Cell. Biochem. 2008, 308, 133–139. [Google Scholar] [CrossRef] [PubMed]
  41. Navas, C.; Hernandez-Porras, I.; Schuhmacher, A.J.; Sibilia, M.; Guerra, C.; Barbacid, M. EGF receptor signaling is essential for k-ras oncogene-driven pancreatic ductal adenocarcinoma. Cancer Cell 2012, 22, 318–330. [Google Scholar] [CrossRef] [PubMed]
  42. Zhao, S.; Wang, Y.; Cao, L.; Ouellette, M.M.; Freeman, J.W. Expression of oncogenic K-ras and loss of Smad4 cooperate to induce the expression of EGFR and to promote invasion of immortalized human pancreas ductal cells. Int. J. Cancer 2010, 127, 2076–2087. [Google Scholar] [CrossRef] [PubMed]
  43. Ardito, C.M.; Gruner, B.M.; Takeuchi, K.K.; Lubeseder-Martellato, C.; Teichmann, N.; Mazur, P.K.; Delgiorno, K.E.; Carpenter, E.S.; Halbrook, C.J.; Hall, J.C.; et al. EGF receptor is required for KRAS-induced pancreatic tumorigenesis. Cancer Cell 2012, 22, 304–317. [Google Scholar] [CrossRef] [PubMed]
  44. Kanehisa, M.; Furumichi, M.; Sato, Y.; Kawashima, M.; Ishiguro-Watanabe, M. KEGG for taxonomy-based analysis of pathways and genomes. Nucleic Acids Res. 2023, 51, D587–D592. [Google Scholar] [CrossRef] [PubMed]
  45. Agrawal, A.; Balci, H.; Hanspers, K.; Coort, S.L.; Martens, M.; Slenter, D.N.; Ehrhart, F.; Digles, D.; Waagmeester, A.; Wassink, I.; et al. WikiPathways 2024: Next generation pathway database. Nucleic Acids Res. 2024, 52, D679–D689. [Google Scholar] [CrossRef] [PubMed]
  46. Milacic, M.; Beavers, D.; Conley, P.; Gong, C.; Gillespie, M.; Griss, J.; Haw, R.; Jassal, B.; Matthews, L.; May, B.; et al. The Reactome Pathway Knowledgebase 2024. Nucleic Acids Res. 2024, 52, D672–D678. [Google Scholar] [CrossRef] [PubMed]
  47. Subramanian, A.; Tamayo, P.; Mootha, V.K.; Mukherjee, S.; Ebert, B.L.; Gillette, M.A.; Paulovich, A.; Pomeroy, S.L.; Golub, T.R.; Lander, E.S.; et al. Gene set enrichment analysis: A knowledge-based approach for interpreting genome-wide expression profiles. Proc. Natl. Acad. Sci. USA 2005, 102, 15545–15550. [Google Scholar] [CrossRef] [PubMed]
  48. Yu, G.; Wang, L.G.; Yan, G.R.; He, Q.Y. DOSE: An R/Bioconductor package for disease ontology semantic and enrichment analysis. Bioinformatics 2015, 31, 608–609. [Google Scholar] [CrossRef] [PubMed]
Figure 1. PDA cell types identified in early- and late-stage KIC compared to wildtype pancreata. t-distributed stochastic neighbor embedding (tSNE) plot of combined cells in normal pancreas (2354, comprising 8 distinct cell populations pooled from 2 mice), early-stage KIC lesions (3524, 8 cell types pooled from 2 mice), and late-stage KIC tumors (804, 6 cell types pooled from 3 mice). Normal “acinar cells ?” (referred to as “acinar 2” in Figure 2 and Figure 3) express cell stress markers.
Ijms 25 06619 g001
Figure 2. Quantitative dot plots (QDPs) of cell-type distribution and levels of exemplary PDA markers in mice. PDA markers identified by MS in mouse KIC tumors or conditioned media from human PDA cell lines were further characterized by QDP analysis of scRNAseq from PDA tumors in KIC mice at 60 days (Late KIC) or 40 days (Early KIC) or from a normal pancreas at 60 days [8]. Representative differentially expressed genes in KIC tumor cell types compared to normal pancreas were detected in the following: (1) Epithelial cancer cells in early-stage KIC mice; (2) Epithelial cancer cells in late-stage KIC mice; (3) Mesenchymal cancer cells in late-stage KIC mice; (5) Fibroblast classes 1, 2 and/or 3 (F1, F2 or F3) in early- and/or late-stage KIC mice; and (6) Hematopoietic cells (macrophage, T cells, B cells or lymphocytes). (7) Markers were preferentially expressed in many cell types in KIC tumors compared to normal pancreas. Cox coefficients measure the association between mRNA expression level and patient survival outcome (oncolnc.org). The percentage (%) of cells expressed within a given cell type is represented by the size of the dot; an increased color intensity (log2) correlates with a higher level of expression (blue dots, tumor cell types; red dots, normal pancreas cell types).
Ijms 25 06619 g002
Figure 3. Quantitative dot plots (QDPs) of cell-type distribution and levels of exemplary prognostic PDA markers in mice or human PDA cell lines. PDA markers identified by MS in mouse KIC tumors or conditioned media from human PDA cell lines were associated with the following: (A) worse survival prognosis (Cox score ≥ 0.250); or (B) better survival prognosis (Cox score ≤ −0.250) in PAAD (oncolnc.org). Candidate genes were further characterized by QDP analysis of scRNAseq from PDA tumors in KIC mice at 60 days (Late KIC) or 40 days (Early KIC) or normal pancreas at 60 days [8]. Representative differentially expressed genes in KIC tumor cell types compared to normal pancreas were detected in the following: (1) Epithelial cancer cells in early-stage KIC mice; (2) Epithelial cancer cells in late-stage KIC mice; (3) Mesenchymal cancer cells in late-stage KIC; (5) Fibroblast classes 1, 2 and/or 3 (F1, F2 or F3) in early- and/or late-stage KIC; and (6) Hematopoietic cells (macrophage, T cells, B cells or lymphocytes). (7) Markers were preferentially expressed in many cell types in KIC tumors compared to normal pancreas. The percentage (%) of cells within a given cell type is represented by the size of the dot; an increased color intensity is correlated with a higher level of expression (blue dots, tumor cell types; red dots, normal pancreas cell types). (C,D) Cox coefficients are a measure of the association between mRNA expression level and patient survival outcome. Kaplan–Meier curves of patient survival associated with top and bottom quartiles of mRNA expression of (C) Pdcd10 and (D) Pgs1.
Ijms 25 06619 g003
Figure 4. Immunohistochemistry validation of PDA markers in human tumors. Protein expression of JUP, DSG2 and ITGA3 in human normal pancreas (A,D,G) and PDA tumors (B,C,E,F,H,I) corresponded to scRNAseq expression in mouse normal pancreas and KIC tumor (Panel A, Scale bar is 250 μm; panels AI are 10× magnification). Pancreatic islets express JUP protein (Panel A, inset) and mRNA (see Figure 3). Human normal tissue and PDA tumor samples provided by the UT Southwestern Cancer Center patient procurement lab.
Ijms 25 06619 g004
Table 1. Cell-type expression of differentially expressed genes in KIC neoplasia.
Supplementary Table S1Query aTotal
Genes #
KIC Cell Type Classification
E.epiEL.epiEL.epi + mesL.epiL.e + mL.mesEL.fibEL.hEL.all
11 + 21 + 2 + 322 + 33567
ST1_1CNvEvL unsup5037349129856747233
ST1_2DmMS53240552530nd
ST1_2EmsMS2094953761101073nd
ST1_2FhMS18741573457171637nd
ST1_3GRas Path1970732565181862nd
ST1_3HMutant cBP1602037400nd
ST1_3IAMP cBP1304104400nd
ST1_3JDel cBP1714114600nd
ST1_3KSB1701249001nd
ST1_3LTempus + FM19112616475023928nd
ST1_3MKEGG cancer660015339414nd
ST1_3NCa2+ Path138153245419824nd
ST1_3OCaer Up721739262515nd
ST1_3PCaer Down401001101nd
ST1_3Qko dTF Up1545206254015538nd
ST1_3Rko dTF Down88465122310820nd
ST1_3SInnate Imm46210835522nd
ST1_3TITGA3-Gpr561281512054141419nd
ST1_4UCox Hi_50020204221536311102
ST1_4WCox Lo_5001910301321347140
ST1_YPanc CT_ID4101200041222
Candidate gene signature type identified in early- and/or late-stage KIC scRNAseq samples. Total gene # differentially expressed in PDA. a see Supplementary Table S1 for the list of gene names in each search query. nd, not determined. KIC cell-type classification defined in Figure 1 and Supplementary Figure S1: E: early-stage KIC. L: late-stage KIC. E.epi (cell type 1): early KIC epithelial cancer. EL.epi (cell types 1 + 2): early- and late-stage KIC epithelial cancer. EL.epi + mes (cell types 1 + 2 + 3): early- and late-stage KIC epithelial and late-stage mesenchymal cancer. L.epi (cell type 2): late-stage KIC epithelial cancer. L.epi + mes (L.e+m; cell types 2 + 3): late-stage KIC epithelial and mesenchymal cancer. L.mes (cell type 3): late-stage KIC mesenchymal cancer. EL.fib (cell type 5): early- and/or late-stage KIC tumor fibroblasts. EL.h (cell type 6): early- and/or late-stage KIC tumor hematopoietic cells (macrophages or lymphocytes). EL.all (7): genes broadly expressed in early- and/or late-stage KIC cancer and stromal cell types 1–6. a Gene signature type: NvEvL unsup, unsupervised screening of scRNAseq of normal pancreas vs. early-stage KIC and late-stage KIC; mMS, mouse KIC PDA mass spec; msMS, mouse KIC PDA mass spec predicted secreted proteins; hMS, mass spec of conditioned media from human PDA cell lines; Ras Path, non-redundant genes in KEGG pathways containing Kras; Mutant cBP, missense mutations in cancer cBioPortal (top 25); AMP cBP, gene amplification in cancer cBioPortal (top 25); Del cBP, gene deletions in cancer cBioPortal (top 25); SB, Sleeping Beauty mutagenesis in mouse PDA (top 25); Tempus + FM, Tempus and Foundation Medicine mutant genes in cancer; KEGG cancer, mutant genes in cancer pathways; Ca2+ Path, calcium signaling pathway genes; Caer Up, elevated differential gene expression in pancreas of normal mice treated with caerulein; Caer Down, decreased differential gene expression in pancreas of normal mice treated with caerulein; ko dTF Up, elevated differential gene expression in pancreas of transcription factor (dTF, Ptf1a or Nr5a2) knockouts; ko dTF Down, decreased differential gene expression in pancreas of transcription factor (dTF, Ptf1a or Nr5a2) knockouts; Innate Imm, immune and NFkB signaling pathway genes; ITGA3-Gpr56, ITGA3 and Gpr56 STRING interactome genes; Cox Hi, top 500 genes associated with worse survival in human PDA patients (Cox coefficient, PAAD, oncolnc.org); Cox Lo, bottom 500 genes associated with better survival in human PDA patients (Cox coefficient, PAAD, oncolnc.org); Panc CT_ID, cell-type identifier genes with cell-type-specific expression in normal mouse pancreas or PDA tumors in KIC mice.
Disclaimer/Publisher’s Note: The statements, opinions and data contained in all publications are solely those of the individual author(s) and contributor(s) and not of MDPI and/or the editor(s). MDPI and/or the editor(s) disclaim responsibility for any injury to people or property resulting from any ideas, methods, instructions or products referred to in the content.

