
Assessment of Total Antioxidant Capacity, 8-Hydroxy-2′-deoxy-guanosine, the Genetic Landscape, and Their Associations in BCR::ABL-1-Negative Chronic and Blast Phase Myeloproliferative Neoplasms

 ,
, 

 ,
,  ,
,  , , and
Abstract
1. Introduction
2. Results
3. Discussion
4. Materials and Methods
5. Conclusions
Author Contributions
Funding
Institutional Review Board Statement
Informed Consent Statement
Data Availability Statement
Acknowledgments
Conflicts of Interest
Abbreviations
References
- Thiele, J.; Kvasnicka, H.M.; Orazi, A.; Gianelli, U.; Gangat, N.; Vannucchi, A.M.; Barbui, T.; Arber, D.A.; Tefferi, A. The international consensus classification of myeloid neoplasms and acute Leukemias: Myeloproliferative neoplasms. Am. J. Hematol. 2023, 98, 166–179, Erratum in Am. J. Hematol. 2023, 98, 544–545. [Google Scholar] [CrossRef] [PubMed]
- Luque Paz, D.; Kralovics, R.; Skoda, R.C. Genetic basis and molecular profiling in myeloproliferative neoplasms. Blood 2023, 141, 1909–1921. [Google Scholar] [CrossRef] [PubMed] [PubMed Central]
- Genovese, E.; Mirabile, M.; Rontauroli, S.; Sartini, S.; Fantini, S.; Tavernari, L.; Maccaferri, M.; Guglielmelli, P.; Bianchi, E.; Parenti, S.; et al. The Response to Oxidative Damage Correlates with Driver Mutations and Clinical Outcome in Patients with Myelofibrosis. Antioxidants 2022, 11, 113. [Google Scholar] [CrossRef] [PubMed] [PubMed Central]
- Constantinescu, S.N.; Vainchenker, W.; Levy, G.; Papadopoulos, N. Functional Consequences of Mutations in Myeloproliferative Neoplasms. Hemasphere 2021, 5, e578. [Google Scholar] [CrossRef] [PubMed] [PubMed Central]
- Tefferi, A.; Alkhateeb, H.; Gangat, N. Blast phase myeloproliferative neoplasm: Contemporary review and 2024 treatment algorithm. Blood Cancer J. 2023, 13, 108. [Google Scholar] [CrossRef] [PubMed] [PubMed Central]
- Baumeister, J.; Chatain, N.; Sofias, A.M.; Lammers, T.; Koschmieder, S. Progression of Myeloproliferative Neoplasms (MPN): Diagnostic and Therapeutic Perspectives. Cells 2021, 10, 3551. [Google Scholar] [CrossRef] [PubMed] [PubMed Central]
- Easwar, A.; Siddon, A.J. Genetic Landscape of Myeloproliferative Neoplasms with an Emphasis on Molecular Diagnostic Laboratory Testing. Life 2021, 11, 1158. [Google Scholar] [CrossRef] [PubMed] [PubMed Central]
- Hasselbalch, H.C. Chronic inflammation as a promotor of mutagenesis in essential thrombocythemia, polycythemia vera and myelofibrosis. A human inflammation model for cancer development? Leuk. Res. 2013, 37, 214–220. [Google Scholar] [CrossRef] [PubMed]
- Allahverdi, N.; Yassin, M.; Ibrahim, M. Environmental Factors, Lifestyle Risk Factors, and Host Characteristics Associated with Philadelphia Negative Myeloproliferative Neoplasm: A Systematic Review. Cancer Control 2021, 28, 10732748211046802. [Google Scholar] [CrossRef] [PubMed] [PubMed Central]
- Allegra, A.; Pioggia, G.; Tonacci, A.; Casciaro, M.; Musolino, C.; Gangemi, S. Synergic Crosstalk between Inflammation, Oxidative Stress, and Genomic Alterations in BCR-ABL-Negative Myeloproliferative Neoplasm. Antioxidants 2020, 9, 1037. [Google Scholar] [CrossRef] [PubMed] [PubMed Central]
- Bjørn, M.E.; Hasselbalch, H.C. The Role of Reactive Oxygen Species in Myelofibrosis and Related Neoplasms. Mediat. Inflamm. 2015, 2015, 648090. [Google Scholar] [CrossRef] [PubMed] [PubMed Central]
- Găman, M.-A.; Kipkorir, V.; Srichawla, B.S.; Dhali, A.; Găman, A.M.; Diaconu, C.C. Primary Arterial Hypertension and Drug-Induced Hypertension in Philadelphia-Negative Classical Myeloproliferative Neoplasms: A Systematic Review. Biomedicines 2023, 11, 388. [Google Scholar] [CrossRef] [PubMed] [PubMed Central]
- Durmus, A.; Mentese, A.; Yilmaz, M.; Sumer, A.; Akalin, I.; Topal, C.; Alver, A. The thrombotic events in polycythemia vera patients may be related to increased oxidative stress. Med. Princ. Pract. 2014, 23, 253–258. [Google Scholar] [CrossRef] [PubMed] [PubMed Central]
- Chen, Y.; Li, J.; Xu, L.; Găman, M.A.; Zou, Z. The genesis and evolution of acute myeloid leukemia stem cells in the microenvironment: From biology to therapeutic targeting. Cell Death Discov. 2022, 8, 397. [Google Scholar] [CrossRef] [PubMed] [PubMed Central]
- Arber, D.A.; Orazi, A.; Hasserjian, R.; Thiele, J.; Borowitz, M.J.; Le Beau, M.M.; Bloomfield, C.D.; Cazzola, M.; Vardiman, J.W. The 2016 revision to the World Health Organization classification of myeloid neoplasms and acute leukemia. Blood 2016, 127, 2391–2405. [Google Scholar] [CrossRef] [PubMed]
- Mangione, R.; Giallongo, C.; Duminuco, A.; La Spina, E.; Longhitano, L.; Giallongo, S.; Tibullo, D.; Lazzarino, G.; Saab, M.W.; Sbriglione, A.; et al. Targeted Metabolomics Highlights Dramatic Antioxidant Depletion, Increased Oxidative/Nitrosative Stress and Altered Purine and Pyrimidine Concentrations in Serum of Primary Myelofibrosis Patients. Antioxidants 2024, 13, 490. [Google Scholar] [CrossRef] [PubMed] [PubMed Central]
- Koyuncu, M.B.; Ilgan, M.; Basir, H.; Tombak, A.; Ucar, M.A.; Koseci, T.; Akdeniz, A.; Tiftik, E.N.; Erel, Ö. Ruxolitinib Reduces Oxidative Stress in Patients with Primary Myelofibrosis: A Multicenter Study. Cureus 2022, 14, e20929. [Google Scholar] [CrossRef] [PubMed] [PubMed Central]
- Skov, V.; Thomassen, M.; Kjær, L.; Ellervik, C.; Larsen, M.K.; Knudsen, T.A.; Kruse, T.A.; Hasselbalch, H.C. Interferon-alpha2 treatment of patients with polycythemia vera and related neoplasms favorably impacts deregulation of oxidative stress genes and antioxidative defense mechanisms. PLoS ONE 2022, 17, e0270669. [Google Scholar] [CrossRef] [PubMed] [PubMed Central]
- Djikic, D.; Markovic, D.; Bogdanovic, A.; Mitrovic-Ajtic, O.; Suboticki, T.; Diklic, M.; Beleslin-Cokic, B.; Bjelica, S.; Kovacic, M.; P Cokic, V. Oxidative and nitrosative stress in myeloproliferative neoplasms: The impact on the AKT/mTOR signaling pathway. J. BUON 2018, 23, 1481–1491. [Google Scholar] [PubMed]
- Durmus, A.; Mentese, A.; Yilmaz, M.; Sumer, A.; Akalin, I.; Topal, C.; Alver, A. Increased oxidative stress in patients with essential thrombocythemia. Eur. Rev. Med. Pharmacol. Sci. 2013, 17, 2860–2866. [Google Scholar] [PubMed]
- Iurlo, A.; De Giuseppe, R.; Sciumè, M.; Cattaneo, D.; Fermo, E.; De Vita, C.; Consonni, D.; Maiavacca, R.; Bamonti, F.; Gianelli, U.; et al. Oxidative status in treatment-naïve essential thrombocythemia: A pilot study in a single center. Hematol. Oncol. 2017, 35, 335–340. [Google Scholar] [CrossRef] [PubMed]
- Vener, C.; Novembrino, C.; Catena, F.B.; Fracchiolla, N.S.; Gianelli, U.; Savi, F.; Radaelli, F.; Fermo, E.; Cortelezzi, A.; Lonati, S.; et al. Oxidative stress is increased in primary and post-polycythemia vera myelofibrosis. Exp. Hematol. 2010, 38, 1058–1065. [Google Scholar] [CrossRef] [PubMed]
- Salati, S.; Genovese, E.; Carretta, C.; Zini, R.; Bartalucci, N.; Prudente, Z.; Pennucci, V.; Ruberti, S.; Rossi, C.; Rontauroli, S.; et al. Calreticulin Ins5 and Del52 mutations impair unfolded protein and oxidative stress responses in K562 cells expressing CALR mutants. Sci. Rep. 2019, 9, 10558. [Google Scholar] [CrossRef] [PubMed] [PubMed Central]
- Bjørn, M.E.; Brimnes, M.K.; Gudbrandsdottir, S.; Andersen, C.L.; Poulsen, H.E.; Henriksen, T.; Hasselbalch, H.C.; Nielsen, C.H. Ruxolitinib treatment reduces monocytic superoxide radical formation without affecting hydrogen peroxide formation or systemic oxidative nucleoside damage in myelofibrosis. Leuk. Lymphoma 2019, 60, 2549–2557. [Google Scholar] [CrossRef] [PubMed]
- Hasselbalch, H.C.; Thomassen, M.; Riley, C.H.; Kjær, L.; Larsen, T.S.; Jensen, M.K.; Bjerrum, O.W.; Kruse, T.A.; Skov, V. Whole blood transcriptional profiling reveals deregulation of oxidative and antioxidative defence genes in myelofibrosis and related neoplasms. Potential implications of downregulation of Nrf2 for genomic instability and disease progression. PLoS ONE 2014, 9, e112786, Erratum in PLoS ONE 2015, 10, e0118049. [Google Scholar] [CrossRef] [PubMed] [PubMed Central]
- Sørensen, A.L.; Hasselbalch, H.C.; Bjørn, M.E.; Nielsen, C.H.; Cordua, S.; Skov, V.; Kjær, L.; Poulsen, H.E.; Ellervik, C. Elevated levels of oxidized nucleosides in individuals with the JAK2V617F mutation from a general population study. Redox Biol. 2021, 41, 101895. [Google Scholar] [CrossRef] [PubMed] [PubMed Central]
- Gonçalves, A.C.; Alves, R.; Baldeiras, I.; Marques, B.; Oliveiros, B.; Pereira, A.; Nascimento Costa, J.M.; Cortesão, E.; Mota Vieira, L.; Sarmento Ribeiro, A.B. DNA Methylation Is Correlated with Oxidative Stress in Myelodysplastic Syndrome-Relevance as Complementary Prognostic Biomarkers. Cancers 2021, 13, 3138. [Google Scholar] [CrossRef] [PubMed] [PubMed Central]
- Chen, Y.; Zou, Z.; Găman, M.A.; Xu, L.; Li, J. NADPH oxidase mediated oxidative stress signaling in FLT3-ITD acute myeloid leukemia. Cell Death Discov. 2023, 9, 208. [Google Scholar] [CrossRef] [PubMed] [PubMed Central]
- Fan, C.; Yang, X.; Yan, L.; Shi, Z. Oxidative stress is two-sided in the treatment of acute myeloid leukemia. Cancer Med. 2024, 13, e6806. [Google Scholar] [CrossRef] [PubMed] [PubMed Central]
- Czubak-Prowizor, K.; Trelinski, J.; Stelmach, P.; Stelmach, P.; Madon, A.; Zbikowska, H.M. Increased Oxidative Stress in Acute Myeloid Leukemia Patients after Red Blood Cell Transfusion, but Not Platelet Transfusion, Results Mainly from the Oxidative/Nitrative Protein Damage: An Exploratory Study. J. Clin. Med. 2021, 10, 1349. [Google Scholar] [CrossRef] [PubMed] [PubMed Central]
- Preston, K.; Harm, S.; Dreyfus, N.; Villalba, N.; Freeman, K. Packed Red Blood Cells Accumulate Oxidative Stress with Increased Storage Duration. Shock 2017, 48, 270–271. [Google Scholar] [CrossRef] [PubMed] [PubMed Central]
- Kim, C.H.; Leitch, H.A. Iron overload-induced oxidative stress in myelodysplastic syndromes and its cellular sequelae. Crit. Rev. Oncol. Hematol. 2021, 163, 103367. [Google Scholar] [CrossRef] [PubMed]
- Marković, D.C.; Maslovarić, I.S.; Kovačić, M.; Vignjević Petrinović, S.; Ilić, V.L. Putative Role of Neutrophil Extracellular Trap Formation in Chronic Myeloproliferative Neoplasms. Int. J. Mol. Sci. 2023, 24, 4497. [Google Scholar] [CrossRef] [PubMed] [PubMed Central]
- Đikić, D.; Bogdanović, A.; Marković, D.; Mitrović-Ajtić, O.; Subotički, T.; Diklić, M.; Vukotić, M.; Dragojević, T.; Živković, E.; Santibanez, J.F.; et al. Inflammation Promotes Oxidative and Nitrosative Stress in Chronic Myelogenous Leukemia. Biomolecules 2022, 12, 247. [Google Scholar] [CrossRef] [PubMed] [PubMed Central]

| Characteristics | Controls | MPNs | PV | ET | MF | sAML |
|---|---|---|---|---|---|---|
| Patients [number] | 14 | 117 | 29 | 40 | 48 | 21 |
| Age [years] | 55.00 ± 10.00 | 57.92 ± 15.31 | 55.10 ± 16.37 | 55.23 ± 16.68 | 61.85 ± 12.70 | 61.76 ± 8.77 |
| Sex [female, %] | 58.00% | 58.12% | 51.72% | 75.00% | 47.92% | 47.62% |
| Leukocytes × 109/L | 4.5–9 | 14.23 ± 9.82 | 16.96 ± 16.21 | 14.70 ± 8.41 | 10.08 ± 5.96 | 48.88 ± 95.46 |
| Hemoglobin [g/dL] | 12–13 | 12.09 ± 3.51 | 14.83 ± 2.02 | 12.72 ± 3.57 | 11.65 ± 3.58 | 14.83 ± 2.02 |
| Platelets × 109/L | 150–400 | 634.9 ± 567.0 | 659.3 ± 471.2 | 735.6 ± 725.8 | 545.5 ± 465.3 | 761.2 ± 377.7 |
| JAK2V617F [%] | 0.00% | 71.80% | 100.0% | 65.00% | 60.42% | 52.38% |
| CALR type 1/2 [%] | 0.00% | 17.95% | 0.00% | 22.50% | 25.00% | 19.05% |
| MPL W515L [%] | 0.00% | 6.84% | 0.00% | 7.50% | 2.08% | 0.00% |
| Triple-negative [%] | 0.00% | 3.41% | 0.00% | 5.00% | 12.50% | 28.57% |
| No previous MPN treatment [%] | 0.00% | 88.03% | 96.55% | 90.00% | 81.25% | 61.90% |
| History of thrombosis [%] | 0.00% | 4.27% | 5.00% | 0.00% | 4.17% | 9.52% |
| Cardiometabolic risk factors [%] | 0.00% | 8.55% | 10.34% | 5.00% | 8.33% | 23.81% |
| Characteristics | MF (prePMF + PMF) | prePMF | PMF |
|---|---|---|---|
| Patients [number] | 48 | 12 | 36 |
| Age [years] | 61.85 ± 12.70 | 54.50 ± 15.80 | 64.31 ± 10.65 |
| Sex [female, %] | 47.92% | 50.00% | 47.22% |
| Leukocytes × 109/L | 10.08 ± 5.96 | 8.15 ± 3.99 | 10.75 ± 6.42 |
| Hemoglobin [g/dL] | 11.65 ± 3.58 | 10.76 ± 2.84 | 11.95 ± 3.80 |
| Platelets × 109/L | 545.5 ± 465.3 | 639.1 ± 609.5 | 512.3 ± 409.5 |
| JAK2V617F [%] | 60.42% | 50.00% | 63.89% |
| CALR type 1/2 [%] | 25.00% | 33.33% | 22.22% |
| MPL W515L [%] | 2.08% | 0.00% | 2.78% |
| Triple-negative [%] | 12.50% | 16.67% | 11.11% |
| No previous MPN treatment [%] | 81.25% | 91.67% | 77.78% |
| History of thrombosis [%] | 4.17% | 8.33% | 2.77% |
| Cardiometabolic risk factors [%] | 8.33% | 25.00% | 2.78% |
| Diagnosis | Obs. | OS Evaluation | Main Results of Genetic Testing |
|---|---|---|---|
| PV | 33 years Male Previous treatment: none | TAC 6.14 8-OHdG 0.57 | Driver mutation: JAK2 V617F 88% TP53 c.388C>T, p.(L130F), 35%, loss of function, COSM11449 BCOR c.4938_4939delCT, p.(L1647fs*4), 42%, loss of function, likely pathogenic, unreported |
| PV | 65 years Female Previous treatment: none | TAC 5.15 8-OHdG 0.51 | Driver mutation: JAK2 V617F Targeted NGS: negative for other mutations |
| prePMF | 26 years Female Previous treatment: none | TAC 4.87 8-OHdG 0.58 | Driver mutation: triple-negative NF1 c.1792A>C (K598Q), 30%, missense, probably damaging |
| PMF | 48 years Female Previous treatment: RUX | TAC 5.29 8-OHdG 0.58 | Driver mutation: JAK2 V617F 92.8% TET2 c.593dupT, 33.5%, rs748109142, unknown significance ASXL1 c.1934dupG (p.G646Wfs*12), 32.1%, COSM1411076 |
| PMF | 51 years Female Previous treatment: ANA | TAC 4.99 8-OHdG 0.50 | Driver mutation: CALR type 2 CALR c.1154_1155ins TTGTC 45.2% TET2 c.4354C>T p.R1452* (nonsense) 21% COSM41706 |
| PMF | 68 years Female Previous treatment: none | TAC 7.00 8-OHdG 16.35 | Driver mutation: CALR type 1 NRAS c.190T>G (p.Y64D) 44.8%, COSM1666991 PTNP11 c.1516T>A (p.S502T) 21.4%, COSM14258 |
sAML Provenance: PMF | 72 years Female Previous treatment: HU | TAC 6.65 8-OHdG 0.94 | Driver mutation: JAK2 V617F (DNA from CD34+ cells: 6% and DNA from CD3+ cells: 2.5%) TET2 c.1648C>T, p.R550*, COSM41644 (DNA from CD34+ cells: 48.6% and DNA from CD3+ cells: 37.8%) ASXL1 c.2066C>G, p.S689*, COSM133037 (DNA from CD34+ cells: 43% and DNA from CD3+ cells: 35.4%) STAG2 c.1840C>T, p.R614*, COSM166815 (DNA from CD34+ cells: 40.9% and DNA from CD3+ cells: 33.9%) TET2 c.5611_5618delATTCTCAT, p.I1871Ter, unreported (DNA from CD34+ cells: 36.8% and DNA from CD3+ cells: 36.5%) IDH2, c.419G>A, p.R140Q, COSM41590 (DNA from CD34+ cells: 27.2% and DNA from CD3+ cells: 19.70%) |
| sAML Provenance: ET | 76 years Female Previous treatment: HU | TAC 5.44 8-OHdG 0.52 | Driver mutation: JAK2 V617F 78.9% DNMT3A c.2322 + 1G>A and p.? splice-site mutation pathogenic 43% |
| sAML Provenance: PMF | 51 years Female Previous treatment: AZA | TAC 6.47 8-OHdG 0.52 | Driver mutation: JAK2 V617F (DNA from CD34+ cells: 72% and DNA from CD3+ cells: 10%) TP53 c.537T>A, p.179Q, missense, COSV52669519 (DNA from CD34+ cells: 100% and DNA from CD3+ cells: 35%) SRSF2 c.284C>T, p.P95L, missense, COSV57969830 (DNA from CD34+ cells: 49% and DNA from CD3+ cells: 12%) |
| sAML Provenance: PMF | 54 years Female Previous treatment: ANA | TAC 6.82 8-OHdG 0.52 | Driver mutations: CALR type 1 FLT3 57.2% (unknown clinical significance and extremely rare in the general population) ASXL1 c.2476_2485 dupGGAACTGGCC 28.2%, unreported |
| sAML Provenance: PMF | 56 years Male Previous treatment: HU | TAC 5.75 8-OHdG 0.49 | Driver mutation: triple-negative ASXL1 c.1888_1910del23 (p.E635fs*15) 73.7% COSM36165 TP53 c.395A>G (p.K132R) 66.3% COSM308311 EZH2 c.1979G>A (p.G660E) 39.5% (unreported in COSMIC and deleterious/probably damaging) |
| sAML Provenance: PMF | 50 years Female Previous treatment: RUX | TAC 5.53 8-OHdG 0.51 | Driver mutation: JAK2 V617F TET2 c.1088C>T (p.P363L) 48.4%, and COSM5020142 (germline and clinical significance not provided) KIT c.1621A>C (p.M541L), 52.1%, COSM28026 |
| sAML Provenance: PMF | 69 years Female Previous treatment: none | TAC 4.90 8-OHdG 0.51 | Driver mutation: CALR type 1 51% NRAS c.190T>G, p.Y64D, (DNA from CD34+ cells: 90.9% and DNA from CD3+ cells: 49%—germline) NRAS c.35G>A, p.G12D, 43%, COSM564 SNP array: del7q22.1, del8q11.1-q11.21, del10p12.1-p11.22, del11p14.1-p11.2, and delXp11.4 UPD1p |
| sAML Provenance: PMF | 63 years Male Previous treatment: AZA | TAC 6.45 8-OHdG 0.51 | Driver mutation: JAK2 V617F (DNA from CD34+ cells: 95.1% and DNA from CD3+ cells: 17.8%) RUNX1 c.364_365insAA, frameshift, p.Gly122fsTer12 (DNA from CD34+ cells: 60.9% and DNA from CD3+ cells: 14.8%) CSF3R c.2492C>T p.A831V (unreported) (DNA from CD34+ cells: 47.4%) IDH1 c.395G>A, p.R132H, COSM28746 (DNA from CD34+ cells: 34.4% and DNA from CD3+ cells: 5.00%) PHF6 c.385C>T, p.R129*, COSM4606367 (DNA from CD34+ cells: 6.00%) |
| sAML Provenance: PMF | 57 years Female Previous treatment: none | TAC 6.37 8-OHdG 0.52 | Driver mutation: triple-negative sAML: FLT3-ITD |
| sAML Provenance: PMF | 57 years Male Previous treatment: none | TAC 5.27 8-OHdG 0.52 | Driver mutation: CALR type 1 58.1% SNP array: UPD11q Targeted NGS: DNA from PBMC ASXL1 c.1773C>A, p.Y591*, 49.3%, COSM1681609 CBL c.1111T>A, p.Y371N, 93.1%, COSM5031014 DNA from granulocytes ASXL1 c.1773C>A, p.Y591*, 43.9%, COSM1681609 CBL c.1111T>A, p.Y371N, 98%, COSM5031014 WES: DNA from PBMC CALR del52 39% ASXL1 c.1773C>A, p.Y591*, 49%, COSM1681609 CBL c.1111T>A (p.Y371N), 96%, COSM5031014 NBN c.511A>G, p.I171V, missense, unknown significance, 55% STAT5A c.2118dupT, p.V707fs, 56% |
| Subgroup | TAC [Trolox Equivalents] | 8-OHdG [ng/mL] |
|---|---|---|
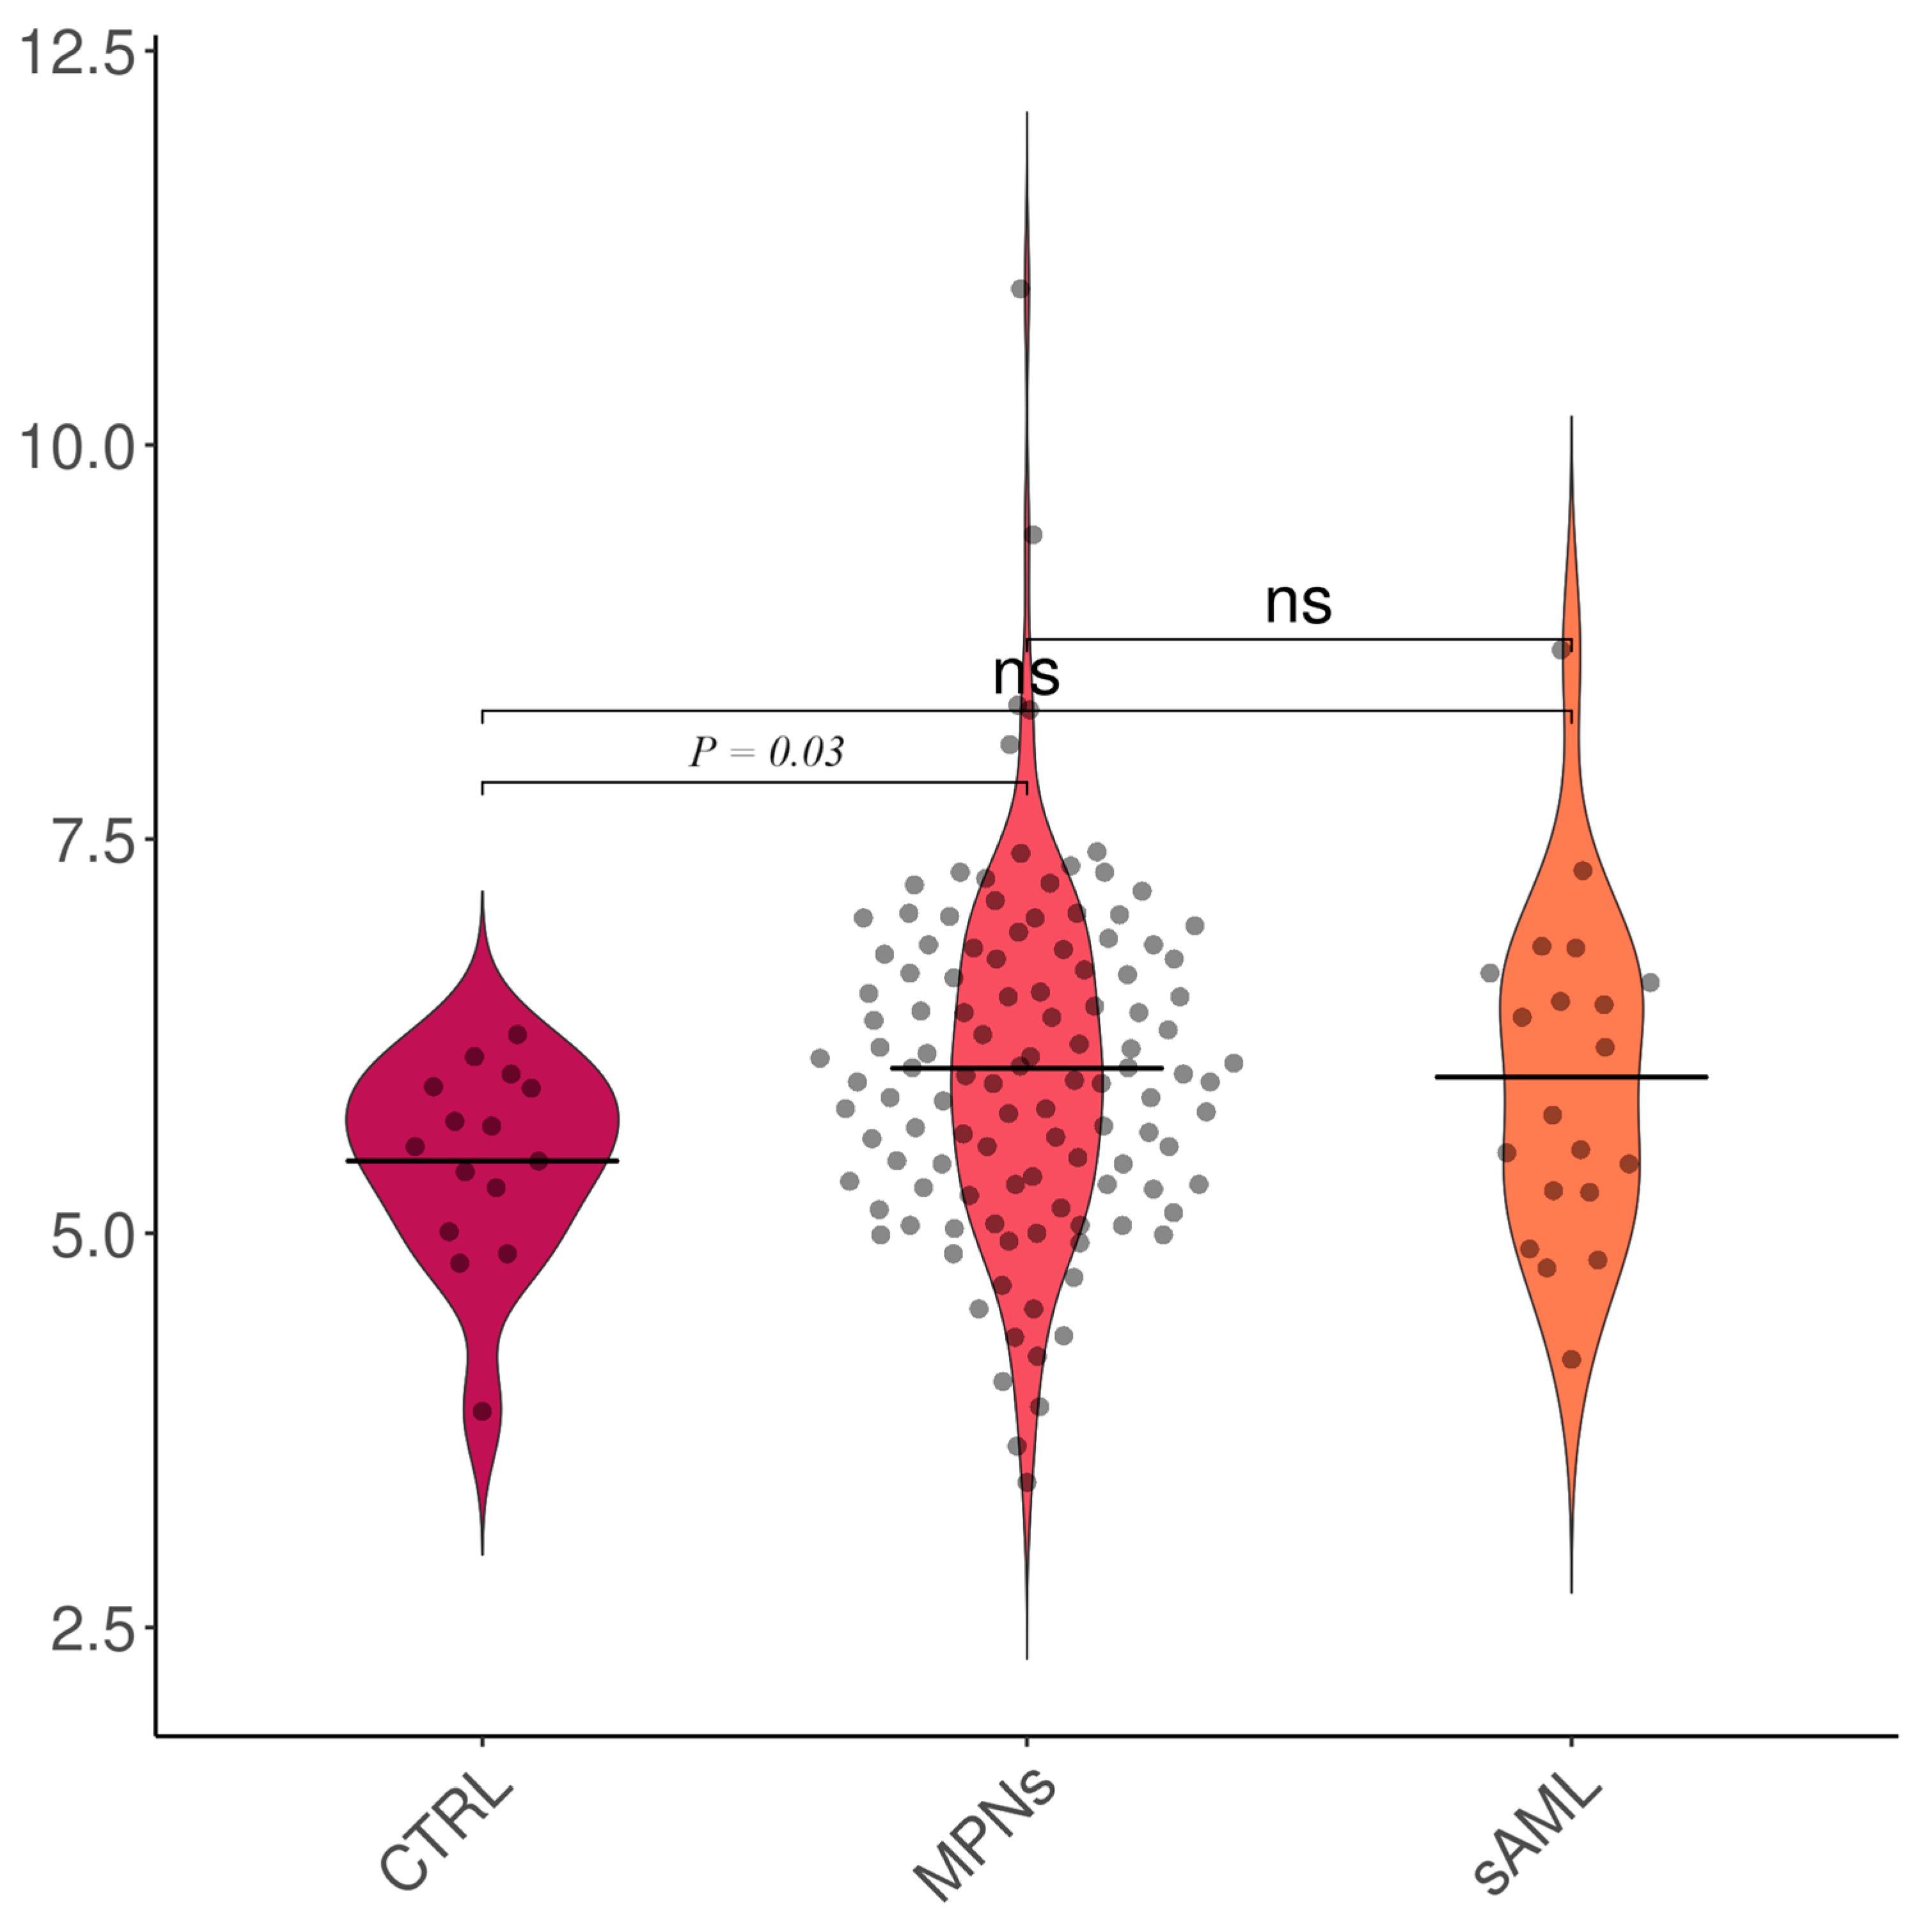
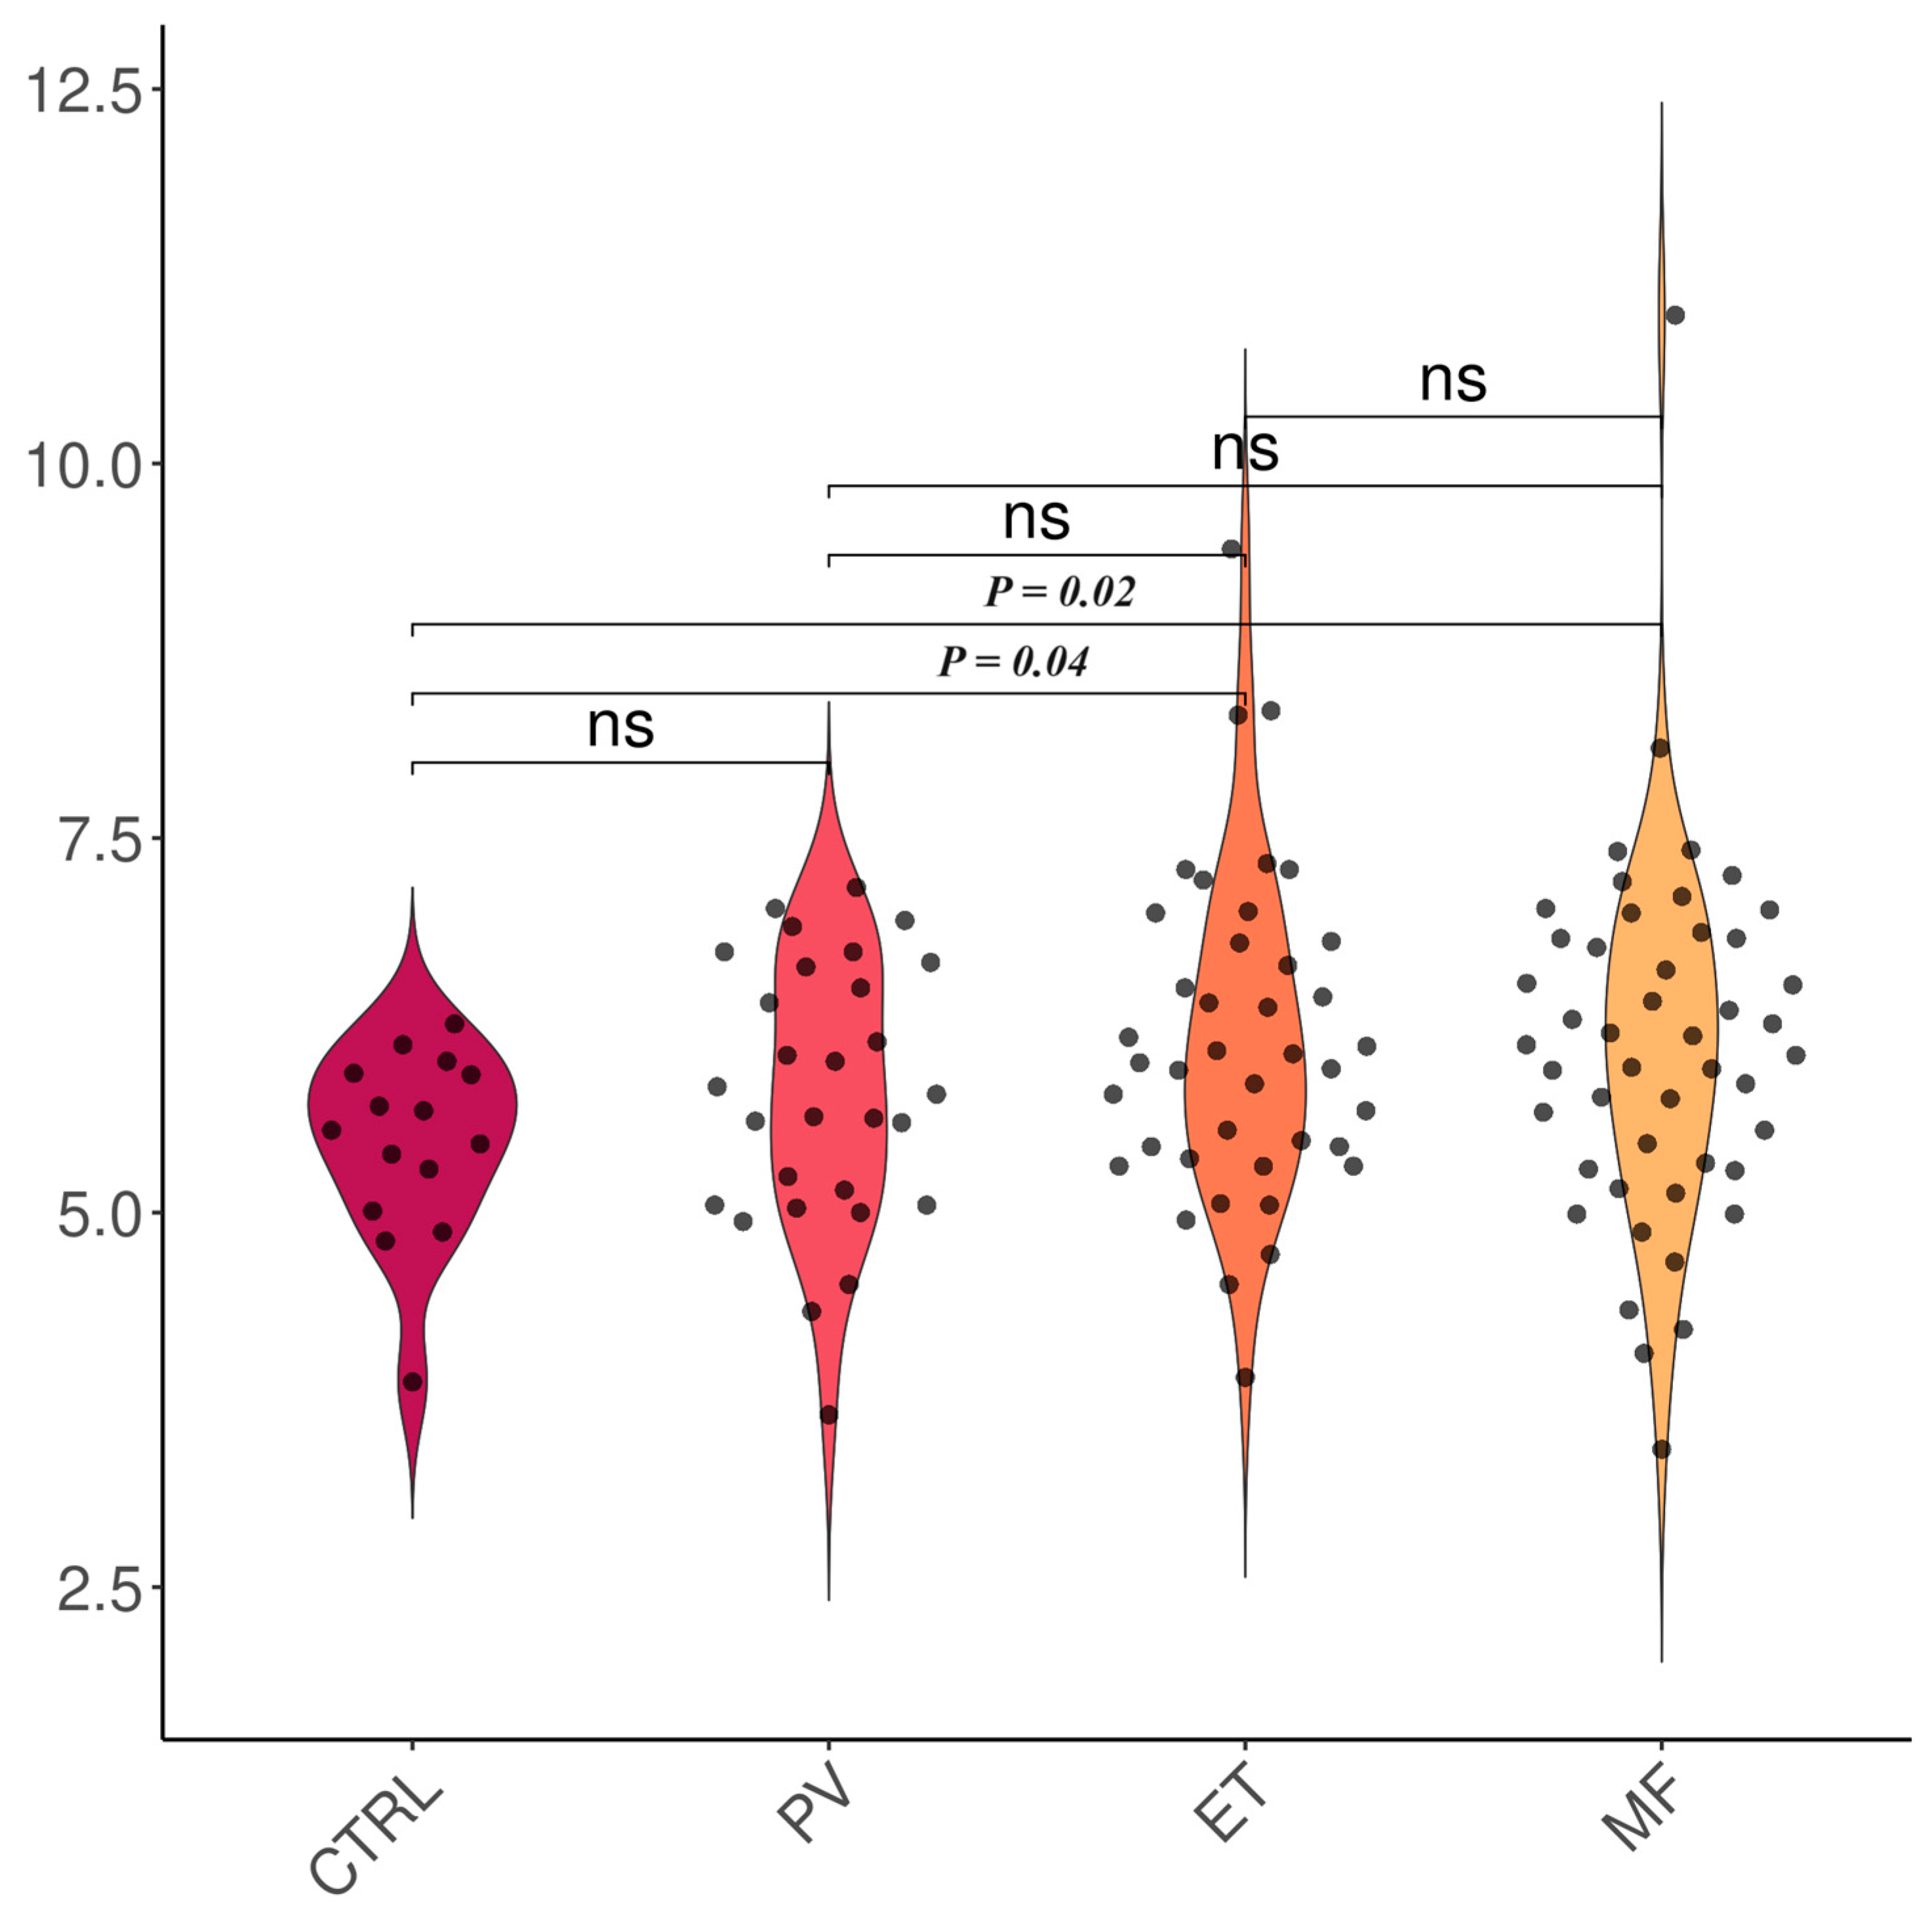
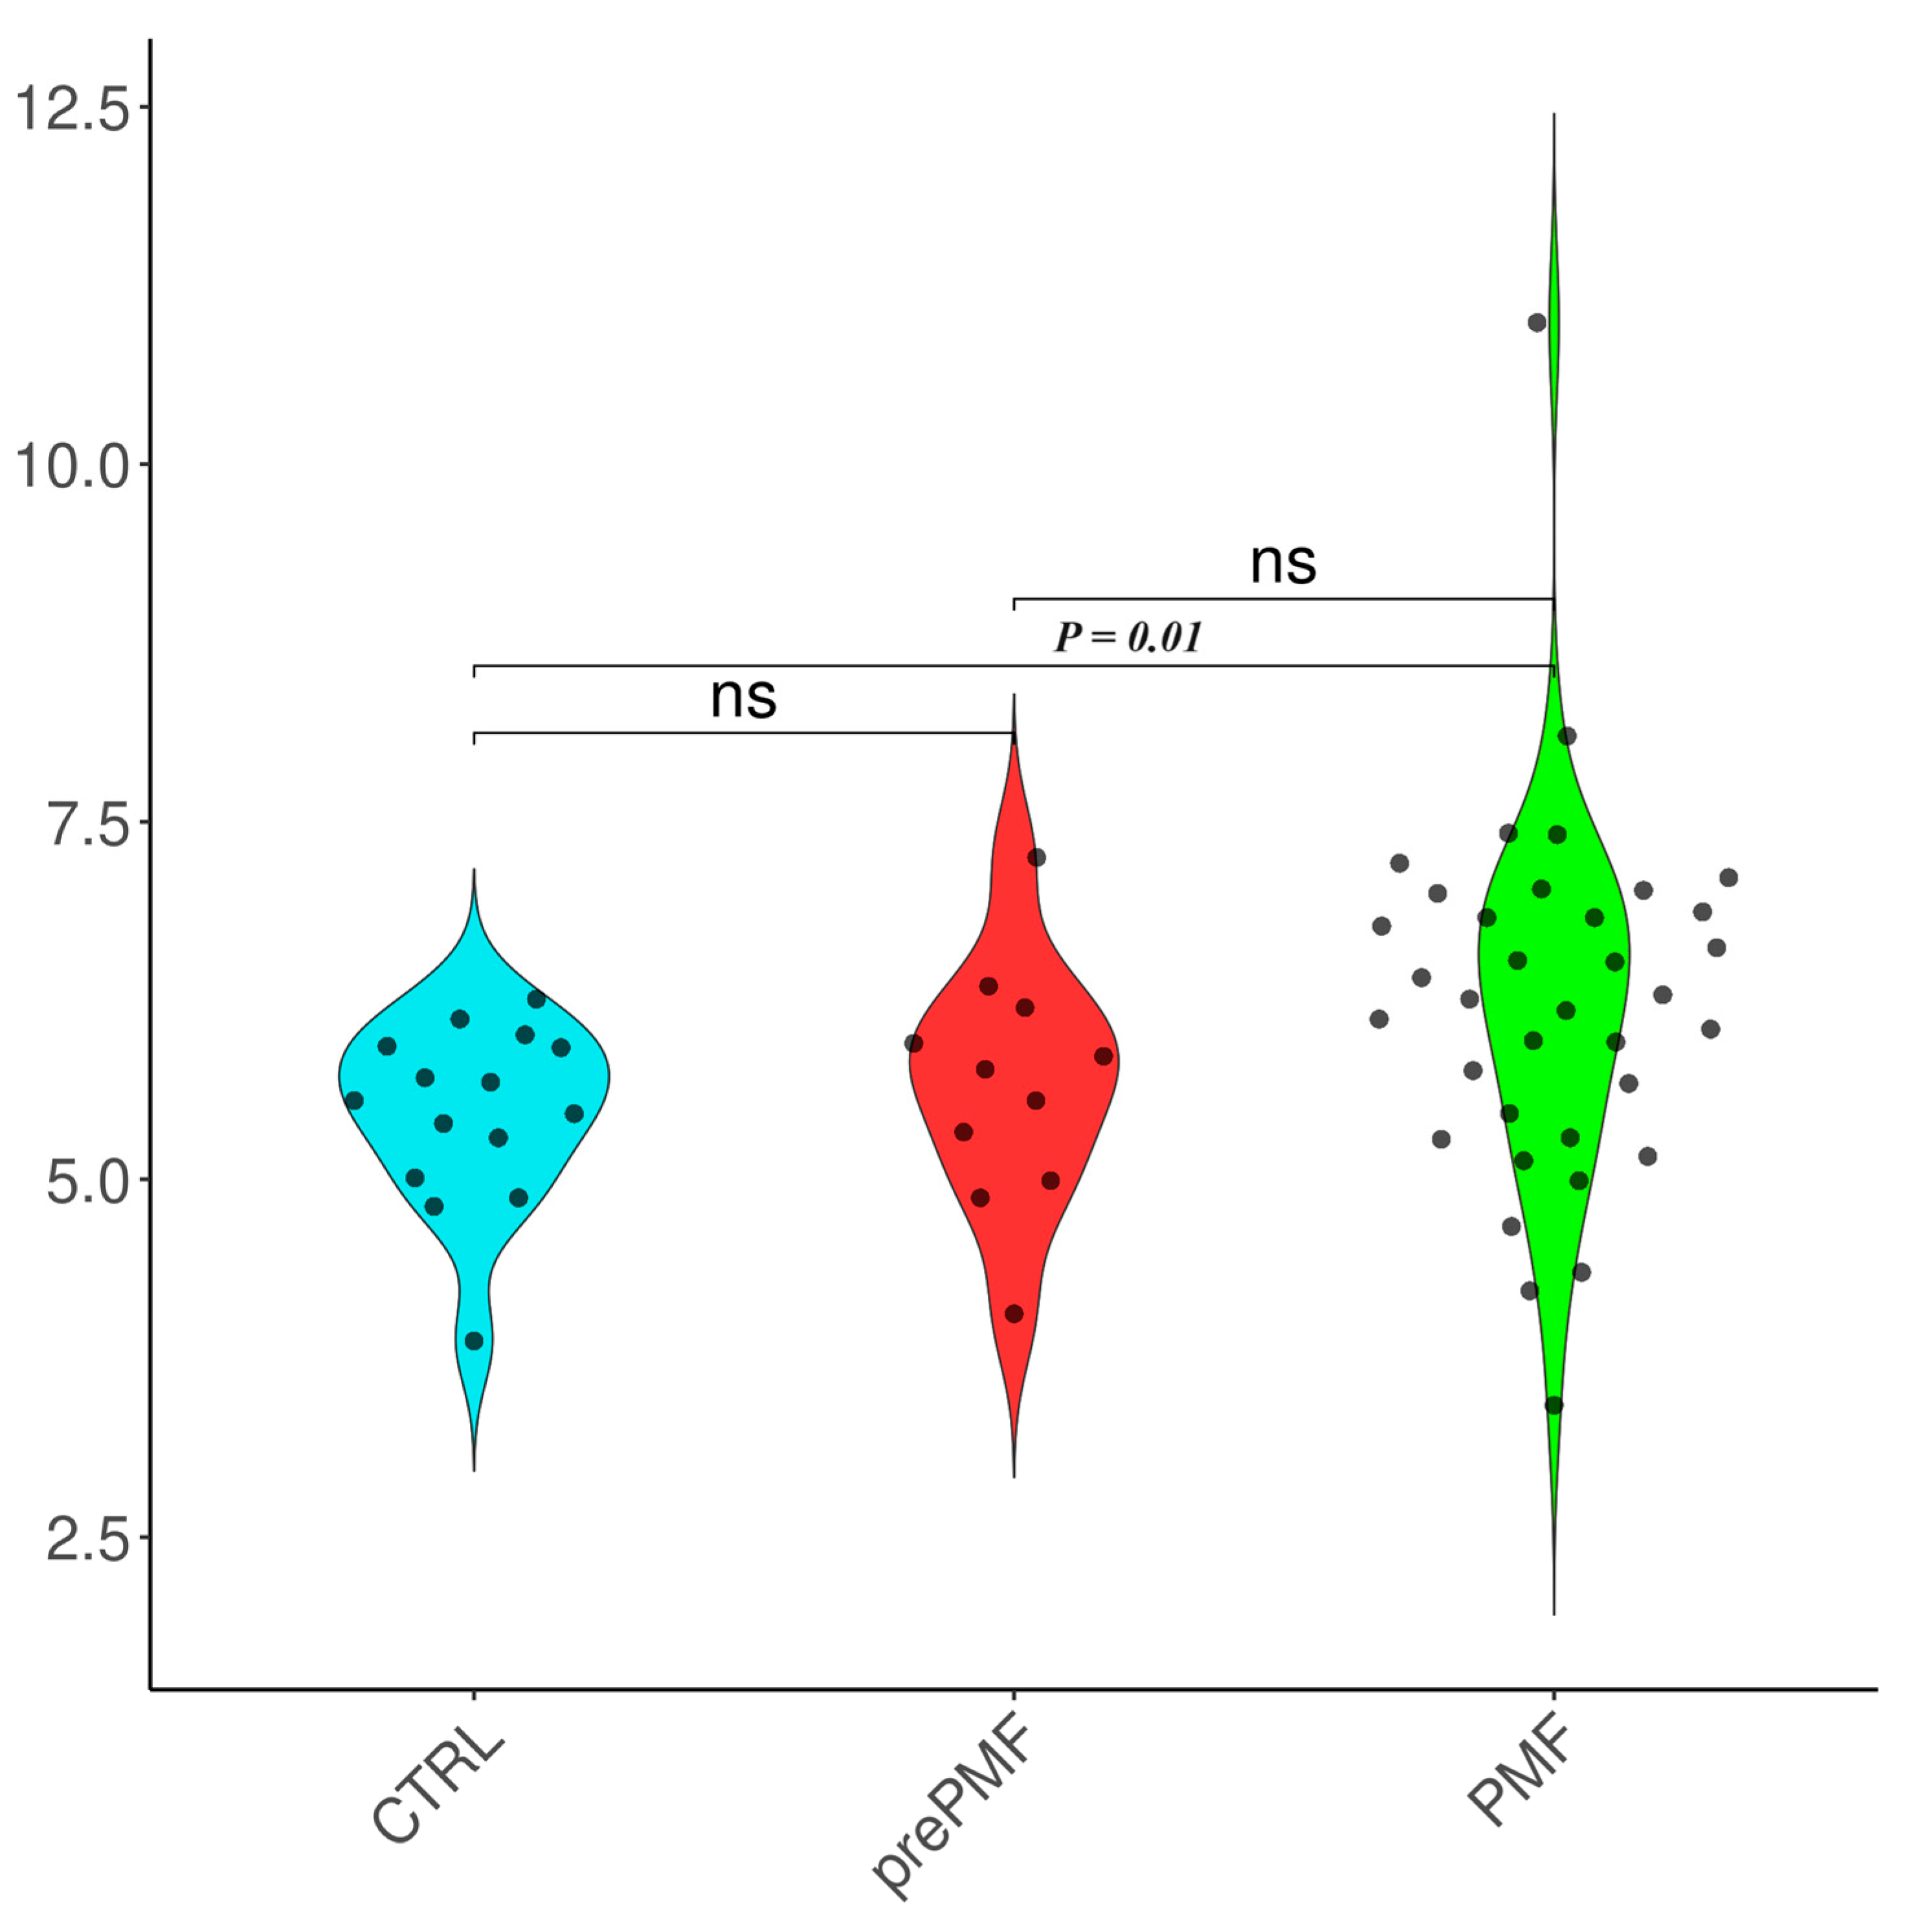
| Controls | 5.46 ± 0.65 | 0.62 ± 0.12 |
| MPNs (entire cohort) | 6.05 ± 1.11 | 0.97 ± 1.91 |
| sAML | 5.99 ± 1.05 | 0.92 ± 1.11 |
| PV | 5.79 ± 0.89 | 0.81 ± 0.62 |
| JAK2V617F (+) | 5.79 ± 0.89 | 0.81 ± 0.62 |
| ET | 6.12 ± 1.11 | 0.56 ± 0.09 |
| JAK2V617F (+) | 6.15 ± 1.25 | 0.54 ± 0.10 |
| CALR (+) | 6.04 ± 0.77 | 0.58 ± 0.10 |
| MPL W515L (+) | 6.90 ± 0.45 | 0.58 ± 0.09 |
| Triple-negative | 5.58 ± 0.38 | 0.57 ± 0.08 |
| MF | 6.11 ± 1.23 | 1.27 ± 2.94 |
| JAK2V617F (+) | 6.38 ± 1.35 | 0.79 ± 0.61 |
| CALR (+) | 5.80 ± 0.87 | 2.45 ± 5.24 |
| MPL W515L (+) | 6.26 ± 0.00 | 0.58 ± 0.00 |
| Triple-negative | 5.37 ± 0.94 | 0.58 ± 0.11 |
| prePMF | 5.65 ± 0.84 | 0.71 ± 0.47 |
| JAK2V617F (+) | 5.68 ± 0.92 | 0.64 ± 0.21 |
| CALR (+) | 5.89 ± 0.96 | 0.91 ± 0.82 |
| MPL W515L (+) | - | - |
| Triple-negative | 5.10 ± 0.32 | 0.54 ± 0.05 |
| (overt) PMF | 6.25 ± 1.30 | 1.66 ± 3.82 |
| JAK2V617F (+) | 6.54 ± 1.40 | 0.89 ± 0.78 |
| CALR (+) | 5.76 ± 0.90 | 3.67 ± 7.08 |
| MPL W515L (+) | 6.26 ± 0.00 | 0.58 ± 0.00 |
| Triple-negative | 5.51 ± 1.17 | 0.62 ± 0.17 |
Disclaimer/Publisher’s Note: The statements, opinions and data contained in all publications are solely those of the individual author(s) and contributor(s) and not of MDPI and/or the editor(s). MDPI and/or the editor(s) disclaim responsibility for any injury to people or property resulting from any ideas, methods, instructions or products referred to in the content. |
© 2024 by the authors. Licensee MDPI, Basel, Switzerland. This article is an open access article distributed under the terms and conditions of the Creative Commons Attribution (CC BY) license (https://creativecommons.org/licenses/by/4.0/).
Share and Cite
Găman, M.-A.; Mambet, C.; Neagu, A.I.; Bleotu, C.; Gurban, P.; Necula, L.; Botezatu, A.; Ataman, M.; Diaconu, C.C.; Ionescu, B.O.; et al. Assessment of Total Antioxidant Capacity, 8-Hydroxy-2′-deoxy-guanosine, the Genetic Landscape, and Their Associations in BCR::ABL-1-Negative Chronic and Blast Phase Myeloproliferative Neoplasms. Int. J. Mol. Sci. 2024, 25, 6652. https://doi.org/10.3390/ijms25126652
Găman M-A, Mambet C, Neagu AI, Bleotu C, Gurban P, Necula L, Botezatu A, Ataman M, Diaconu CC, Ionescu BO, et al. Assessment of Total Antioxidant Capacity, 8-Hydroxy-2′-deoxy-guanosine, the Genetic Landscape, and Their Associations in BCR::ABL-1-Negative Chronic and Blast Phase Myeloproliferative Neoplasms. International Journal of Molecular Sciences. 2024; 25(12):6652. https://doi.org/10.3390/ijms25126652
Chicago/Turabian StyleGăman, Mihnea-Alexandru, Cristina Mambet, Ana Iulia Neagu, Coralia Bleotu, Petruta Gurban, Laura Necula, Anca Botezatu, Marius Ataman, Camelia Cristina Diaconu, Bogdan Octavian Ionescu, and et al. 2024. "Assessment of Total Antioxidant Capacity, 8-Hydroxy-2′-deoxy-guanosine, the Genetic Landscape, and Their Associations in BCR::ABL-1-Negative Chronic and Blast Phase Myeloproliferative Neoplasms" International Journal of Molecular Sciences 25, no. 12: 6652. https://doi.org/10.3390/ijms25126652
APA StyleGăman, M.-A., Mambet, C., Neagu, A. I., Bleotu, C., Gurban, P., Necula, L., Botezatu, A., Ataman, M., Diaconu, C. C., Ionescu, B. O., Ghiaur, A. E., Tatic, A., Coriu, D., Găman, A. M., & Diaconu, C. C. (2024). Assessment of Total Antioxidant Capacity, 8-Hydroxy-2′-deoxy-guanosine, the Genetic Landscape, and Their Associations in BCR::ABL-1-Negative Chronic and Blast Phase Myeloproliferative Neoplasms. International Journal of Molecular Sciences, 25(12), 6652. https://doi.org/10.3390/ijms25126652