Article

Chloroplast Genomes Evolution and Phylogenetic Relationships of Caragana species

School of Ecology and Nature Conservation, Beijing Forestry University, Beijing 100083, China
*
Authors to whom correspondence should be addressed.
Int. J. Mol. Sci. 2024, 25(12), 6786; https://doi.org/10.3390/ijms25126786
Submission received: 30 May 2024 / Revised: 18 June 2024 / Accepted: 18 June 2024 / Published: 20 June 2024
(This article belongs to the Special Issue Plant Phylogenomics and Genetic Diversity (2nd Edition))

Abstract

:
Caragana sensu lato (s.l.) includes approximately 100 species that are mainly distributed in arid and semi-arid regions. Caragana species are ecologically valuable for their roles in windbreaking and sand fixation. However, the taxonomy and phylogenetic relationships of the genus Caragana are still unclear. In this study, we sequenced and assembled the chloroplast genomes of representative species of Caragana and reconstructed robust phylogenetic relationships at the section level. The Caragana chloroplast genome has lost the inverted repeat region and wascategorized in the inverted repeat loss clade (IRLC). The chloroplast genomes of the eight species ranged from 128,458 bp to 135,401 bp and contained 110 unique genes. All the Caragana chloroplast genomes have a highly conserved structure and gene order. The number of long repeats and simple sequence repeats (SSRs) showed significant variation among the eight species, indicating heterogeneous evolution in Caragana. Selective pressure analysis of the genes revealed that most of the protein-coding genes evolved under purifying selection. The phylogenetic analyses indicated that each section forms a clade, except the section Spinosae, which was divided into two clades. This study elucidated the evolution of the chloroplast genome within the widely distributed genus Caragana. The detailed information obtained from this study can serve as a valuable resource for understanding the molecular dynamics and phylogenetic relationships within Caragana.

1. Introduction

Caragana Fabr. belongs to the Fabaceae and includes approximately 100 species [1]. Its native distribution ranges from Eastern Europe to temperate Asia, including Central Asia, the Qinghai–Tibet Plateau, and East Asia [2]. The genus prefers arid and cold habitats, being mainly distributed in arid and semi-arid regions [3], where it is often the dominant plant in the community [4].
The taxonomy and phylogenetic relationships of the genus Caragana sensu lato (s.l.) are still unclear. Zhao [5] divided Caragana sensu stricto (s.s.) into five sections according to morphological characteristics (namely, Caragana, Spinosae, Longispinae, Jubatae, and Frutescentes). Recently, Duan et al. [6], using the nuclear ITS and plastid matK, psbA-trnH, and trnL-F markers, supported that the two genera of Calophaca and Halimodendron belong to Caragana and should be treated as section Calophaca and section Halimodendron. Calophaca Fisch. includes about eight species with a native range from European Russia to Xinjiang and Pakistan [7]. Halimodendron Fisch. ex DC. includes only one species, which is distributed in dry sand and saline soil in the Caucasus, Western Siberia, Central Asia, and the Tianshan Mountains. Both Caragana s.s. and Calophaca are shrubs. Caragana s.s. has paripinnate leaves; axillary flowers that are usually solitary but sometimes present in groups of two–five in a fascicle; and cylindrical or compressed legumes. Calophaca has imparipinnate leaves and four-flowered (or more) raceme (Figure 1). Halimodendron has paripinnate leaves; racemes with four or more flowers; inflated legumes; and thick valves [8].
The phylogenetic relationships among the sections of Caragana sensu lato (s.l.) were poorly supported and could not be resolved using the rbcL, trnStrnG, and ITS markers [4]. Moreover, the topology of the section was also inconsistent between different studies. For example, section Caragana or Frutescentes was supported as the basal group of Caragana based on the results of Zhang et al. [9] and Duan et al. [6], respectively. Previous studies suffered from poor phylogenetic resolution due to the limited availability of DNA sequence data (rbcL, matK, trnS–trnG, trnL–F, psbA–trnH, and ITS) and the low genetic variability in the selected molecular markers [6,10,11], possibly attributed to the recent origin and rapid diversification of this genera. Overall, previous phylogenetic trees showed problems such as low bootstrap values and low robustness due to only a few molecular markers with the limitation of sequencing technology. Consequently, expanding the sampling of genetic information, such as by using complete chloroplast genomes, could provide a more robust phylogenetic tree and could improve investigations of the evolutionary history of Caragana at the section level. Furthermore, a well-supported phylogenetic framework will enable a better estimate of the divergence time of these genera.
Chloroplast genome sequences have been widely used to investigate phylogenetic relationships among closely related species due to their higher mutation rates, maternal inheritance, and lack of recombination [12,13,14]. The advancement of sequencing technologies has facilitated cost-effective, easy-to-obtain, complete chloroplast genome sequences, enabling the transition from gene-based phylogenetics to genome-based phylogenomics [13,15] and facilitating the investigation of evolutionary phenomena in plant species with greater efficiency. Recently, the chloroplast genomes of several Caragana s.s. species have been sequenced and annotated, focusing on chloroplast genome evolution [16,17,18].
In order to understand the evolutionary history and the dynamic evolution of Caragana, we sequenced the chloroplast genomes of representative species of Caragana. In this study, we specifically aimed to (1) deepen our understanding of Caragana evolution using chloroplast genomes and (2) reconstruct robust phylogenetic relationships in Caragana at the section level.

2. Results

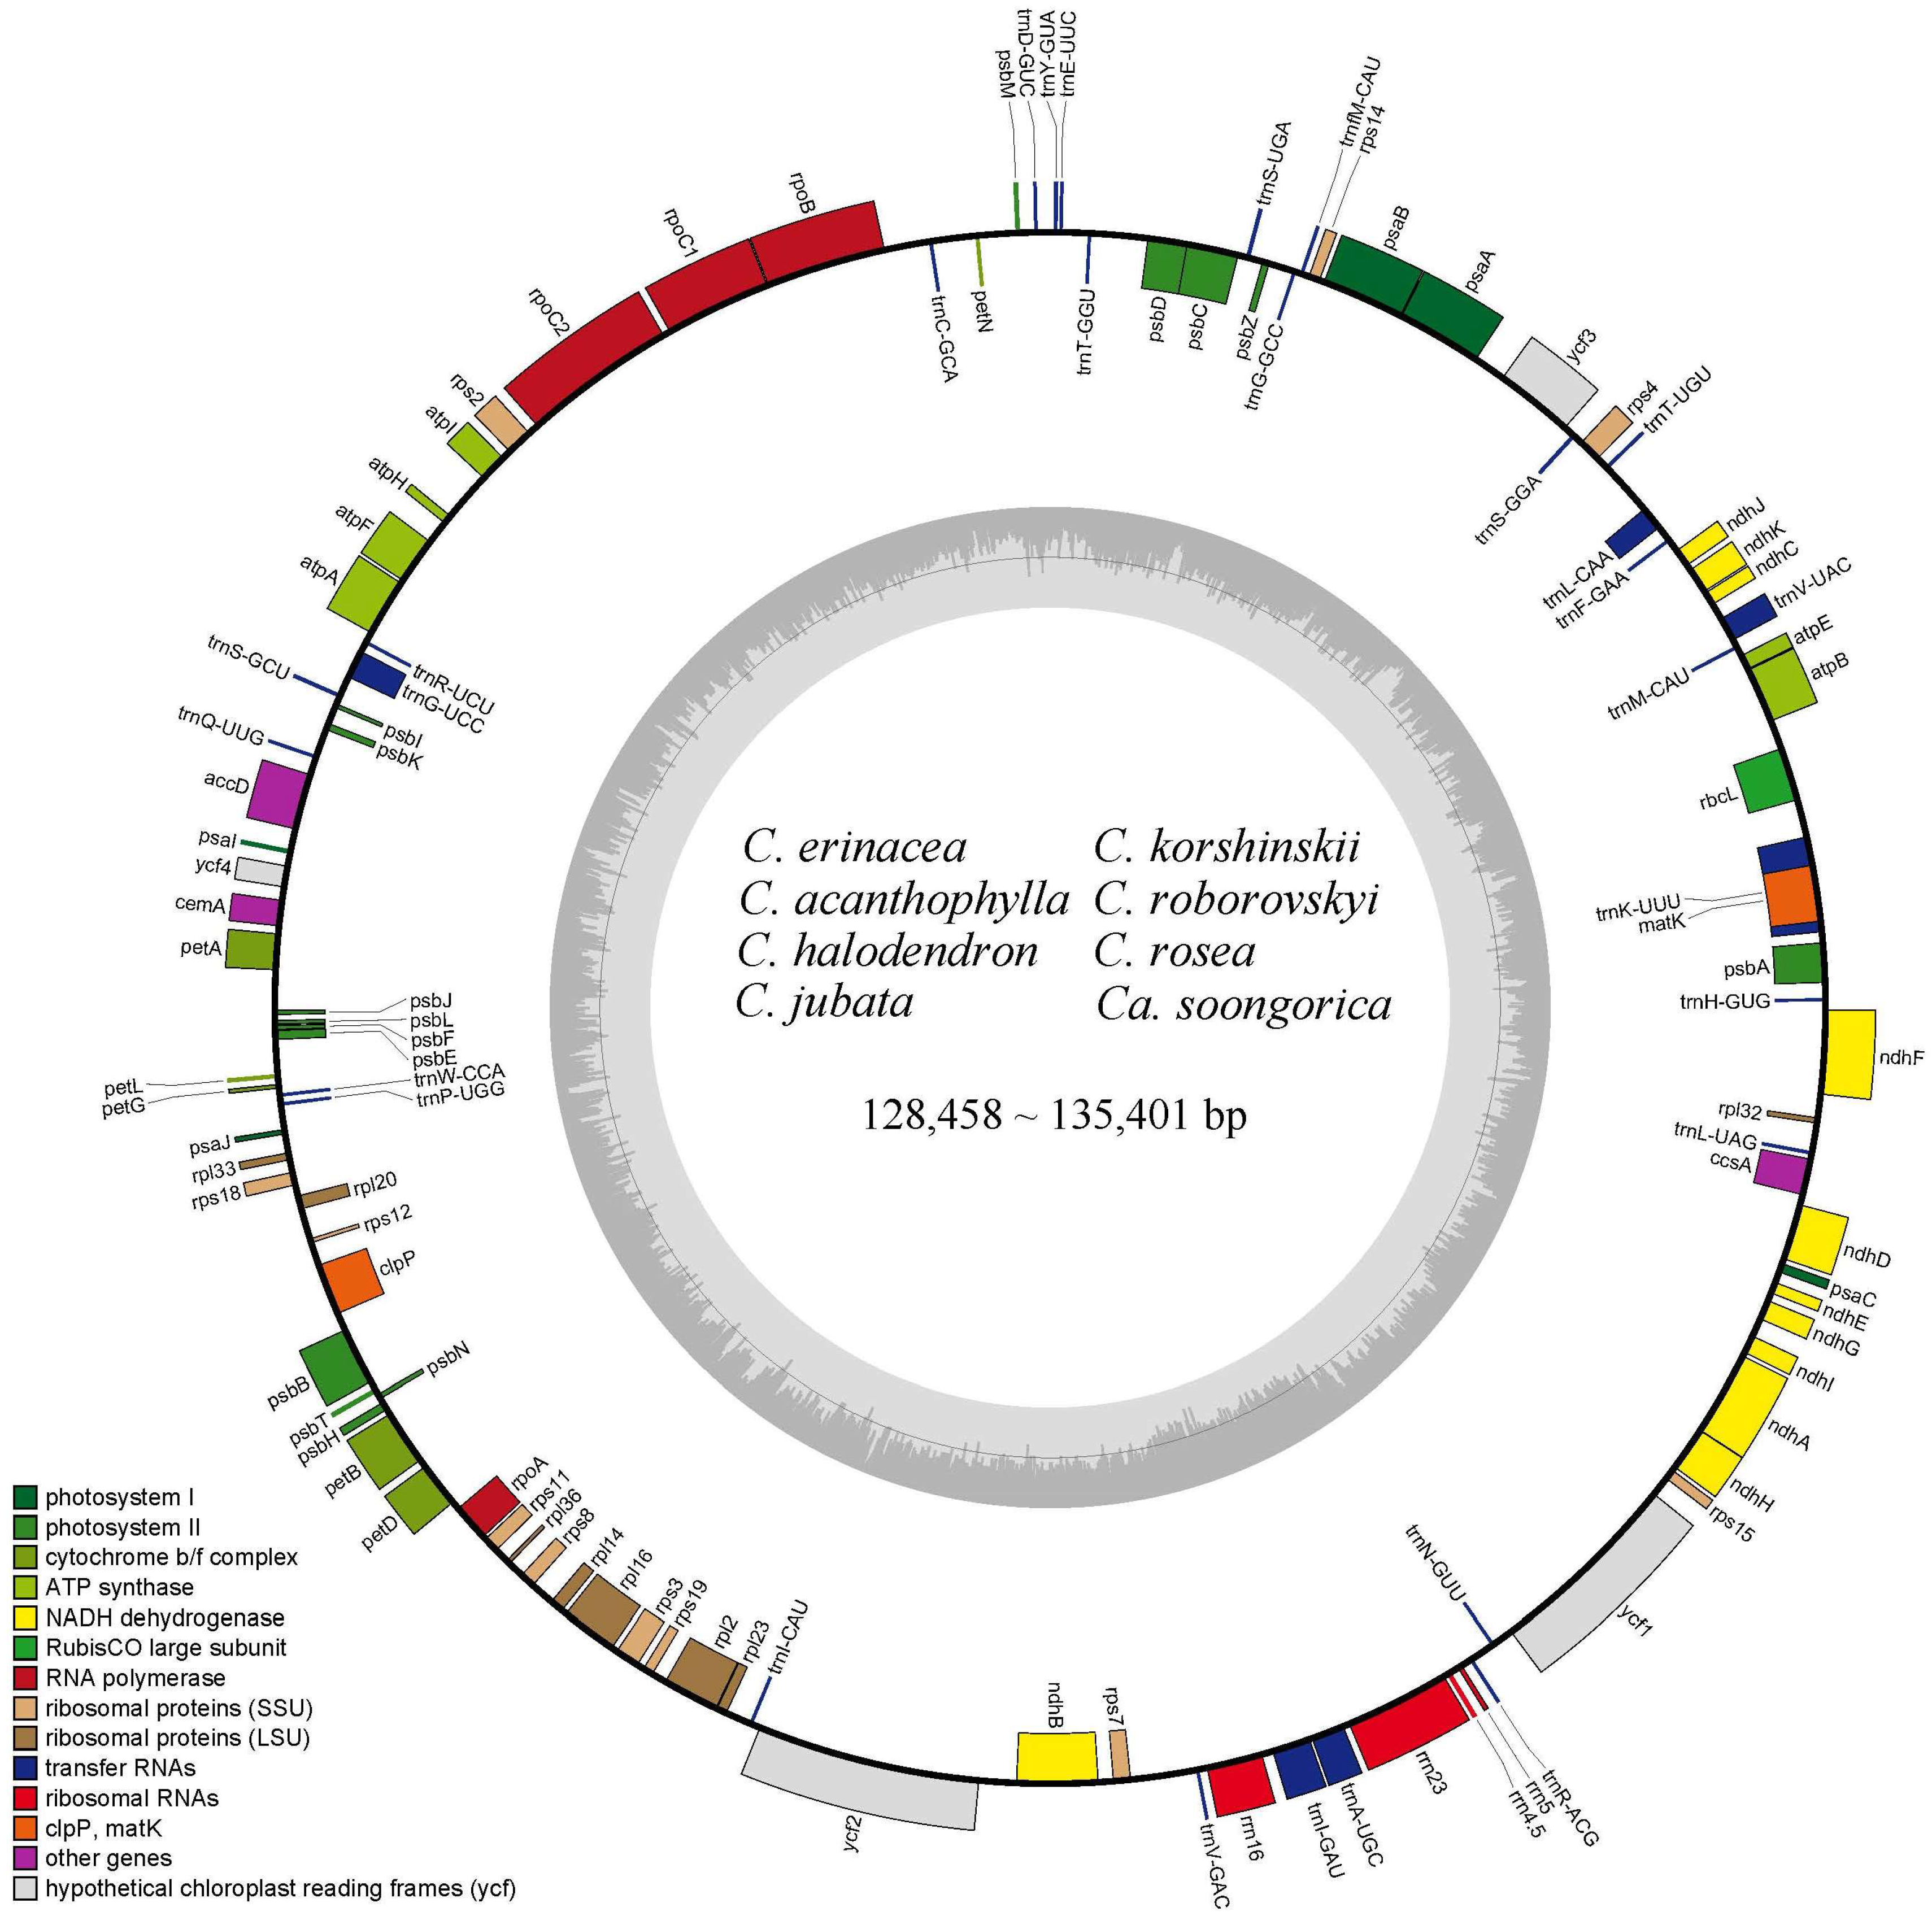
2.1. Characteristics of Caragana Chloroplast Genomes

The lengths of newly sequenced chloroplast genomes of Caragana varied from 12.8458 kb (C. jubata) to 13.5401 kb (C. rosea) (Table 1). All Caragana chloroplast genomes had lost the IR region and did not have the typical quadripartite structure found in most land plant chloroplast genomes (Figure 2). The GC content of the eight Caragana chloroplast genomes ranged from 34.3% (C. korshinskii) to 34.8% (C. rosea).
We annotated 110 unique genes, including 76 protein-coding genes, 30 tRNA genes, and four rRNA genes in Caragana chloroplast genomes (Figure 2). The genes could be divided into three categories. We identified 57 genes associated with self-replication, encompassing transfer RNA, ribosomal RNA, and three subunits—large, small, and DNA-dependent RNA polymerase—encoding chloroplast RNA polymerase. Additionally, 44 genes were linked to photosynthesis. The remaining genes were classified as either other genes or unknown genes. A total of 17 genes had introns; ycf3 had two introns, and the remaining 16 genes (atpF, clpP, ndhA, ndhB, petB, petD, rpl2, rpl16, rpoC1, rps12, trnA-UGC, trnG-UCC, trnI-GAU, trnK-UUU, trnL-CAA, and trnV-UAC) had only one intron.

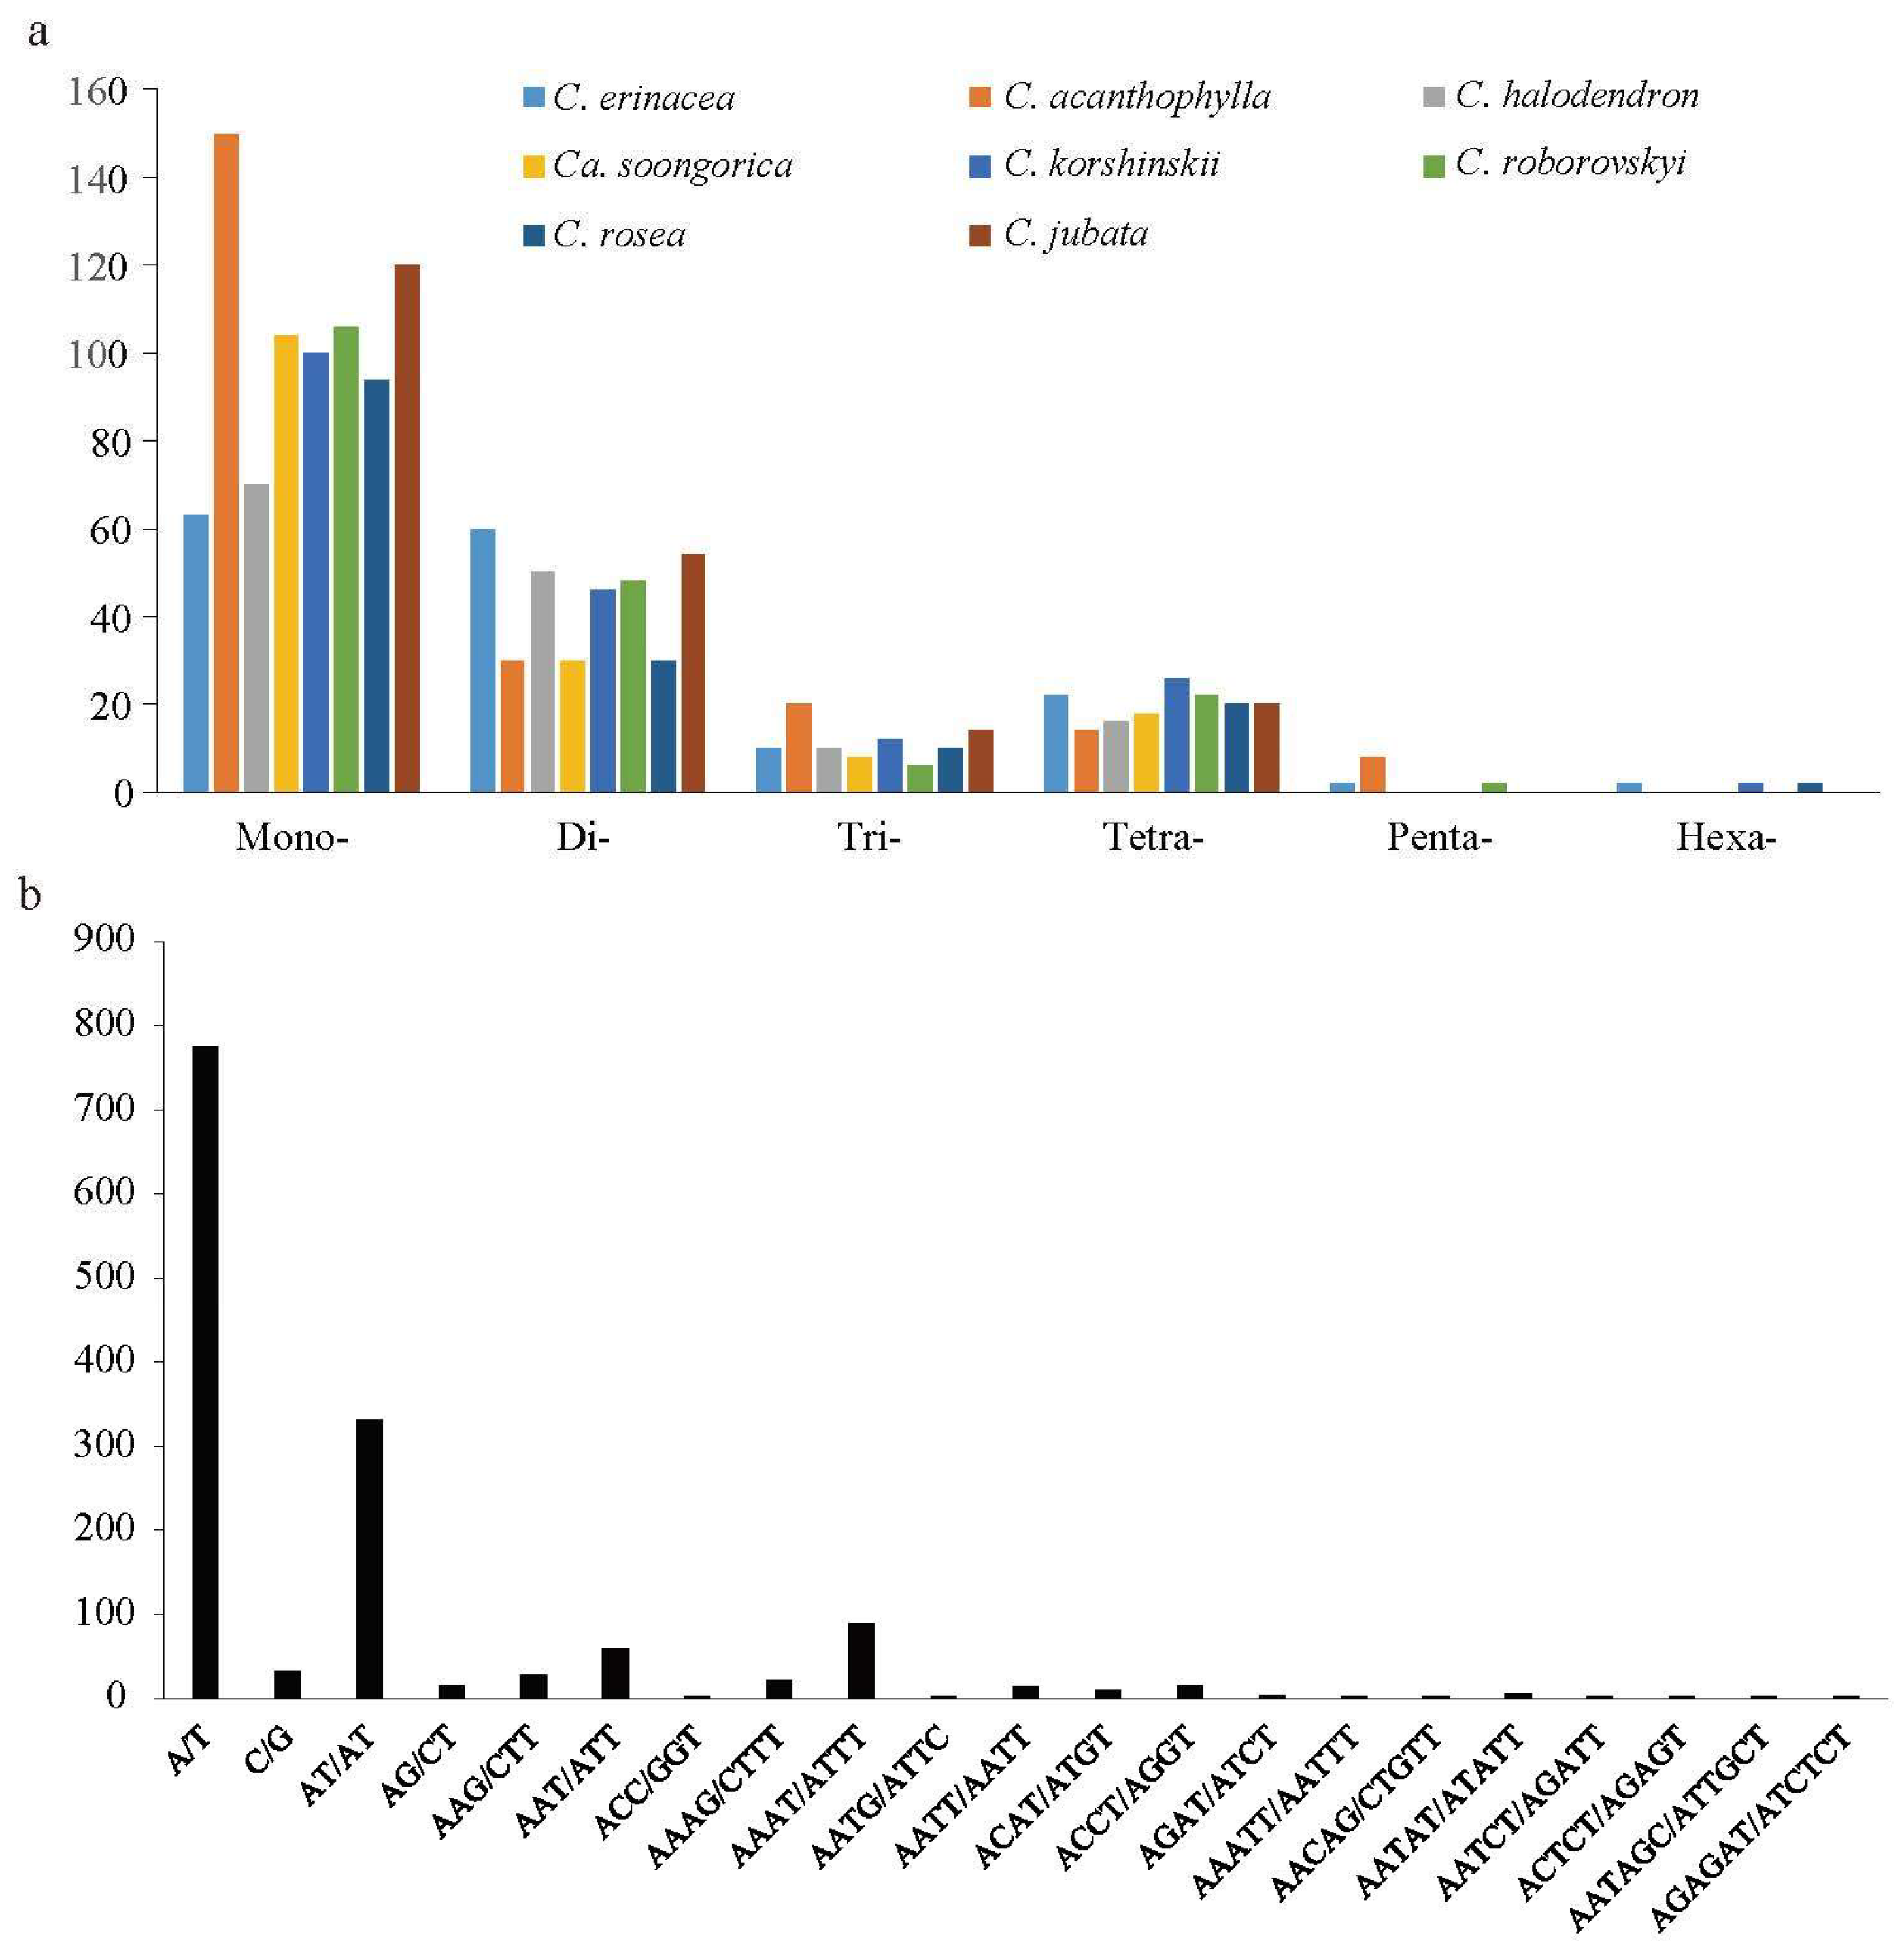
2.2. Analyses of Repeat Sequences

In the eight Caragana chloroplast genomes, we detected 1421 simple sequence repeats (SSRs), with the number of SSRs in each genome ranging from 156 to 222 (Figure 3). Six types of SSR were identified. Among them, mononucleotide repeats were the most frequent in all eight species, with proportions ranging from 39.62% (C. erinacea) to 67.57% (C. acanthophylla) (Figure 3a). Dinucleotide repeats were the second most frequent SSR type, with proportions ranging from 13.51% (C. acanthophylla) to 37.74% (C. erinacea). Caragana acanthophylla had the most trinucleotide repeats, followed by C. jubata with 14 trinucleotide repeats. The number of tetranucleotide repeats ranged from 14 (C. acanthophylla) to 26 (C. korshinskii). Some Caragana species did not have trinucleotides or hexanucleotides. The SSRs had a significant bias toward A/T bases (Figure 3b), with most mononucleotide repeats being A/T (54.54%) and most dinucleotide repeats being AT/TA (23.36%).
We detected 1296 long repeats, consisting of forward repeats (F), palindromic repeats (P), reverse repeats (R), and complementary (C) repeats with 30–472 bp in the eight chloroplast genomes (Figure 4a). The repeat number and length varied from one to another. Caragana roborovskyi had the greatest number of repeats (314) followed by C. acanthophylla and C. erinacea (205), and C. jubata had the lowest (84). The number of long repeats significantly differed among the four long repeat types. Forward repeats were most common (1025), followed by palindromic repeats (238). Complementary repeats were only identified in C. jubata and C. roborovskyi. The analysis of forward, palindromic, and reverse repeat lengths revealed that the most common type was long repeats (30–40 bp; Figure 4b–d), followed by repeats with lengths of 41–50 bp and 51–60 bp.

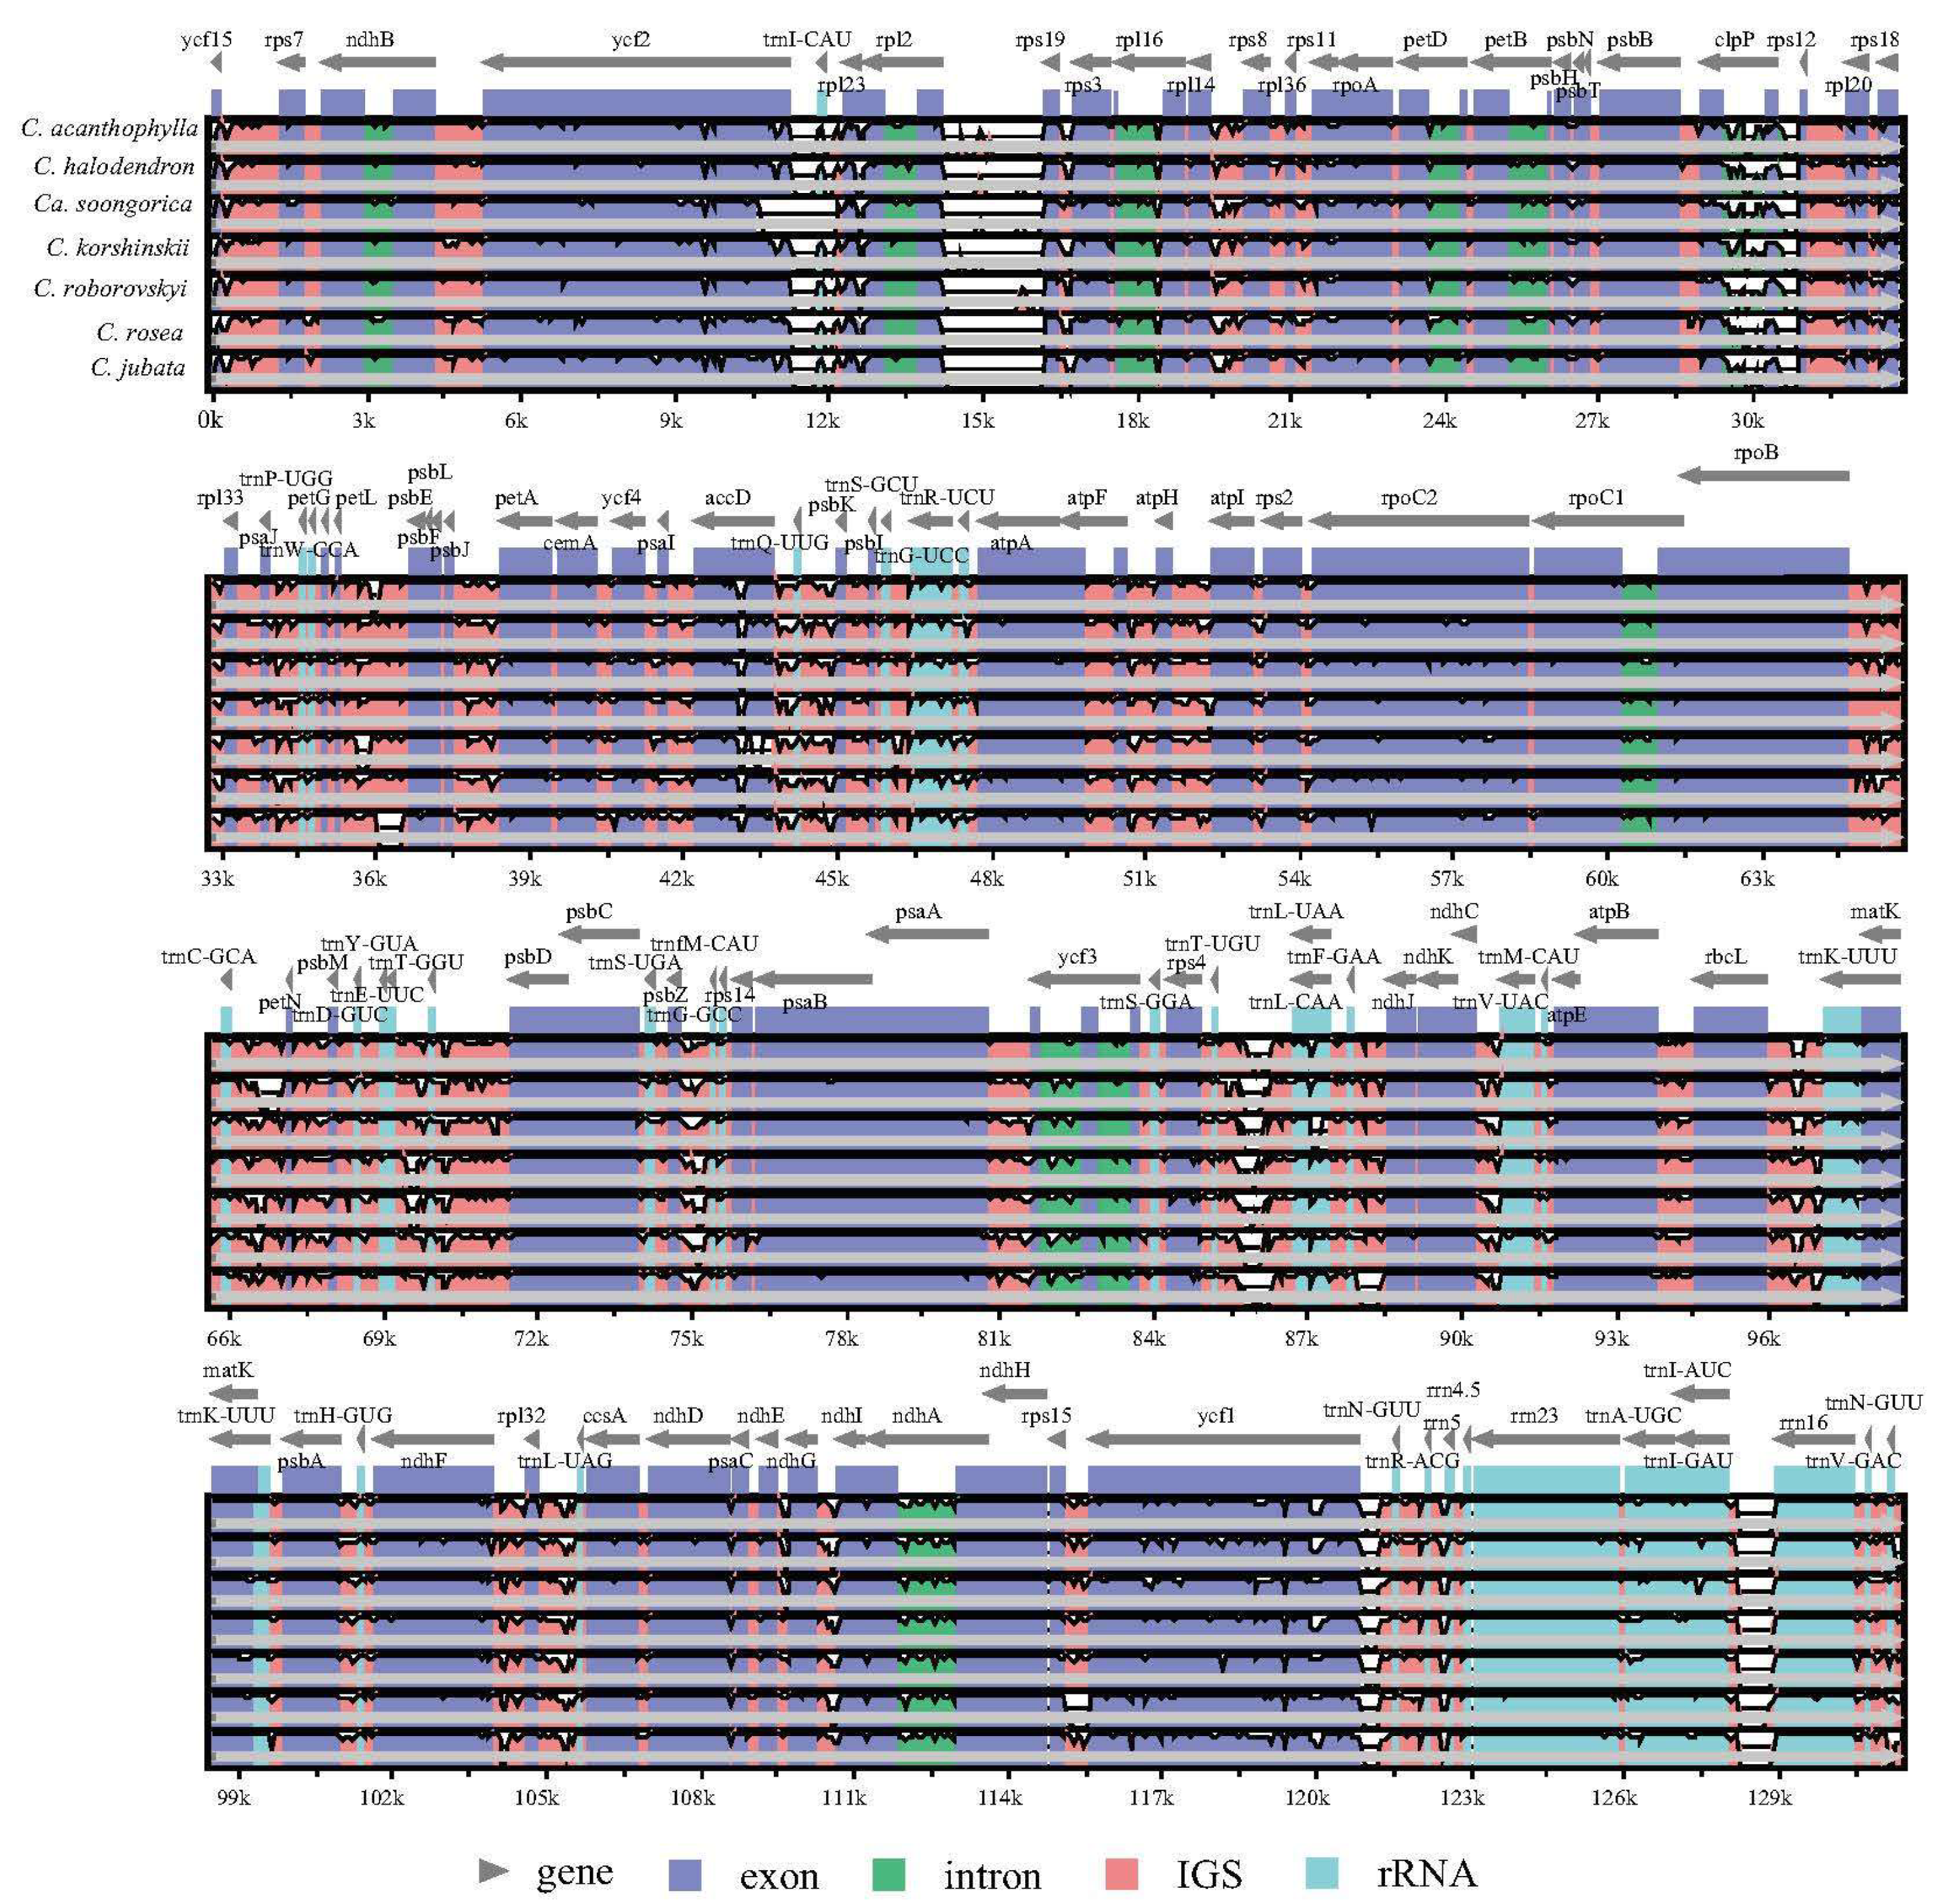
2.3. Genomic Sequence Divergence

The multiple sequence alignments determined with mVISTA revealed no evidence of genomic rearrangements or large inversions across the Caragana chloroplast genomes, as illustrated in Figure 5. These chloroplast genomes exhibited a high degree of conservation, both in terms of gene order and sequence identity. Notably, the coding regions and inverted repeat (IR) regions demonstrated a higher level of conservation compared to the non-coding regions and single-copy regions. The analysis further revealed that the intergenic spacer regions exhibiting the most variation were trnI-rpl23, rpl2-rps19, clpP-rps12, trnC-petN, trnT-trnL, and trnN-trnR. Additionally, the coding genes accD, rpoC2, and ycf1 demonstrated high levels of variation among the coding regions of the chloroplast genomes.

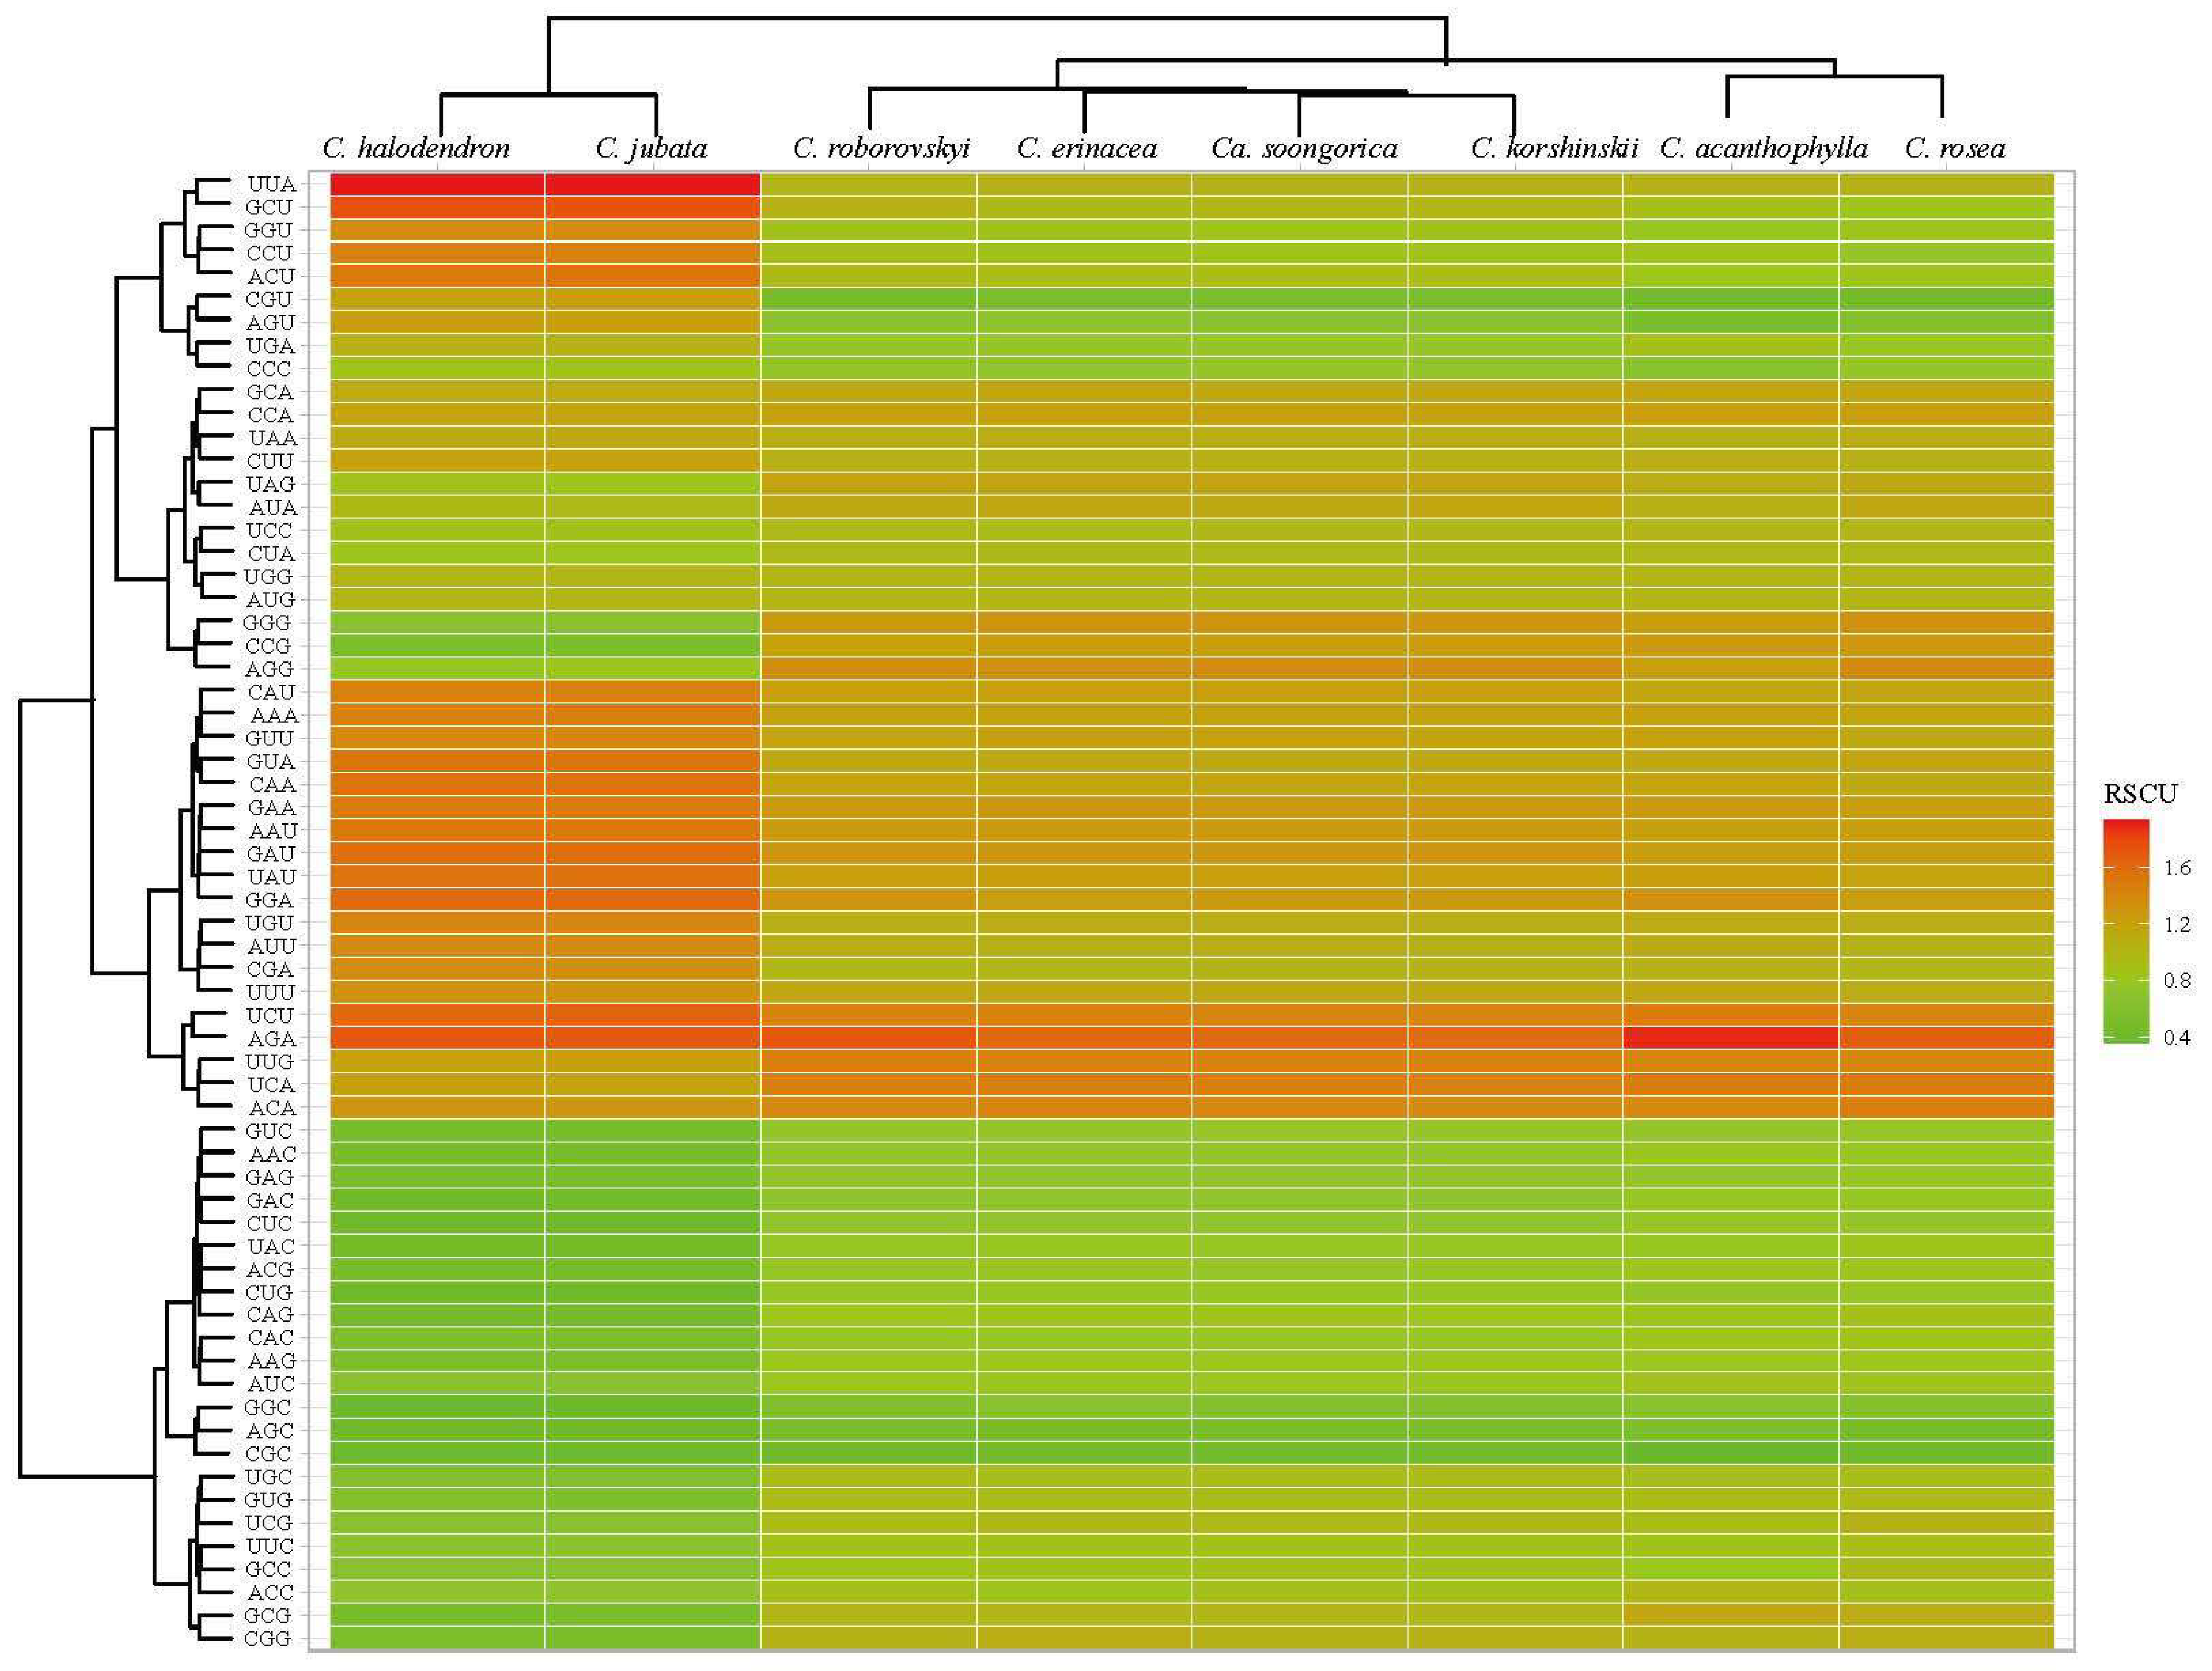
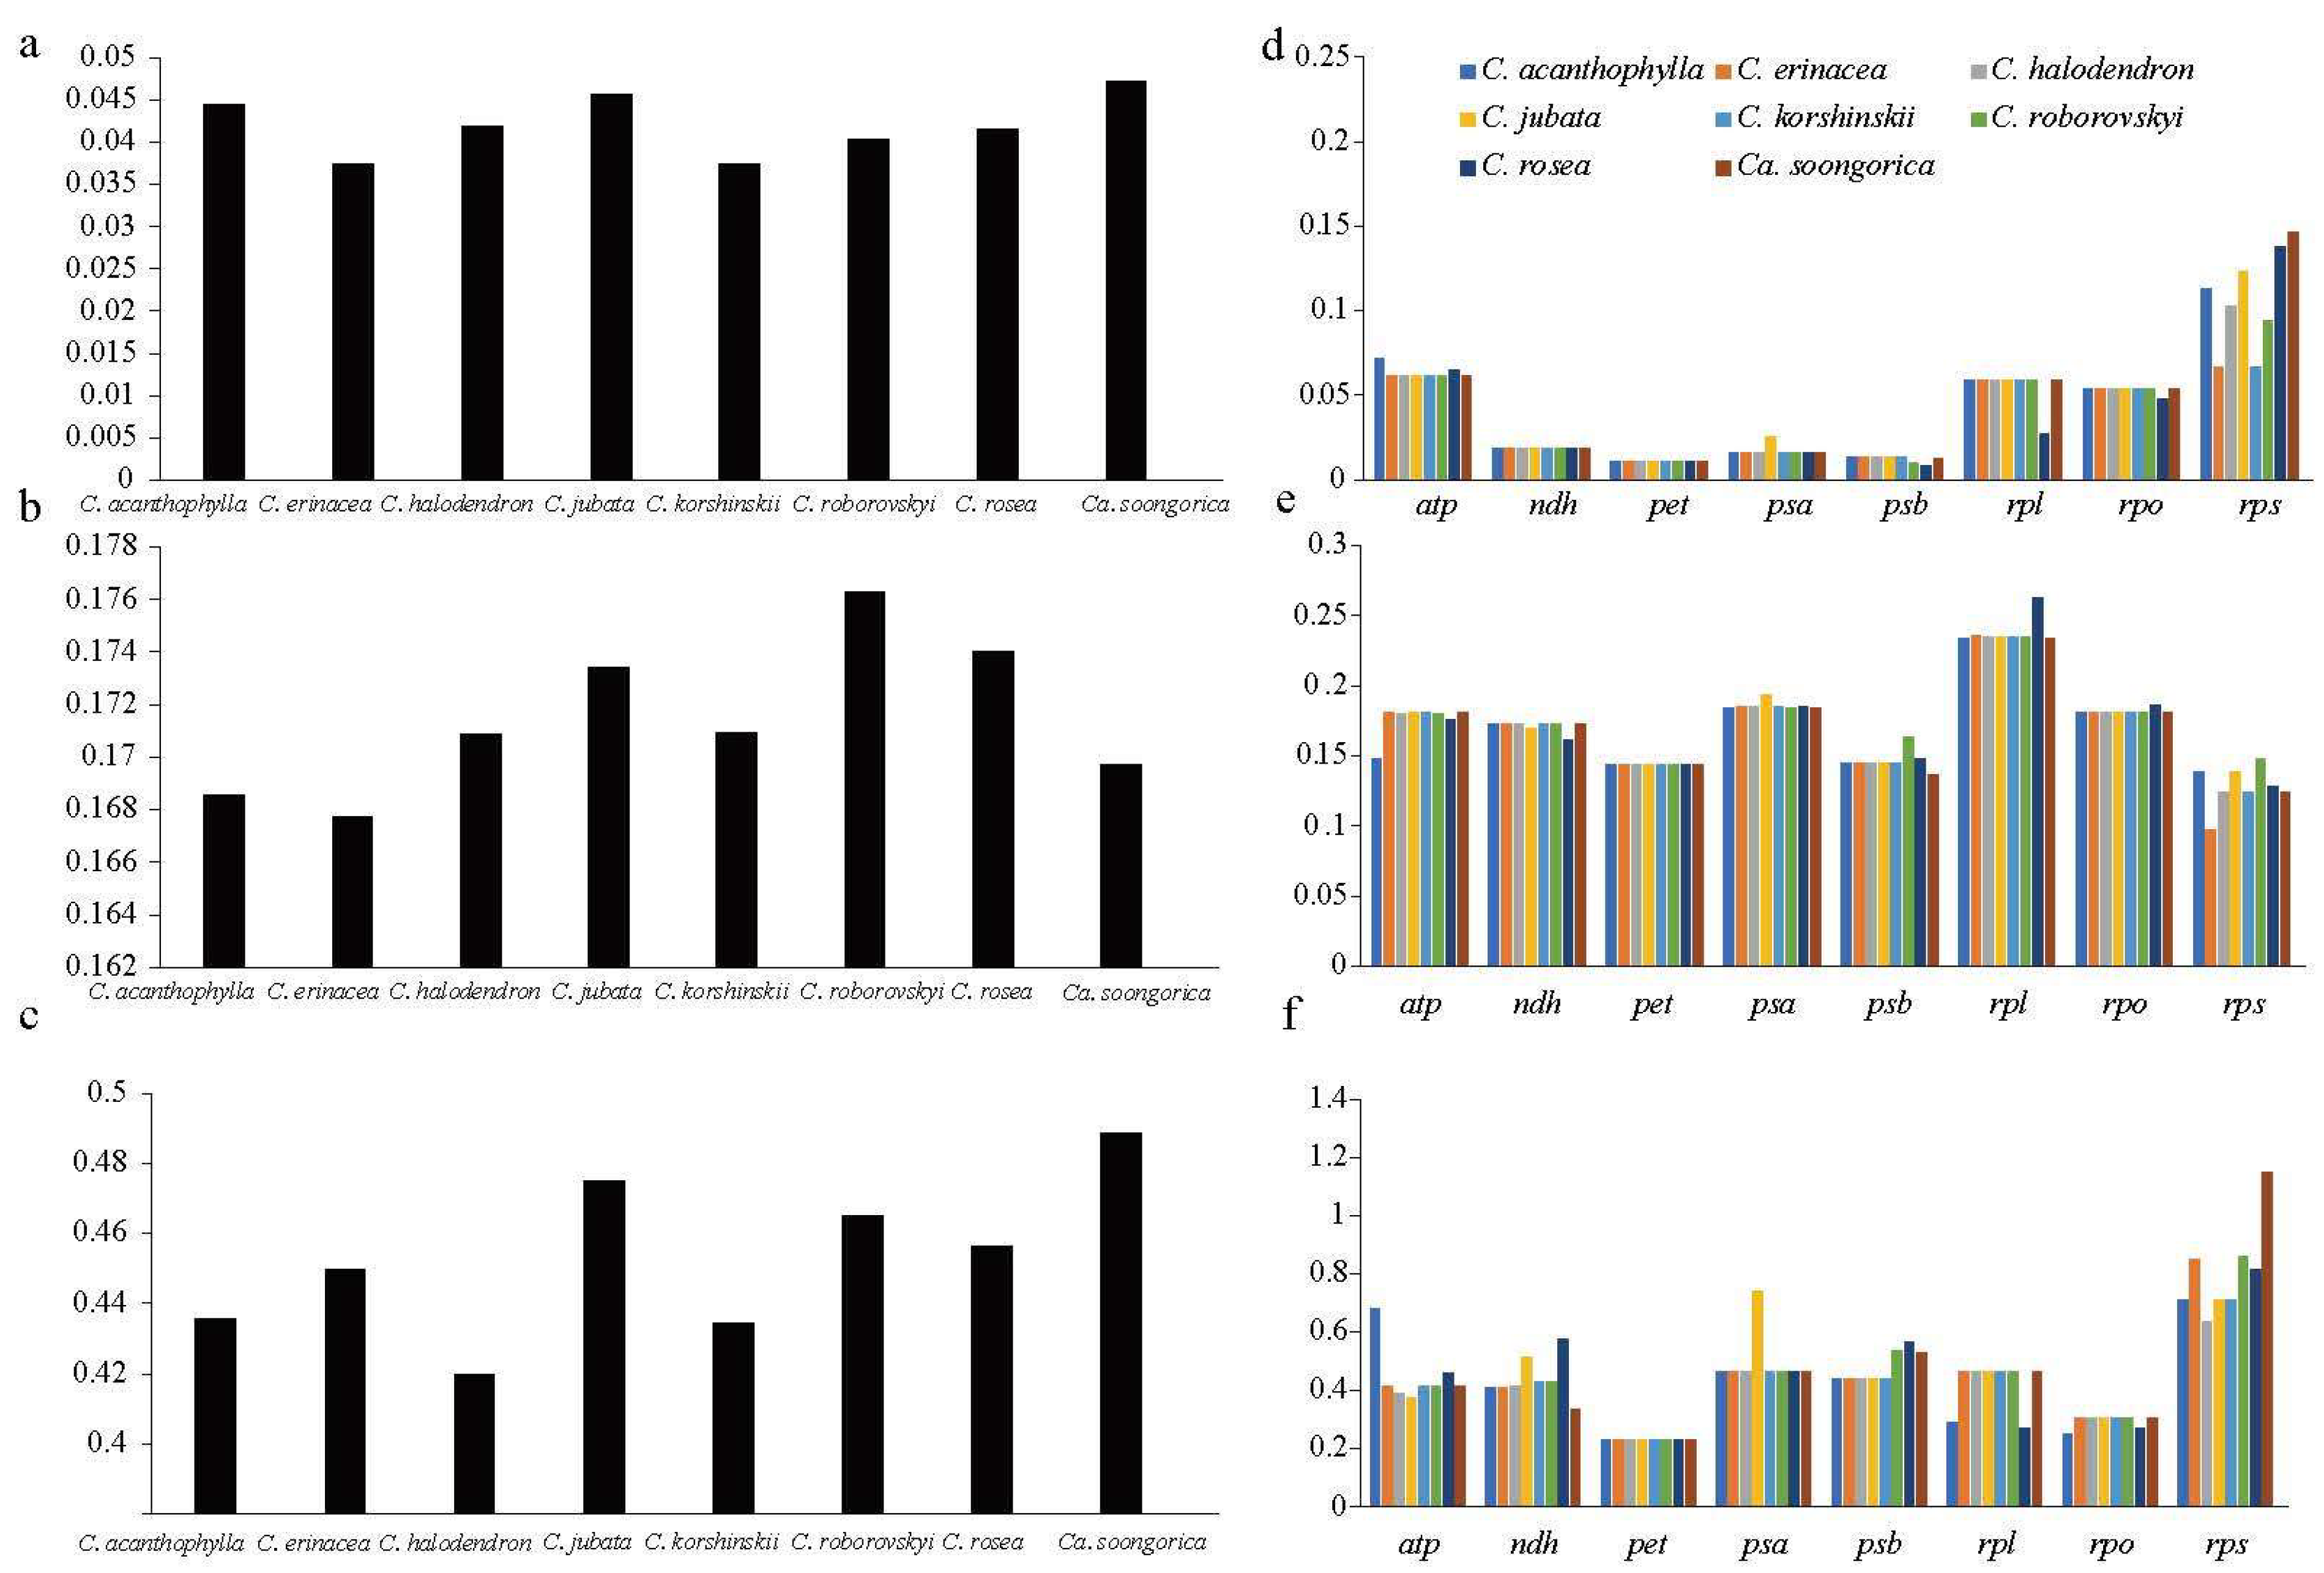
2.4. Codon Usage Pattern and Molecular Evolution

We analyzed the codon usage of the protein-coding genes in the chloroplast genomes of the eight Caragana species (Table S3). The number of codons ranged from 23,335 (Calophaca soongorica) to 23,750 (C. halodendron). We identified 64 codons encoding 20 amino acids, including three termination codons. Leucine (Leu) showed the highest abundance among the amino acids, accounting for 24,164 occurrences (12.89%) across all eight species. This was followed by isoleucine (Ile), with a frequency of 15,339 (8.18%). In contrast, methionine (Met) was represented by the fewest number of codons, totaling 5017 occurrences.
The results of relative synonymous codon usage (RSCU; Figure 6) indicate that 24 codons were used more frequently with RSCU > 1. Notably, 23 of these 24 codons possessed A/U at the third nucleotide positions except UUG. Conversely, most of the codons ending with G/C exhibited RSCU values lower than 1, suggesting less prevalent usage in the eight chloroplast genomes. The bias towards A/U at the third position of the codons was further evidenced by the A/U contents of the codons, with a mean value of 58.79% at the third codon position. Two codons, ATU for methionine (Met) and UGG for tryptophan (Trp), displayed RSCU values of 1.00, indicating no codon bias.

2.5. Molecular Evolution of the Caragana Chloroplast Genome

We assessed the evolutionary rate disparities among Caragana species according to computed dN, dS, and ω values with 74 protein-coding genes, gene groups, and the combinations of all 74 protein-coding genes for each Caragana species (Figure 7 and Table S4). The t-test for dN, dS, and ω values revealed noteworthy variations for each gene, denoting diverse molecular evolution rates across genes.
The highest dN value was linked to accD (0.37), and the mean dN value was 0.052. Notably, three genes (petD, petN, and psaC) exhibited non-synonymous substitution sites with dN = 0. The mean dS value was 0.18, and accD displayed the highest dS value (0.78), followed by psbL (0.65) and clpP (0.43). Most ω values were <1, indicating that most genes were predominantly under purifying selection. However, positive selection was observed in 13 genes (atpF, atpI, cemA, matK, ndhB, psaI, rpl20, rps14, rps7, rps8, ycf1, ycf2, and ycf4), with at least one species-pair exhibiting ω > 1.
Among the different gene groups (Figure 7d), the rps group exhibited the highest dN value (0.106), followed by atp (0.063) and rpl (0.055), while the photosynthetic genes (psa and psb), ndh and pet demonstrated the lowest dN values. There was less variation in dS among the different gene groups (Figure 7e). The ω value was <0.5 for all gene groups except the rps group, indicating purifying selection (Figure 7f). The ω value was >1 in the rps group in Calophaca soongorica, indicating positive selection within this group.
At the species level (Figure 7a), Calophaca soongorica showed the highest dN value (0.047), followed by 0.046 in C. jubata and 0.044 in C. acanthophylla. Caragana roborovskyi had the highest dS value (0.176) (Figure 7b). Both dS and dN values demonstrated less variability between the eight species. All ω values were <0.5 (ranging from 0.420 to 0.489), indicating a much lower frequency of non-synonymous substitutions compared to synonymous substitutions and that the species were under purifying selection (Figure 7c).

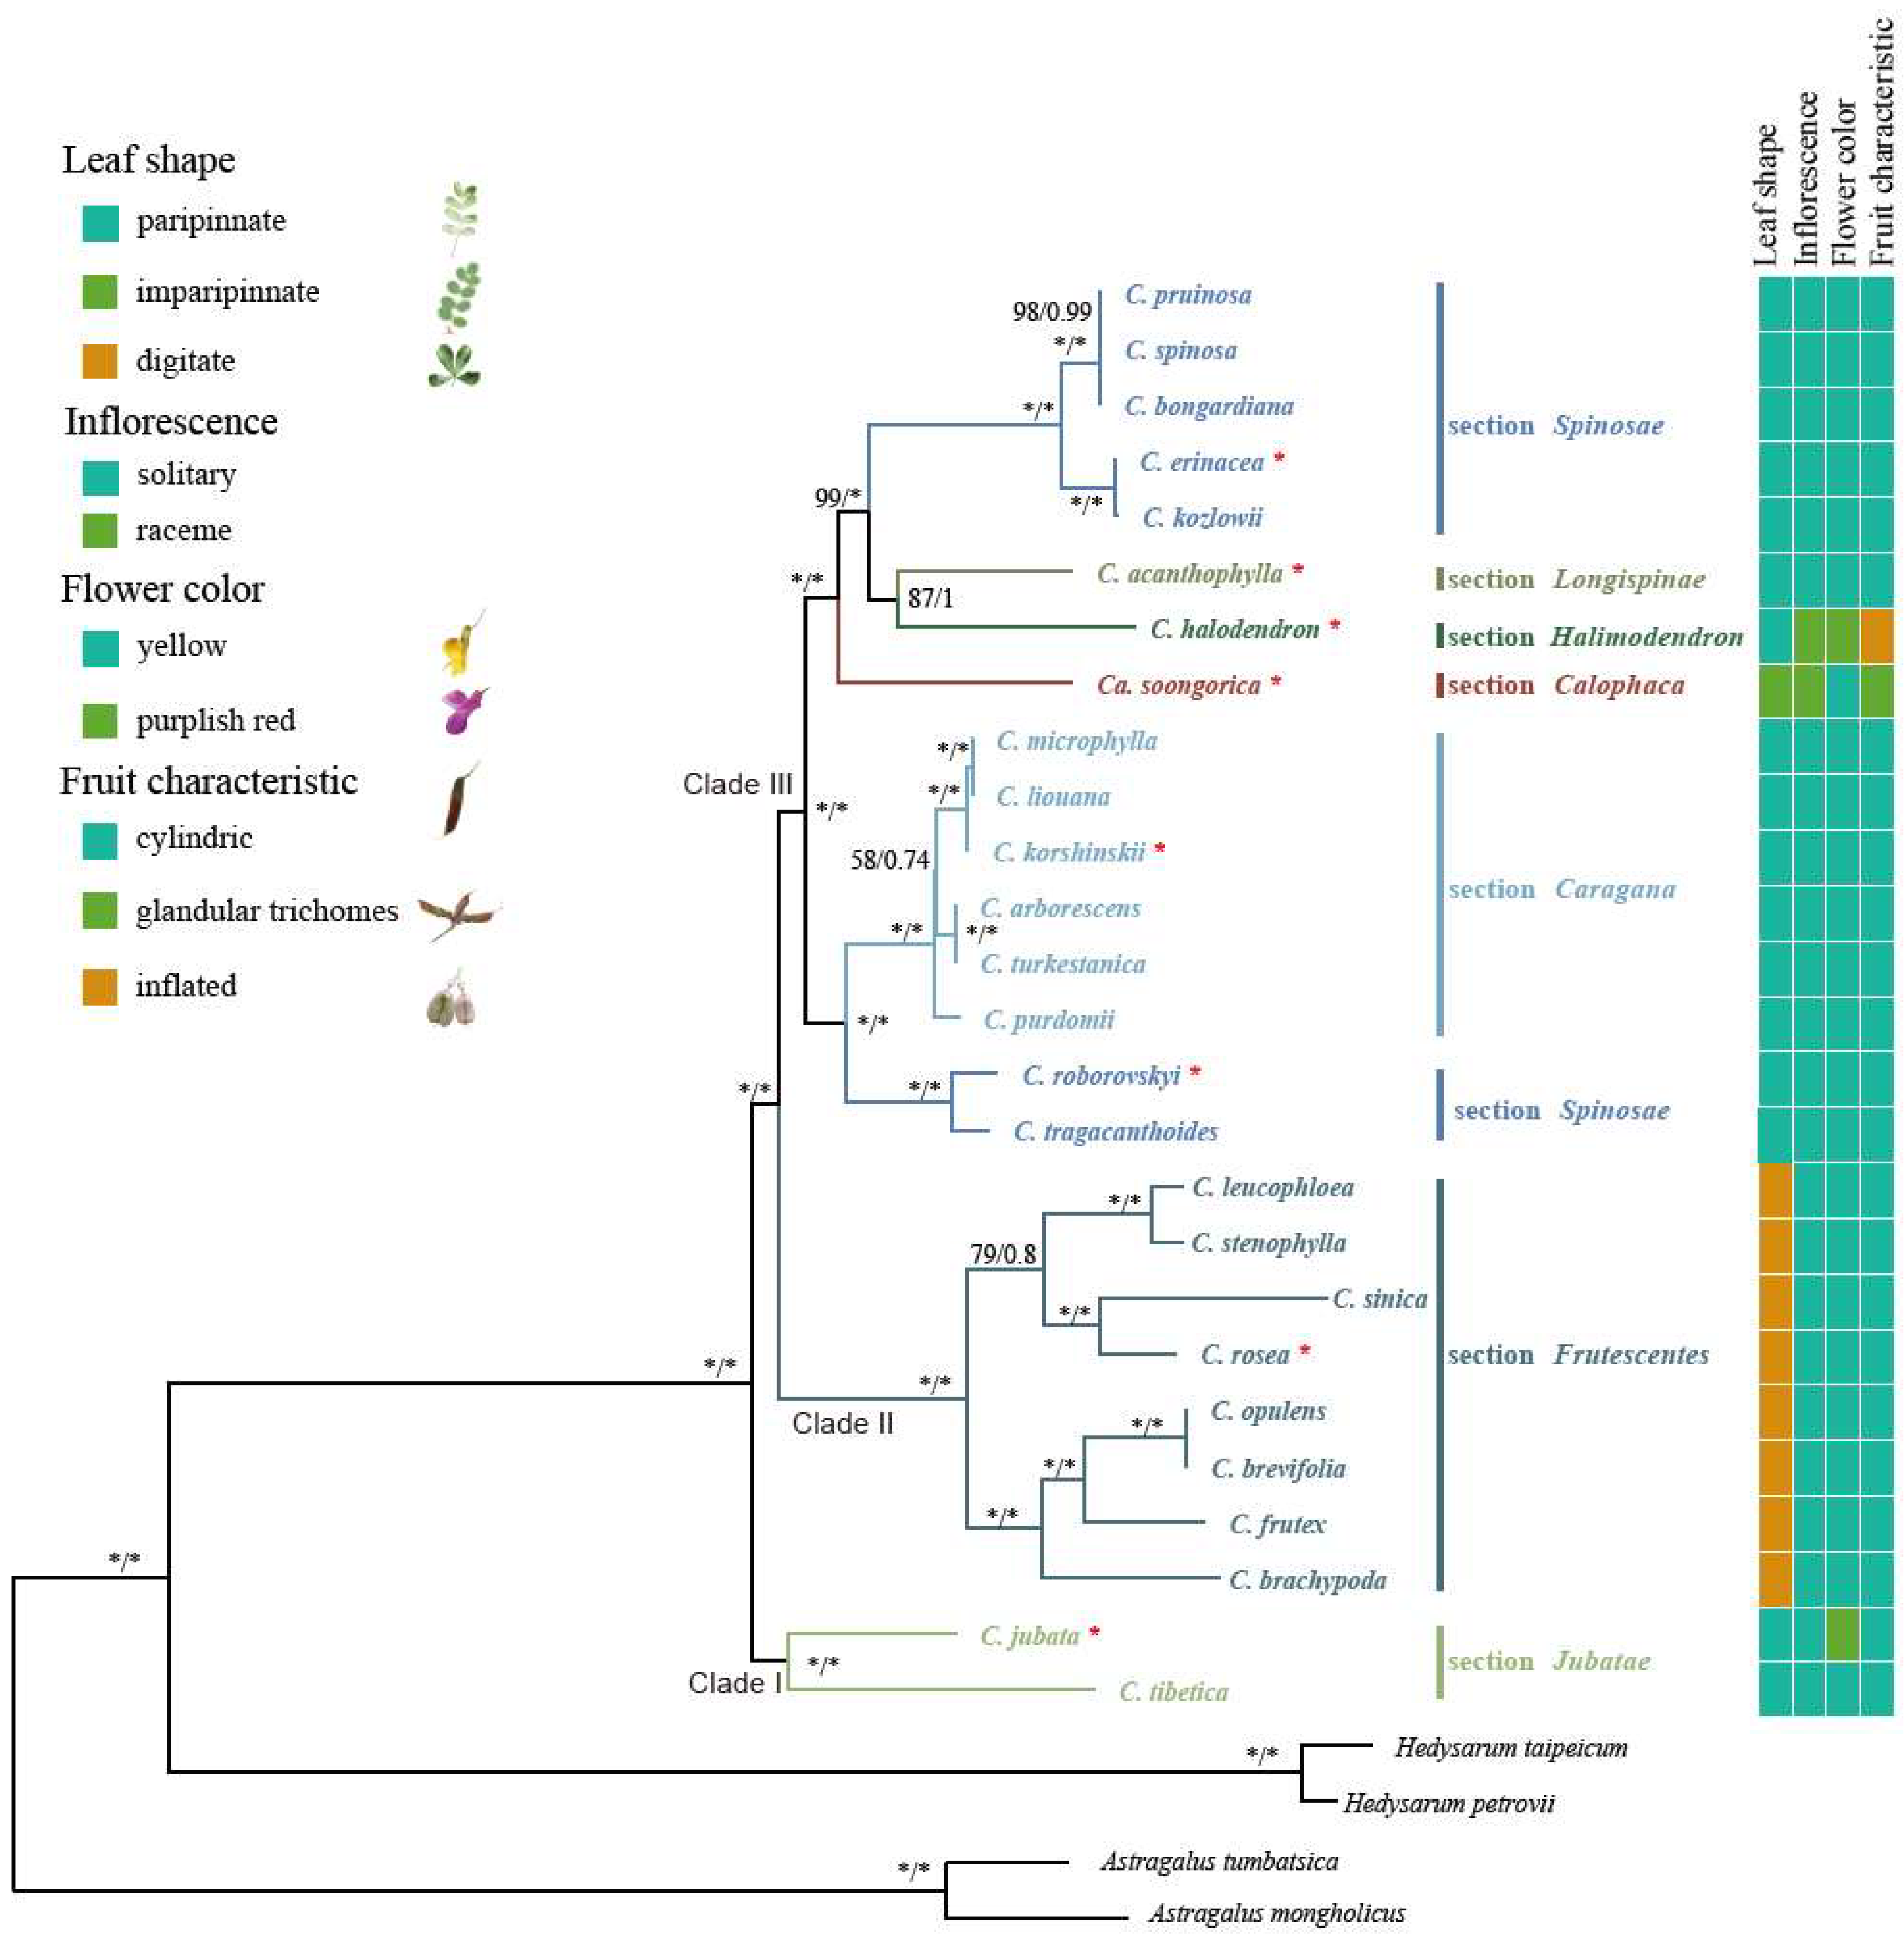
2.6. Phylogenetic Analysis

The genera Caragana included seven sections: Caragana, Calophaca, Halimodendron, Spinosae, Longispinae, Jubatae, and Frutescentes. A total of 26 Caragana (including genus Halimodendron and Calophaca) chloroplast genomes were used for phylogenetic investigation to elucidate the phylogenetic relationships of Caragana at the section level. The species Astragalus tumbatsica, Astragalus mongholicus, Hedysarum taipeicum, and Hedysarum petrovii were used as outgroups in the analysis.
Both maximum likelihood (ML) and Bayesian inference (BI) approaches yielded consistent tree structures (Figure 8), with robust support for the monophyly of the genus Caragana, which was evident in both analyses (bootstrap value (BS) = 100%; posterior probability (PP) = 1.0). The Caragana phylogenetic trees were strongly supported, indicating that the relationships among the Caragana species were well resolved based on the whole chloroplast genome sequences. These species of Caragana formed three clades with high support. Clade I, consisting of the section Jubatae, was the first group of this genera to diverge. The section Frutescentes formed Clade II and was sister to the rest of Caragana. The section Frutescentes further diverged into two groups. Clade III included two main groups; section Caragana was sister to section Spinosae and formed a group. The four sections of Calophaca, Halimodendron, Longispinae, and Spinosae formed a clade with high support (BB = 100%; PP = 1.0), and section Calophaca was sister to the other three sections. The section Spinosae did not form a clade and was divided into two groups.

3. Discussion

3.1. Structure and Comparative Analysis of Caragana Chloroplast Genomes

In this study, we sequenced eight species (Figure 1) of Caragana, each from a different section, and we compared the chloroplast genome variations and mutations. The chloroplast genome length ranged from 128,458 bp to 135,401 bp, which is significantly shorter than other angiosperms [12,13,19]. The shorter genome lengths were due to the loss of the inverted repeat (IR) region (Figure 2). Caragana, as a member of the tribe Caraganeae, is categorized within the IR-lacking clade (IRLC) in the subfamily Papilionoideae of Fabaceae. The loss of the chloroplast genome IR region in IRLC taxa, which is recognized as a robust phylogenetic indicator within the clade, has been consistently validated in prior research [20,21,22].
The loss of IR regions likely leads to mechanisms such as increased mutation rates, facilitated genome rearrangements, and altered selection pressures and intron structure, significantly accelerating the rate of evolution of the chloroplast genome [23]. Numerous studies have shown gene and intron loss, such as the loss of introns from the rps12 and clpP genes in chickpea (Cicer arietinum) [24], loss of the accD gene in Trifolium [25,26], and loss of rpl22, rps16, and one intron of clpP in Vicia [27]. In this study, the rpl22 and infA genes in the Caragana chloroplast genomes were lost (Figure 2). The infA gene is a notably labile chloroplast gene, and there are multiple independent cases of its loss or transfer to the nucleus in flowering plants [28]. The gene rpl22, encoding ribosomal protein CL22, also has been lost from the chloroplast genomes and translocated to the nucleus [29].
The significant difference in chloroplast genome size between Caragana and other angiosperms indicates that IRLC chloroplast genomes may have undergone different evolutionary processes. Compared to other angiosperm species, the GC content in the Caragana chloroplast genome is lower due to the IR region generally displaying higher GC content compared to other regions of the chloroplast genome. This disparity is primarily attributed to the presence of four rRNA genes with high GC content (50–56.4%) in the IRs. Similar to GC content, codon usage biases also showed differences from other species, including both IR regions, indicating significant molecular evolutionary processes. Notably, Caragana chloroplast genomes exhibited similar GC content and codon usage bias to other IRLC species [30].
Repeat sequences play a crucial role in genome rearrangements and serve as significant markers in evolutionary studies [31]. We identified four types of long repeats and SSRs. Forward repeats were the most frequent in the Caragana chloroplast genomes, and complementary repeats were the lowest (Figure 4). There are minor variations in the numbers and types of repeats among closely related species (Figure 5). Nonetheless, the number of repeats displayed noteworthy variability across the eight Caragana species, indicating heterogeneous evolution in the Caragana chloroplast genomes. SSRs exhibit high levels of polymorphism at the species level. They have been extensively studied in the field of population genetics, and variation has been documented [32,33]. In the current study, mononucleotide repeats were highly abundant, predominantly comprising A/T repeats rather than G/C repeats (Figure 3). This strong bias toward A/T in SSR loci was also noted in other legumes, such as Albizia julibrissin [34] and Desmodium stryacifolium [35].

3.2. Phylogenetic Relationships among the Sections of Caragana

We reconstructed a robust phylogenetic tree with high bootstrap values using chloroplast genomes. The findings do not support the results of Zhao [5], who classified Caragana into three subgenera. The results of the current study support the monophyly of Caragana and classify Calophaca and Halimodendron as sections [6]. Previous studies have shown that the monophyly of sections Longispinae, Spinosae, Frutescentes, and Jubatae is difficult to recover based on the small number of molecular markers [11], but we recovered the monophyly of sections Frutescentes and Jubatae. Our results strongly suggest that Caragana be split into two clades with seven sections. Section Jubata was found to be a sister to the most recent common ancestor of the other six sections and was thus identified as the basal clade. The next to be differentiated was section Frutescentes. The sister relationship of section Longispinae and Halimodendron was not strong (bootstrap value = 87). The monophyly of section Spinosae was not recovered, and future studies with nuclear genetic data representing biparental inheritance and more complete species sampling will be required [36], as well as further study of the cause of conflict by comparing the phylogenetic relationships of nuclear genes and plastids.
Our phylogenetic results are consistent with the existing morphological taxonomic consensus [5]. Section Calophaca has some unique traits, such as imparipinnate leaves and racemes with glandular trichomes, and we speculated that these traits are derived characteristics. Section Halimodendron has racemes, pale purple or purplish red corollas, inflated legumes, and thick valves. It has a strong tolerance to drought and salinity, and its habitats vary greatly from those of other species in the genus Caragana. We propose that section Calophaca likely experienced a unique adaptive evolutionary history. The leaf morphology of Caragana is diverse and is mainly divided into paripinnate (4–20-foliolate) and digitate (4-foliolate). All members of section Frutescentes have digitated leaves. Section Frutescentes also has the highest species richness, covering 36% of Caragana, which is likely related to trait innovation. Section Caragana has caducous rachis, pinnate leaves, and 4–10 pairs of leaflets. Section Jubata has persistent rachis, pinnate leaves, and three–seven pairs of leaflets and is mostly distributed in high-elevation regions. The leaflets of section Spinosae are pinnate on the rachis of long branches, digitate or pinnate connected on the rachis of short branches, and are often found in two–three pairs. Section Longispinae has three–nine leaflet pairs and generally either long branches with persistent rachis or short branches with caducous rachis.

4. Materials and Methods

4.1. Plant Material, DNA Extraction, and Sequencing

According to the taxonomic system of Caragana, six Caragana s.s. species, one Halimodendron species (Halimodendron halodendron), and one Calophaca species (Calophaca soongorica) were selected for this study (Figure 1), representing all the eight sections of Caragana. Fresh leaves were collected from various regions in China, including Xinjiang, Xizang, Gansu, Sichuan, Hebei, and Beijing. The fresh leaves were dried with silica gel. Details on the material are provided in Table S1. The plant materials were identified by Prof. Zhixiang Zhang (Beijing Forestry University). Voucher specimens were deposited at the museum of Beijing Forestry University (BJFC) under voucher specimen numbers BJFC00024602, BJFC00120870, BJFC00120894, ZJK05210301, FS05270301, and SC060501.
Genomic DNA was extracted following the methods of Li et al. [37]. The quality and quantity of extracted DNA were evaluated with a Qubit 3.0 Fluorometer (Thermo Fisher Scientific, Waltham, MA, USA). Then, 300 ng of DNA for each sample was randomly sheared into ~350-bp fragments using an Ultrasound Covaris instrument. The paired-end sequencing library was generated and sequenced on the DNBSEQ-T7 platform to generate 150 bp paired-end reads. For each sample, approximately 5 GB of raw data was obtained.

4.2. Chloroplast Genome Assembly and Annotation

Trimmomatic 0.36 [38] was used to check the sequencing quality of the raw data, such as adapter-contaminated reads and low-quality bases. The chloroplast genomes were de novo assembled with the GetOrganelle v1.6.2 [39] with parameter k-mer lengths of 95. If GetOrganelle was unable to assemble a complete chloroplast genome, the method of Dong et al. [13,40] was used to complete the assembly. Plastid Genome Annotator (PGA) Version 3 [41] was used to annotate the newly sequenced chloroplast genomes. Geneious Prime was used to check and revise the annotation errors manually. The online software Chloroplast (https://irscope.shinyapps.io/Chloroplot/, accessed on 21 May 2024) was used to draw the physical maps.

4.3. Analysis of Repeat Sequences and SSRs

We used MISA (http://pgrc.ipk-gatersleben.de/misa/, accessed on 21 May 2024) to identify the simple sequence repeats (SSRs) within the eight Caragana species [42]. Six types of SSRs (mononucleotide, dinucleotide, trinucleotide, tetranucleotide, pentanucleotide, and hexanucleotide SSRs) were analyzed, and the repeat thresholds were set to 10, 5, 4, 3, 3, and 3, respectively. Moreover, we used REPuter (https://bibiserv.cebitec.uni-bielefeld.de/reputer/, accessed on 23 May 2024) to identify the four types of dispersed repeats (forward, palindromic, reverse, and complementary repeats). The parameters were set as follows: a repeat identity of more than 90%, a minimum repeat size of 30 bp, and a hamming distance of 3.

4.4. Comparative Genomic Analyses and Molecular Evolution Analysis

The Caragana chloroplast genome structure variation was examined using mVISTA (https://genome.lbl.gov/vista/mvista/submit.shtml, accessed on 23 May 2024) [43] with the shuffle-LAGAN model. The chloroplast genome of Caragana erinacea was used as the reference sequence.
We calculated relative synonymous codon usage (RSCU), which is the ratio of the observed frequency of a specific codon to the expected frequency, with CodonW v1.4.2. The R package Pvclust was used to assess the uncertainty in hierarchical cluster analysis [44]. The RSCU values were then plotted as a heatmap using TBtools 1.116 [45].
We computed the non-synonymous substitution ratio (dN), synonymous substitution ratio (dS), and dN/dS ratio (ω) to investigate the molecular evolution within the Caragana chloroplast genomes. This evaluation facilitates the examination of evolutionary rates and the impact of natural selection on molecular evolution. Hedysarum taipeicum served as the reference species in these analyses.
We extracted all protein-coding genes with PhyloSuite v1.2.3 according to genome annotation [46] and aligned with MAFFT v7.471. The dN, dS, and ω values were determined utilizing the YN100 method in PAML v4.10.3 [47]. These calculations were conducted for gene clusters sharing identical functions [48], and at the species level, they were combined with all coding genes for each species.

4.5. Phylogenetic Analysis

The phylogenetic relationships of Caragana were reconstructed using the chloroplast genome sequences. In addition to the chloroplast genomes sequenced in this study, complete Caragana chloroplast genomes (publicly available in NCBI) were used (Table S2). Four species from two genera were designed as outgroups according to a previous phylogenetic study [49]. We aligned the whole chloroplast genome sequences with MAFFT [50] with default parameters and detected the unreliable alignment regions with trimAl v1.4.1 [51].
We performed the phylogenetic analyses using two methods: maximum likelihood (ML) and Bayesian inference (BI). ModelFinder v1.5.4 was used to determine the best substitution model [52]. The ML tree was reconstructed using IQ-TREE v2.0.3 [53] with 1000 bootstrap replicates. The BI tree was inferred using MrBayes 3.2 [54]. Four MCMC simulations were run simultaneously and sampled every 1000 generations for a total of two million generations. The first 25% of each tree was discarded as burn-in. We used Tracer v1.7 [55] to analyze the effective size of each parameter and the convergence to a stationary distribution, and we estimated posterior probabilities using a 50% majority-rule consensus tree.

Supplementary Materials

The following supporting information can be downloaded at: https://www.mdpi.com/article/10.3390/ijms25126786/s1.

Author Contributions

Conceptualization, project administration: W.D. and Z.Z.; Data curation, investigation, conceptualization, and resources: X.C., K.L. and E.L.; Funding acquisition: Z.Z. and W.D.; Writing-review and editing, visualization, and supervision: X.C. and W.D. All authors have read and agreed to the published version of the manuscript.

Funding

This study was financially supported by the Survey of Herbaceous Germplasm Resources in Shandong Province (Grant No. Lu Financial [2021]1), Science and Technology Basic Resources. Investigation Program of China (Grant No. 2021FY100200), and CACMS Innovation Fund (Grant No. CI2021A03909).

Institutional Review Board Statement

Not applicable.

Informed Consent Statement

Not applicable.

Data Availability Statement

The chloroplast genome of Caragana is deposited in the GenBank database under the following accession number: PP848196, PP897764-PP897770.

Conflicts of Interest

The authors declare no conflict of interest.

References

  1. Roskov, Y.; Bisby, F.; Zarucchi, J.; Schrire, B.; White, R.J.R. ILDIS World Database of Legumes: Draft Checklist, 10th ed.; Mini CD-ROM: Reading, UK, 2005; ISBN 070491-2481. [Google Scholar]
  2. Lewis, G.P.; Schrire, B.; Mackinder, B.; Lock, M. Legumes of the World; Royal Botanic Gardens Kew: London, UK, 2005. [Google Scholar]
  3. Du, L.-T.; Ma, L.-L.; Pan, H.-Z.; Qiao, C.-L.; Meng, C.; Wu, H.-Y.; Tian, J.; Yuan, H.-Y. Carbon–water coupling and its relationship with environmental and biological factors in a planted Caragana liouana shrub community in desert steppe, northwest China. J. Plant Ecol. 2022, 15, 947–960. [Google Scholar] [CrossRef]
  4. Zhang, M.L.; Xiang, X.G.; Xue, J.J.; Sanderson, S.C.; Fritsch, P.W. Himalayan uplift shaped biomes in Miocene temperate Asia: Evidence from leguminous Caragana. Sci. Rep. 2016, 6, 36528. [Google Scholar] [CrossRef]
  5. Zhao, Y. Classification and Its Floristic Geography of Caragana Fabr. in the World; Inner Mongolia University Press: Hohhot, China, 2009. [Google Scholar]
  6. Duan, L.; Yang, X.; Liu, P.L.; Johnson, G.; Wen, J.; Chang, Z.Y. A molecular phylogeny of Caraganeae (Leguminosae, Papilionoideae) reveals insights into new generic and infrageneric delimitations. PhytoKeys 2016, 70, 111–137. [Google Scholar] [CrossRef]
  7. Zhang, M.L.; Wen, Z.B.; Fritsch, P.W.; Sanderson, S.C. Spatiotemporal evolution of Calophaca (Fabaceae) reveals multiple dispersals in central Asian mountains. PLoS ONE 2015, 10, e0123228. [Google Scholar] [CrossRef]
  8. Wu, Z.; Raven, P.; Hong, D. Flora of China, Volume 10: Fabaceae; Missouri Botanical Garden Press: St. Louis, MO, USA, 2010. [Google Scholar]
  9. Zhang, M.; Xue, J.; Zhang, Q.; Sanderson, S.C. Inferring ancestral distribution area and survival vegetation of Caragana (Fabaceae) in Tertiary. Plant Syst. Evol. 2015, 301, 1831–1842. [Google Scholar] [CrossRef]
  10. Hou, X.; Liu, J.E.; Zhao, Y.Z. Molecular phylogeny of Caragana (Fabaceae) in China. J. Syst. Evol. 2008, 46, 600–607. [Google Scholar]
  11. Zhang, M.; Fritsch, P.W.; Cruz, B.C. Phylogeny of Caragana (Fabaceae) based on DNA sequence data from rbcL, trnS-trnG, and ITS. Mol. Phylogenet. Evol. 2009, 50, 547–559. [Google Scholar] [CrossRef]
  12. Guo, C.; Liu, K.; Li, E.; Chen, Y.; He, J.; Li, W.; Dong, W.; Suo, Z. Maternal donor and genetic variation of Lagerstroemia indica cultivars. Int. J. Mol. Sci. 2023, 24, 3606. [Google Scholar] [CrossRef]
  13. Li, E.; Liu, K.; Deng, R.; Gao, Y.; Liu, X.; Dong, W.; Zhang, Z. Insights into the phylogeny and chloroplast genome evolution of Eriocaulon (Eriocaulaceae). BMC Plant Biol. 2023, 23, 32. [Google Scholar] [CrossRef]
  14. Liu, X.; Bai, Y.; Wang, Y.; Chen, Y.; Dong, W.; Zhang, Z. Complete Chloroplast Genome of Hypericum perforatum and Dynamic Evolution in Hypericum (Hypericaceae). Int. J. Mol. Sci. 2023, 24, 16130. [Google Scholar] [CrossRef]
  15. Dong, W.; Li, E.; Liu, Y.; Xu, C.; Wang, Y.; Liu, K.; Cui, X.; Sun, J.; Suo, Z.; Zhang, Z.; et al. Phylogenomic approaches untangle early divergences and complex diversifications of the olive plant family. BMC Biol. 2022, 20, 92. [Google Scholar] [CrossRef]
  16. Liu, L.; Li, H.; Li, J.; Li, X.; Hu, N.; Sun, J.; Zhou, W. Chloroplast genomes of Caragana tibetica and Caragana turkestanica: Structures and comparative analysis. BMC Plant Biol. 2024, 24, 254. [Google Scholar] [CrossRef]
  17. Jiang, M.; Chen, H.; He, S.; Wang, L.; Chen, A.J.; Liu, C. Sequencing, Characterization, and Comparative Analyses of the Plastome of Caragana rosea var. rosea. Int. J. Mol. Sci. 2018, 19, 1419. [Google Scholar] [CrossRef]
  18. Yuan, M.; Yin, X.; Gao, B.; Gu, R.; Jiang, G. The chloroplasts genomic analyses of four specific Caragana species. PLoS ONE 2022, 17, e0272990. [Google Scholar] [CrossRef]
  19. Olejniczak, S.A.; Lojewska, E.; Kowalczyk, T.; Sakowicz, T. Chloroplasts: State of research and practical applications of plastome sequencing. Planta 2016, 244, 517–527. [Google Scholar] [CrossRef]
  20. Choi, I.S.; Jansen, R.; Ruhlman, T. Lost and Found: Return of the Inverted Repeat in the Legume Clade Defined by Its Absence. Genome Biol. Evol. 2019, 11, 1321–1333. [Google Scholar] [CrossRef]
  21. Jiao, Y.X.; He, X.F.; Song, R.; Wang, X.M.; Zhang, H.; Aili, R.; Chao, Y.H.; Shen, Y.H.; Yu, L.X.; Zhang, T.J.; et al. Recent structural variations in the Medicago chloroplast genomes and their horizontal transfer into nuclear chromosomes. J. Syst. Evol. 2023, 61, 627–642. [Google Scholar] [CrossRef]
  22. Lee, C.; Choi, I.S.; Cardoso, D.; de Lima, H.C.; de Queiroz, L.P.; Wojciechowski, M.F.; Jansen, R.K.; Ruhlman, T.A. The chicken or the egg? Plastome evolution and an independent loss of the inverted repeat in papilionoid legumes. Plant J. 2021, 107, 861–875. [Google Scholar]
  23. Ping, J.; Hao, J.; Li, J.; Yang, Y.; Su, Y.; Wang, T. Loss of the IR region in conifer plastomes: Changes in the selection pressure and substitution rate of protein-coding genes. Ecol. Evol. 2022, 12, e8499. [Google Scholar] [CrossRef]
  24. Jansen, R.K.; Wojciechowski, M.F.; Sanniyasi, E.; Lee, S.B.; Daniell, H. Complete plastid genome sequence of the chickpea (Cicer arietinum) and the phylogenetic distribution of rps12 and clpP intron losses among legumes (Leguminosae). Mol. Phylogenet. Evol. 2008, 48, 1204–1217. [Google Scholar] [CrossRef]
  25. Cai, Z.Q.; Guisinger, M.; Kim, H.G.; Ruck, E.; Blazier, J.C.; McMurtry, V.; Kuehl, J.V.; Boore, J.; Jansen, R.K. Extensive Reorganization of the Plastid Genome of Trifolium subterraneum (Fabaceae) Is Associated with Numerous Repeated Sequences and Novel DNA Insertions. J. Mol. Evol. 2008, 67, 696–704. [Google Scholar] [CrossRef]
  26. Sveinsson, S.; Cronk, Q. Evolutionary origin of highly repetitive plastid genomes within the clover genus (Trifolium). BMC Evol. Biol. 2014, 14, 228. [Google Scholar] [CrossRef]
  27. Jo, I.-H.; Han, S.; Shim, D.; Ryu, H.; Hyun, T.K.; Lee, Y.; Kim, D.; So, Y.-S.; Chung, J.-W. Complete Chloroplast Genome of the Inverted Repeat-Lacking Species Vicia bungei and Development of Polymorphic Simple Sequence Repeat Markers. Front. Plant Sci. 2022, 13, 891783. [Google Scholar] [CrossRef]
  28. Millen, R.S.; Olmstead, R.G.; Adams, K.L.; Palmer, J.D.; Lao, N.T.; Heggie, L.; Kavanagh, T.A.; Hibberd, J.M.; Gray, J.C.; Morden, C.W.; et al. Many parallel losses of infA from chloroplast DNA during angiosperm evolution with multiple independent transfers to the nucleus. Plant Cell 2001, 13, 645–658. [Google Scholar] [CrossRef]
  29. Jansen, R.K.; Saski, C.; Lee, S.B.; Hansen, A.K.; Daniell, H. Complete plastid genome sequences of three Rosids (Castanea, Prunus, Theobroma): Evidence for at least two independent transfers of rpl22 to the nucleus. Mol. Biol. Evol. 2011, 28, 835–847. [Google Scholar] [CrossRef]
  30. Moghaddam, M.; Ohta, A.; Shimizu, M.; Terauchi, R.; Kazempour-Osaloo, S. The complete chloroplast genome of Onobrychis gaubae (Fabaceae-Papilionoideae): Comparative analysis with related IR-lacking clade species. BMC Plant Biol. 2022, 22, 75. [Google Scholar] [CrossRef] [PubMed]
  31. Weng, M.-L.; Blazier, J.C.; Govindu, M.; Jansen, R.K. Reconstruction of the Ancestral Plastid Genome in Geraniaceae Reveals a Correlation between Genome Rearrangements, Repeats, and Nucleotide Substitution Rates. Mol. Biol. Evol. 2014, 31, 645–659. [Google Scholar] [CrossRef]
  32. Liu, H.; Zhao, W.; Hua, W.; Liu, J. A large-scale population based organelle pan-genomes construction and phylogeny analysis reveal the genetic diversity and the evolutionary origins of chloroplast and mitochondrion in Brassica napus L. BMC Genom. 2022, 23, 339. [Google Scholar] [CrossRef]
  33. Xiong, Y.; Xiong, Y.L.; Jia, X.J.; Zhao, J.M.; Yan, L.J.; Sha, L.N.; Liu, L.; Yu, Q.Q.; Lei, X.; Bai, S.Q. Divergence in Elymus sibiricus is related to geography and climate oscillation: A new look from pan-chloroplast genome data. J. Syst. Evol. 2023. [Google Scholar] [CrossRef]
  34. Zhang, J.; Huang, H.; Qu, C.; Meng, X.; Meng, F.; Yao, X.; Wu, J.; Guo, X.; Han, B.; Xing, S. Comprehensive analysis of chloroplast genome of Albizia julibrissin Durazz. (Leguminosae sp.). Planta 2021, 255, 26. [Google Scholar] [CrossRef]
  35. Yen, L.-T.; Kousar, M.; Park, J. Comparative Analysis of Chloroplast Genome of Desmodium stryacifolium with Closely Related Legume Genome from the Phaseoloid Clade. Int. J. Mol. Sci. 2023, 24, 6072. [Google Scholar] [CrossRef] [PubMed]
  36. Ge, S. A review of recent studies of plant systematics and evolution in China. Biodivers. Sci. 2022, 30, 22385. [Google Scholar] [CrossRef]
  37. Li, J.L.; Wang, S.; Yu, J.; Wang, L.; Zhou, S.L. A Modified CTAB Protocol for Plant DNA Extraction. Chin. Bull. Bot. 2013, 48, 72–78. [Google Scholar]
  38. Bolger, A.M.; Lohse, M.; Usadel, B. Trimmomatic: A flexible trimmer for Illumina sequence data. Bioinformatics 2014, 30, 2114–2120. [Google Scholar] [CrossRef] [PubMed]
  39. Jin, J.-J.; Yu, W.-B.; Yang, J.-B.; Song, Y.; dePamphilis, C.W.; Yi, T.-S.; Li, D.-Z. GetOrganelle: A fast and versatile toolkit for accurate de novo assembly of organelle genomes. Genome Biol. 2020, 21, 241. [Google Scholar] [CrossRef] [PubMed]
  40. Dong, W.; Liu, Y.; Li, E.; Xu, C.; Sun, J.; Li, W.; Zhou, S.; Zhang, Z.; Suo, Z. Phylogenomics and biogeography of Catalpa (Bignoniaceae) reveal incomplete lineage sorting and three dispersal events. Mol. Phylogenet. Evol. 2022, 166, 107330. [Google Scholar] [CrossRef] [PubMed]
  41. Qu, X.-J.; Moore, M.J.; Li, D.-Z.; Yi, T.-S. PGA: A software package for rapid, accurate, and flexible batch annotation of plastomes. Plant Methods 2019, 15, 50. [Google Scholar] [CrossRef] [PubMed]
  42. Beier, S.; Thiel, T.; Munch, T.; Scholz, U.; Mascher, M. MISA-web: A web server for microsatellite prediction. Bioinformatics 2017, 33, 2583–2585. [Google Scholar] [CrossRef] [PubMed]
  43. Frazer, K.A.; Pachter, L.; Poliakov, A.; Rubin, E.M.; Dubchak, I. VISTA: Computational tools for comparative genomics. Nucleic Acids Res. 2004, 32, W273–W279. [Google Scholar] [CrossRef]
  44. Suzuki, R.; Shimodaira, H. Pvclust: An R package for assessing the uncertainty in hierarchical clustering. Bioinformatics 2006, 22, 1540–1542. [Google Scholar] [CrossRef]
  45. Chen, C.; Chen, H.; Zhang, Y.; Thomas, H.R.; Frank, M.H.; He, Y.; Xia, R. TBtools: An Integrative Toolkit Developed for Interactive Analyses of Big Biological Data. Mol. Plant 2020, 13, 1194–1202. [Google Scholar] [CrossRef] [PubMed]
  46. Zhang, D.; Gao, F.; Jakovlic, I.; Zou, H.; Zhang, J.; Li, W.X.; Wang, G.T. PhyloSuite: An integrated and scalable desktop platform for streamlined molecular sequence data management and evolutionary phylogenetics studies. Mol. Ecol. Resour. 2020, 20, 348–355. [Google Scholar] [CrossRef] [PubMed]
  47. Xu, B.; Yang, Z. PAMLX: A graphical user interface for PAML. Mol. Biol. Evol. 2013, 30, 2723–2724. [Google Scholar] [CrossRef] [PubMed]
  48. Dong, W.; Xu, C.; Cheng, T.; Zhou, S. Complete chloroplast genome of Sedum sarmentosum and chloroplast genome evolution in Saxifragales. PLoS ONE 2013, 8, e77965. [Google Scholar] [CrossRef] [PubMed]
  49. Duan, L.; Li, S.J.; Su, C.; Sirichamorn, Y.; Han, L.N.; Ye, W.; Loc, P.K.; Wen, J.; Compton, J.A.; Schrire, B.; et al. Phylogenomic framework of the IRLC legumes (Leguminosae subfamily Papilionoideae) and intercontinental biogeography of tribe Wisterieae. Mol. Phylogenet. Evol. 2021, 163, 107235. [Google Scholar] [CrossRef] [PubMed]
  50. Katoh, K.; Standley, D.M. MAFFT multiple sequence alignment software version 7: Improvements in performance and usability. Mol. Biol. Evol. 2013, 30, 772–780. [Google Scholar] [CrossRef] [PubMed]
  51. Capella-Gutiérrez, S.; Silla-Martínez, J.M.; Gabaldón, T. trimAl: A tool for automated alignment trimming in large-scale phylogenetic analyses. Bioinformatics 2009, 25, 1972–1973. [Google Scholar] [CrossRef] [PubMed]
  52. Kalyaanamoorthy, S.; Minh, B.Q.; Wong, T.K.F.; von Haeseler, A.; Jermiin, L.S. ModelFinder: Fast model selection for accurate phylogenetic estimates. Nat. Methods 2017, 14, 587–589. [Google Scholar] [CrossRef] [PubMed]
  53. Minh, B.Q.; Schmidt, H.A.; Chernomor, O.; Schrempf, D.; Woodhams, M.D.; von Haeseler, A.; Lanfear, R. IQ-TREE 2: New models and efficient methods for phylogenetic inference in the genomic era. Mol. Biol. Evol. 2020, 37, 1530–1534. [Google Scholar] [CrossRef]
  54. Ronquist, F.; Teslenko, M.; van der Mark, P.; Ayres, D.L.; Darling, A.; Hohna, S.; Larget, B.; Liu, L.; Suchard, M.A.; Huelsenbeck, J.P. MrBayes 3.2: Efficient Bayesian phylogenetic inference and model choice across a large model space. Syst. Biol. 2012, 61, 539–542. [Google Scholar] [CrossRef]
  55. Rambaut, A.; Drummond, A.J.; Xie, D.; Baele, G.; Suchard, M.A. Posterior summarization in Bayesian phylogenetics using Tracer 1.7. Syst. Biol. 2018, 67, 901–904. [Google Scholar] [CrossRef]
Figure 1. The morphology of the species sequenced in this study. (a) Caragana erinacea; (b) C. acanthophylla; (c) C. halodendron; (d) C. roborovskyi; (e) Calophaca soongorica; (f) C. rosea; (g) C. korshinskii; (h) C. jubata.
Ijms 25 06786 g001
Figure 2. Gene map of the chloroplast genomes of Caragana species. Genes outside the ring are transcribed in a counterclockwise direction, whereas those inside the ring are transcribed in a clockwise direction. The GC content of the chloroplast genome is shown in the dark gray region, and the AT content is shown in the light gray region. Calophaca soongorica has the abbreviation of Ca. soongorica.
Ijms 25 06786 g002
Figure 3. Number and type of simple sequence repeats (SSRs) of eight Caragana species in the chloroplast genome. (a) Number of six types of SSRs. (b) Number of base types of SSRs.
Ijms 25 06786 g003
Figure 4. Number and type of dispersed repeats of eight Caragana species in the chloroplast genome. (a) Number and type of long repeats in dispersed repeats. (b) Length and frequency of forward long repeats. (c) Length and frequency of palindromic long repeats. (d) Length and frequency of reverse long repeats.
Ijms 25 06786 g004
Figure 5. Sequence similarity plots of eight chloroplast genomes of Caragana, which were constructed using mVISTA (C. erinacea was used as the reference sequence). The proportion of sequence identity is displayed on the y-axis and ranges from 50% to 100%. The x-axis indicates the co-ordinates of the chloroplast genomes. Genomic regions are color-coded as protein-coding (exon), intron, intergenic region space (IGS), and rRNA. Genes are indicated by gray arrows.
Ijms 25 06786 g005
Figure 6. The relative synonymous codon usage (RSCU), calculated for eight species using CodonW.
Ijms 25 06786 g006
Figure 7. The non-synonymous substitution ratio (dN), synonymous substitution ratio (dS), and dN/dS ratio (ω), computed for eight species and gene groups using PAML. (ac) dN, dS, and ω values of eight species. (df) dN, dS, and ω values of gene groups with eight species.
Ijms 25 06786 g007
Figure 8. Phylogenetic tree, constructed using the maximum likelihood (ML) and Bayesian inference (BI) methods with chloroplast genomes. The number on the line represents the ML bootstrap support (BS) value and Bayesian posterior probability (PP) value for each node (in both, “*” in black font represents the BS 100 or PP 1.0). “*” in red font represents the newly sequenced chloroplast genomes. Important taxonomic characteristics are shown on the right side of the tree.
Ijms 25 06786 g008
Table 1. Features of the chloroplast genomes of eight Caragana species.
SpeciesLength (bp)GC (%)Number of Genes
TotalCoding GenestRNArRNA
Caragana erinacea131,34534.611076304
Caragana acanthophyllaa130,52334.511076304
Caragana halodendron129,14434.411076304
Calophaca soongorica128,81334.711076304
Caragana korshinskii130,05234.311076304
Caragana roborovskyi130,39234.411076304
Caragana rosea135,40134.811076304
Caragana jubata128,45834.411076304
Disclaimer/Publisher’s Note: The statements, opinions and data contained in all publications are solely those of the individual author(s) and contributor(s) and not of MDPI and/or the editor(s). MDPI and/or the editor(s) disclaim responsibility for any injury to people or property resulting from any ideas, methods, instructions or products referred to in the content.

