Article

Inter-Species Pharmacokinetic Modeling and Scaling for Drug Repurposing of Pyronaridine and Artesunate

College of Pharmacy, CHA University, 335 Pangyo-ro, Bundang-gu, Seongnam-si 13488, Gyeonggi-do, Republic of Korea
*
Author to whom correspondence should be addressed.
Int. J. Mol. Sci. 2024, 25(13), 6998; https://doi.org/10.3390/ijms25136998 (registering DOI)
Submission received: 10 May 2024 / Revised: 23 June 2024 / Accepted: 25 June 2024 / Published: 26 June 2024
(This article belongs to the Special Issue Drug Repurposing: Emerging Approaches to Drug Discovery)

Abstract

:
Even though several new targets (mostly viral infection) for drug repurposing of pyronaridine and artesunate have recently emerged in vitro and in vivo, inter-species pharmacokinetic (PK) data that can extend nonclinical efficacy to humans has not been reported over 30 years of usage. Since extrapolation of animal PK data to those of humans is essential to predict clinical outcomes for drug repurposing, this study aimed to investigate inter-species PK differences in three animal species (hamster, rat, and dog) and to support clinical translation of a fixed-dose combination of pyronaridine and artesunate. PK parameters (e.g., steady-state volume of distribution (Vss), clearance (CL), area under the concentration-time curve (AUC), mean residence time (MRT), etc.) of pyronaridine, artesunate, and dihydroartemisinin (an active metabolite of artesunate) were determined by non-compartmental analysis. In addition, one- or two-compartment PK modeling was performed to support inter-species scaling. The PK models appropriately described the blood concentrations of pyronaridine, artesunate, and dihydroartemisinin in all animal species, and the estimated PK parameters in three species were integrated for inter-species allometric scaling to predict human PKs. The simple allometric equation (Y = a × Wb) well explained the relationship between PK parameters and the actual body weight of animal species. The results from the study could be used as a basis for drug repurposing and support determining the effective dosage regimen for new indications based on in vitro/in vivo efficacy data and predicted human PKs in initial clinical trials.

Graphical Abstract

1. Introduction

Traditionally, pyronaridine has been used as a single agent or artemisinin-based combination therapy for malaria treatment [1]. The activity of pyronaridine is highly potent against Plasmodium falciparum, including strains resistant to other antimalarials [2]. In erythrocytes, malaria parasites digest hemoglobin for replication and neutralize the toxicity of free heme (released by hemoglobin digestion) by converting free heme into hemozoin [3]. Pyronaridine blocks the formation of hemozoin and facilitates the accumulation of toxic heme in the digestive vacuole of malaria parasites; thus, the growth and replication of parasites are inhibited [4]. Currently, pyronaridine has been approved only by the European Medicines Agency (EMA) under the brand name Pyramax® (Seoul, Republic of Korea) for the indication of the treatment of malaria infection as a fixed-dose combination with artesunate [5]. The World Health Organization (WHO) recommends artemisinin-based combination therapy for malaria treatment [6]. Short-acting artemisinin derivatives (artesunate, artemether, dihydroartemisinin, etc.) and long-acting antimalarial agents (pyronaridine, mefloquine, etc.) that have a different mechanism of action have been combined in artemisinin-based combination therapy [7]. Artesunate was approved by the Food and Drug Administration (FDA) in the United States under the brand name Amivas® (Wilmington, DE, USA) for treating severe malaria [8]. Although artesunate has antimalarial effects as a monotherapy, the 3:1 ratio of the pyronaridine:artesunate combination significantly lowers the ED90 of pyronaridine or artesunate administered alone [9,10]. Artesunate is rapidly and almost wholly hydrolyzed to dihydroartemisinin, the principal active metabolite of artesunate [9,11]. Artesunate undergoes biotransformation primarily in the liver, where it is metabolized to dihydroartemisinin (DHA) by cytochrome 2A6 and blood esterase [12]. Human liver microsomal incubations of DHA revealed the presence of only DHA-glucuronide as a metabolite (catalyzed by UGT1A9 and UGT2B7), while α-DHA-β-glucuronide (α-DHA-G) and varying amounts of the tetrahydrofuran isomer of α-DHA-G were identified in urine samples from patients, with DHA itself detected only in trace amounts [5,12]. Dihydroartemisinin is the active metabolite of all artemisinin-like compounds and has antimalarial effects with low toxicity [13]. The mechanism of action for artesunate and dihydroartemisinin includes heme polymerization, alkylating malarial proteins, and ROS generation, which results in oxidative damage to malaria parasites [14,15].
Recent studies have demonstrated pyronaridine has immune-modulatory activity in immune cells as well as anti-cancer activity via anti-mitochondrial activity, altering cell cycle progression, and intercalating DNA [16,17,18]. These studies have shown that pyronaridine may be a promising candidate for antiparasitic, anticancer, antiviral, etc. [19,20,21]. Artesunate and dihydroartemisinin have also been studied for their usage in non-malarial indications. Artesunate is well-tolerated and has shown high efficacy in anti-parasitic, anti-viral, anti-tumor, and anti-inflammatory effects [22,23,24]. Also, dihydroartemisinin regulates immune system function and inhibits tumor growth and inflammation, in addition to having antimalarial effects [13]. Based on the evidence from nonclinical studies, several attempts at drug repurposing of pyronaridine and artesunate have been ongoing. As a monotherapy, there is a ton of research for drug repurposing of pyronaridine for the treatment of breast cancer, Echinococcus granulosus infection, Ebola/Marburg virus infection, and severe acute respiratory syndrome coronavirus 2 (SARS-CoV-2) infection [18,19,20,25]. Also, new indications for treating metastatic renal cell carcinoma, hepatocellular carcinoma, hepatitis E virus, depression prevention, and ovarian cancer have been studied for artesunate [26,27,28,29,30,31]. In addition to the monotherapy, research for the approved drug, Pyramax® (3:1 fixed-dose combination of pyronaridine:artenusate), has been conducted to uncover new indications of Ebola virus, influenza, and SARS-CoV-2 disease for drug repurposing [32,33,34].
Drug repurposing of approved drugs is generally considered a time-saving, low-cost, and minimum-risk strategy to identify new therapeutic usage [35]. Since approved drugs have already established their safety in animals and humans, the drugs could be approved by evaluating their efficacy for the new indications in nonclinical studies and clinical trials [36]. In our previous study, the pharmacokinetics of pyronaridine and artesunate were evaluated in hamsters to support in vivo activity for drug repurposing to non-malarial effects [37]. Although new molecular targets of pyronaridine and artesunate (including dihydroartemisinin, its active metabolite) have continually emerged in recent years, PK data that could support those new efficacy data are insufficient. To support drug repurposing, this study described the inter-species PK differences of pyronaridine, artesunate, and dihydroartemisinin in three animal species (hamsters, rats, and dogs) and predicted the clinical PK by inter-species scaling of PK parameters. The PK parameters were estimated using non-compartmental analysis (NCA) and compartment PK modeling. Integrating the PK parameters in animal species, clinical PK parameters were predicted using the allometric scaling and compared with the reported human PK parameters.

2. Results

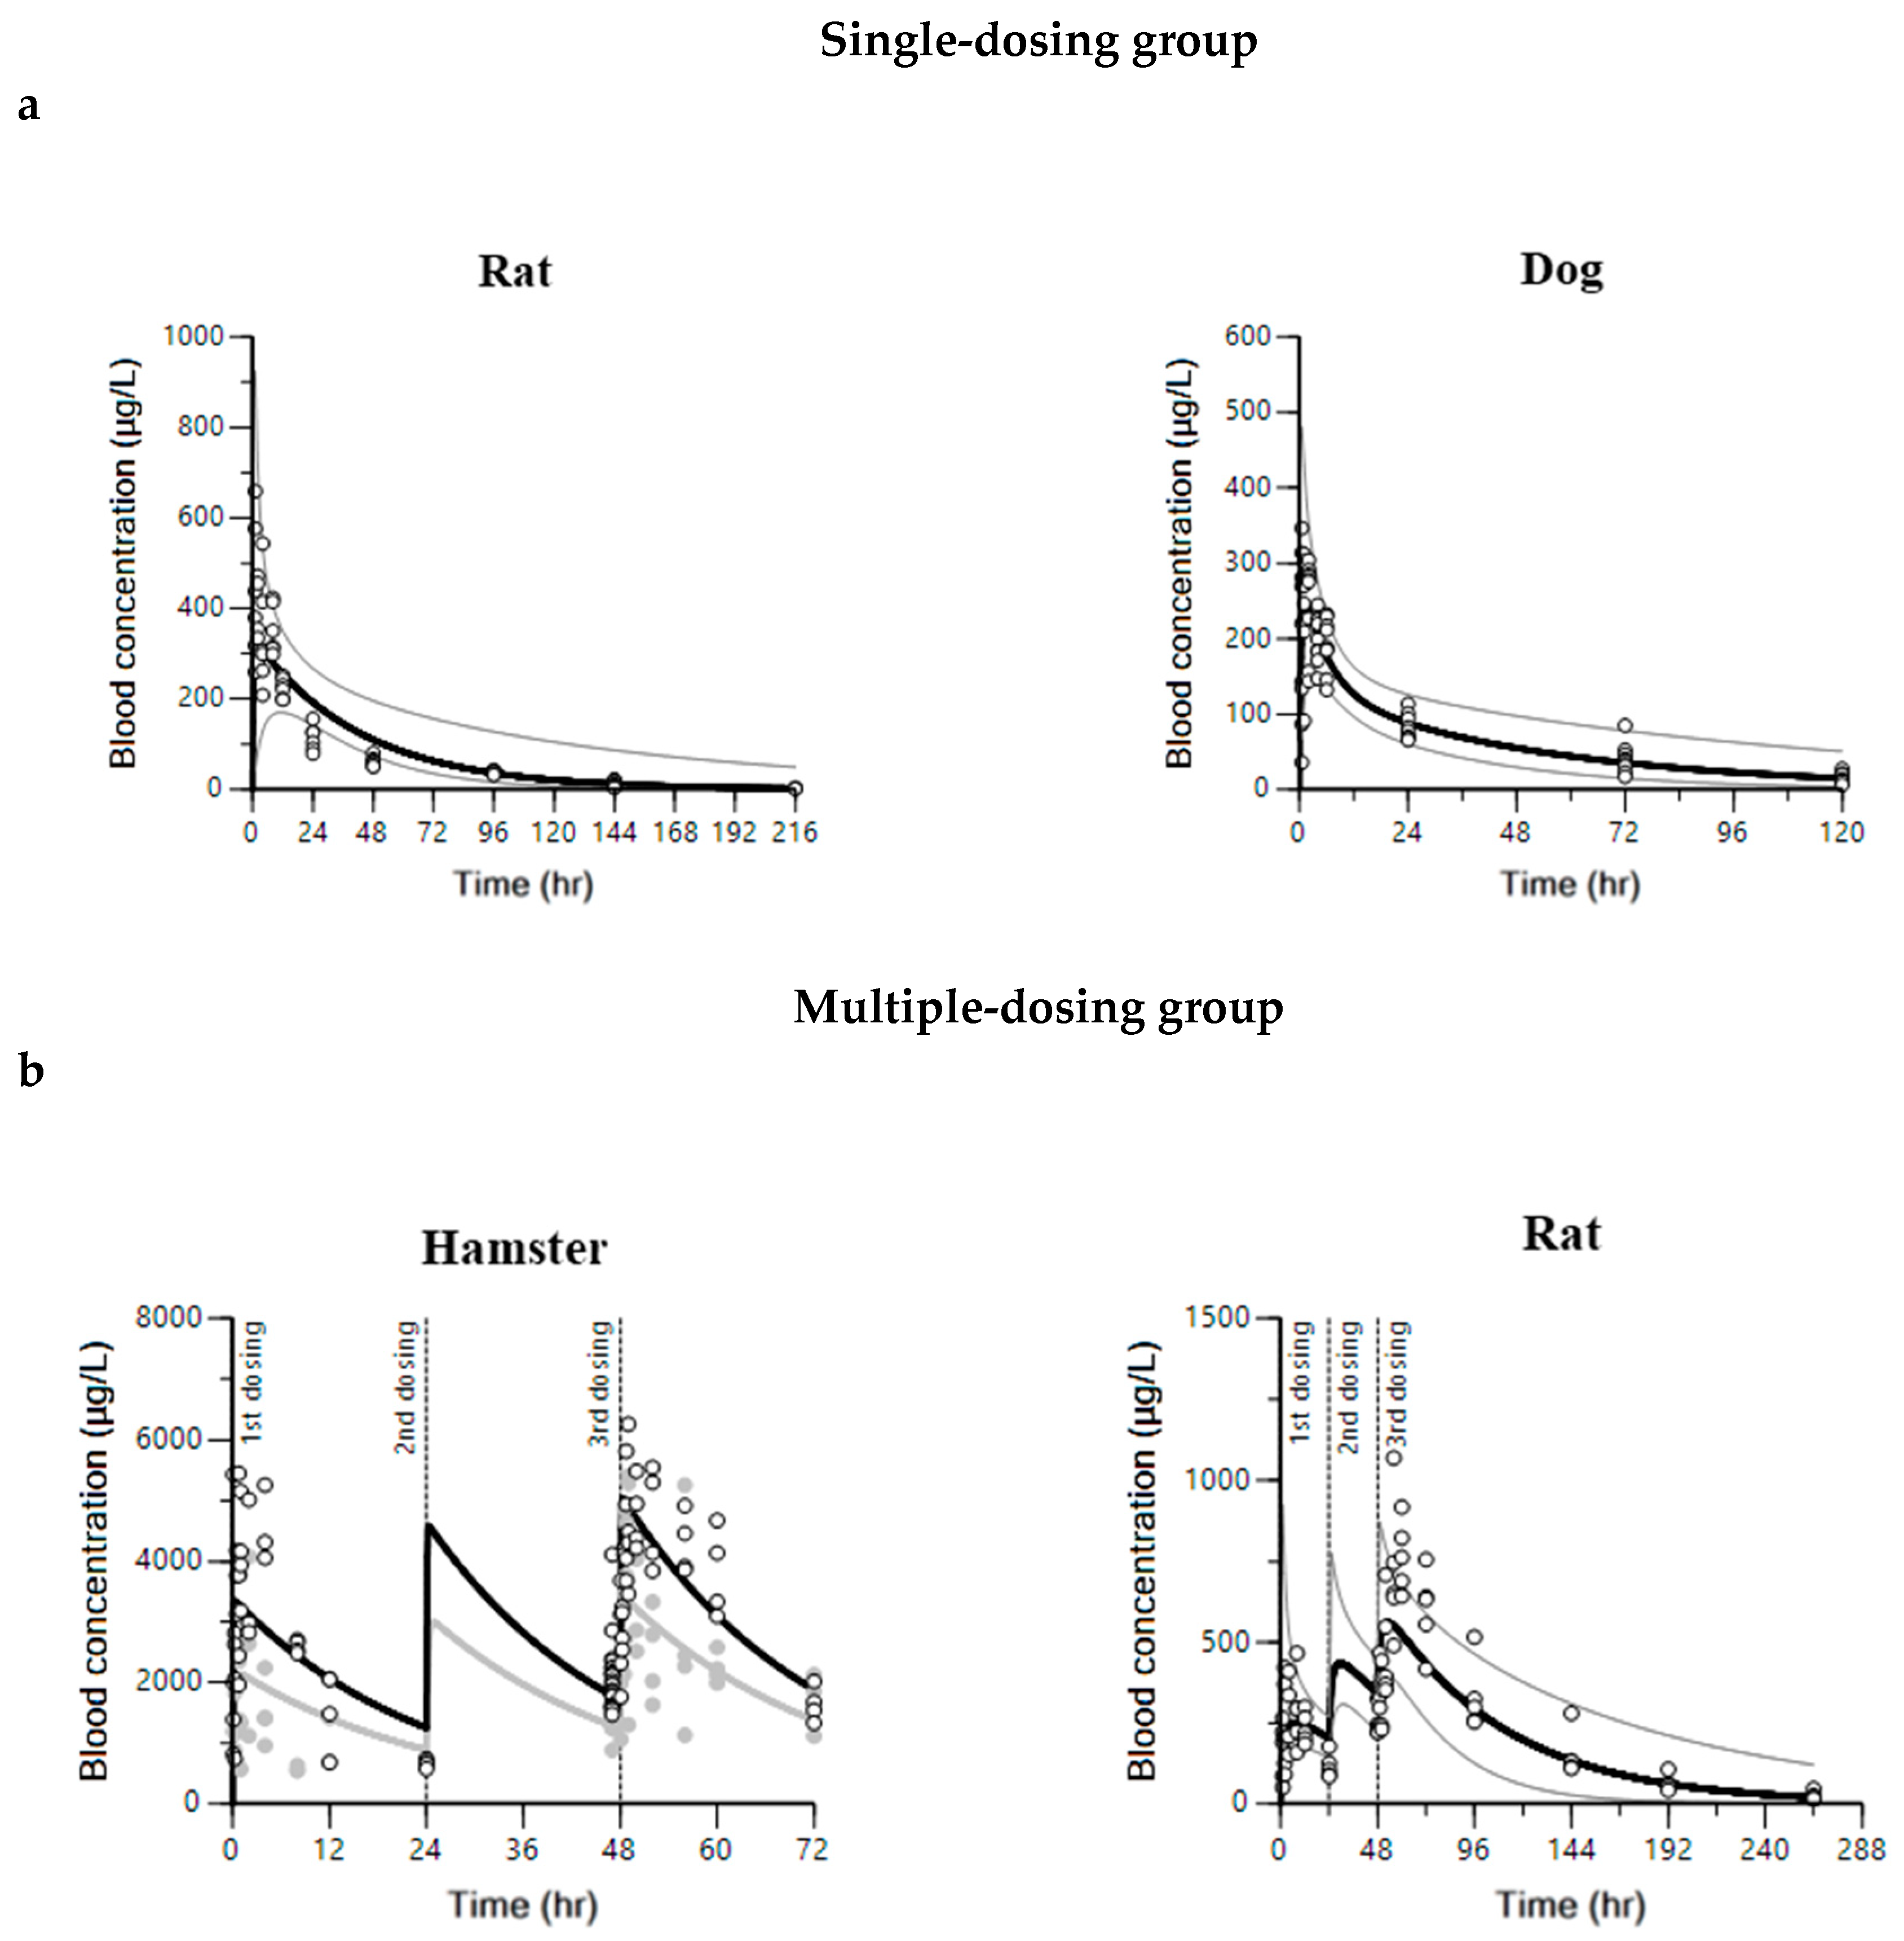
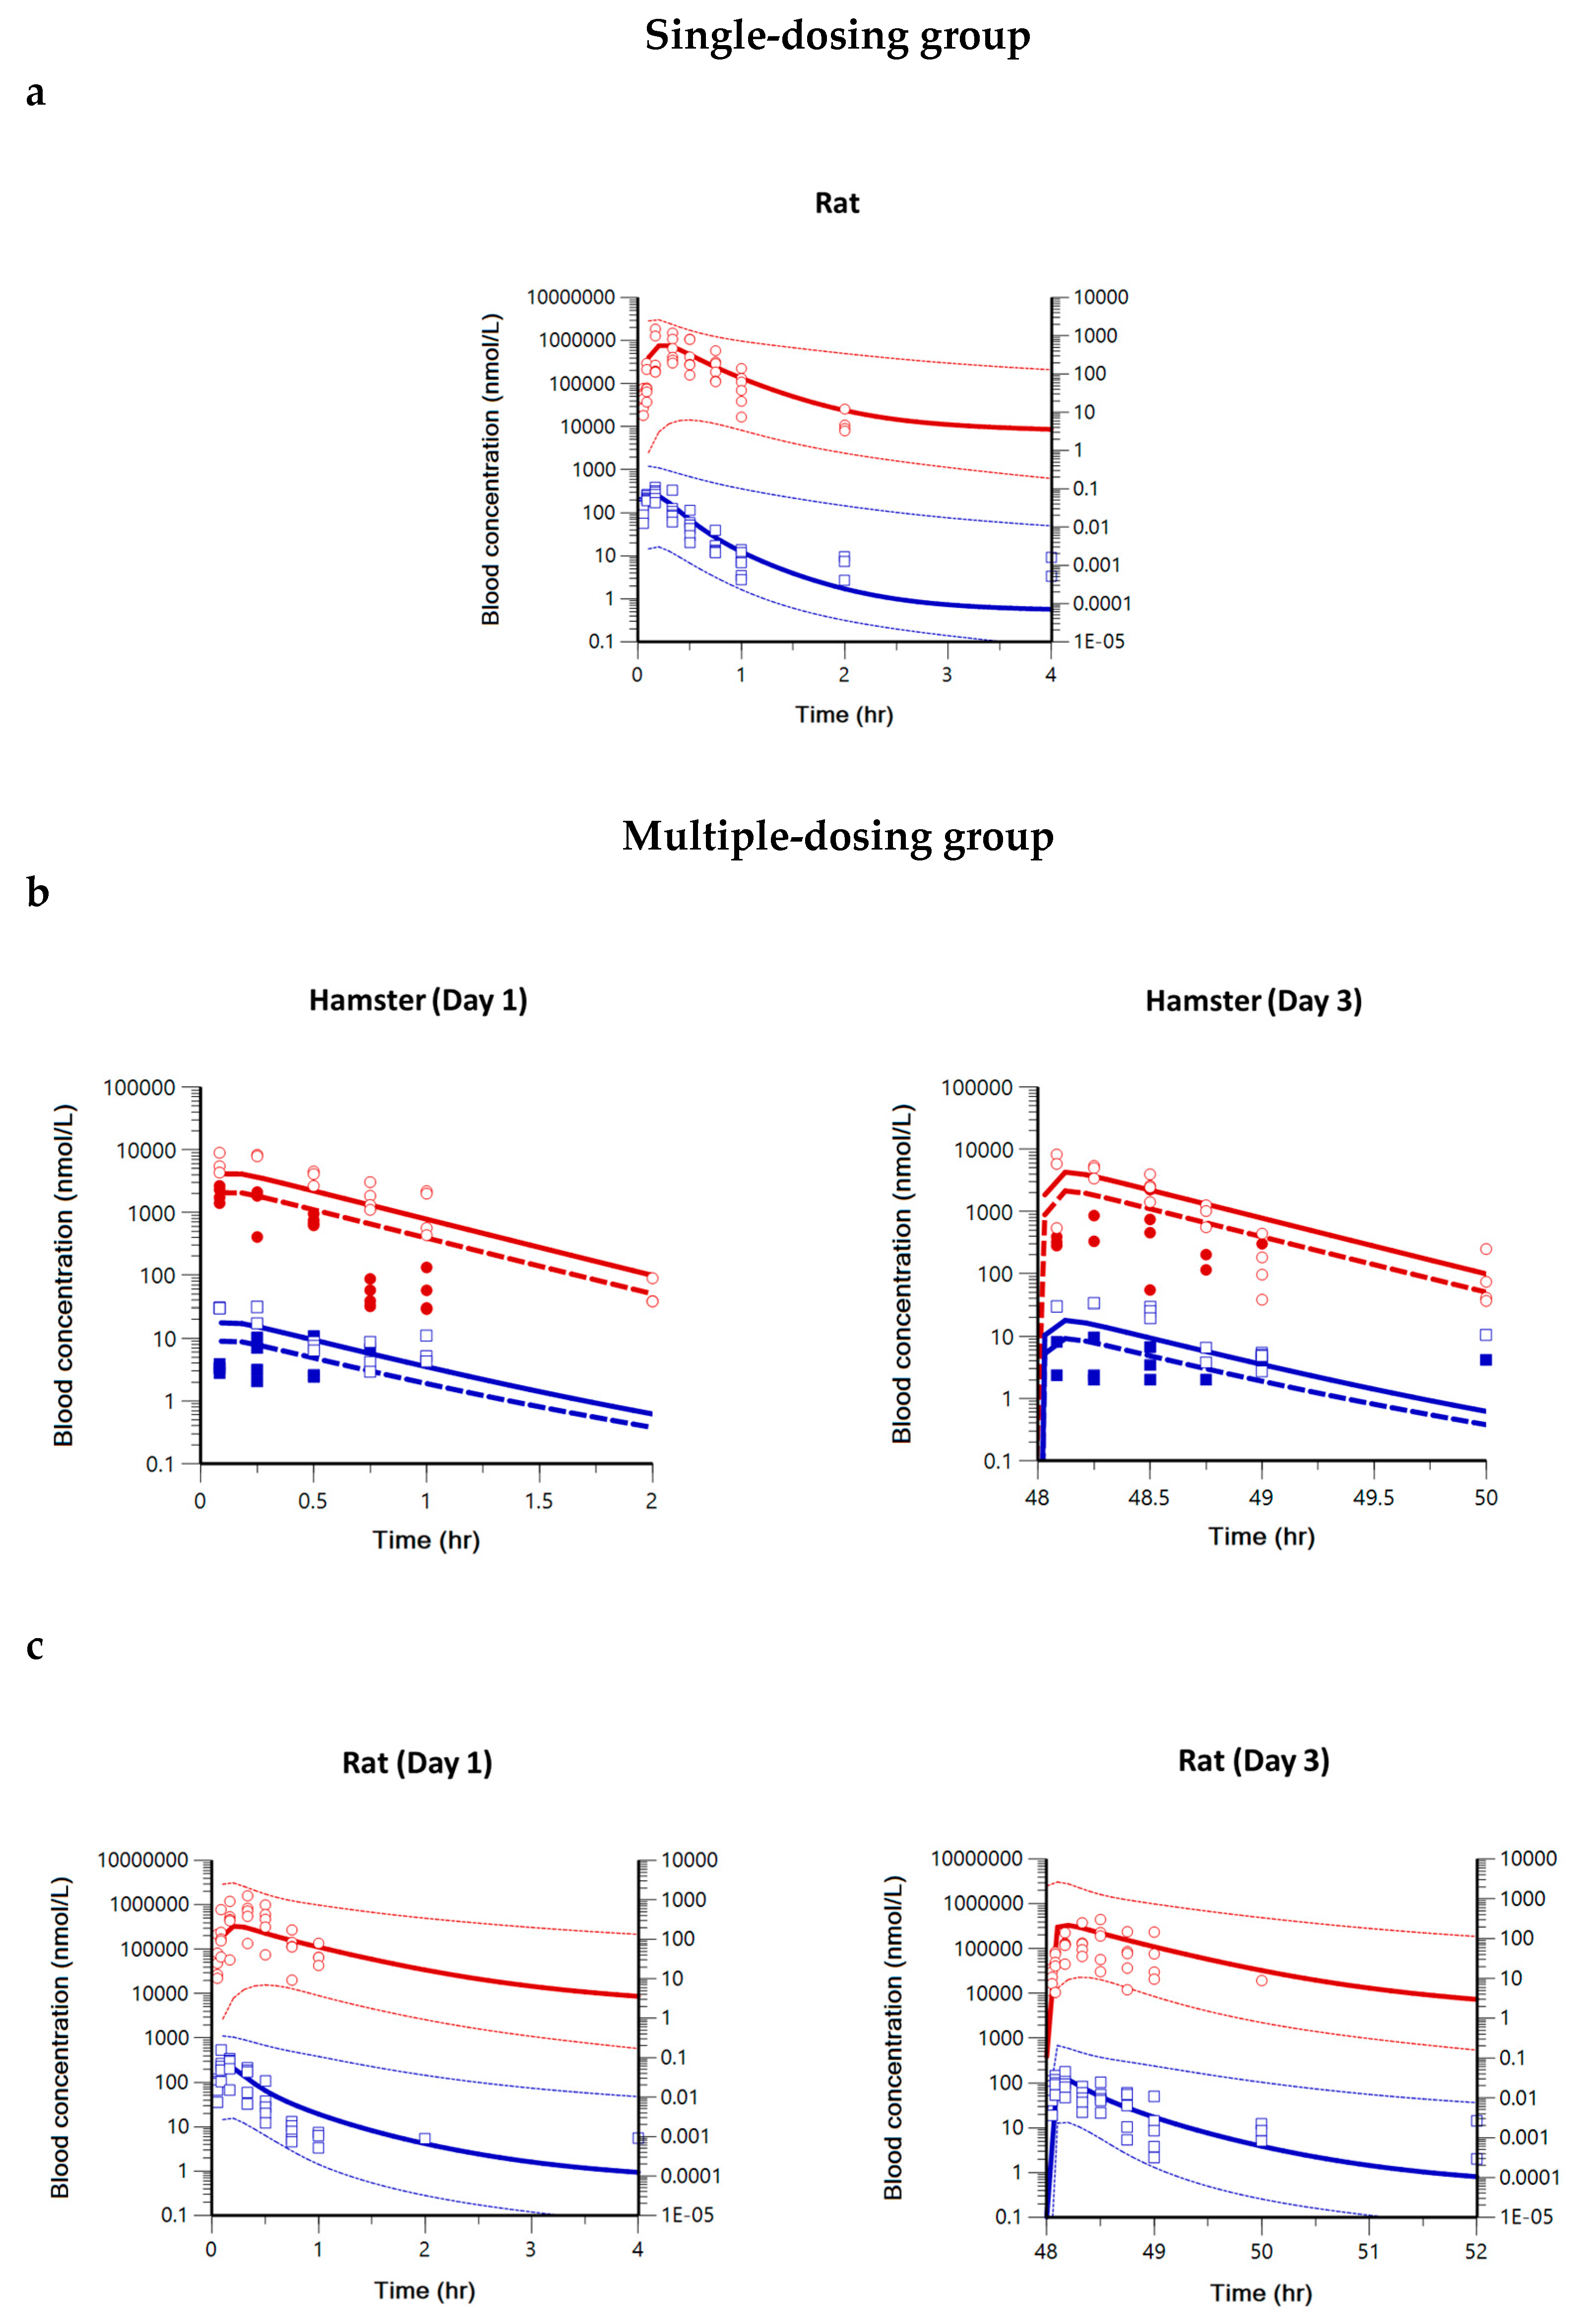
2.1. Pharmacokinetics of Pyronaridine, Artesunate, and Dihydroartemisinin in Hamsters, Rats, and Dogs

The pharmacokinetics of pyronaridine were evaluated in hamsters, rats, and dogs. Because a high blood-to-plasma ratio (4.9–17.8) and distribution to red blood cells have been reported for pyronaridine, whole blood was selected as the matrix for bioanalytical quantification [38]. The PK profile of pyronaridine for each species is shown in Figure S1. The corresponding estimated PK parameters from NCA for each species are summarized in Table S1. In rats, 60 mg/kg of pyronaridine tetraphosphate was orally administered once or once a day for three days. From the single-dosing group (Figure S1a, left), the Vss/F and CL/F were estimated to be 125.02 ± 21.63 L/kg and 2.79 ± 0.21 L/h/kg in rats. The Tmax, t1/2, and MRT were estimated to be 3.83 ± 3.43, 37.43 ± 6.61, and 45.01 ± 8.60 h, respectively. In dogs, 90 mg of pyronaridine tetraphosphate was orally administered once (Figure S1a, right). The Vss/F and CL/F were estimated to be 28.40 ± 5.55 L/kg and 0.64 ± 0.13 L/h/kg. The Tmax, t1/2, and MRT were estimated to be 1.67 ± 1.09, 38.44 ± 7.06, and 46.19 ± 11.47 h.
The standard deviation could not be calculated in hamsters since naïve-pooled analysis (pooling sparse data from several individuals) was used to evaluate PKs. In the multiple-dosing group (180 mg/kg or 360 mg/kg for three days) in hamsters (Figure S1b, left), the t1/2 and MRT were estimated to be 14.05–13.97 h and 20.27–20.15 h for the low-to-high dose group, respectively. The accumulation index was calculated to be 2.37 for the low-dose group and 1.66 for the high-dose group in hamsters. The Vss/F and CL/F were estimated to be 36.38–48.66 L/kg and 1.80–2.41 L/h/kg for the low-to-high dose group. In the multiple-dosing group (60 mg/kg for three days) in rats (Figure S1b, right), the t1/2 and MRT were estimated to be 42.27 ± 2.99 h and 60.99 ± 4.31 h. The Vss/F and CL/F were estimated to be 141.30 ± 18.66 L/kg and 2.33 ± 0.36 L/h/kg. The accumulation index was calculated to be 3.04 ± 0.45 in rats.
The pharmacokinetics of artesunate and dihydroartemisinin were evaluated in hamsters and rats. Since the blood-to-plasma ratio was reported to be 0.75 for both artesunate and dihydroartemisinin, blood concentrations were calculated by multiplying plasma concentrations by 0.75 [39]. The PK profiles of artesunate and dihydroartemisinin for each species are shown in Figure S2. The corresponding estimated PK parameters from NCA for each species are summarized in Table S2. Hamsters received a low dose (60 mg/kg) or a high dose (120 mg/kg) of daily oral artesunate for three consecutive days, and blood concentrations for artesunate and dihydroartemisinin were simultaneously quantified (Figure S2b). The t1/2 and MRT of artesunate were estimated to be 1.18–1.39 h and 1.70–2.00 h for the low-to-high dose group, respectively. The accumulation index of artesunate was calculated to be 0.11 for the low-dose group and 0.15 for the high-dose group. The Vss/F and CL/F of artesunate were estimated to be 11,915.76–19,674.11 L/kg and 7009.38–9830.19 L/h/kg for the low-to-high dose group. The t1/2 and MRT of dihydroartemisinin were estimated to be 0.31–0.33 h and 0.44–0.47 h for the low-to-high dose group, respectively. The accumulation index of dihydroartemisinin was calculated to be 0.17 for the low-dose group and 0.09 for the high-dose group.
In rats, blood concentrations for artesunate and dihydroartemisinin were simultaneously quantified after receiving 20 mg/kg of oral artesunate once or once a day for three days. From the single-dosing group (Figure S2a), the Vss/F and CL/F of artesunate were estimated to be 231.89 ± 116.35 L/kg and 547.08 ± 132.41 L/h/kg. The Tmax, t1/2, and MRT were estimated to be 0.14 ± 0.04, 0.17 ± 0.07, and 0.44 ± 0.23 h for artesunate and 0.28 ± 0.09, 0.23 ± 0.08, and 0.52 ± 0.11 h for dihydroartemisinin. From the multiple-dosing group (Figure S2c), the Vss/F and CL/F of artesunate were estimated to be 485.07 ± 189.31 L/kg and 1008.34 ± 593.65 L/h/kg. The t1/2 and MRT were estimated to be 0.43 ± 0.25 and 0.62 ± 0.36 h for artesunate and 0.31 ± 0.16 and 0.45 ± 0.23 h for dihydroartemisinin. The accumulation index of artesunate and dihydroartemisinin was calculated to be 0.13 ± 0.06 and 0.09 ± 0.08 in rats. The AUCDay 1 and AUCDay 3 of artesunate were 506.74 ± 170.31 and 69.01 ± 39.58, respectively, and showed a significant difference (p < 0.01). Also, the AUCDay 1 and AUCDay 3 of dihydroartemisinin were 943.37 ± 646.81 and 79.46 ± 69.28, respectively, and showed a significant difference (p < 0.01).

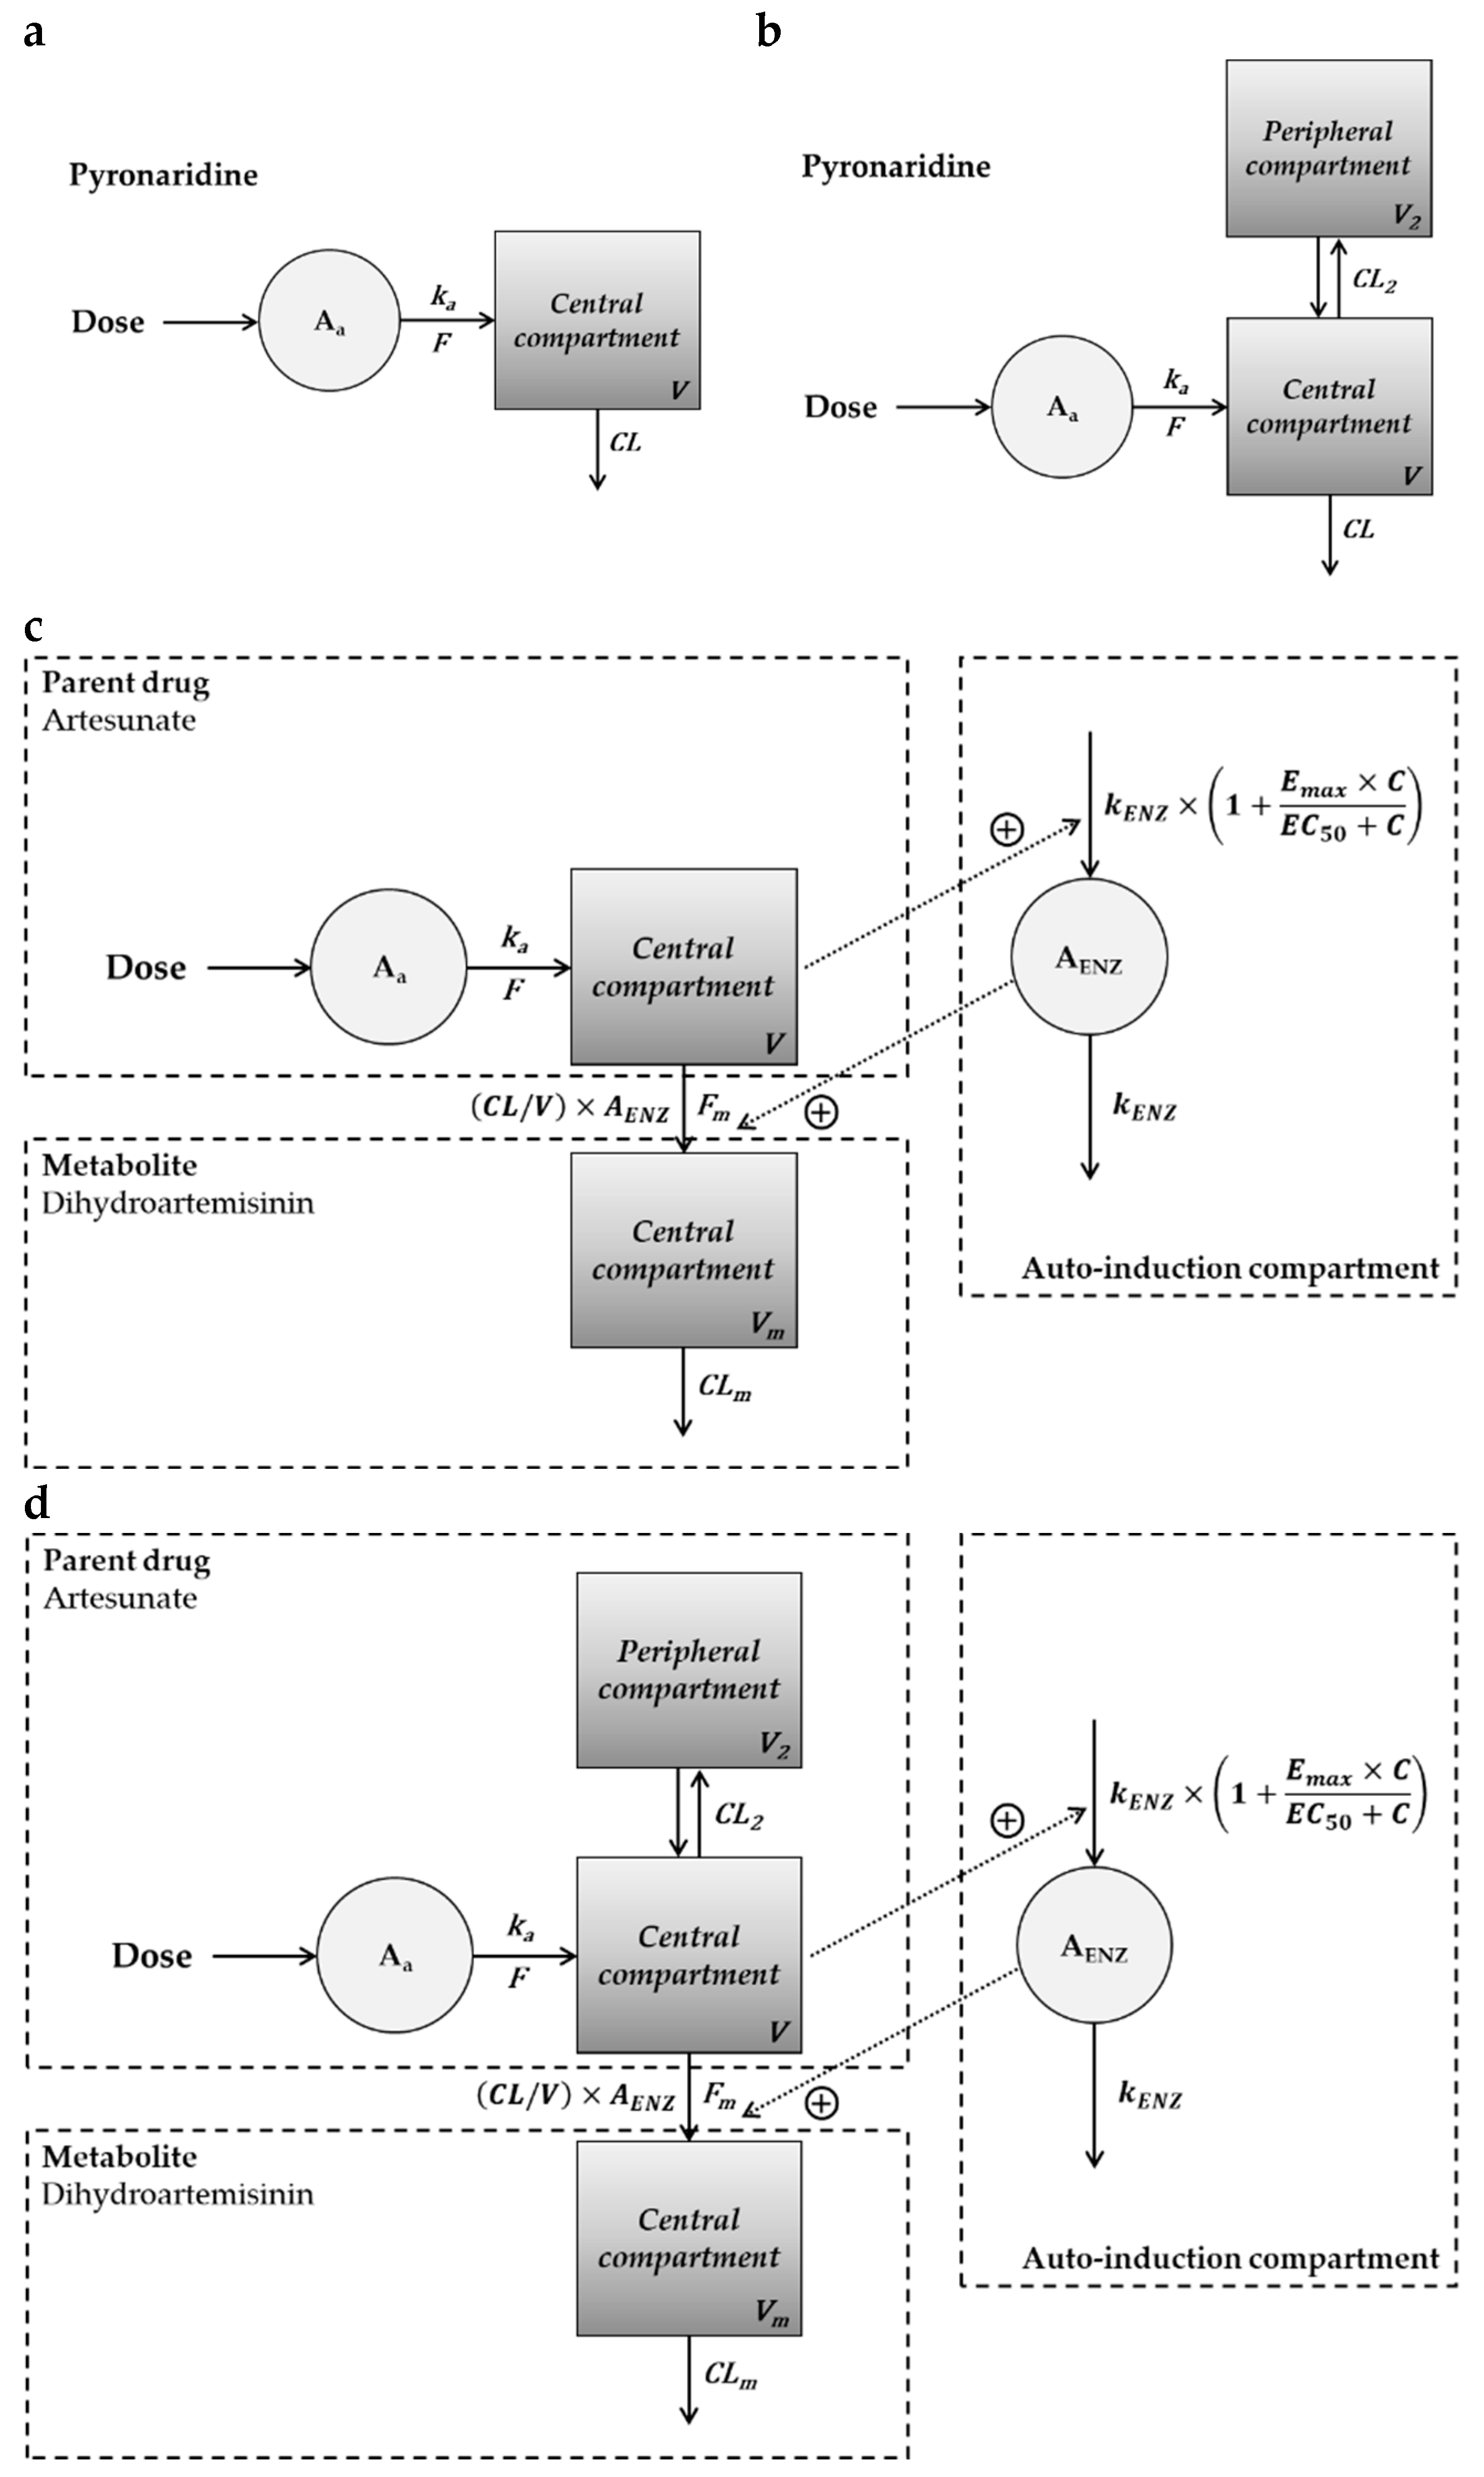
2.2. Compartment PK Modeling in Hamsters, Rats, and Dogs

The non-compartmental PK parameters were used as initial estimates for compartment PK modeling of pyronaridine, artesunate, and dihydroartemisinin. A one- or two-compartment PK model was used to fit the observed blood concentrations in hamsters, rats, and dogs. The PK modeling process for pyronaridine, artesunate, and dihydroartemisinin is summarized in Tables S3 and S4. The one-compartment model described the blood concentrations of pyronaridine in hamsters and rats well, whereas the two-compartment model described those in dogs well. A lag time was not incorporated into the model parameter since the lag time was estimated to be zero in NCA. The blood concentrations of artesunate and dihydroartemisinin were well-described by the parent-metabolite model with auto-induction elimination in hamsters and rats. The combined model of one- (artesunate) and one- (dihydroartemisinin) compartment was established for hamsters, and the combined model of two- (artesunate) and one- (dihydroartemisinin) compartment was established for rats. To verify the performance of the PK models in each species, basic goodness-of-fit (GOF) plots were evaluated (Figures S3 and S4). The GOF plots showed no visible trends and suggested reasonable agreements between observations and model predictions. The blood concentrations for observations and model predictions in each species are shown in Figure 1 (pyronaridine) and Figure 2 (artesunate and dihydroartemisinin).
The estimated PK parameters from the developed model in all species are summarized in Table 1. The ka for pyronaridine in hamsters, rats, and dogs was estimated to be 11.62, 1.67, and 2.46, respectively. The ka for artesunate was estimated to be 2.08−1 in hamsters and 1.54 h−1 in rats, respectively. In compartmental PK analysis, the Vss is described as Vc + Vp, where Vc and Vp are the volumes of a central and peripheral compartment, respectively [40]. In other words, the Vss is expressed as V1 (in the one-compartment model) or as V1 + V2 (in the two-compartment model) [41]. Thus, using the PK model estimates, the Vss/F of pyronaridine for hamsters, rats, and dogs was calculated to be 53.32, 110.00, and 32.68 L/kg. The elimination clearance (CL/F) of pyronaridine for hamsters, rats, and dogs was estimated to be 2.15, 2.18, and 0.68 L/h/kg, respectively. From the parent-metabolite PK model, the Vss/F of artesunate was calculated to be 1571.71 and 514.08 L/kg in hamsters and rats, and the Vm/(F∙Fm) of dihydroartemisinin was estimated to be 0.02 and 0.16 L/kg in hamsters and rats, respectively. The CL/F of artesunate was estimated to be 3555.94 and 13.33 L/kg in hamsters and rats, and the CLm/(F∙Fm) of dihydroartemisinin was estimated to be 117.68 and 237.25 L/kg in hamsters and rats, respectively. These PK parameters in three species were used to extrapolate and predict PK parameters in humans.

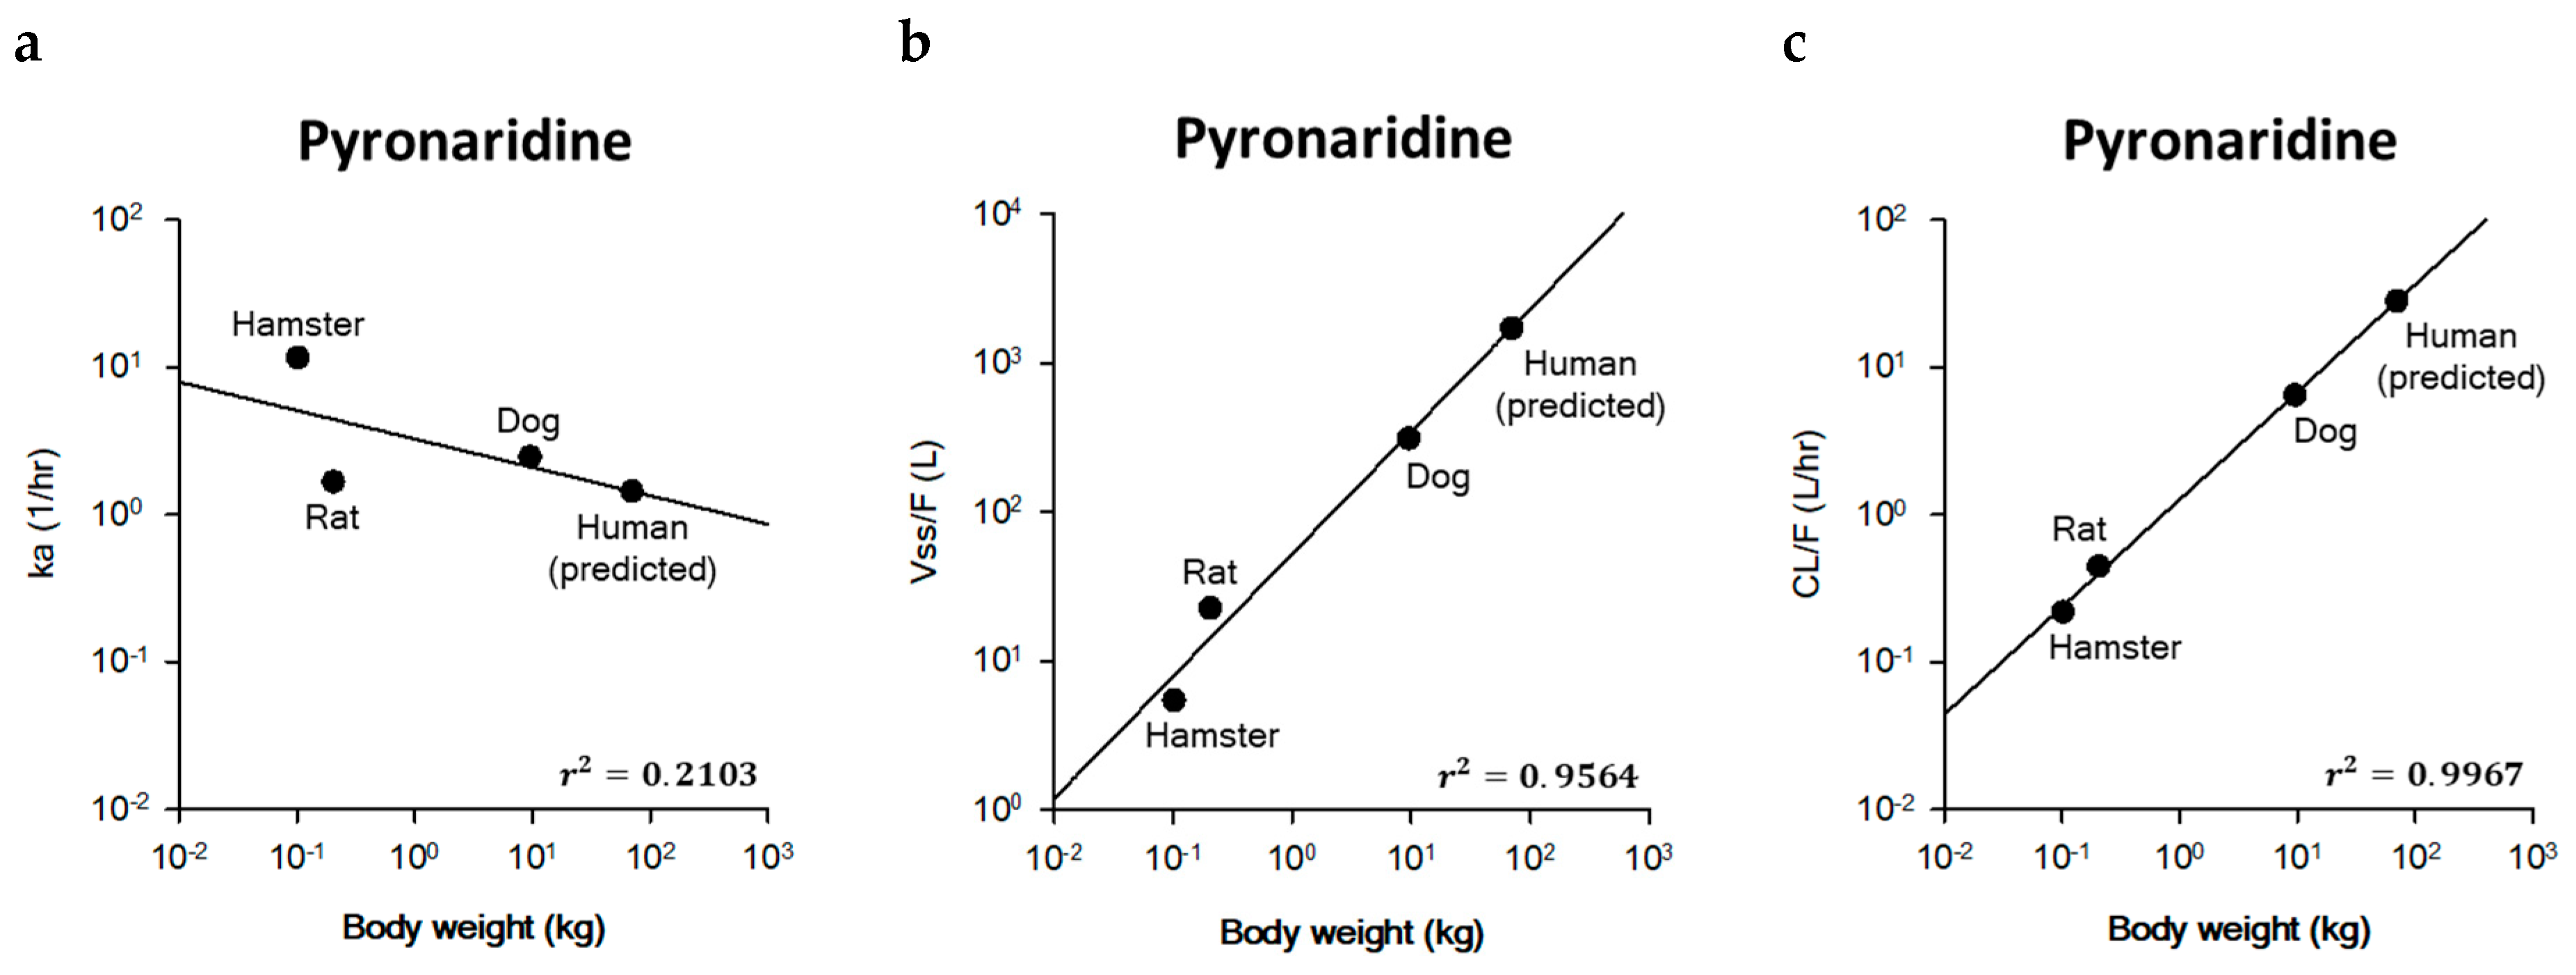
2.3. Prediction of Human PK Parameters Using Allometric Scaling

The PK parameters estimated by the model fitting in hamsters, rats, and dogs were used for the inter-species extrapolation to predict human parameters of pyronaridine. The ka of 11.62 h−1 (hamster), 1.67 h−1 (rat), and 2.46 h−1 (dog) was used for inter-species scaling. For the extrapolation, the units of Vss/F and CL/F were modified from L/kg to L and from L/h/kg to L/h, respectively, using the actual body weight of animals. The Vss/F in hamsters, rats, and dogs were calculated to be 5.44, 22.57, and 311.18 L, respectively. The CL/F in hamsters, rats, and dogs were estimated to be 0.22, 0.45, and 6.48 L/h, respectively. The body weights of hamsters, rats, and dogs used for allometric scaling were 0.10, 0.21, and 9.52 kg, respectively. The exponents, coefficients, and correlation coefficients for ka, Vss/F, and CL/F were estimated using the equation for simple allometric scaling. The human PK parameters were predicted using a simple allometric equation. The predicted parameters were 1.44 h−1 for ka, 1721.75 L (=24.60 L/kg) for Vss/F, and 28.25 L/h (=0.40 L/h/kg) for CL/F in a 70 kg human. The coefficient of determination (r2) was estimated to be 0.2103 for ka, 0.9564 for Vss/F, and 0.9967 for CL/F, respectively. The relationship between the PK parameters and body weights across the species is shown in Figure 3.
The estimated PK parameters from the model fitting in hamsters and rats were used for inter-species extrapolation to predict human parameters of artesunate and dihydroartemisinin. Similar to pyronaridine, the units of the volume of distribution and clearance were modified by multiplying the actual body weight of animals. In the case of artesunate, the Vss/F in hamsters and rats was calculated to be 160.33 and 105.48 L, and the CL/F in hamsters and rats was calculated to be 362.74 and 2.73 L/h. In the case of artesunate, the Vss/F and CL/F were estimated to be 160.33 L and 362.74 L/h in hamsters and 105.48 L and 2.73 L/h in rats. In the case of dihydroartemisinin, the Vm/(F·Fm) and CLm/(F·Fm) were calculated to be 0.002 L and 12.00 L/h in hamsters and 0.033 L and 48.68 L/h in rats. In addition, the PK parameters of artesunate and dihydroartemisinin in dogs were taken from the literature, and only one study has reported the PK parameters of artesunate and dihydroartemisinin in dogs after intravenous (IV) injection of artesunate. In the dog PK study, the PK parameters of artesunate and dihydroartemisinin were reported to be 0.21 L for Vss/F, 28.86 L/h for CL/F, 1.96 L/kg for Vm/(F·Fm), and 61.54 L/h/kg for CLm/(F·Fm) [42]. Since IV injection is an extravascular route, the absorption rate constant (ka) of artesunate cannot be estimated in dogs. Thus, after fixing the exponent of first-order rate constants (i.e., ka) to −0.25 following the literature, only the intercept for the ka of artesunate was estimated by using the ka of 2.08 h−1 (hamster) and 1.54 h−1 (rat) [43]. The predicted human PK parameters of artesunate and dihydroartemisinin were 0.38 h−1 for ka, 0.01 L (=0.0002 L/kg) for Vss/F, 14.69 L/h (=0.21 L/h/kg) for CL/F, 25.04 L (=0.36 L/kg) for Vm/(F·Fm), and 108.50 L/h (1.55 L/h/kg) for CLm/(F·Fm) in 70 kg human. The coefficient of determination (r2) was estimated to be 0.8230 for ka, 0.9931 for Vss/F, 0.0254 for CL/F, 0.9352 for Vm/(F·Fm), and 0.5105 for CLm/(F·Fm), respectively. Figure 4. shows the exponents, coefficients, and correlation coefficients for simple allometric scaling to predict human PK parameters of artesunate and dihydroartemisinin.

3. Discussion

Reported PD data for drug repurposing. We have previously evaluated the PKs of pyronaridine and artesunate in hamsters to support the correlation between in vivo exposures and in vitro antiviral activity [37]. However, only Cavg and AUC were calculated for assessing in vivo exposures, and disposition parameters (e.g., volume of distribution and clearance) were not estimated. This study additionally evaluated the PKs of pyronaridine and artesunate via NCA and PK modeling to describe interspecies PK differences in animal species. The PK parameters in hamsters, rats, and dogs were extrapolated to the clinical PK parameters by the simple equation for allometric scaling. Since the dosage regimen for the approved pyronaridine (Pyramax®) is a single oral daily dose for three consecutive days, the multiple-dosing schedules were set the same as the approved drug. For example, only the single-dose PKs of pyronaridine in dogs have been performed to evaluate inter-species differences. Thus, PK modeling was used to integrate the single- and multiple-dose PK data to predict the clinical PKs.
In the NCA result of pyronaridine (Table S1), the low- or high-doses were orally administered daily for three days to hamsters. The exposure parameters (Cavg, AUCτ, and AUCinf) were all about 1.5 times higher in the high-dose (360 mg/kg) group than the low-dose (180 mg/kg) group. Even though the exposure parameters are shown as less than dose-proportional, the t1/2 (13.97–14.05 h) and MRT (20.15–20.27 h) were not changed as the dose increased. Rats and dogs showed similar t1/2 (about 37–42 h), whereas hamsters showed relatively short t1/2 (about 14 h). The PKs of pyronaridine in several animal species (rat, rabbit, dog, and monkey) have been reported. After intramuscular administration of pyronaridine to monkeys and rabbits, the Tmax was reached within 0.75–1.5 h with a t1/2 of 48–72 h [44,45]. In rabbits, the range of Tmax by intragastric (IG) and intramuscular (IM) administration of pyronaridine was 1.38–1.62 h and 0.75 h, respectively [44]. In addition, the t1/2 after IG, IM, and IV administration to rabbits were 56, 49, and 59 h, respectively [44,46]. Using the PK profile after the IV injection in rabbits, the Vss and CL were estimated to be 29.0 ± 6.0 L/kg and 0.442 ± 0.131 L/h/kg, respectively [44]. The PK parameters estimated from IG and IV administration were described using the compartment PK model. The monkey PK data (n = 1) for pyronaridine showed a t1/2 of 64 h [45]. Intravenous injection of pyronaridine in rats and dogs showed an apparent terminal t1/2 of 48–96 h [1,47].
In the NCA results of artesunate and dihydroartemisinin (Table S2), the hamster showed a similar t1/2 (1.18–1.39 h for artesunate; 0.31–0.33 h for dihydroartemisinin) and MRT (1.70–2.00 h for artesunate; 0.44–0.47 for dihydroartemisinin) between the low-dose (60 mg/kg) and high-dose (120 mg/kg) groups. The AUCτ of artesunate on days 1 and 3 were calculated to be 151.07 and 15.88 nmol∙hr/L for the low-dose group, and 298.16 and 44.53 nmol∙hr/L for the high-dose group in hamsters. The AUCτ of dihydroartemisinin on days 1 and 3 were calculated to be 3698.50 and 614.17 nmol∙hr/L for the low-dose group, and 31,147.39 and 2860.22 nmol∙hr/L for the high-dose group in hamsters. In rats, the AUCτ on day 1 and day 3 were calculated to be 506.74 ± 170.31 and 69.01 ± 39.58 nmol∙hr/L for artesunate, and 943.37 ± 646.81 and 79.46 ± 69.28 nmol∙hr/L for dihydroartemisinin. Due to the reduced AUC after repeat dosing of artesunate, the accumulation index of artesunate and dihydroartemisinin was less than 1 in hamsters and rats. The volumes of distribution and clearance of dihydroartemisinin could not be estimated since the dose of the metabolite or the fraction of drug metabolized (Fm), which is used for calculating the PK parameters of the metabolite, is unknown. To describe the PKs of dihydroartemisinin, artesunate was assumed to be eliminated through the central compartment, where the Fm of artesunate was metabolized to dihydroartemisinin. However, it was impossible to estimate the actual value of the Fm and the Vd of the dihydroartemisinin simultaneously [48,49]. Thus, the apparent clearance [CLm/(F·Fm)] and apparent volume of distribution [Vm/(F·Fm)] of dihydroartemisinin were estimated.
Several studies have reported the PKs of artesunate and dihydroartemisinin after administering oral or intravenous artesunate in rats. After oral administration of 100 mg/kg artesunate to rats, the t1/2 was 1.14 ± 0.22 h for artesunate and 0.90 ± 0.21 h for dihydroartemisinin [50]. The IV injection study of artesunate showed a t1/2 of 0.46 ± 0.06 h for artesunate and 0.65 ± 0.06 h for dihydroartemisinin [51]. Also, the range of reported MRTs in rats was 0.20–2.05 h for artesunate and 0.40–0.65 h for dihydroartemisinin, respectively [51,52,53]. The accumulation index was reported to be 0.37–1.11 for artesunate and 0.53–0.80 for dihydroartemisinin, respectively, from the repeat-dose studies of artesunate in rats [51,52,53].
The volume of distribution at steady-state (Vss) is a key PK parameter that explains the relationship between the amount of drug in the body and concentration in blood at equilibrium [54,55,56]. Also, estimating Vss is important since it influences t1/2 and Cmax, which supports determining dosage regimens in clinical trials [57]. In this study, compartment PK modeling of pyronaridine and artesunate was conducted in animal species to estimate the PK parameters, including Vss. In all animal species, the CV% for most estimated PK parameters was within about 30% (Table 1), and the observed PK profiles were well described by model predictions (Figure 1 and Figure 2). In the case of artesunate and dihydroartemisinin, several studies have shown the auto-induction PKs and the plasma concentrations (or AUC) showed a remarkable decline after repeated dosing in our NCA results [51,53]. Chai et al. have examined the mechanism for the auto-induction phenomenon of artesunate and dihydroartemisinin by 5-day IV/PO PK studies in rats and dogs [58]. In Chai’s study, the hepatic and intestinal first-pass effects were investigated with the induction capacities of cytochrome P450 (CYP450), and the result showed an increased CYP450 expression in the intestine. It suggests declining blood concentrations after multiple oral doses are caused by the increased intestinal first-pass effect rather than the hepatic first-pass effect or systemic elimination. To accurately capture the tissue-specific auto-induction and time-dependent PKs, future development of a physiologically-based pharmacokinetic (PBPK) model should be conducted with the auto-induction mechanism of an intestine compartment. The other issue in the NCA results is that the volume of distribution and the clearance for the metabolite could not be estimated since the administered dose of the metabolite or the parent drug-to-metabolite ratio are unknown. Thus, parent-metabolite PK modeling with auto-induction elimination was conducted to capture declining plasma concentrations and estimate the volume of distribution and clearance for dihydroartemisinin. The model structure and parameters for the parent-metabolite model and auto-induction elimination were modified from several pieces of literature [48,59,60].
Allometric scaling is the most common approach for interspecies scaling to describe the relationship of PK parameters between animal species and humans [56,61]. The major assumption for allometric scaling is that PK parameters are related to body weight [62]. In the current study, the estimated PK parameters of ka, CL/F, and Vss/F in animal species were extrapolated into those of humans using the simple allometric equation. In the case of first-order rate constants (units of reciprocal time; h−1), the power exponent of −0.25 is generally used [43]. Among 40 drugs, the typical range for simple allometric exponents is 0.35 to 1.39 for clearances [63,64]. Also, the exponent for all types of volume distribution was around 1 and generally ranged between 0.8 and 1.1 [64,65]. The allometric exponents (b) of pyronaridine for ka, Vss/F, and CL/F were estimated to be −0.1928, 0.8220, and 0.7296, respectively (Figure 3). The coefficient of determination (r2) for the ka (0.2103) was relatively lower than the Vss/F (0.9564) and CL/F (0.9967). It might be since the extrapolation of ka with body weight was less evident than that of volumes of distribution and clearances [66]. The allometric exponents of the parent drug (artesunate) and the metabolite (dihydroartemisinin) were estimated to be −1.4725 for the Vss/F, −0.1547 for the CL/F, 1.2933 for the Vm/(F·Fm), and 0.2509 for the CLm/(F·Fm) (Figure 4). Since the ka in dog was unavailable, the allometric exponent for ka was fixed to be −0.25, which is the general exponent for first-order rate constants [43]. Unlike the typical reported values, the parent drug (artesunate) showed negative values of simple allometric exponents for the volume of distribution (−1.4725) and clearance (−0.1547), and only the metabolite (dihydroartemisinin) showed positive values for those parameters. These values suggest the volume of distribution and the clearance of artesunate decreased as the body weight increased, while those parameters of dihydroartemisinin increased as the body weight increased.
Several studies conducted population PK modeling of pyronaridine in healthy and malaria-infected adults, and the PKs of pyronaridine were well-fitted by a two-compartment model in both populations [67,68]. Also, artesunate disposition was reported to be best described by a two-compartment model in humans, capturing a rapid initial distribution phase [69]. The disposition pharmacokinetics of dihydroartemisinin were best described by a one-compartment model with no benefit of an additional peripheral compartment in humans [70,71]. All reported PK models followed first-order absorption and elimination kinetics for pyronaridine, artesunate, and dihydroartemisinin, which are the same in this study. Hence, the two-compartment model in dogs for pyronaridine and the combined one- and two-compartment model in rats for artesunate/dihydroartemisinin best described the human PKs and disposition.
The predicted human PK parameters were compared with the reported ones in the literature. Two studies have evaluated the human PKs of pyronaridine via compartment PK modeling. In one published Ph.D. dissertation, the ka of 0.87 h−1, Vss/F of 7532 L, and CL/F of 20.08 L/h were estimated using the two-compartment population PK model in healthy adults [67]. The other literature performed population PK modeling by pooled analysis in malaria-infected pediatric patients younger than 16 years of age, and PK parameters were estimated to be 0.76 h−1 for ka, 5460 L for Vss/F, and 15.71 L/h for CL/F [68]. The predicted ka (=1.44 h−1) and CL/F (=28.25 L/h) in this study were within 2-fold compared with the literature, while the predicted Vss/F showed about 3- to 4-fold lower than the observed values in humans. Also, several studies have evaluated the pharmacokinetics of artesunate and dihydroartemisinin following the administration of artesunate in humans. The reported ka for the oral and intrarectal routes was 0.2–3.9 h−1 [72,73]. The range of the reported Vss of artesunate was 0.09–15.2 L/kg for the IV route and 2.07–19.67 L/kg for the extravascular (PO and IM) routes [73,74,75,76]. The CL of artesunate was reported to be 1.16–64 L/h/kg for the IV route and 2.4–60 L/h/kg for the extravascular route, respectively [73,77,78]. The Vss of dihydroartemisinin was reported to be 0.75–2.40 and 1.20–6.34 L/kg following the IV and extravascular (oral, intramuscular, and intrarectal) administration of artesunate, respectively [73,75]. The reported range of the clearance of dihydroartemisinin was 0.48–5.6 and 0.73–3.17 L/h/kg for the IV and the extravascular dosing of artesunate, respectively [72,73,74,75,76,78,79,80,81,82,83]. In this study, the predicted human PK parameters of artesunate and dihydroartemisinin from allometric scaling were 0.38 h−1 for ka, 0.0002 L/kg for Vss/F, 0.21 L/h/kg for CL/F, 0.36 L/kg for Vm/(F·Fm), and 1.55 L/h/kg for CLm/(F·Fm), respectively. Both the predicted ka of artesunate and the predicted CL of dihydroartemisinin were within the reported range of human PK parameters. However, the predicted CL of artesunate and Vss of artesunate and dihydroartemisinin were more than two times lower than the reported values. This large difference between the actual CL and predicted CL of artesunate in humans might be due to the CL of artesunate being irrelevant to the body weight and showing a very low coefficient of determination (r2) of 0.0254. The unbound fraction of the drug can influence the Vss in the blood (fu,blood), the unbound fraction of the drug in tissue (fu,tissue), and the tissue-to-blood partition coefficient (Kp) [83]. A relationship between Vss and blood–tissue volumes/protein binding/tissue partitioning is described as follows [83,84,85,86]:
V s s = V b + V t × f u , b l o o d f u , t i s s u e
V s s = V b + i n V t , i × K p , i
where the Vb is the blood volume and the Vt is the sum of all tissue volumes. In this study, the Vss in animal species were estimated by assuming that the fu,blood and fu,tissue are equal (Vss = Vb + Vt), and the human Vss was predicted with more than a 2-fold difference between the predicted and actual measured value. This large difference in the Vss might be due to the difference between the unbound fraction of the drug in blood (fu,blood) and the unbound fraction of the drug in tissue (fu,tissue). If the unbound fraction in tissue is more than two times lower than that in blood, the tissue binding fraction, or partitioning, is more than two times higher. It might result in a higher value of the actual Vss than the predicted Vss. In the EMA report for pyronaridine, the fu,blood has been reported to be in the range of 4% to 8% in rats, rabbits, dogs, and humans, while tissue concentrations were ten times higher than blood concentrations with a potential tissue accumulation in rats [5]. Artesunate was extensively distributed in the intestines, urinary bladder, bile duct, and small and large intestinal contents, with a Kp of 3.08–28.86 following IV injection to rats and showed similar protein binding rates of 73–86% between rats and humans [87,88]. Dihydroartemisinin also showed wide tissue distribution for 192 h after IV injection to rats with the Kp of 5.04–226.37 in 17 tissues and showed high binding rates (76–82%) with both rat and human plasma proteins [89]. Based on the evidence for the extensive tissue distribution of pyronaridine, artesunate, and dihydroartemisinin, the difference between the predicted and actual Vss in humans could be derived from the higher tissue binding (fu,blood/fu,tissue > 1) and higher tissue partitioning (Kp > 1). Despite this limitation, the inter-species scaling of other PK parameters was well described by the simple allometric equation, and it might be a useful tool for predicting clinical PK parameters. In the future, evaluating the tissue distribution of pyronaridine and artesunate could be combined with the PK parameter estimates, and it could allow a more comprehensive understanding of the prediction of clinical PK parameters.
International organizations have recently suggested alternative approaches, such as cell-based testing and computer modeling, to minimize and eliminate unnecessary animal testing [90]. Even though the FDA encourages and accepts scientifically valid alternatives to animal testing, validated alternatives are yet to be available for many medical products [91]. Although the use of animal models for pre-clinical testing has been minimized in some European countries and other regions, they have provided critical insights into drug pharmacokinetics, informing subsequent human studies. The choice of animal models was driven by the need to evaluate comprehensive in vivo ADME data accurately, which remains challenging to predict and validate fully through in silico or in vitro methods alone. Moreover, animal models can aid researchers in conducting sophisticated in silico or in vitro modeling by incorporating fundamental data from animal experiments. This research aims to provide a balanced approach, utilizing traditional animal PK experiments and modeling methods to understand comprehensive PK data. The findings from our study can be valuable for researchers where animal models are acceptable, and they can be utilized as in vivo validation data for future in silico/in vitro modeling.

4. Materials and Methods

4.1. Chemicals and Reagents

Pyronaridine tetraphosphate (CAS No. 76748-86-2), artesunate (CAS No. 88495-63-0), and dihydroartemisinin (71939-50-9) were provided by Shin Poong Pharm. Co., Ltd. (Seoul, Republic of Korea). Amodiaquine (CAS No. 6398-98-7), sodium phosphate tribasic dodecahydrate buffer (CAS No. 10101-89-0), diethyl ether (CAS No. 60-29-7), ortho-phosphoric acid (CAS No. 7664-38-2), formic acid (CAS No. 64-18-6), ammonium acetate (CAS No. 631-61-8), and trifluoroacetic acid (TFA; CAS No. 76-05-1) were purchased from Sigma-Aldrich (St Louis, MO, USA). Acetonitrile (CAS No. 75-05-8), methanol (CAS No. 67-56-1), methyl-tert-butyl ether (CAS No. 1634-04-4), and water (CAS No. 7732-18-5) were purchased from J.T. Baker (Phillipsburg, DE, USA). All other chemicals and reagents were HPLC or analytical grade.

4.2. LC-MS/MS Conditions

Pyronaridine Liquid chromatography was conducted on the Agilent 1290 Infinity II LC System (Agilent Technologies Inc., Santa Clara, CA, USA) coupled to a 6490 Triple Quad Mass Spectrometer (Agilent Technologies Inc., Santa Clara, CA, USA). A Synergi Max-RP column (2.0 × 75 mm, 4 μm particle size, Phenomenex, Torrance, CA, USA) was used at a temperature of 25 °C. The mobile phase consisted of 0.04% TFA in water (mobile phase A) and methanol:acetonitrile = 3:1 (v/v) (mobile phase B) with a flow rate of 0.2 mL/min. A gradient elution was used for the chromatographic separation of pyronaridine as follows: 0.0–1.5 min, 10% B; 1.5–1.6 min, 10–60% B; 1.6–4.0 min, 60% B; 4.0–4.1 min, 60–10% B; 4.1–5.0 min, 10% B. The multiple reaction monitoring was set with a positive atmospheric pressure chemical ionization (APCI+) mode. The MRM transitions of 518.2 > 447.1 and 356.2 > 283.0 were used for pyronaridine and amodiaquine (internal standard, IS). The collision energy of 17 and 21 eV was used for pyronaridine and amodiaquine, respectively.
Artesunate and dihydroartemisinin Liquid chromatography was conducted on the Shimadzu Nexera-X2 series (Shimadzu Corp., Tokyo, Japan) coupled with an LCMS-8040 (Shimadzu Corp., Tokyo, Japan). An Inertsil ODS column (2.1 × 100 mm, 5 μm particle size; GL Sciences, Tokyo, Japan) was used at a temperature of 25 °C. The mobile phase consisted of 10 mM ammonium acetate (mobile phase A) and acetonitrile (mobile phase B), with a 0.2 mL/min flow rate. An isocratic elution (mobile phase A:B = 10:90, v/v) was used for the chromatographic separation. The multiple reaction monitoring was set with a positive electrospray ionization (ESI+) mode. The MRM transitions were 402.05 > 267.10 for artesunate, 302.00 > 267.05 for dihydroartemisinin, and 299.95 > 283.15 for artemisinin (IS), respectively. The collision energies of 11, 9, and 7 eV were used for artesunate, dihydroartemisinin, and artemisinin, respectively.

4.3. Sample Preparation

Pyronaridine 50 μL of rat or dog blood sample was mixed with 10 μL of the IS solution (1 μg/mL of amodiaquine in 50% methanol). An amount of 125 μL of 0.5 M sodium phosphate tribasic dodecahydrate buffer (pH adjusted to 10.3 with 85% ortho-phosphoric acid) and 500 μL of diethyl ether were added to the mixed sample, vortexed for 5 min, and centrifuged at 21,130× g for 5 min. Then, 300 μL of supernatant was collected and evaporated using nitrogen at room temperature. The dried residue was reconstituted with 100 μL of mobile phase (0.04% TFA:methanol:acetonitrile = 40:45:15, v/v/v) and vortexed for 5 min before centrifugation at 21,130× g for 5 min. Five μL of aliquot was injected into the UPLC-MS/MS system.
Artesunate and dihydroartemisinin 50 μL of hamster or rat plasma were mixed with 10 μL of the IS solution (5 μg/mL of artemisinin in 50% methanol). An amount of 300 μL of acetonitrile was added to the mixed sample, vortexed for 5 min, and centrifuged at 21,130× g for 5 min. Then, 325 μL of supernatant was collected and evaporated using nitrogen at room temperature. The dried residue was reconstituted with 75 μL of mobile phase and vortexed for 5 min before centrifugation at 21,130× g for 5 min. Five μL of aliquot was injected into the UPLC-MS/MS system.

4.4. Pharmacokinetic Study Design

Rat Eleven male Sprague-Dawley rats were obtained from Orient Bio (Seongnam-si, Korea), and the mean body weight of the rats was 205.2 ± 7.3 g. All rats were maintained on a 12 h light/12 h dark cycle at a temperature of 23 ± 3 °C, relative humidity of 50 ± 20%, ventilation with 10–15 air changes/hour, and 150–200 lux of light. The animal study has received approval for research ethics from the Institutional Animal Care and Use Committee (IACUC, protocol number: IACUC220095) of CHA University. All rats were randomly divided into three groups, and each group received a single or multiple (once a day for three days) oral dose of 60/20 mg/kg pyronaridine tetraphosphate/artesunate. Blood samples (0.3 mL) were taken from the jugular vein into heparinized tubes and stored at −80 °C until sample analysis.
Dog Nine male beagle dogs were obtained from SaeronBio (Uiwang-si, Korea), and the mean body weight of the dogs was 9.5 ± 0.3 kg. All dogs were maintained on a 12 h light/12 h dark cycle at a temperature of 23 ± 3 °C, relative humidity of 55 ± 15%, ventilation with 10–20 air changes/hour, and 150–300 lux of light. The animal study has received approval for research ethics from the IACUC (protocol number: 21-KE-762) of KNOTUS Co., Ltd. (Incheon, Republic of Korea). All dogs received a single oral dose of 90 mg/head pyronaridine tetraphosphate (51.2 mg as pyronaridine). Blood samples (3 mL) were taken from the jugular vein into heparinized tubes and stored at −80 °C until sample analysis.
Hamster The hamster PK data were adapted from the hamster PK study of pyronaridine and artesunate previously conducted in our published research [37]. One hundred eight male Golden hamsters were obtained from Janvier Labs (Le Genest-Saint-Isle, France), and the mean body weight of the hamsters was 102.01 ± 5.72 g. The detailed design for the hamster, rat, and dog PK study was summarized in Table 2.

4.5. Pharmacokinetic Evaluation

For the estimation of PK parameters for pyronaridine, non-compartmental analysis (NCA) was performed using WinNonlin software (version 8.4, Certara™, Princeton, NJ, USA). The elimination rate constant (ke) was estimated by linear regression analysis, and the elimination half-life (t1/2) was calculated by dividing ln 2 by ke. The time to maximum concentration (Tmax) and maximum blood concentration (Cmax) were obtained by visual observation of the blood concentration-time curve. The area under the blood concentration-time curve from zero to time t (AUCt) and the area under the first moment curve from zero to time t (AUMCt) were calculated by a linear trapezoidal method. The area under the blood concentration-time curve from zero to time infinity (AUCinf) was calculated as follows: AUCt + Clast/ke, where Clast is the last measurable concentration. The area under the first moment curve from zero to time infinity (AUMCinf) was calculated as follows: AUMCt + (Clast × tlast/ke) + (Clast/ke2), where tlast is the time of last measurable concentration. The clearance (CL/F) was calculated as dose/AUCinf in the single-dose group or dose/AUCτ in the multiple-dose group. The mean residence time (MRT) was calculated as AUMCinf/AUCinf. The volume of distribution at steady-state (Vss/F) was calculated as follows: (Dose×AUMCinf)/AUCinf2 or CL/F × MRT. The average blood concentration at a steady state (Cavg) in multiple doses was calculated by dividing the AUCτ by the dosing interval (τ). The accumulation index was calculated as a ratio of the AUCτ from day 3 to day 1. Log-linear regression and basic/log statistics (mean, SD, variance, CI, etc.) were used as statistical methods for the model-independent method. The statistically significant differences were analyzed using the Wilcoxon rank sum test of R software (version 2024.04.2).

4.6. Pharmacokinetic Modeling

Compartment PK modeling was performed in three species (hamster, rat, and dog) to describe the time course of pyronaridine, artesunate, and dihydroartemisinin blood concentrations. The hamster PK data were collected from the literature we previously published [37]. The observed PK data in three species were fitted to a one- or two-compartment PK model using WinNonlin software (version 8.4, Certara™, Princeton, NJ, USA). The PK data were fitted using nonlinear mixed-effects (NLME) modeling with the first-order conditional estimation-extended least squares (FOCE-ELS) algorithm. The NLME model incorporated fixed effects (population parameters) and random effects (individual parameters). Also, a parent-metabolite model consisting of the one- or two-compartment PK model was developed to describe the PKs of artesunate and dihydroartemisinin. An auto-induction PK model was incorporated into the parent-metabolite model of artesunate and dihydroartemisinin since artemisinin-like drugs showed time-dependent PKs (decreasing plasma concentrations) after repeated oral administration by auto-induction metabolism [52,58]. First-order kinetics was assumed for the absorption, distribution, and elimination of pyronaridine, and a well-fitted model was chosen. The final models for pyronaridine, artesunate, and dihydroartemisinin are shown in Figure 5, and the differential equations for each model are provided in Table 3.
The PK parameters estimated from the NCA were used for initial estimates of the PK model parameters. Since hamster PK data were from a naïve pooled method, the mean blood concentrations were used for PK modeling. Population PK modeling was performed in rats and dogs using individual PK data. In the population modeling, the inter-individual variability (IIV) of PK parameters was modeled by exponential random effects as follows:
θ i = θ T V × e η i
where θTV is a population value of a PK parameter, θi is the PK parameter for the ith individual, and ηi is a random variable for the ith individual following a normal distribution with the mean of zero and the variance of ω2. The intra-individual variability (ε) was modeled by an additive error (pyronaridine) or multiplicative error (artesunate and dihydroartemisinin) as follows:
C o b s = C p r e d + ε   (pyronaridine)
C o b s = C p r e d × 1 + ε   (artesunate and dihydroartemisinin)
where Cobs is observed concentrations and Cpred is predicted concentrations. The selection of the well-fitted model was guided by evaluating the precision of parameter estimates and diagnostic values, including the negative log-like (-2LL), Akaike information criterion (AIC), and Bayes information criterion (BIC). The developed model was evaluated using the visual inspection of PK profiles between observed and predicted concentrations and diagnostic plots, including the dependent variable (DV) versus (individual) predictions [(I)PRED], (conditional) weighted residuals [(C)WRES] versus population predictions (PRED), and (conditional) weighted residuals [(C)WRES] versus time after dose (TAD). A visual inspection of PK profiles between observed and predicted concentrations was also conducted.

4.7. Extrapolation into Clinical PK Parameters by Allometric Scaling

The human PK parameters were extrapolated from the hamster, rat, and dog PK parameters using allometric scaling. The hamster PK parameters were taken from our previous research [37]. The equation for simple allometric scaling was expressed as a power function following [92]:
Y = a × W b
where Y is the pharmacokinetic parameter of interest, W is the body weight, a is the coefficient of the allometric equation, and b is the exponent of the allometric equation. The above equation was log-transformed as follows:
log Y = log a + b log W
where log a is the y-intercept and b is the slope. The PK parameters and actual body weights of three animal species (hamster, rat, and dog) were plotted using a log-log scale. Then, a and b were estimated by a curve fitting the equation to scale up the PK parameters of a 70 kg human. The ka, CL/F, and Vss/F were extrapolated to 70 kg men from animals.

5. Conclusions

The inter-species PK difference for pyronaridine and artesunate in hamsters, rats, and dogs was evaluated using NCA and compartment PK modeling in animal species. The simple allometric equation (Y = a × Wb) well-described the inter-species difference of PK parameters according to the body weights. Given the reported human PKs of both drugs, dogs were well-correlated with humans for pyronaridine, and rats were well-correlated with humans for artesunate/dihydroartemisinin. The data from the study may support the rationale for extrapolating PK exposures to evaluate the clinical efficacy of pyronaridine and artesunate for new targets. These data could be used as a basis for drug repurposing of pyronaridine and artesunate, and the results from the study could support assessing clinical effectiveness based on predicted clinical PK exposures. Furthermore, in drug repurposing, these data could be applied to determine effective dosage regimens based on clinical PK-PD prediction for new indications in initial clinical trials.

Supplementary Materials

The following supporting information can be downloaded at: https://www.mdpi.com/article/10.3390/ijms25136998/s1.

Author Contributions

Writing—Original Draft, D.W.K.; Investigation, D.W.K.; Visualization, D.W.K.; Writing—Review and Editing, J.H.K. and G.-W.C.; Data Curation, K.M.K.; Formal analysis, K.M.K.; Validation, S.-j.C.; Conceptualization, H.-Y.C.; Methodology, H.-Y.C.; Supervision, H.-Y.C. All authors have read and agreed to the published version of the manuscript.

Funding

This research received no external funding.

Institutional Review Board Statement

The animal study protocol was approved by the Institutional Animal Care and Use Committee (IACUC) of CHA University (protocol code: IACUC220095) and the Institutional Review Board (or Ethics Committee) of KNOTUS Co., Ltd. (protocol code: 21-KE-762).

Informed Consent Statement

Not applicable.

Data Availability Statement

Data are contained within the article and Supplementary Materials.

Acknowledgments

This research was supported by Shin Poong Pharm. Co., Ltd.

Conflicts of Interest

The authors declare no conflicts of interest.

References

  1. Croft, S.L.; Duparc, S.; Arbe-Barnes, S.J.; Craft, J.C.; Shin, C.S.; Fleckenstein, L.; Borghini-Fuhrer, I.; Rim, H.J. Review of Pyronaridine Anti-Malarial Properties and Product Characteristics. Malar. J. 2012, 11, 270. [Google Scholar] [CrossRef] [PubMed]
  2. Kurth, F.; Pongratz, P.; Bélard, S.; Mordmüller, B.; Kremsner, P.G.; Ramharter, M. In Vitro Activity of Pyronaridine against Plasmodium Falciparum and Comparative Evaluation of Anti-Malarial Drug Susceptibility Assays. Malar. J. 2009, 8, 79. [Google Scholar] [CrossRef] [PubMed]
  3. Moore, L.R.; Fujioka, H.; Williams, P.S.; Chalmers, J.J.; Grimberg, B.; Zimmerman, P.A.; Zborowski, M. Hemoglobin Degradation in Malaria-infected Erythrocytes Determined from Live Cell Magnetophoresis. FASEB J. 2006, 20, 747–749. [Google Scholar] [CrossRef]
  4. Ma, W.; Balta, V.A.; Pan, W.; Rimer, J.D.; Sullivan, D.J.; Vekilov, P.G. Nonclassical Mechanisms to Irreversibly Suppress β-Hematin Crystal Growth. Commun. Biol. 2023, 6, 783. [Google Scholar] [CrossRef] [PubMed]
  5. EMA. Pyramax: Public Assessment Report (EMA/CHMP/61768/2012); European Medicines Agency: London, UK, 2021.
  6. Aweeka, F.T.; German, P.I. Clinical Pharmacology of Artemisinin-Based Combination Therapies. Clin. Pharmacokinet. 2008, 47, 91–102. [Google Scholar] [CrossRef] [PubMed]
  7. Bukirwa, H.; Unnikrishnan, B.; Kramer, C.V.; Sinclair, D.; Nair, S.; Tharyan, P. Artesunate plus Pyronaridine for Treating Uncomplicated Plasmodium Falciparum Malaria. Cochrane Database Syst. Rev. 2014, 2014, CD006404. [Google Scholar] [CrossRef]
  8. Thomas, C.M.; Stauffer, W.M.; Alpern, J.D. Food and Drug Administration Approval of Artesunate for Severe Malaria: Enough to Achieve Best Practice? Clin. Infect. Dis. 2023, 76, e864–e866. [Google Scholar] [CrossRef] [PubMed]
  9. Barradell, L.B.; Fitton, A. Artesunate: A Review of Its Pharmacology and Therapeutic Efficacy in the Treatment of Malaria. Drugs 1995, 50, 714–741. [Google Scholar] [CrossRef] [PubMed]
  10. Vivas, L.; Rattray, L.; Stewart, L.; Bongard, E.; Robinson, B.L.; Peters, W.; Croft, S.L. Anti-Malarial Efficacy of Pyronaridine and Artesunate in Combination in Vitro and in Vivo. Acta Trop. 2008, 105, 222–228. [Google Scholar] [CrossRef]
  11. Newton, P.N.; Van Vugt, M.; Teja-Isavadharm, P.; Siriyanonda, D.; Rasameesoroj, M.; Teerapong, P.; Ruangveerayuth, R.; Slight, T.; Nosten, F.; Suputtamongkol, Y.; et al. Comparison of Oral Artesunate and Dihydroartemisinin Antimalarial Bioavailabilities in Acute Falciparum Malaria. Antimicrob. Agents Chemother. 2002, 46, 1125–1127. [Google Scholar] [CrossRef]
  12. EMA. Artesunate Amivas: EPAR—Medicine Overview (EMA/531550/2021); European Medicines Agency: London, UK, 2022.
  13. Yu, R.; Jin, G.; Fujimoto, M. Dihydroartemisinin: A Potential Drug for the Treatment of Malignancies and Inflammatory Diseases. Front. Oncol. 2021, 11, 722331. [Google Scholar] [CrossRef] [PubMed]
  14. Ruwizhi, N.; Maseko, R.B.; Aderibigbe, B.A. Recent Advances in the Therapeutic Efficacy of Artesunate. Pharmaceutics 2022, 14, 504. [Google Scholar] [CrossRef]
  15. Moss, S.; Mańko, E.; Krishna, S.; Campino, S.; Clark, T.G.; Last, A. How Has Mass Drug Administration with Dihydroartemisinin-Piperaquine Impacted Molecular Markers of Drug Resistance? A Systematic Review. Malar. J. 2022, 21, 186. [Google Scholar] [CrossRef] [PubMed]
  16. Otta, D.A.; De Araújo, F.F.; De Rezende, V.B.; Souza-Fagundes, E.M.; Elói-Santos, S.M.; Costa-Silva, M.F.; Santos, R.A.; Costa, H.A.; Siqueira-Neto, J.L.; Martins-Filho, O.A.; et al. Identification of Anti-Trypanosoma Cruzi Lead Compounds with Putative Immunomodulatory Activity. Antimicrob. Agents Chemother. 2018, 62, e01834-17. [Google Scholar] [CrossRef] [PubMed]
  17. Qi, J.; Yang, C.Z.; Wang, C.Y.; Wang, S.B.; Yang, M.; Wang, J.H. Function and Mechanism of Pyronaridine: A New Inhibitor of P-Glycoprotein-Mediated Multidrug Resistance. Acta Pharmacol. Sin. 2002, 23, 544–550. [Google Scholar]
  18. Villanueva, P.J.; Gutierrez, D.A.; Contreras, L.; Parra, K.; Segura-Cabrera, A.; Varela-Ramirez, A.; Aguilera, R.J. The Antimalarial Drug Pyronaridine Inhibits Topoisomerase II in Breast Cancer Cells and Hinders Tumor Progression In Vivo. Clin. Cancer Drugs 2021, 8, 50–56. [Google Scholar] [CrossRef] [PubMed]
  19. Li, J.; Wang, W.; Yao, J.; Wang, T.; Li, S.; Qi, W.; Han, S.; Ren, Y.; Dang, Z.; Han, X.; et al. Old Drug Repurposing for Neglected Disease: Pyronaridine as a Promising Candidate for the Treatment of Echinococcus Granulosus Infections. eBioMedicine 2020, 54, 102711. [Google Scholar] [CrossRef] [PubMed]
  20. Lane, T.R.; Massey, C.; Comer, J.E.; Anantpadma, M.; Freundlich, J.S.; Davey, R.A.; Madrid, P.B.; Ekins, S. Repurposing the Antimalarial Pyronaridine Tetraphosphate to Protect against Ebola Virus Infection. PLoS Negl. Trop. Dis. 2019, 13, e0007890. [Google Scholar] [CrossRef] [PubMed]
  21. Jackson, N.; Alhussan, A.; Bromma, K.; Jay, D.; Donnelly, J.C.; West, F.G.; Lavasanifar, A.; Weinfeld, M.; Beckham, W.; Chithrani, D.B. Repurposing Antimalarial Pyronaridine as a DNA Repair Inhibitor to Exploit the Full Potential of Gold-Nanoparticle-Mediated Radiation Response. Pharmaceutics 2022, 14, 2795. [Google Scholar] [CrossRef]
  22. Zuo, S.; Li, Q.; Liu, X.; Feng, H.; Chen, Y. The Potential Therapeutic Effects of Artesunate on Stroke and Other Central Nervous System Diseases. Biomed. Res. Int. 2016, 2016, 1489050. [Google Scholar] [CrossRef]
  23. Ho, W.E.; Peh, H.Y.; Chan, T.K.; Wong, W.S.F. Artemisinins: Pharmacological Actions beyond Anti-Malarial. Pharmacol. Ther. 2014, 142, 126–139. [Google Scholar] [CrossRef] [PubMed]
  24. Raffetin, A.; Bruneel, F.; Roussel, C.; Thellier, M.; Buffet, P.; Caumes, E.; Jauréguiberry, S. Use of Artesunate in Non-Malarial Indications. Med. Mal. Infect. 2018, 48, 238–249. [Google Scholar] [CrossRef]
  25. Puhl, A.C.; Fritch, E.J.; Lane, T.R.; Tse, L.V.; Yount, B.L.; Sacramento, C.Q.; Fintelman-Rodrigues, N.; Tavella, T.A.; Maranhão Costa, F.T.; Weston, S.; et al. Repurposing the Ebola and Marburg Virus Inhibitors Tilorone, Quinacrine, and Pyronaridine: In Vitro Activity against SARS-CoV-2 and Potential Mechanisms. ACS Omega 2021, 6, 7454–7468. [Google Scholar] [CrossRef]
  26. Jeong, D.E.; Song, H.J.; Lim, S.; Lee, S.J.; Lim, J.E.; Nam, D.H.; Joo, K.M.; Jeong, B.C.; Jeon, S.S.; Choi, H.Y.; et al. Repurposing the Anti-Malarial Drug Artesunate as a Novel Therapeutic Agent for Metastatic Renal Cell Carcinoma Due to Its Attenuation of Tumor Growth, Metastasis, and Angiogenesis. Oncotarget 2015, 6, 33046–33064. [Google Scholar] [CrossRef]
  27. Vandewynckel, Y.P.; Laukens, D.; Geerts, A.; Vanhove, C.; Descamps, B.; Colle, I.; Devisscher, L.; Bogaerts, E.; Paridaens, A.; Verhelst, X.; et al. Therapeutic Effects of Artesunate in Hepatocellular Carcinoma: Repurposing an Ancient Antimalarial Agent. Eur. J. Gastroenterol. Hepatol. 2014, 26, 861–870. [Google Scholar] [CrossRef] [PubMed]
  28. Bhise, N.; Agarwal, M.; Thakur, N.; Akshay, P.S.; Cherian, S.; Lole, K. Repurposing of Artesunate, an Antimalarial Drug, as a Potential Inhibitor of Hepatitis E Virus. Arch. Virol. 2023, 168, 147. [Google Scholar] [CrossRef]
  29. Huang, S.; Galaj, E.; Wang, J.; Guo, Y.; Wang, S.; Shi, M.; Yin, X.; Liu, K.; Luo, Y.; Meng, L.; et al. Repurposing Antimalarial Artesunate for the Prophylactic Treatment of Depression: Evidence from Preclinical Research. Brain Behav. 2023, 13, e2833. [Google Scholar] [CrossRef]
  30. Ramirez, I.; Marchion, D.; Xiong, Y.; Abbasi, F.; Boac, B.; McClung, C.; Al Sawah, E.; Judson, P.; Apte, S.M.; Lancaster, J.M. Repurposing Artesunate, an Anti-Malarial, for Ovarian Cancer Treatment: Mechanistic Insights from Cell Line Models. Gynecol. Oncol. 2015, 137, 207. [Google Scholar] [CrossRef]
  31. Lu, X.; Efferth, T. Repurposing of Artemisinin-Type Drugs for the Treatment of Acute Leukemia. Semin. Cancer Biol. 2021, 68, 291–312. [Google Scholar] [CrossRef]
  32. Lane, T.R.; Dyall, J.; Mercer, L.; Goodin, C.; Foil, D.H.; Zhou, H.; Postnikova, E.; Liang, J.Y.; Holbrook, M.R.; Madrid, P.B.; et al. Repurposing Pyramax® for the Treatment of Ebola Virus Disease: Additivity of the Lysosomotropic Pyronaridine and Non-Lysosomotropic Artesunate. bioRxiv 2020, 13, 061333. [Google Scholar]
  33. Lane, T.R.; Dyall, J.; Mercer, L.; Goodin, C.; Foil, D.H.; Zhou, H.; Postnikova, E.; Liang, J.Y.; Holbrook, M.R.; Madrid, P.B.; et al. Repurposing Pyramax®, Quinacrine and Tilorone as Treatments for Ebola Virus Disease. Antivir. Res. 2020, 182, 104908. [Google Scholar] [CrossRef] [PubMed]
  34. Bae, J.-Y.; Lee, G.E.; Park, H.; Cho, J.; Kim, Y.-E.; Lee, J.-Y.; Ju, C.; Kim, W.-K.; Kim, J.I.; Park, M.-S. Pyronaridine and Artesunate Are Potential Antiviral Drugs against COVID-19 and Influenza. bioRxiv 2020. [Google Scholar] [CrossRef]
  35. Mithun, R.; Shubham, J.K.; Anil, G.J. Drug Repurposing—Hypothesis, Molecular Aspects and Therapeutic Applications; IntechOpen: London, UK, 2020. [Google Scholar]
  36. Kulkarni, V.S.; Alagarsamy, V.; Solomon, V.R.; Jose, P.A.; Murugesan, S. Drug Repurposing: An Effective Tool in Modern Drug Discovery. Russ. J. Bioorg. Chem. 2023, 49, 157–166. [Google Scholar] [CrossRef]
  37. Kang, D.W.; Kim, K.M.; Kim, J.H.; Cho, H.Y. Application of Minimal Physiologically-Based Pharmacokinetic Model to Simulate Lung and Trachea Exposure of Pyronaridine and Artesunate in Hamsters. Pharmaceutics 2023, 15, 838. [Google Scholar] [CrossRef] [PubMed]
  38. Morris, C.A.; Lopez-Lazaro, L.; Jung, D.; Methaneethorn, J.; Duparc, S.; Borghini-Fuhrer, I.; Pokorny, R.; Shin, C.S.; Fleckenstein, L. Drug-Drug Interaction Analysis of Pyronaridine/Artesunate and Ritonavir in Healthy Volunteers. Am. J. Trop. Med. Hyg. 2012, 86, 489–495. [Google Scholar] [CrossRef] [PubMed]
  39. Lindegardh, N.; Hanpithakpong, W.; Kamanikom, B.; Pattayaso, J.; Singhasivanon, P.; White, N.J.; Day, N.P.J. Quantification of Dihydroartemisinin, Artesunate and Artemisinin in Human Blood: Overcoming the Technical Challenge of Protecting the Peroxide Bridge. Bioanalysis 2011, 3, 1613–1624. [Google Scholar] [CrossRef] [PubMed]
  40. Stein, A.M.; Peletier, L.A. Predicting the Onset of Nonlinear Pharmacokinetics. CPT Pharmacomet. Syst. Pharmacol. 2018, 7, 670–677. [Google Scholar] [CrossRef]
  41. Cho, H.; Lee, E.K. Pkconverter: R Package to Convert the Pharmacokinetic Parameters. Transl. Clin. Pharmacol. 2019, 27, 73–79. [Google Scholar] [CrossRef]
  42. Bennett, K.; Si, Y.; Steinbach, T.; Zhang, J.; Li, Q. Pharmacokinetic and Pharmacodynamic Evaluation of Intramuscular Artesunate in Healthy Beagle Dogs. Am. J. Trop. Med. Hyg. 2008, 79, 36–41. [Google Scholar] [CrossRef]
  43. Kenyon, E.M. Interspecies Extrapolation. Methods Mol. Biol. 2012, 959, 501–520. [Google Scholar]
  44. Feng, Z.; Jiang, N.X.; Wang, C.Y.; Zhang, W. Pharmacokinetics of Pyronaridine, an Antimalarial in Rabbits. Acta Pharm. Sin. 1986, 21, 801–805. [Google Scholar]
  45. Wages, S.A.; Patchen, L.C.; Churchill, F.C. Analysis of Blood and Urine Samples from Macaca Mulata for Pyronaridine by High-Performance Liquid Chromatography with Electrochemical Detection. J. Chromatogr. B Biomed. Sci. Appl. 1990, 527, 115–126. [Google Scholar] [CrossRef] [PubMed]
  46. Chen, Y.C.; Fleckenstein, L. Improved Assay Method for the Determination of Pyronaridine in Plasma and Whole Blood by High-Performance Liquid Chromatography for Application to Clinical Pharmacokinetic Studies. J. Chromatogr. B Biomed. Sci. Appl. 2001, 752, 39–46. [Google Scholar] [CrossRef] [PubMed]
  47. Ni, Y.C.; Zhan, C.Q.; HA, S.H.; Shao, B.R. The Embryotoxicity of a New Antimalarial Pyronaridine in Rats. Acta Pharm. Sin. 1982, 17, 401–406. [Google Scholar]
  48. Zou, H.X.; Zhang, Y.F.; Zhong, D.F.; Jiang, Y.; Liu, F.; Zhao, Q.Y.; Zuo, Z.; Zhang, Y.F.; Yan, X.Y. Effect of Autoinduction and Food on the Pharmacokinetics of Furmonertinib and Its Active Metabolite Characterized by a Population Pharmacokinetic Model. Acta Pharmacol. Sin. 2022, 43, 1865–1874. [Google Scholar] [CrossRef] [PubMed]
  49. Cosson, V.; Jorga, K.; Fuseau, E. Modeling of Metabolite Pharmacokinetics in a Large Pharmacokinetic Data Set: An Application. In Pharmacometrics: The Science of Quantitative Pharmacology; Wiley: Hoboken, NJ, USA, 2006. [Google Scholar]
  50. Keiser, J.; Gruyer, M.S.; Perrottet, N.; Zanolari, B.; Mercier, T.; Decosterd, L. Pharmacokinetic Parameters of Artesunate and Dihydroartemisinin in Rats Infected with Fasciola Hepatica. J. Antimicrob. Chemother. 2009, 63, 543–549. [Google Scholar] [CrossRef] [PubMed]
  51. Li, Q.; Xie, L.H.; Si, Y.; Wong, E.; Upadhyay, R.; Yanez, D.; Weina, P.J. Toxicokinetics and Hydrolysis of Artelinate and Artesunate in Malaria-Infected Rats. Int. J. Toxicol. 2005, 24, 241–250. [Google Scholar] [CrossRef] [PubMed]
  52. Zhu, F.; Du, F.; Li, X.; Xing, J. An Investigation of the Auto-Induction of and Gender-Related Variability in the Pharmacokinetics of Dihydroartemisinin in the Rat. Malar. J. 2012, 11, 379. [Google Scholar] [CrossRef] [PubMed]
  53. Xing, J.; Bai, K.H.; Liu, T.; Wang, R.L.; Zhang, L.F.; Zhang, S.Q. The Multiple-Dosing Pharmacokinetics of Artemether, Artesunate, and Their Metabolite Dihydroartemisinin in Rats. Xenobiotica 2011, 41, 252–258. [Google Scholar] [CrossRef]
  54. Smith, D.A.; Beaumont, K.; Maurer, T.S.; Di, L. Volume of Distribution in Drug Design. J. Med. Chem. 2015, 58, 5691–5698. [Google Scholar] [CrossRef]
  55. Murad, N.; Pasikanti, K.K.; Madej, B.D.; Minnich, A.; McComas, J.M.; Crouch, S.; Polli, J.W.; Weber, A.D. Predicting Volume of Distribution in Humans: Performance of in Silico Methods for a Large Set of Structurally Diverse Clinical Compounds. Drug Metab. Dispos. 2021, 49, 169–178. [Google Scholar] [CrossRef] [PubMed]
  56. Shimizu, H.; Yoshida, K.; Nakada, T.; Kojima, K.; Ogasawara, A.; Nakamaru, Y.; Yamazaki, H. Prediction of Human Distribution Volumes of Compounds in Various Elimination Phases Using Physiologically Based Pharmacokinetic Modeling and Experimental Pharmacokinetics in Animals. Drug Metab. Dispos. 2019, 47, 114–123. [Google Scholar] [CrossRef] [PubMed]
  57. del Amo, E.M.; Ghemtio, L.; Xhaard, H.; Yliperttula, M.; Urtti, A.; Kidron, H. Applying Linear and Non-Linear Methods for Parallel Prediction of Volume of Distribution and Fraction of Unbound Drug. PLoS ONE 2013, 8, e74758. [Google Scholar] [CrossRef] [PubMed]
  58. Chai, L.; Wang, R.; Wang, Y.; Guo, W.; Li, N.; Zuo, H.; Wang, Y.; Duan, D.; Ren, G.; Zheng, B.; et al. Auto-Induction of Intestinal First-Pass Effect Related Time-Dependent Pharmacokinetics of Artemisinin Rather than Dihydroartemisinin. J. Pharm. Sci. 2021, 110, 458–466. [Google Scholar] [CrossRef] [PubMed]
  59. Smythe, W.; Khandelwal, A.; Merle, C.; Rustomjee, R.; Gninafon, M.; Lo, M.B.; Sow, O.B.; Olliaro, P.L.; Lienhardt, C.; Horton, J.; et al. A Semimechanistic Pharmacokinetic-Enzyme Turnover Model for Rifampin Autoinduction in Adult Tuberculosis Patients. Antimicrob. Agents Chemother. 2012, 56, 2091–2098. [Google Scholar] [CrossRef] [PubMed]
  60. Svensson, R.J.; Aarnoutse, R.E.; Diacon, A.H.; Dawson, R.; Gillespie, S.H.; Boeree, M.J.; Simonsson, U.S.H. A Population Pharmacokinetic Model Incorporating Saturable Pharmacokinetics and Autoinduction for High Rifampicin Doses. Clin. Pharmacol. Ther. 2018, 103, 674–683. [Google Scholar] [CrossRef] [PubMed]
  61. Shaw, J.P.; Jaw-Tsai, S. An Interspecies Extrapolation of the Pharmacokinetics of Telavancin, a Rapidly Bactericidal, Concentration-Dependent Antibiotic. Xenobiotica 2011, 41, 82–89. [Google Scholar] [CrossRef] [PubMed]
  62. Boxenbaum, H. Interspecies Scaling, Allometry, Physiological Time, and the Ground Plan of Pharmacokinetics. J. Pharmacokinet. Biopharm. 1982, 10, 201–227. [Google Scholar] [CrossRef]
  63. Mahmood, I.; Balian, J.D. Interspecies Scaling: Predicting Clearance of Drugs in Humans. Three Different Approaches. Xenobiotica 1996, 26, 887–895. [Google Scholar] [CrossRef]
  64. Huang, Q.; Riviere, J.E. The Application of Allometric Scaling Principles to Predict Pharmacokinetic Parameters across Species. Expert Opin. Drug Metab. Toxicol. 2014, 10, 1241–1253. [Google Scholar] [CrossRef]
  65. Mahmood, I. Application of Allometric Principles for the Prediction of Pharmacokinetics in Human and Veterinary Drug Development. Adv. Drug Deliv. Rev. 2007, 59, 1177–1192. [Google Scholar] [CrossRef] [PubMed]
  66. Jolling, K.; Perez Ruixo, J.J.; Hemeryck, A.; Vermeulen, A.; Greway, T. Mixed-Effects Modelling of the Interspecies Pharmacokinetic Scaling of Pegylated Human Erythropoietin. Eur. J. Pharm. Sci. 2005, 24, 465–475. [Google Scholar] [CrossRef] [PubMed]
  67. Chu, W.Y.; Dorlo, T.P.C. Pyronaridine: A Review of Its Clinical Pharmacology in the Treatment of Malaria. J. Antimicrob. Chemother. 2023, 78, 2406–2418. [Google Scholar] [CrossRef] [PubMed]
  68. Ayyoub, A.; Methaneethorn, J.; Ramharter, M.; Djimde, A.A.; Tekete, M.; Duparc, S.; Borghini-Fuhrer, I.; Shin, J.S.; Fleckenstein, L. Population Pharmacokinetics of Pyronaridine in Pediatric Malaria Patients. Antimicrob. Agents Chemother. 2016, 60, 1450–1458. [Google Scholar] [CrossRef]
  69. Miller, R.S.; Li, Q.; Cantilena, L.R.; Leary, K.J.; Saviolakis, G.A.; Melendez, V.; Smith, B.; Weina, P.J. Pharmacokinetic Profiles of Artesunate Following Multiple Intravenous Doses of 2, 4, and 8mg/Kg in Healthy Volunteers: Phase 1b Study. Malar. J. 2012, 11, 255. [Google Scholar] [CrossRef] [PubMed]
  70. Tarning, J.; Rijken, M.J.; McGready, R.; Phyo, A.P.; Hanpithakpong, W.; Day, N.P.J.; White, N.J.; Nosten, F.; Lindegardh, N. Population Pharmacokinetics of Dihydroartemisinin and Piperaquine in Pregnant and Nonpregnant Women with Uncomplicated Malaria. Antimicrob. Agents Chemother. 2012, 56, 1997–2007. [Google Scholar] [CrossRef] [PubMed]
  71. Birgersson, S.; Valea, I.; Tinto, H.; Traore-Coulibaly, M.; Toe, L.C.; Hoglund, R.M.; Van Geertruyden, J.P.; Ward, S.A.; D’Alessandro, U.; Abelö, A.; et al. Population Pharmacokinetics of Artesunate and Dihydroartemisinin in Pregnant and Non-Pregnant Women with Uncomplicated Plasmodium Falciparum Malaria in Burkina Faso: An Open Label Trial. Wellcome Open Res. 2020, 4, 45. [Google Scholar] [CrossRef] [PubMed]
  72. Simpson, J.A.; Agbenyega, T.; Barnes, K.I.; Di Perri, G.; Folb, P.; Gomes, M.; Krishna, S.; Krudsood, S.; Looareesuwan, S.; Mansor, S.; et al. Population Pharmacokinetics of Artesunate and Dihydroartemisinin Following Intra-Rectal Dosing of Artesunate in Malaria Patients. PLoS Med. 2006, 3, e444. [Google Scholar] [CrossRef]
  73. Tan, B.; Naik, H.; Jang, I.J.; Yu, K.S.; Kirsch, L.E.; Shin, C.S.; Craft, J.C.; Fleckenstein, L. Population Pharmacokinetics of Artesunate and Dihydroartemisinin Following Single-and Multiple-Dosing of Oral Artesunate in Healthy Subjects. Malar. J. 2009, 8, 304. [Google Scholar] [CrossRef]
  74. Newton, P.N.; Barnes, K.I.; Smith, P.J.; Evans, A.C.; Chierakul, W.; Ruangveerayuth, R.; White, N.J. The Pharmacokinetics of Intravenous Artesunate in Adults with Severe Falciparum Malaria. Eur. J. Clin. Pharmacol. 2006, 62, 1003–1009. [Google Scholar] [CrossRef]
  75. Nealon, C.; Dzeing, A.; Müller-Römer, U.; Planche, T.; Sinou, V.; Kombila, M.; Kremsner, P.G.; Parzy, D.; Krishna, S. Intramuscular Bioavailability and Clinical Efficacy of Artesunate in Gabonese Children with Severe Malaria. Antimicrob. Agents Chemother. 2002, 46, 3933–3939. [Google Scholar] [CrossRef] [PubMed]
  76. Li, Q.; Cantilena, L.R.; Leary, K.J.; Saviolakis, G.A.; Miller, R.S.; Melendez, V.; Weina, P.J. Pharmacokinetic Profiles of Artesunate after Single Intravenous Doses at 0.5,1,2,4, and 8 Mg/Kg in Healthy Volunteers: A Phase I Study. Am. J. Trop. Med. Hyg. 2009, 81, 615–621. [Google Scholar] [CrossRef] [PubMed]
  77. Morris, C.A.; Duparc, S.; Borghini-Fuhrer, I.; Jung, D.; Shin, C.S.; Fleckenstein, L. Review of the Clinical Pharmacokinetics of Artesunate and Its Active Metabolite Dihydroartemisinin Following Intravenous, Intramuscular, Oral or Rectal Administration. Malar. J. 2011, 10, 263. [Google Scholar] [CrossRef] [PubMed]
  78. Kouakou, Y.I.; Tod, M.; Leboucher, G.; Lavoignat, A.; Bonnot, G.; Bienvenu, A.L.; Picot, S. Systematic Review of Artesunate Pharmacokinetics: Implication for Treatment of Resistant Malaria. Int. J. Infect. Dis. 2019, 89, 30–44. [Google Scholar] [CrossRef]
  79. Batty, K.T.; Thu, L.T.A.; Davis, T.M.E.; Ilett, K.F.; Mai, T.X.; Hung, N.C.; Tien, N.P.; Powell, S.M.; Van Thien, H.; Binh, T.Q.; et al. A Pharmacokinetic and Pharmacodynamic Study of Intravenous vs Oral Artesunate in Uncomplicated Falciparum Malaria. Br. J. Clin. Pharmacol. 1998, 45, 123–129. [Google Scholar] [CrossRef] [PubMed]
  80. Davis, T.M.E. The Pharmacokinetic Properties of Intramuscular Artesunate and Rectal Dihydroartemisinin in Uncomplicated Falciparum Malaria. Br. J. Clin. Pharmacol. 2002, 53, 23–30. [Google Scholar] [CrossRef]
  81. Davis, T.M.E.; Phuong, H.L.; Ilett, K.F.; Hung, N.C.; Batty, K.T.; Phuong, V.D.B.; Powell, S.M.; Thien, H.V.; Binh, T.Q. Pharmacokinetics and Pharmacodynamics of Intravenous Artesunate in Severe Falciparum Malaria. Antimicrob. Agents Chemother. 2001, 45, 181–186. [Google Scholar] [CrossRef]
  82. Krishna, S.; Planche, T.; Agbenyega, T.; Woodrow, C.; Agranoff, D.; Bedu-Addo, G.; Owusu-Ofori, A.K.; Appiah, J.A.; Ramanathan, S.; Mansor, S.M.; et al. Bioavailability and Preliminary Clinical Efficacy of Intrarectal Artesunate in Ghanaian Children with Moderate Malaria. Antimicrob. Agents Chemother. 2001, 45, 509–516. [Google Scholar] [CrossRef] [PubMed]
  83. Hien, T.T.; Davis, T.M.E.; Chuong, L.V.; Ilett, K.F.; Sinh, D.X.T.; Phu, N.H.; Agus, C.; Chiswell, G.M.; White, N.J.; Farrar, J. Comparative Pharmacokinetics of Intramuscular Artesunate and Artemether in Patients with Severe Falciparum Malaria. Antimicrob. Agents Chemother. 2004, 48, 4234–4239. [Google Scholar] [CrossRef]
  84. Holt, K.; Nagar, S.; Korzekwa, K. Methods to Predict Volume of Distribution. Curr. Pharmacol. Rep. 2019, 5, 391–399. [Google Scholar] [CrossRef]
  85. Gillette, J.R. Factors Affecting Drug Metabolism. Ann. N. Y. Acad. Sci. 1971, 179, 43–66. [Google Scholar] [CrossRef] [PubMed]
  86. Sawada, Y.; Hanano, M.; Sugiyama, Y.; Harashima, H.; Iga, T. Prediction of the Volumes of Distribution of Basic Drugs in Humans Based on Data from Animals. J. Pharmacokinet. Biopharm. 1984, 12, 587–596. [Google Scholar] [CrossRef]
  87. Li, Q.; Xie, L.; Zhang, J.; Weina, P.J. The Distribution Pattern of Intravenous [14C] Artesunate in Rat Tissues by Quantitative Whole-Body Autoradiography and Tissue Dissection Techniques. J. Pharm. Biomed. Anal. 2008, 48, 876–884. [Google Scholar] [CrossRef]
  88. Li, Q.; Xie, L.H.; Haeberle, A.; Zhang, J.; Weina, P. The Evaluation of Radiolabeled Artesunate on Tissue Distribution in Rats and Protein Binding in Humans. Am. J. Trop. Med. Hyg. 2006, 75, 817–826. [Google Scholar] [CrossRef]
  89. Xie, L.H.; Li, Q.; Zhang, J.; Weina, P.J. Pharmacokinetics, Tissue Distribution and Mass Balance of Radiolabeled Dihydroartemisinin in Male Rats. Malar. J. 2009, 8, 112. [Google Scholar] [CrossRef] [PubMed]
  90. Doke, S.K.; Dhawale, S.C. Alternatives to Animal Testing: A Review. Saudi Pharm. J. 2015, 23, 223–229. [Google Scholar] [CrossRef]
  91. FDA. Facts about FDA and Animal Welfare, Testing & Research; FDA: Silver Spring, MA, USA, 2024.
  92. Mahmood, I. Interspecies Scaling: Predicting Volumes, Mean Residence Time and Elimination Half-Life. Some Suggestions. J. Pharm. Pharmacol. 1998, 50, 493–499. [Google Scholar] [CrossRef]
Figure 1. Model predictions and observations for blood concentrations of pyronaridine. (a) Single-dose PK profile for rats and dogs. (b) Multiple-dose PK profiles for hamsters and rats. Circles and lines are individual and average blood concentrations, respectively. The gray solid line represents the 2.5th–97.5th percentile range. In the hamster PK profile, closed circles with gray solid lines represent the low-dose group, and open circles with black solid lines represent the high-dose group.
Ijms 25 06998 g001
Figure 2. Model predictions and observations for blood concentrations of artesunate and dihydroartemisinin. (a) Single-dose PK profile for rats. (b) Multiple-dose PK profile for hamsters. (c) Multiple-dose PK profile for rats. Blue squares with blue lines represent artesunate (left y-axis), and red circles with red lines represent dihydroartemisinin (right y-axis), respectively. The dotted lines represent the 2.5th–97.5th percentile range. In the hamster PK profile, closed squares and circles with dashed lines represent the low-dose group, and open squares and circles with solid lines represent the high-dose group.
Ijms 25 06998 g002
Figure 3. Relationship between (a) the absorption rate constant (ka), (b) the steady-state volume of distribution (Vss/F), and (c) the clearance (CL/F) of pyronaridine and body weight in hamsters, rats, dogs, and humans. The allometric equations are log Y = −0.1928 × log W + 0.5146 for ka, log Y = 0.8220 × log W + 1.7193 for Vss/F, and log Y = 0.7296 × log W + 0.1048 for CL/F, respectively.
Ijms 25 06998 g003
Figure 4. Relationship between (a) the absorption rate constant (ka), (b) the steady-state volume of distribution (Vss/F), and (c) the clearance (CL/F) of artesunate and body weight in hamsters, rats, dogs, and humans. (d) the volume of distribution [Vm/(F·Fm)] and (e) the clearance [CLm/(F·Fm)] for dihydroartemisinin. The allometric equations for artesunate are log Y = −0.250 × log W + 0.0428 for ka, log Y = −1.4725 × log W + 0.8671 for Vss/F, and log Y = −0.1547 × log W + 1.4524 for CL/F, respectively. The allometric equations for dihydroartemisinin are log Y = 1.2933 × log W − 0.9876 for Vm/(F·Fm), and log Y = 0.2509 × log W + 1.5725 for CLm/(F·Fm), respectively.
Ijms 25 06998 g004
Figure 5. The developed PK models for pyronaridine and artesunate. (a) One-compartment model of pyronaridine in hamsters and rats. (b) Two-compartment model of pyronaridine in dogs. The parent-metabolite model with auto-induction of artesunate and dihydroartemisinin in (c) hamsters and (d) rats.
Ijms 25 06998 g005
Table 1. PK parameter estimates of pyronaridine, artesunate, and dihydroartemisinin.
ParameterUnitEstimateCV%IIV * (%RSE)
Pyronaridine
Hamster
ka1/h11.6230.21-
V/FL/kg53.326.58-
CL/FL/h/kg2.154.36-
ε-0.367.95-
Rat
ka1/h1.678.840.02 (13.44)
V/FL/kg110.004.961.69 (16.25)
CL/FL/h/kg2.186.150.04 (28.17)
ε-0.344.13-
Dog
ka1/h2.4622.430.46 (60.48)
V/FL/kg18.9810.200.03 (142.17)
V2/FL/kg13.7017.82-
CL/FL/h/kg0.688.540.05 (48.35)
CL2/FL/h/kg1.3028.88-
ε-0.2010.15-
Artesunate and dihydroartemisinin
Hamster
ka1/h2.0815.02-
V/FL/kg1571.7118.95-
CL/FL/h/kg3555.949.60-
Vm/(F∙Fm)L/kg0.0211.70-
CLm/(F∙Fm)L/h/kg117.689.66-
kenz1/h47.4013.19-
Emax-7.0610.70-
EC50nmol/L0.4213.37-
ε (artesunate)-4.3814.21-
ε (dihydroartemisinin)-1033.7612.12-
Rat
ka1/h1.5424.85
V/FL/kg33.0314.81
V2/FL/kg481.0521.47
CL/FL/h/kg13.3314.61
CL2/FL/h/kg82.6913.450.18 (0.06)
Vm/(F∙Fm)L/kg0.1625.23
CLm/(F∙Fm)L/h/kg237.2534.091.13 (0.29)
kenz1/h1.0428.481.32 (0.41)
Emax-76.8919.64
EC50nmol/L0.4942.60
ε (artesunate)-35.1918.81-
ε (dihydroartemisinin)-194.6725.47-
* inter-individual variability (ω); IIVs in hamsters could not be estimated since the naïve-pooled method was used for PK modeling.
Table 2. Summary of pharmacokinetic study design for pyronaridine tetraphosphate/artesunate in hamsters, rats, and dogs.
SpeciesGroupNDosage Regimen
(Pyronaridine/Artesunate)
Blood Sampling Time (Hour)Ref.
HamsterH160180/60 mg/kg daily
(for 3 days)
0, 0.08, 0.25, 0.5, 0.75, 1, 2, 4, 8, 12, 24, 47, 48.08, 48.25, 48.5, 48.75, 49, 50, 52, 56, 60, 72[37]
HamsterH248360/120 mg/kg daily
(for 3 days)
0, 0.08, 0.25, 0.5, 0.75, 1, 2, 4, 8, 12, 24, 47, 48.08, 48.25, 48.5, 48.75, 49, 50, 52, 56, 60, 72[37]
RatR1360/20 mg/kg once0, (0.05, 0.08, 0.16, 0.33, 0.5, 0.75), 1, 2, 4, 8, 12, 24, 48, 96, 144-
360/20 mg/kg once0, (0.05, 0.08, 0.16, 0.33, 0.5, 0.75), 1, 2, 4, 8, 12, 24, 48, 96, 144, 216-
RatR2560/20 mg/kg daily
(for 3 days)
0, (0.05, 0.08, 0.16, 0.33, 0.5, 0.75), 1, 2, 4, 8, 12, 24, 48, (48.05, 48.17, 48.33, 48.5, 48.75), 49, 50, 52, 56, 60, 72, 96, 144, 192, 264-
DogD1990/- mg/head once0, 0.5, 1, 2, 4, 6, 24, 72, 120-
Table 3. The equations of the PK models for pyronaridine, artesunate, and dihydroartesunate.
One-compartment model of pyronaridine in hamsters and rats
d A a d t = k a · A a
d A 1 d t = k a · A a C · C L / F
C = A 1 / V
Two-compartment model of pyronaridine in dogs
d A a d t = k a · A a
d A 1 d t = k a · A a + C 2 · C L 2 / F C · C L 2 / F C · C L / F
d A 2 d t = C · C L 2 / F C 2 · C L 2 / F
C = A 1 / V
C 2 = A 2 / V 2
The parent-metabolite model with auto-induction for artesunate and dihydroartemisinin in hamsters
d A a d t = k a · A a
d A 1 d t = k a · A a C · C L / F · A E N Z
d A m d t = C · C L / F · A E N Z C m · C L m / ( F · F m )
d A E N Z d t = k E N Z · 1 + E m a x · C E C 50 + C k E N Z · A E N Z
C = A 1 / V
C m = A m / V m
The parent-metabolite model with auto-induction for artesunate and dihydroartemisinin in rats
d A a d t = k a · A a
d A 1 d t = k a · A a + C 2 · C L 2 / F C · C L 2 / F C · C L / F · A E N Z
d A 2 d t = C · C L 2 / F C 2 · C L 2 / F
d A m d t = C · C L / F · A E N Z C m · C L m / ( F · F m )
d A E N Z d t = k E N Z · 1 + E m a x · C E C 50 + C k E N Z · A E N Z
C = A 1 / V
C 2 = A 2 / V 2
C m = A m / V m
where Aa, A1, A2, and Am are drug amounts in the absorption, central, peripheral, and metabolite compartments, respectively. C, C2, and Cm are drug concentrations in the central, peripheral, and metabolite compartments, respectively. ka is the absorption rate constant, and kENZ is the enzyme degradation rate (which also serves as a zero-order rate constant for enzyme production). CL, CL2, and CLm are total, intercompartmental, and metabolite clearance, respectively. V, V2, and Vm are the volumes of distribution in the central, peripheral, and metabolite compartments, respectively. F is the oral bioavailability, and Fm is the metabolized fraction of the drug. Emax is the maximum induction in enzyme formation rate, and EC50 is the drug concentration that produces 50% of the Emax.
Disclaimer/Publisher’s Note: The statements, opinions and data contained in all publications are solely those of the individual author(s) and contributor(s) and not of MDPI and/or the editor(s). MDPI and/or the editor(s) disclaim responsibility for any injury to people or property resulting from any ideas, methods, instructions or products referred to in the content.

