
Cancerous Conditions Accelerate the Aging of Skeletal Muscle via Mitochondrial DNA Damage


Abstract
1. Introduction
2. Results
2.1. Age-Related Changes of Mouse Skeletal Muscle
2.2. Changes in Aging Marker Levels in an In Vitro Cachexia Model
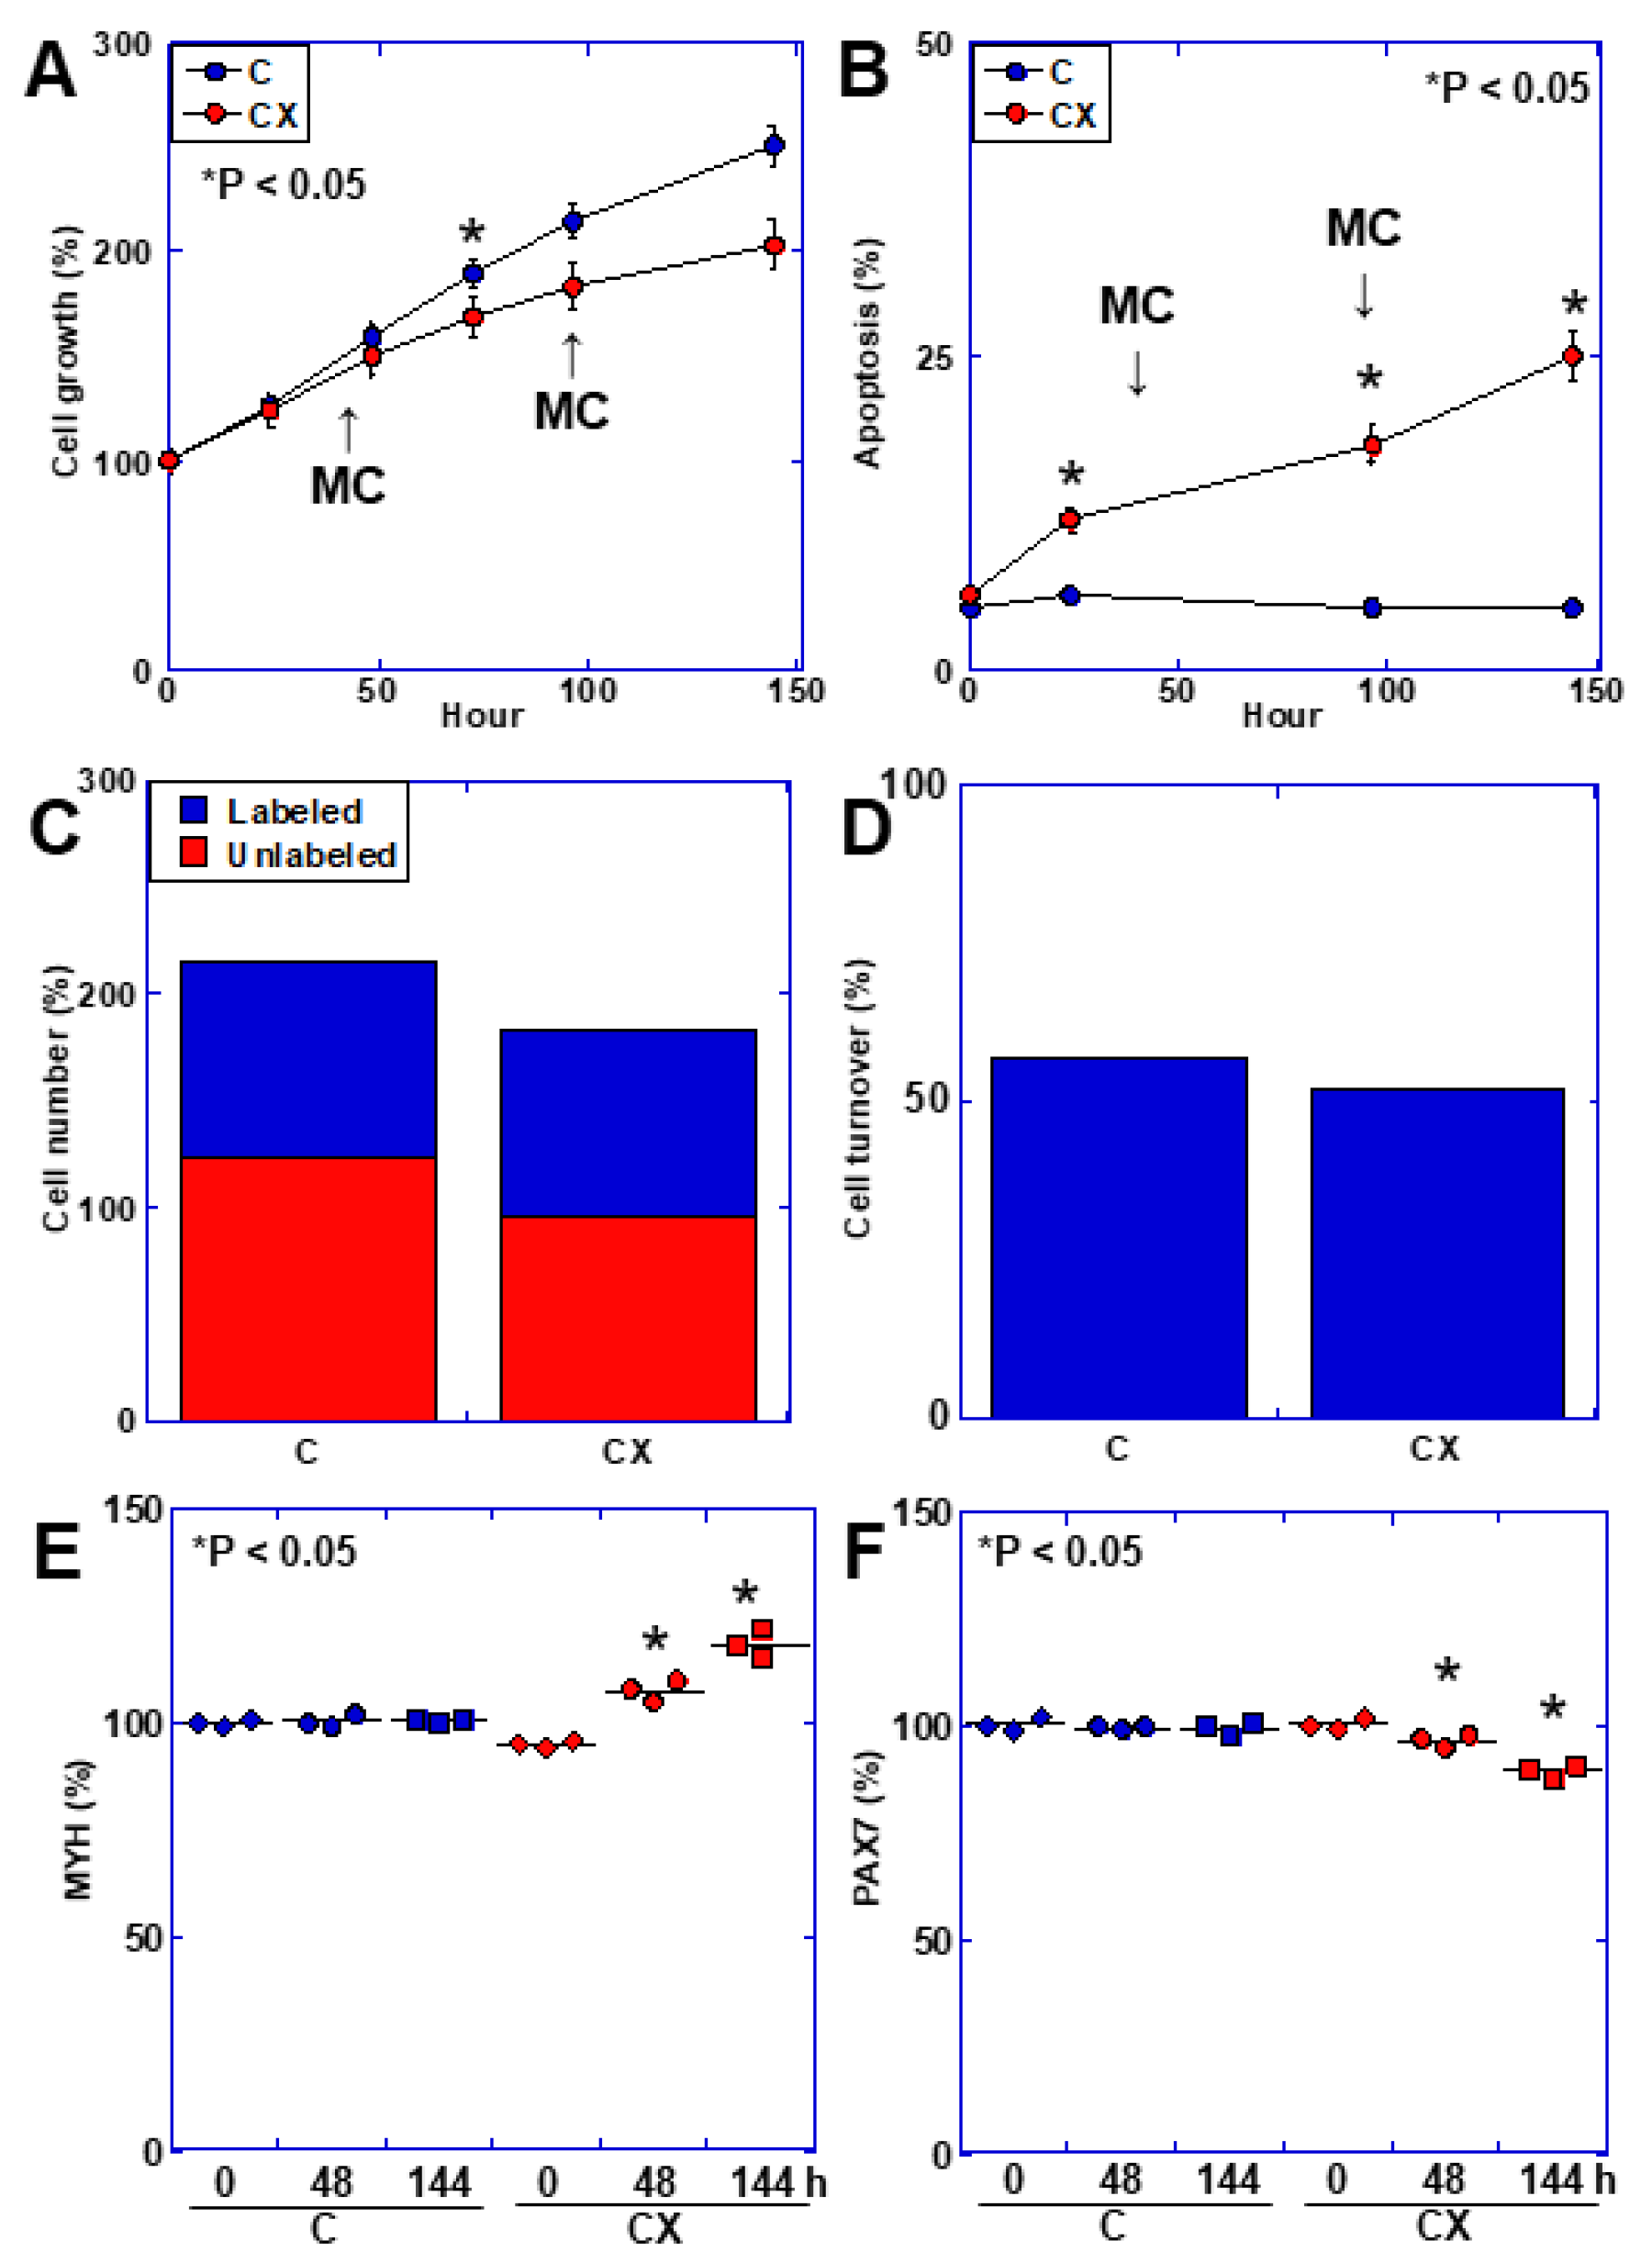
2.3. Muscle Cell Kinetics in an In Vitro Cachexia Model
2.4. Mitochondrial Alterations in C2C12 Cells in an In Vitro Cachexia Model
2.5. Skeletal Muscle Aging Phenotypes in a Mouse Model of Cachexia
2.6. Skeletal Muscle Kinetics in the Mouse Cachexia Model
2.7. Skeletal Muscle Mitochondrial Alterations in the Mouse Cachexia Model
2.8. Mechanism of Mitochondrial DNA Damage
3. Discussion
4. Materials and Methods
4.1. Animals
4.2. Cell Lines and Reagents
4.3. In Vitro Cachexia Model
4.4. Protein Extraction
4.5. Western Blot Analysis
4.6. Mitochondrial Imaging
4.7. Enzyme-Linked Immunosorbent Assay (ELISA) and Fluorometric Assay
4.8. DNA Isolation
4.9. Telomere Quantification
- ∆Cq (telomere, TEL) = Cq (TEL, sample 2) − Cq (TEL, sample 1), where TEL = telomere and ∆Cq is the difference in quantification cycles between two samples.
- ∆Cq (single copy reference, SCR) = Cq (SCR, sample 2) − Cq (SCR, sample 1).
- ∆∆Cq = ∆Cq (TEL) − ∆Cq (SCR).
- Relative telomere length of sample 2 to sample 1 (fold) = 2−∆∆Cq.
4.10. Mitochondrial DNA Mutations
4.11. Mitochondrial Stress Test (Seahorse Assay)
4.12. Statistical Analysis
Author Contributions
Funding
Institutional Review Board Statement
Informed Consent Statement
Data Availability Statement
Acknowledgments
Conflicts of Interest
Abbreviations
References
- Hjermstad, M.J.; Jakobsen, G.; Arends, J.; Balstad, T.R.; Brown, L.R.; Bye, A.; Coats, A.J.S.; Dajani, O.F.; Dolan, R.D.; Fallon, M.T.; et al. Quality of life endpoints in cancer cachexia clinical trials: Systematic review 3 of the cachexia endpoints series. J. Cachexia Sarcopenia Muscle 2024, 15, 794–815. [Google Scholar] [CrossRef]
- Argilés, J.M.; Busquets, S.; Stemmler, B.; López-Soriano, F.J. Cachexia and sarcopenia: Mechanisms and potential targets for intervention. Curr. Opin. Pharmacol. 2015, 22, 100–106. [Google Scholar] [CrossRef]
- Cui, P.; Li, X.; Huang, C.; Lin, D. Metabolomics-driven discovery of therapeutic targets for cancer cachexia. J. Cachexia Sarcopenia Muscle 2024, 15, 781–793. [Google Scholar] [CrossRef]
- Tian, X.; Lou, S.; Shi, R. From mitochondria to sarcopenia: Role of 17β-estradiol and testosterone. Front. Endocrinol. 2023, 14, 1156583. [Google Scholar] [CrossRef]
- Bertocchi, E.; Frigo, F.; Buonaccorso, L.; Venturelli, F.; Bassi, M.C.; Tanzi, S. Cancer cachexia: A scoping review on non-pharmacological interventions. Asia Pac. J. Oncol. Nurs. 2024, 11, 100438. [Google Scholar] [CrossRef]
- Morena da Silva, F.; Lim, S.; Cabrera, A.R.; Schrems, E.R.; Jones, R.G.; Rosa-Caldwell, M.E.; Washington, T.A.; Murach, K.A.; Greene, N.P. The time-course of cancer cachexia onset reveals biphasic transcriptional disruptions in female skeletal muscle distinct from males. BMC Genomics 2023, 24, 374. [Google Scholar] [CrossRef]
- Blum, D.; Stene, G.B.; Solheim, T.S.; Fayers, P.; Hjermstad, M.J.; Baracos, V.E.; Fearon, K.; Strasser, F.; Kaasa, S. Validation of the Consensus-Definition for Cancer Cachexia and evaluation of a classification model--a study based on data from an international multicentre project (EPCRC-CSA). Ann. Oncol. 2014, 25, 1635–1642. [Google Scholar] [CrossRef]
- Fearon, K.C.; Voss, A.C.; Hustead, D.S. Definition of cancer cachexia: Effect of weight loss, reduced food intake, and systemic inflammation on functional status and prognosis. Am. J. Clin. Nutr. 2006, 83, 1345–1350. [Google Scholar] [CrossRef]
- Mariean, C.R.; Tiucă, O.M.; Mariean, A.; Cotoi, O.S. Cancer Cachexia: New Insights and Future Directions. Cancers 2023, 15, 5590. [Google Scholar] [CrossRef]
- Ryan, A.M.; Sullivan, E.S. Impact of musculoskeletal degradation on cancer outcomes and strategies for management in clinical practice. Proc. Nutr. Soc. 2021, 80, 73–91. [Google Scholar] [CrossRef]
- Anabtawi, N.M.; Pasala, M.S.; Grimshaw, A.A.; Kharel, P.; Bal, S.; Godby, K.; Siwakoti, A.; Buford, T.W.; Bhatia, S.; Costa, L.J.; et al. Low skeletal muscle mass and treatment outcomes among adults with haematologic malignancies: A systematic review and meta-analysis. J. Cachexia Sarcopenia Muscle 2024, 15, 1084–1093. [Google Scholar] [CrossRef] [PubMed]
- Bonomi, P.D.; Crawford, J.; Dunne, R.F.; Roeland, E.J.; Smoyer, K.E.; Siddiqui, M.K.; McRae, T.D.; Rossulek, M.I.; Revkin, J.H.; Tarasenko, L.C. Mortality burden of pre-treatment weight loss in patients with non-small-cell lung cancer: A systematic literature review and meta-analysis. J. Cachexia Sarcopenia Muscle 2024, in press. [Google Scholar] [CrossRef]
- Shachar, S.S.; Williams, G.R.; Muss, H.B.; Nishijima, T.F. Prognostic value of sarcopenia in adults with solid tumours: A meta-analysis and systematic review. Eur. J. Cancer 2016, 57, 58–67. [Google Scholar] [CrossRef]
- Zhou, X.; Wang, J.L.; Lu, J.; Song, Y.; Kwak, K.S.; Jiao, Q.; Rosenfeld, R.; Chen, Q.; Boone, T.; Simonet, W.S.; et al. Reversal of cancer cachexia and muscle wasting by ActRIIB antagonism leads to prolonged survival. Cell 2010, 142, 531–543. [Google Scholar] [CrossRef] [PubMed]
- Xu, X.; Wen, Z. The mediating role of inflammaging between mitochondrial dysfunction and sarcopenia in aging: A review. Am. J. Clin. Exp. Immunol. 2023, 12, 109–126. [Google Scholar]
- Lei, T.; Rui, Y.; Xiaoshuang, Z.; Jinglan, Z.; Jihong, Z. Mitochondria transcription and cancer. Cell Death Discov. 2024, 10, 168. [Google Scholar] [CrossRef]
- Alizadeh Pahlavani, H.; Laher, I.; Knechtle, B.; Zouhal, H. Exercise and mitochondrial mechanisms in patients with sarcopenia. Front. Physiol. 2022, 13, 1040381. [Google Scholar] [CrossRef] [PubMed]
- Careccia, G.; Mangiavini, L.; Cirillo, F. Regulation of Satellite Cells Functions during Skeletal Muscle Regeneration: A Critical Step in Physiological and Pathological Conditions. Int. J. Mol. Sci. 2023, 25, 512. [Google Scholar] [CrossRef]
- Rutledge, C.A. Molecular mechanisms underlying sarcopenia in heart failure. J. Cardiovasc. Aging 2024, 4, 7. [Google Scholar] [CrossRef]
- Lena, A.; Anker, M.S.; Springer, J. Muscle Wasting and Sarcopenia in Heart Failure-The Current State of Science. Int. J. Mol. Sci. 2020, 21, 6549. [Google Scholar] [CrossRef]
- Ali, S.; Garcia, J.M. Sarcopenia, cachexia and aging: Diagnosis, mechanisms and therapeutic options—A mini-review. Gerontology 2014, 60, 294–305. [Google Scholar] [CrossRef] [PubMed]
- Tang, H.; Inoki, K.; Brooks, S.V.; Okazawa, H.; Lee, M.; Wang, J.; Kim, M.; Kennedy, C.L.; Macpherson, P.C.D.; Ji, X.; et al. mTORC1 underlies age-related muscle fiber damage and loss by inducing oxidative stress and catabolism. Aging Cell 2019, 18, e12943. [Google Scholar] [CrossRef]
- D’Arcy, M.S. Mitophagy in health and disease. Molecular mechanisms, regulatory pathways, and therapeutic implications. Apoptosis 2024, in press. [Google Scholar] [CrossRef]
- Picca, A.; Guerra, F.; Calvani, R.; Coelho-Júnior, H.J.; Leeuwenburgh, C.; Bucci, C.; Marzetti, E. The contribution of mitochondrial DNA alterations to aging, cancer, and neurodegeneration. Exp. Gerontol. 2023, 178, 112203. [Google Scholar] [CrossRef]
- Song, M.; Tang, Y.; Cao, K.; Qi, L.; Xie, K. Unveiling the role of interleukin-6 in pancreatic cancer occurrence and progression. Front. Endocrinol. 2024, 15, 1408312. [Google Scholar] [CrossRef]
- Ohmori, H.; Kawahara, I.; Mori, T.; Nukaga, S.; Luo, Y.; Kishi, S.; Fujiwara-Tani, R.; Mori, S.; Goto, K.; Sasaki, T.; et al. Evaluation of Parameters for Cancer-Induced Sarcopenia in Patients Autopsied after Death from Colorectal Cancer. Pathobiology 2019, 86, 306–314. [Google Scholar] [CrossRef] [PubMed]
- Tylutka, A.; Walas, Ł.; Zembron-Lacny, A. Level of IL-6, TNF, and IL-1β and age-related diseases: A systematic review and meta-analysis. Front. Immunol. 2024, 15, 1330386. [Google Scholar] [CrossRef]
- Mori, T.; Ohmori, H.; Luo, Y.; Mori, S.; Miyagawa, Y.; Nukaga, S.; Goto, K.; Fujiwara-Tani, R.; Kishi, S.; Sasaki, T.; et al. Giving combined medium-chain fatty acids and glucose protects against cancer-associated skeletal muscle atrophy. Cancer Sci. 2019, 110, 3391–3399. [Google Scholar] [CrossRef] [PubMed]
- Xie, X.; Huang, C. Role of the gut-muscle axis in mitochondrial function of ageing muscle under different exercise modes. Ageing Res. Rev. 2024, 98, 102316. [Google Scholar] [CrossRef]
- Herbst, A.; Prior, S.J.; Lee, C.C.; Aiken, J.M.; McKenzie, D.; Hoang, A.; Liu, N.; Chen, X.; Xun, P.; Allison, D.B.; et al. Skeletal muscle mitochondrial DNA copy number and mitochondrial DNA deletion mutation frequency as predictors of physical performance in older men and women. Geroscience 2021, 43, 1253–1264. [Google Scholar] [CrossRef]
- Vandiver, A.R.; Hoang, A.N.; Herbst, A.; Lee, C.C.; Aiken, J.M.; McKenzie, D.; Teitell, M.A.; Timp, W.; Wanagat, J. Nanopore sequencing identifies a higher frequency and expanded spectrum of mitochondrial DNA deletion mutations in human aging. Aging Cell 2023, 22, e13842. [Google Scholar] [CrossRef] [PubMed]
- Lu, A.; Tseng, C.; Guo, P.; Gao, Z.; Whitney, K.E.; Kolonin, M.G.; Huard, J. The role of the aging microenvironment on the fate of PDGFRβ lineage cells in skeletal muscle repair. Stem Cell Res. Ther. 2022, 13, 405. [Google Scholar] [CrossRef] [PubMed]
- Perez, K.; Ciotlos, S.; McGirr, J.; Limbad, C.; Doi, R.; Nederveen, J.P.; Nilsson, M.I.; Winer, D.A.; Evans, W.; Tarnopolsky, M.; et al. Single nuclei profiling identifies cell specific markers of skeletal muscle aging, frailty, and senescence. Aging 2022, 14, 9393–9422. [Google Scholar] [CrossRef] [PubMed]
- Kanazawa, Y.; Miyachi, R.; Higuchi, T.; Sato, H. Effects of Aging on Collagen in the Skeletal Muscle of Mice. Int. J. Mol. Sci. 2023, 24, 13121. [Google Scholar] [CrossRef] [PubMed]
- Penniman, C.M.; Bhardwaj, G.; Nowers, C.J.; Brown, C.U.; Junck, T.L.; Boyer, C.K.; Jena, J.; Fuqua, J.D.; Lira, V.A.; O’Neill, B.T. Loss of FoxOs in muscle increases strength and mitochondrial function during aging. J. Cachexia Sarcopenia Muscle 2023, 14, 243–259. [Google Scholar] [CrossRef]
- Neves, R.V.P.; Rosa, T.D.S.; Corrêa, H.L.; da Silva Aires, K.M.; Deus, L.A.; Sousa, M.K.; Stone, W.J.; Aguiar, L.R.; Prestes, J.; Simões, H.G.; et al. Biomarkers and Redox Balance in Aging Rats after Dynamic and Isometric Resistance Training. Int. J. Sports Med. 2021, 42, 283–290. [Google Scholar] [CrossRef]
- González-Blanco, L.; Bermúdez, M.; Bermejo-Millo, J.C.; Gutiérrez-Rodríguez, J.; Solano, J.J.; Antuña, E.; Menéndez-Valle, I.; Caballero, B.; Vega-Naredo, I.; Potes, Y.; et al. Cell interactome in sarcopenia during aging. J. Cachexia Sarcopenia Muscle 2022, 13, 919–931. [Google Scholar] [CrossRef]
- Mendelsohn, A.R.; Larrick, J.W. Partial reversal of skeletal muscle aging by restoration of normal NAD⁺ levels. Rejuvenation Res. 2014, 17, 62–69. [Google Scholar] [CrossRef]
- Kajstura, J.; Rota, M.; Urbanek, K.; Hosoda, T.; Bearzi, C.; Anversa, P.; Bolli, R.; Leri, A. The telomere-telomerase axis and the heart. Antioxid. Redox Signal 2006, 8, 2125–2141. [Google Scholar] [CrossRef]
- Baek, J.H.; Son, H.; Jeong, Y.H.; Park, S.W.; Kim, H.J. Chronological Aging Standard Curves of Telomere Length and Mitochondrial DNA Copy Number in Twelve Tissues of C57BL/6 Male Mouse. Cells 2019, 8, 247. [Google Scholar] [CrossRef]
- Zhu, J.; Wang, Z.; Lv, C.; Li, M.; Wang, K.; Chen, Z. Advanced Glycation End Products and Health: A Systematic Review. Ann. Biomed. Eng. 2024, in press. [Google Scholar] [CrossRef] [PubMed]
- Lee, B.Y.; Han, J.A.; Im, J.S.; Morrone, A.; Johung, K.; Goodwin, E.C.; Kleijer, W.J.; DiMaio, D.; Hwang, E.S. Senescence-associated beta-galactosidase is lysosomal beta-galactosidase. Aging Cell 2006, 5, 187–195. [Google Scholar] [CrossRef]
- Lozano-Torres, B.; Blandez, J.F.; Sancenón, F.; Martínez-Máñez, R. Chromo-fluorogenic probes for β-galactosidase detection. Anal. Bioanal. Chem. 2021, 413, 2361–2388. [Google Scholar] [CrossRef] [PubMed]
- Fontana, G.A.; Gahlon, H.L. Mechanisms of replication and repair in mitochondrial DNA deletion formation. Nucleic Acids Res. 2020, 48, 11244–11258. [Google Scholar] [CrossRef] [PubMed]
- Abe, K.; Ikeda, M.; Ide, T.; Tadokoro, T.; Miyamoto, H.D.; Furusawa, S.; Tsutsui, Y.; Miyake, R.; Ishimaru, K.; Watanabe, M.; et al. Doxorubicin causes ferroptosis and cardiotoxicity by intercalating into mitochondrial DNA and disrupting Alas1-dependent heme synthesis. Sci. Signal 2022, 15, eabn8017. [Google Scholar] [CrossRef]
- Sun, T.; Zhang, L.; Feng, J.; Bao, L.; Wang, J.; Song, Z.; Mao, Z.; Li, J.; Hu, Z. Characterization of cellular senescence in doxorubicin-induced aging mice. Exp. Gerontol. 2022, 163, 111800. [Google Scholar] [CrossRef] [PubMed]
- Pérez-Amado, C.J.; Bazan-Cordoba, A.; Hidalgo-Miranda, A.; Jiménez-Morales, S. Mitochondrial Heteroplasmy Shifting as a Potential Biomarker of Cancer Progression. Int. J. Mol. Sci. 2021, 22, 7369. [Google Scholar] [CrossRef] [PubMed]
- Nissanka, N.; Moraes, C.T. Mitochondrial DNA heteroplasmy in disease and targeted nuclease-based therapeutic approaches. EMBO Rep. 2020, 21, e49612. [Google Scholar] [CrossRef]
- Stefano, G.B.; Kream, R.M. Aging Reversal and Healthy Longevity is in Reach: Dependence on Mitochondrial DNA Heteroplasmy as a Key Molecular Target. Med. Sci. Monit. 2017, 23, 2732–2735. [Google Scholar] [CrossRef]
- Du, Z.D.; He, L.; Tu, C.; Guo, X.A.; Yu, S.; Liu, K.; Gong, S. Mitochondrial DNA 3,860-bp Deletion Increases with Aging in the Auditory Nervous System of C57BL/6J Mice. ORL J. Otorhinolaryngol. Relat. Spec. 2019, 81, 92–100. [Google Scholar] [CrossRef]
- Herbst, A.; Lee, C.C.; Vandiver, A.R.; Aiken, J.M.; McKenzie, D.; Hoang, A.; Allison, D.; Liu, N.; Wanagat, J. Mitochondrial DNA deletion mutations increase exponentially with age in human skeletal muscle. Aging Clin. Exp. Res. 2021, 33, 1811–1820. [Google Scholar] [CrossRef] [PubMed]
- Xu, Y.; Shen, J.; Ran, Z. Emerging views of mitophagy in immunity and autoimmune diseases. Autophagy 2020, 16, 3–17. [Google Scholar] [CrossRef]
- Amador-Martínez, I.; Aparicio-Trejo, O.E.; Bernabe-Yepes, B.; Aranda-Rivera, A.K.; Cruz-Gregorio, A.; Sánchez-Lozada, L.G.; Pedraza-Chaverri, J.; Tapia, E. Mitochondrial Impairment: A Link for Inflammatory Responses Activation in the Cardiorenal Syndrome Type 4. Int. J. Mol. Sci. 2023, 24, 15875. [Google Scholar] [CrossRef] [PubMed]
- Enzan, N.; Matsushima, S.; Ikeda, S.; Okabe, K.; Ishikita, A.; Yamamoto, T.; Sada, M.; Miyake, R.; Tsutsui, Y.; Nishimura, R.; et al. ZBP1 Protects Against mtDNA-Induced Myocardial Inflammation in Failing Hearts. Circ. Res. 2023, 132, 1110–1126. [Google Scholar] [CrossRef] [PubMed]
- Liu, Y.; Zhang, B.; Duan, R.; Liu, Y. Mitochondrial DNA Leakage and cGas/STING Pathway in Microglia: Crosstalk between Neuroinflammation and Neurodegeneration. Neuroscience 2024, 548, 1–8. [Google Scholar] [CrossRef]
- Yu, D.; Ji, Y.; Zhang, J.; Huang, X. TNFRSF6 induces mitochondrial dysfunction and microglia activation in the in vivo and in vitro models of sepsis-associated encephalopathy. Cell Mol. Biol. 2024, 70, 102–109. [Google Scholar] [PubMed]
- Yang, K.; Yan, Y.; Yu, A.; Zhang, R.; Zhang, Y.; Qiu, Z.; Li, Z.; Zhang, Q.; Wu, S.; Li, F. Mitophagy in neurodegenerative disease pathogenesis. Neural Regen. Res. 2024, 19, 998–1005. [Google Scholar] [CrossRef] [PubMed]
- Kadochi, Y.; Mori, S.; Fujiwara-Tani, R.; Luo, Y.; Nishiguchi, Y.; Kishi, S.; Fujii, K.; Ohmori, H.; Kuniyasu, H. Remodeling of energy metabolism by a ketone body and medium-chain fatty acid suppressed the proliferation of CT26 mouse colon cancer cells. Oncol. Lett. 2017, 14, 673–680. [Google Scholar] [CrossRef]
- Nukaga, S.; Mori, T.; Miyagawa, Y.; Fujiwara-Tani, R.; Sasaki, T.; Fujii, K.; Mori, S.; Goto, K.; Kishi, S.; Nakashima, C.; et al. Combined administration of lauric acid and glucose improved cancer-derived cardiac atrophy in a mouse cachexia model. Cancer Sci. 2020, 111, 4605–4615. [Google Scholar] [CrossRef]
- Kuniyasu, H.; Oue, N.; Wakikawa, A.; Shigeishi, H.; Matsutani, N.; Kuraoka, K.; Ito, R.; Yokozaki, H.; Yasui, W. Expression of receptors for advanced glycation end-products (RAGE) is closely associated with the invasive and metastatic activity of gastric cancer. J. Pathol. 2002, 196, 163–170. [Google Scholar] [CrossRef]


| 4 Weeks | 55 Weeks | 110 Weeks | p | |
|---|---|---|---|---|
| MDA (μg/g) | 10.3 ± 0.08 | 12.2 ± 0.3 | 14.9 ± 0.3 | <0.0001 |
| 4HNE (ng/g) | 55 ± 0.4 | 64 ± 0.7 | 74 ± 1.9 | <0.0001 |
| AGE (ng/g) | 101 ± 1.1 | 108.3 ± 2.1 | 113.0 ± 3.1 | <0.0001 |
| HMGB1 (μg/g) | 5.2 ± 0.8 | 7.2 ± 0.8 | 13.0 ± 1.2 | <0.0001 |
| COL (μg/g) | 26 ± 0.3 | 28 ± 0.4 | 30 ± 0.6 | <0.0001 |
| TV (%) | 100.0 ± 0.7 | 95.0 ± 1.2 | 88.2 ± 1.3 | <0.0001 |
| βGAL (ng/g) | 7.6 ± 0.08 | 7.8 ± 0.06 | 8.6 ± 0.14 | <0.0001 |
| SDS-MYL1 (pg/g) | 108 ± 0.8 | 105 ± 0.7 | 92 ± 0.9 | <0.0001 |
| Ki67 (pg/g) | 11 ± 0.1 | 10 ± 0.1 | 9.3 ± 0.1 | <0.0001 |
| Parameter | 0 | 1 d | 6 d | |||
|---|---|---|---|---|---|---|
| C | CX | C | CX | C | CX | |
| MDA (μg/g) | 8.1 ± 0.04 | 8.1 ± 0.1 | 8.2 ± 0.1 | 9.5 ± 0.4 * | 8.2 ± 0.4 | 13.2 ± 0.5 * |
| 4HNE (ng/g) | 45 ± 0.03 | 46 ± 0.04 | 46 ± 0.6 | 52 ± 1.1 * | 47 ± 1.2 | 64 ± 1.6 * |
| AGE (ng/g) | 82 ± 0.8 | 81 ± 0.5 | 83 ± 1.2 | 87 ± 1.3 * | 89 ± 0.9 | 101 ± 2.0 * |
| HMGB1 (μg/g) | 5.7 ± 0.6 | 6.0 ± 1.0 | 7.3 ± 0.6 | 7.7 ± 0.6 | 5.7 ± 0.6 | 15.3 ± 1.5 * |
| COL (μg/g) | 12.5 ± 0.08 | 12.5 ± 0.08 | 12.8 ± 0.13 | 13.2 ± 0.2 * | 12.6 ± 0.13 | 14.6 ± 0.36 * |
| TV (%) | 99.7 ± 0.6 | 100.0 ± 1.0 | 98.0 ± 1.0 | 95.3 ± 1.2 * | 97.0 ± 1.0 | 89.7 ± 0.6 * |
| βGAL (ng/g) | 8.2 ± 0.08 | 8.1 ± 0.05 | 8.1 ± 0.05 | 8.3 ± 0.12 * | 8.2 ± 0.08 | 8.7 ± 0.13 * |
| SDS-MYL1 (pg/g) | 91 ± 0.5 | 91 ± 00.9 | 91 ± 0.9 | 87 ± 1.0 * | 92 ± 0.5 | 78 ± 1.2 * |
| C | NT | CX | p | |
|---|---|---|---|---|
| BW (g) | 22.5 ± 0.5 | 25.3 ± 0.7 | 18.0 ± 0.5 | <0.0001 |
| QCM weight (g) | 0.16 ± 0.2 | 0.17 ± 0.2 | 0.11 ± 0.1 | <0.0001 |
| Tumor weight (g) | − | − | 1.4 ± 0.2 | − |
| Ascites (mL) | − | − | 4.3 ± 0.5 | − |
| MDA (μg/g) | 10.6 ± 0.3 | 11.1 ± 0.3 | 23.0 ± 0.8 | <0.0001 |
| 4HNE (ng/g) | 57 ± 0.3 | 60 ± 2.1 | 106 ± 4.0 | <0.0001 |
| AGE (ng/g) | 110 ± 0.6 | 102.7 ± 3.5 | 145.3 ± 2.5 | <0.0001 |
| HMGB1 (μg/g) | 7.0 ± 1.0 | 7.6 ± 0.6 | 32.3 ± 2.5 | <0.0001 |
| COL (μg/g) | 28 ± 0.2 | 28 ± 0.5 | 31 ± 0.8 | <0.0001 |
| TV (%) | 100.0 ± 0.7 | 99.1 ± 1.5 | 85.4 ± 2.1 | <0.0001 |
| βGAL (ng/g) | 7.3 ± 0.08 | 7.5 ± 0.09 | 8.9 ± 0.2 | <0.0001 |
| SDS-MYL1 (pg/g) | 105 ± 0.9 | 106 ± 1.2 | 79 ± 1.7 | <0.0001 |
| C | NT | CX | p | |
|---|---|---|---|---|
| Ki67 (pg/g) | 10 ± 0.07 | 10 ± 0.2 | 8.3 ± 0.3 | <0.0001 |
| Apoptosis (per 200 cells) | 12.1 ± 1.2 | 13.4 ± 2.6 | 32.7 ± 4.3 | <0.0001 |
| MYH8 (pg/g) | 27 ± 0.2 | 27 ± 0.3 | 21 ± 0.5 | <0.0001 |
| PAX7 (pg/g) | 11 ± 0.07 | 11 ± 0.2 | 9 ± 0.2 | <0.0001 |
| C | NT | CX | p | |
|---|---|---|---|---|
| LetM1 (pg/g) | 28 ± 0.2 | 28 ± 0.5 | 21 ± 0.4 | <0.0001 |
| PINK1 (pg/g) | 6 ± 0.4 | 47 ± 0.7 | 39 ± 0.9 | <0.0001 |
| Parkin (pg/g) | 8 ± 0.9 | 99 ± 1.5 | 76 ± 2.0 | <0.0001 |
| pCr (pg/g) | 31 ± 0.2 | 31 ± 0.4 | 20 ± 0.6 | <0.0001 |
| C-I (pg/g) | 9 ± 0.03 | 9 ± 0.06 | 5.8 ± 0.2 | <0.0001 |
| Target | GenBank | Sequence | |
|---|---|---|---|
| Mouse | NC_005089.1 | L | CTTCAATCTACTTCTACCGCCGA (5150–5172) |
| mitochondria | R | AGAGTTTTGGTTCACGGAACA (16245–16265) | |
| Antibody | Clone or Cat# | Company | |
| Mouse C-I | 18G12BC2 | Abcam, Waltham, MA, USA | |
| Mouse C-III | 1F11C4 | Proteintech, Rosemont, IL, USA | |
| Mouse C-IV | 55082-1-AP | Proteintech, Rosemont, IL, USA | |
| Mouse C-V | A305-417A | Fortis Life Sciences, Waltham, MA, USA | |
| β-actin | ab8227 | Abcam, Waltham, MA, USA | |
| Target | Cat# | Company | |
| MDA | ab238537 | Abcam, Waltham, MA, USA | |
| 4HNE | ab238538 | Abcam, Waltham, MA, USA | |
| AGE | LS-F14150 | LS Bio, Shirley, MA, USA | |
| HMGB1 | LS-F4039 | Shino-Test, Sagamihara, Japan | |
| TNFα | #88-7324-88 | Thermo Fisher Scientific, Tokyo, Japan | |
| COLIII | abx258006 | Abbexa, Cambridge, UK | |
| βGAL | ab119595 | Abcam, Waltham, MA, USA | |
| MYL1 | orb1211541 | Biorbyt, Cambridge, UK | |
| Ki67 | EK15089 | Signalway Antibody, Greenbelt, MD | |
| MYH8 | abx534171 | Abbexa, Cambridge, UK | |
| PAX7 | MBS2602714 | MyBioSource, San Diego, CA, USA | |
| LetM1 | abx530900 | Abbexa, Cambridge, UK | |
| PINK1 | MBS9337825 | MyBioSource, San Diego, CA, USA | |
| Parkin | MBS723678 | MyBioSource, San Diego, CA, USA | |
| pCr | CB65529263 | Chemical Book, Albany. NY, USA | |
| C-I | CSB-EQ027280MO | Cusabio, Houston, TX, USA |
Disclaimer/Publisher’s Note: The statements, opinions and data contained in all publications are solely those of the individual author(s) and contributor(s) and not of MDPI and/or the editor(s). MDPI and/or the editor(s) disclaim responsibility for any injury to people or property resulting from any ideas, methods, instructions or products referred to in the content. |
© 2024 by the authors. Licensee MDPI, Basel, Switzerland. This article is an open access article distributed under the terms and conditions of the Creative Commons Attribution (CC BY) license (https://creativecommons.org/licenses/by/4.0/).
Share and Cite
Luo, Y.; Fujiwara-Tani, R.; Kawahara, I.; Goto, K.; Nukaga, S.; Nishida, R.; Nakashima, C.; Sasaki, T.; Miyagawa, Y.; Ogata, R.; et al. Cancerous Conditions Accelerate the Aging of Skeletal Muscle via Mitochondrial DNA Damage. Int. J. Mol. Sci. 2024, 25, 7060. https://doi.org/10.3390/ijms25137060
Luo Y, Fujiwara-Tani R, Kawahara I, Goto K, Nukaga S, Nishida R, Nakashima C, Sasaki T, Miyagawa Y, Ogata R, et al. Cancerous Conditions Accelerate the Aging of Skeletal Muscle via Mitochondrial DNA Damage. International Journal of Molecular Sciences. 2024; 25(13):7060. https://doi.org/10.3390/ijms25137060
Chicago/Turabian StyleLuo, Yi, Rina Fujiwara-Tani, Isao Kawahara, Kei Goto, Shota Nukaga, Ryoichi Nishida, Chie Nakashima, Takamitsu Sasaki, Yoshihiro Miyagawa, Ruiko Ogata, and et al. 2024. "Cancerous Conditions Accelerate the Aging of Skeletal Muscle via Mitochondrial DNA Damage" International Journal of Molecular Sciences 25, no. 13: 7060. https://doi.org/10.3390/ijms25137060
APA StyleLuo, Y., Fujiwara-Tani, R., Kawahara, I., Goto, K., Nukaga, S., Nishida, R., Nakashima, C., Sasaki, T., Miyagawa, Y., Ogata, R., Fujii, K., Ohmori, H., & Kuniyasu, H. (2024). Cancerous Conditions Accelerate the Aging of Skeletal Muscle via Mitochondrial DNA Damage. International Journal of Molecular Sciences, 25(13), 7060. https://doi.org/10.3390/ijms25137060