Communication

Detection and Characterization of Methylated Circulating Tumor DNA in Gastric Cancer

1
Department of Internal Medicine, Jeonbuk National University Medical School, Jeonju-si 54907, Republic of Korea
2
Research Institute of Clinical Medicine of Jeonbuk National University-Biomedical Research Institute, Jeonbuk National University Hospital, 634-18 Keuman-dong, Dukjin-gu, Jeonju-si 54907, Republic of Korea
3
Department of Radiation Oncology, Jeonbuk National University Medical School, Jeonju-si 54907, Republic of Korea
4
Research Center, Cancer Breaker, Yongin-si 16942, Republic of Korea
5
Cancer Genomic Research Institute, Clinomics, Chungju-si 28161, Republic of Korea
*
Authors to whom correspondence should be addressed.
These authors contributed equally to this work.
Int. J. Mol. Sci. 2024, 25(13), 7377; https://doi.org/10.3390/ijms25137377
Submission received: 25 April 2024 / Revised: 17 June 2024 / Accepted: 18 June 2024 / Published: 5 July 2024
(This article belongs to the Section Molecular Genetics and Genomics)

Abstract

:
Gastric cancer is the fifth most common disease in the world and the fourth most common cause of death. It is diagnosed through esophagogastroduodenoscopy with biopsy; however, there are limitations in finding lesions in the early stages. Recently, research has been actively conducted to use liquid biopsy to diagnose various cancers, including gastric cancer. Various substances derived from cancer are reflected in the blood. By analyzing these substances, it was expected that not only the presence or absence of cancer but also the type of cancer can be diagnosed. However, the amount of these substances is extremely small, and even these have various variables depending on the characteristics of the individual or the characteristics of the cancer. To overcome these, we collected methylated DNA fragments using MeDIP and compared them with normal plasma to characterize gastric cancer tissue or patients’ plasma. We attempted to diagnose gastric cancer using the characteristics of cancer reflected in the blood through the cancer tissue and patients’ plasma. As a result, we confirmed that the consistency of common methylated fragments between tissue and plasma was approximately 41.2% and we found the possibility of diagnosing and characterizing cancer using the characteristics of the fragments through SFR and 5′end-motif analysis.

1. Introduction

1.1. Gastric Cancer and Liquid Biopsy

Despite advances in diagnosis and treatment, cancer is the second leading cause of death worldwide [1]. In particular, gastric cancer is the fifth most common disease and fourth most cause of death, causing 1.1 million new cases and 7.6 hundred thousand deaths each year worldwide [2,3]. Recently, the incidence of gastric cancer has been increasing in Korea due to changes in eating habits and various environments [4,5]. The gold standard of diagnosis for gastric cancer is esophagogastroduodenoscopy with biopsy. However, the diagnosis can often be delayed in early-stage cancer. In particular, liquid biopsy research using blood has been conducted recently for early diagnosis of various diseases, including cancer [6,7]. In various diseases, including cancer, various characteristics derived from the lesion are reflected in the blood. Direct indicators include exosomes, metabolic materials, cfDNAs, and CTCs. Although it exists in extremely small quantities, analyzing its characteristics has made it possible to diagnose the disease with minimally invasive methods [8,9,10]. Therefore, for a more accurate diagnosis, the unique characteristics of each cancer type must be identified. Representative successful cases include EGFR, KRAS, and BRAF mutations in lung cancer [11,12,13,14]. Recently, omics research on various characteristics has reached a level where it is possible to diagnose not only cancer but also types of cancer [15,16,17]. However, the uniqueness of many types of cancer is still unclear.

1.2. Methylation

Changes in the gene sequence cause functional changes and, in fact, many diseases, including cancer, are caused by small changes in genes [18]. It is known that cancer is sometimes caused by abnormal changes in expression levels rather than functional changes in genes. These epigenetic studies are widely applied in the diagnosis and prediction of cancer. Human cancer is closely associated with changes in methylation [19]. In particular, tissues sometimes have specific methylation profiles [20,21]. Based on these characteristics, it is possible to diagnose cancer and its type using the methylation pattern of cancer-derived substances present in the blood.

1.3. Fragmentomics (Size and 5′End-Motif)

cfDNA in the blood comes from various tissues and cells [22,23]. Recently, it has been revealed that fragments derived from various cancers are shorter than those derived from normal cells due to different biological mechanisms, and the possibility of diagnosis using this is being discussed [24,25,26,27].
All living organisms contain nucleases that can interact with nucleic acids and hydrolyze phosphodiester bonds. Nucleases may also exhibit a cleavage preference for single- or double-stranded nucleic acids. Some nucleases are structure- or sequence-specific. In particular, there are nucleases that are predominant and specific to the cancer type or tissue [28,29,30,31]. In gastric cancer, FEN1, APE1, XPF/XPG, MRN complex, and DNase1 are typically found [30].
Many liquid biopsy studies are focused on diagnosing cancer by analyzing the characteristics of cancer-derived cell-free nucleic acids in the blood. However, it is still true that in the early stages of cancer, the amount present is very small, and a lot of effort and time are required for accurate analysis. In this study, in order to clarify the characteristics of cancer-derived fragments, hypermethylated fragments were collected and their length and 5′end-motif sequences were analyzed. We also confirmed whether this approach was consistent with results from tissue.

2. Results

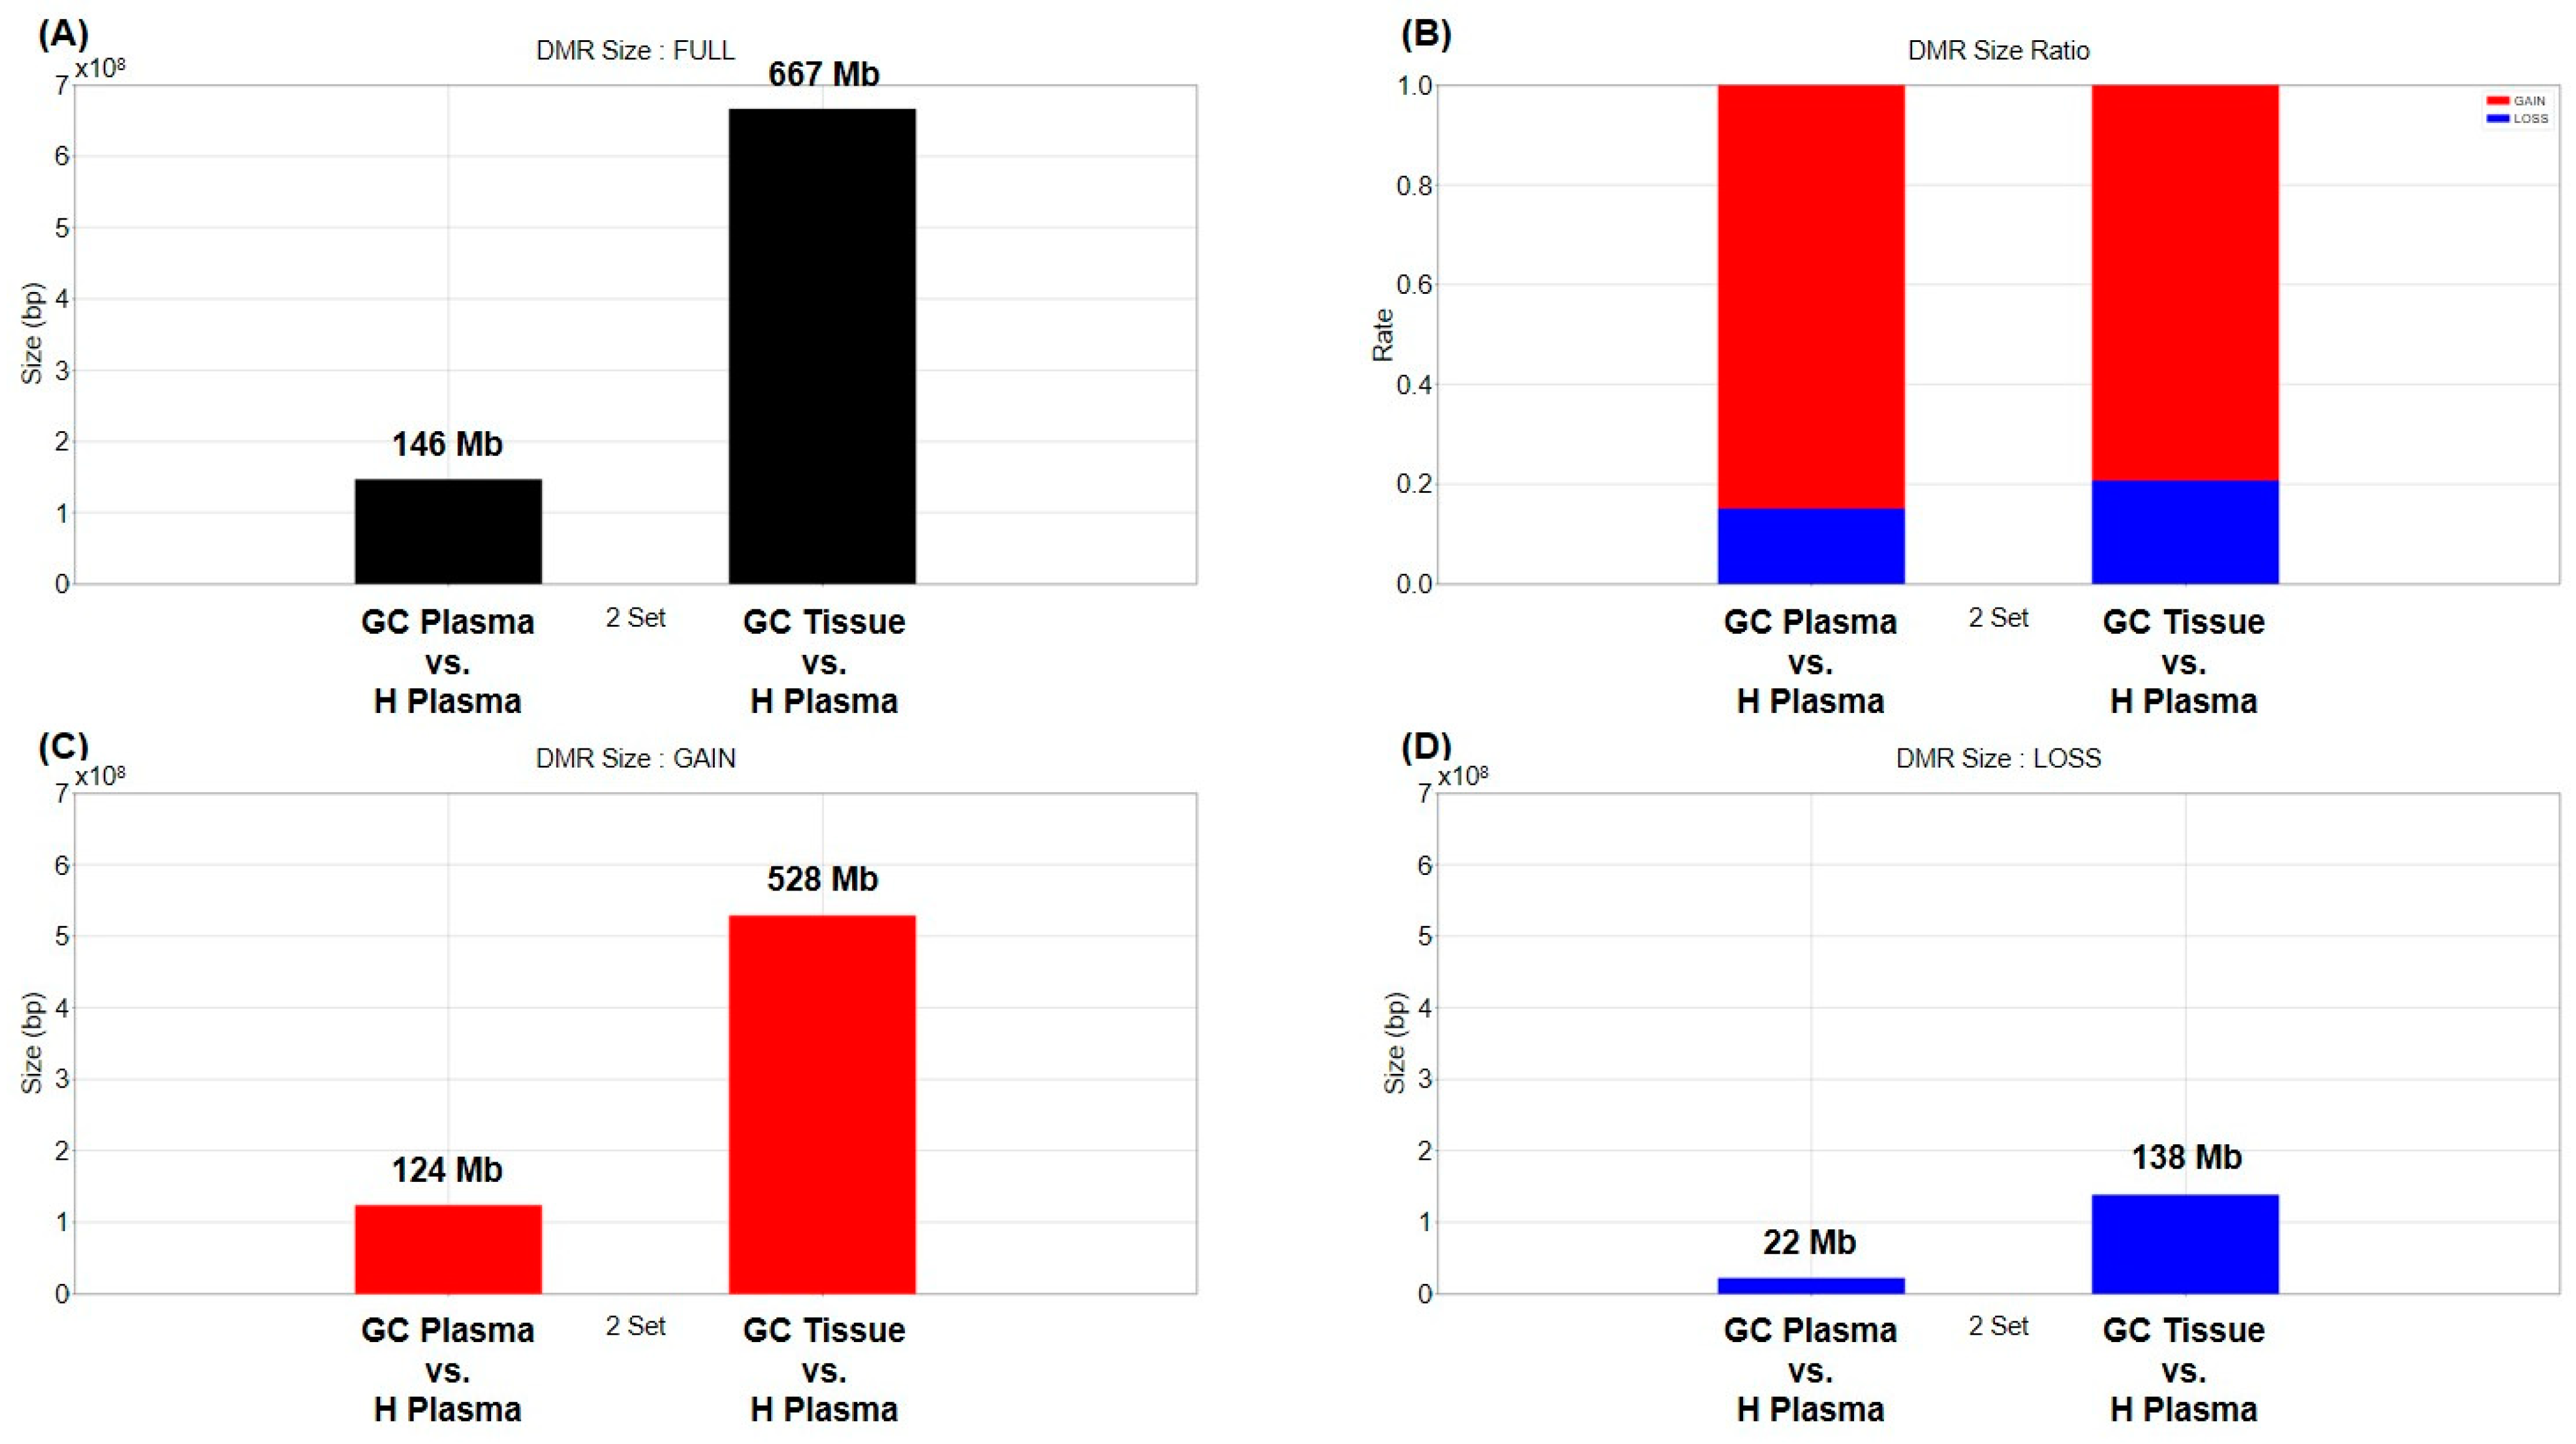
2.1. Differentially Methylated Region (DMR)

First, changes in cfDNA methylation in the plasma of cancer patients were compared with the healthy human plasma. Paired blood and tissue from 22 stomach cancer patients and 40 plasma samples from healthy people were used (Table 1). The MEDIPS library was used to determine differentially methylated regions (DMR) [32]. The BH (Benjamini–Hochberg) method was set to be used for p-value adjustment, and areas with a value of 0.01 or less based on the adjusted p-value were selected as DMR. The methylation marker information for each cancer type was used as published in Vrba’s paper [33], and the methylation marker information for each tissue was used as published in Moss’ paper [34]. A total of 1,541,364 DMRs were obtained by comparing tissue and plasma of cancer patients with healthy human plasma, and the total length was approximately 813 Mb (Figure 1A and Supplementary Table S1). About 146 Mb DMRs were identified between plasma from cancer patients and healthy human plasma, with a ratio of 124 Mb gain (hypermethylation) to 22 Mb loss (hypomethylation) of approximately 6:1. Additionally, DMR coverage of 667 Mb was confirmed between cancer patients’ tissue and healthy human plasma, and hypermethylation and hypomethylation of 528 Mb and 138 Mb were found, respectively (Figure 1). Between cancer patient and healthy plasma samples, approximately 3% (9711/316,507) of DMRs were found in the promoter region. Between cancer tissue and healthy plasma samples, 2.6% (31,922/1,224,857) of DMRs were located in promoter regions (Supplementary Table S1 and Supplementary Figure S2).

2.2. Commonly Methylated Region (CMR)

Next, we analyzed how much methylated DNA there was in common between tissue and plasma from cancer patients. The MACS-2.2.6 program was used to discover methylation regions [35]. The discovered methylation region was then used to determine the common methylation region (CMR). Methylated regions were processed in 300 bp sections. If the methylated region discovered by the MACS program occupied more than 50% of the 300 bp region, the region was considered methylated. The region was determined by connecting adjacent windows (Supplementary Figure S3A). Overall, the average number of peaks was 439,109 and the average number of CMRs was 213,548, and most CMRs were not located in DMR (Supplementary Figure S3B,C). When comparing the tissue and plasma of cancer patients with that of healthy human plasma, the average size of the CMR between tissue and cfDNA was approximately 73 Mb (Figure 2). Interestingly, the average similarity was approximately 41.2% between tissue and cfDNA (Supplementary Figure S3D). This shows that cancer-tissue-based methylation changes were also reflected at high levels in ctDNA from the blood.

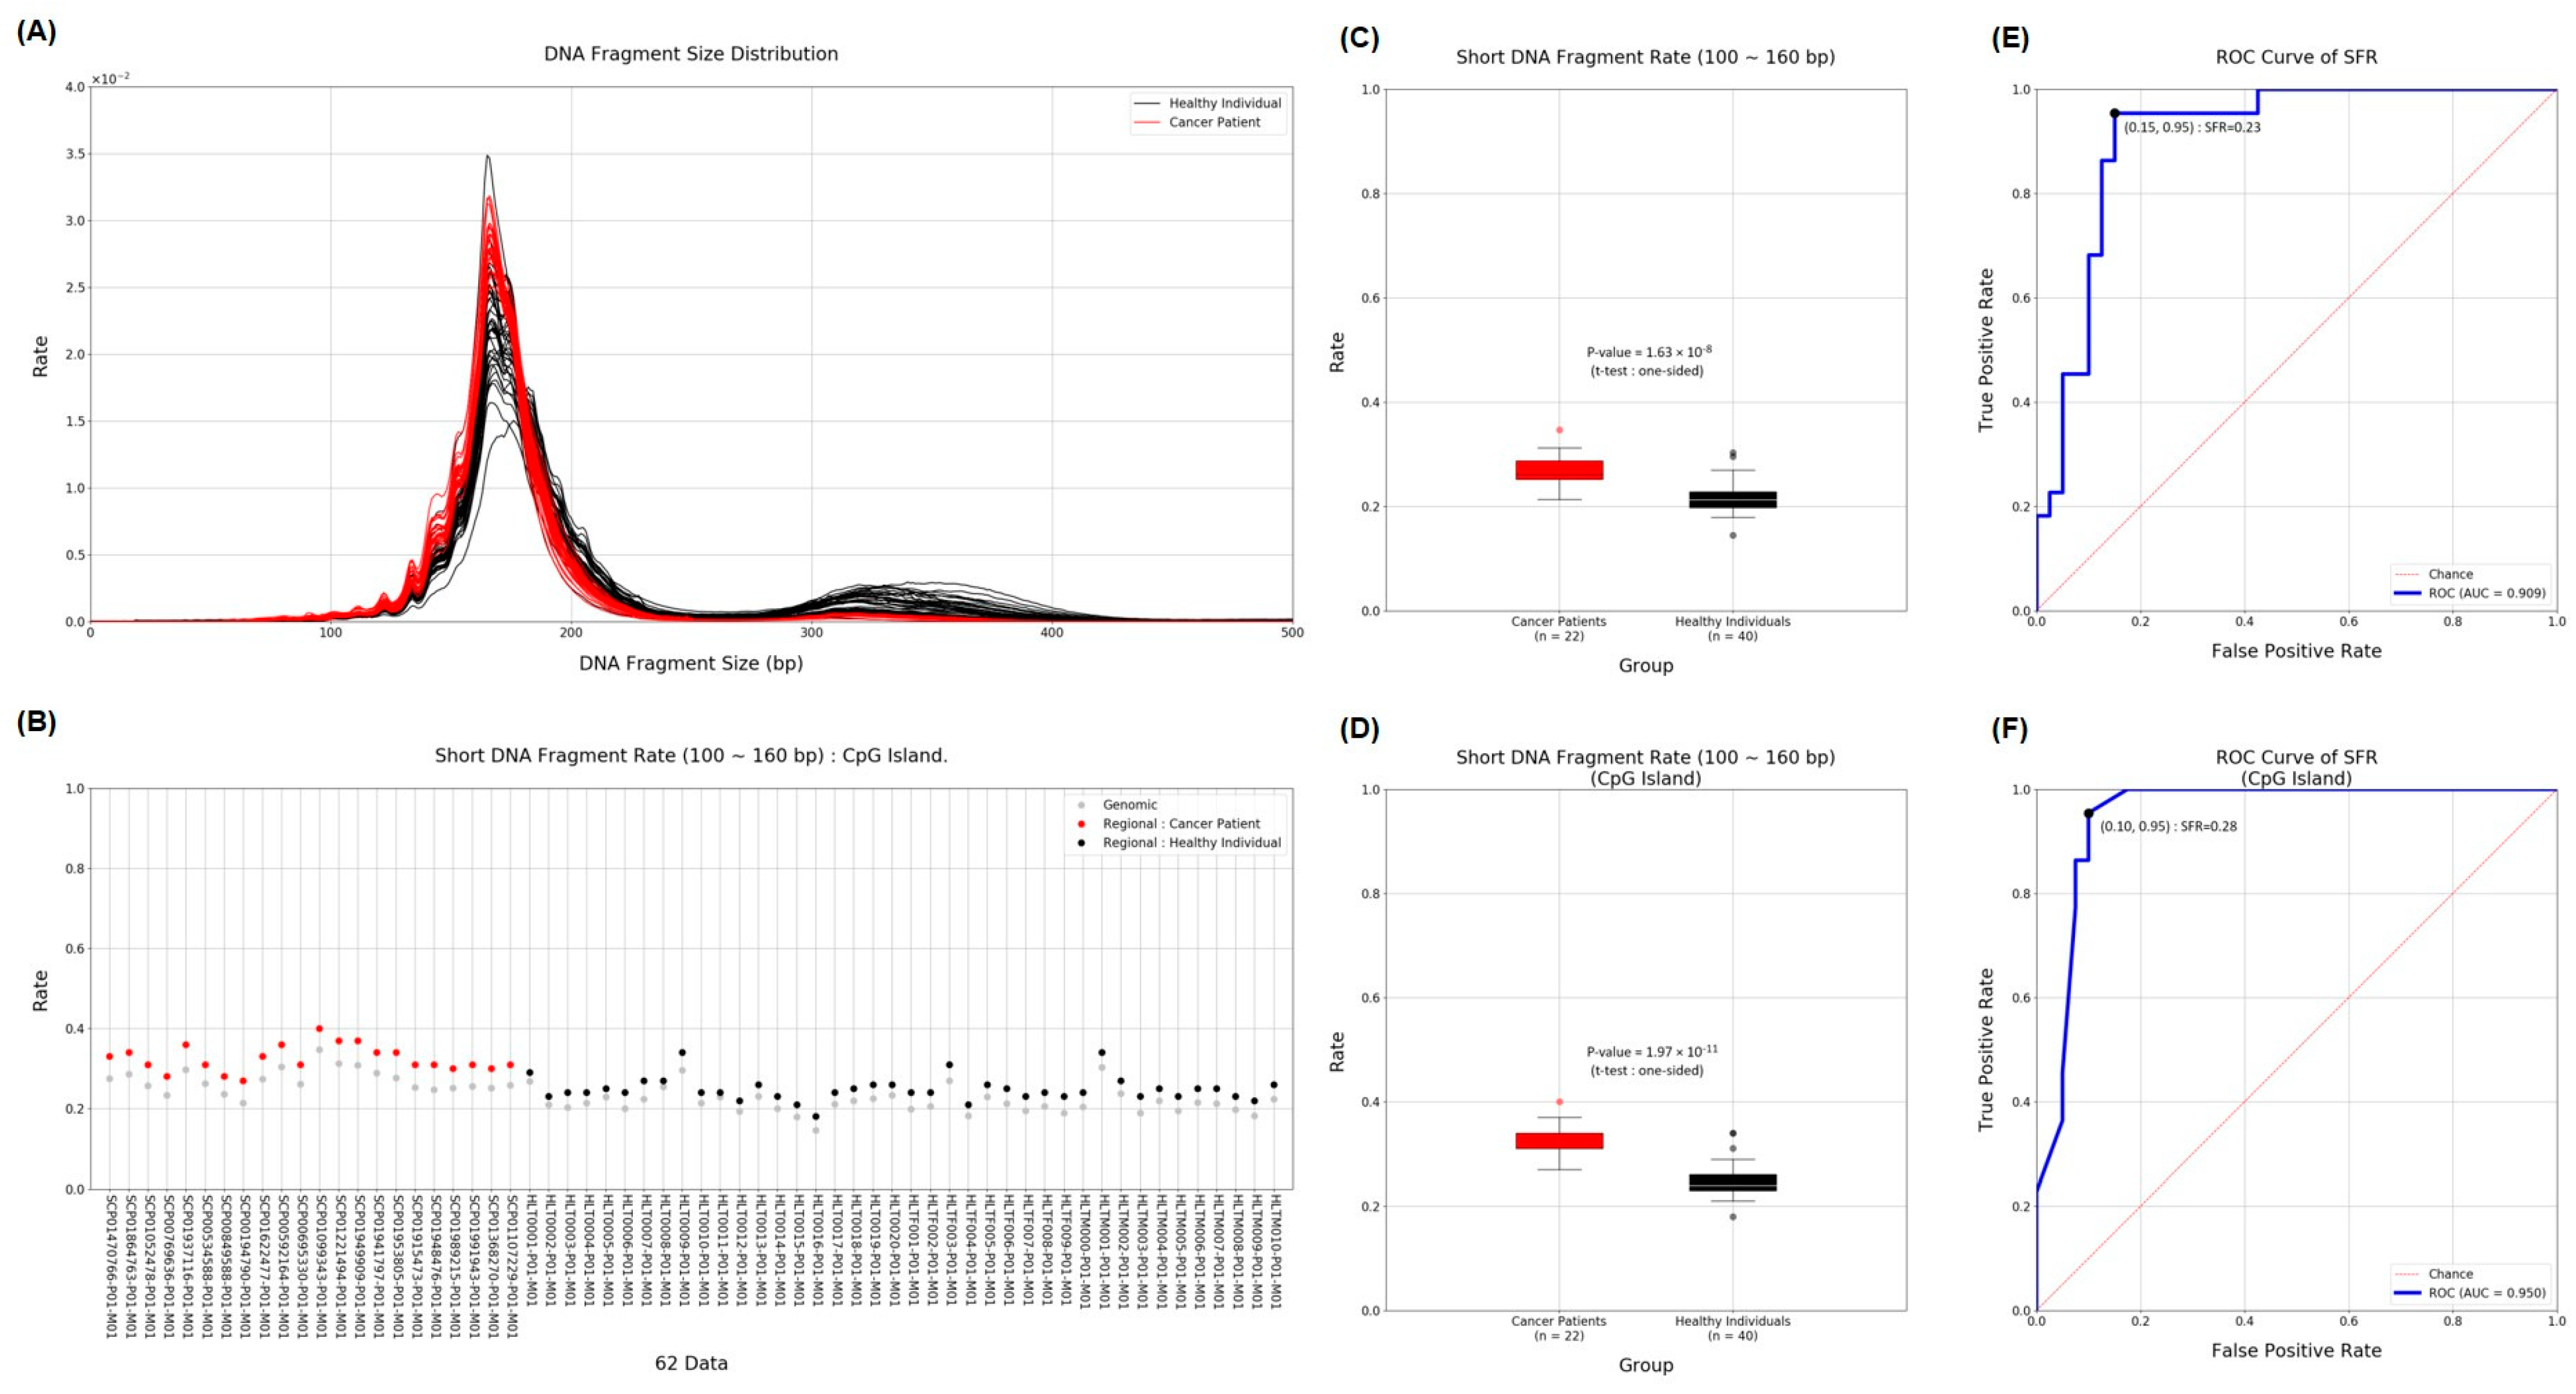
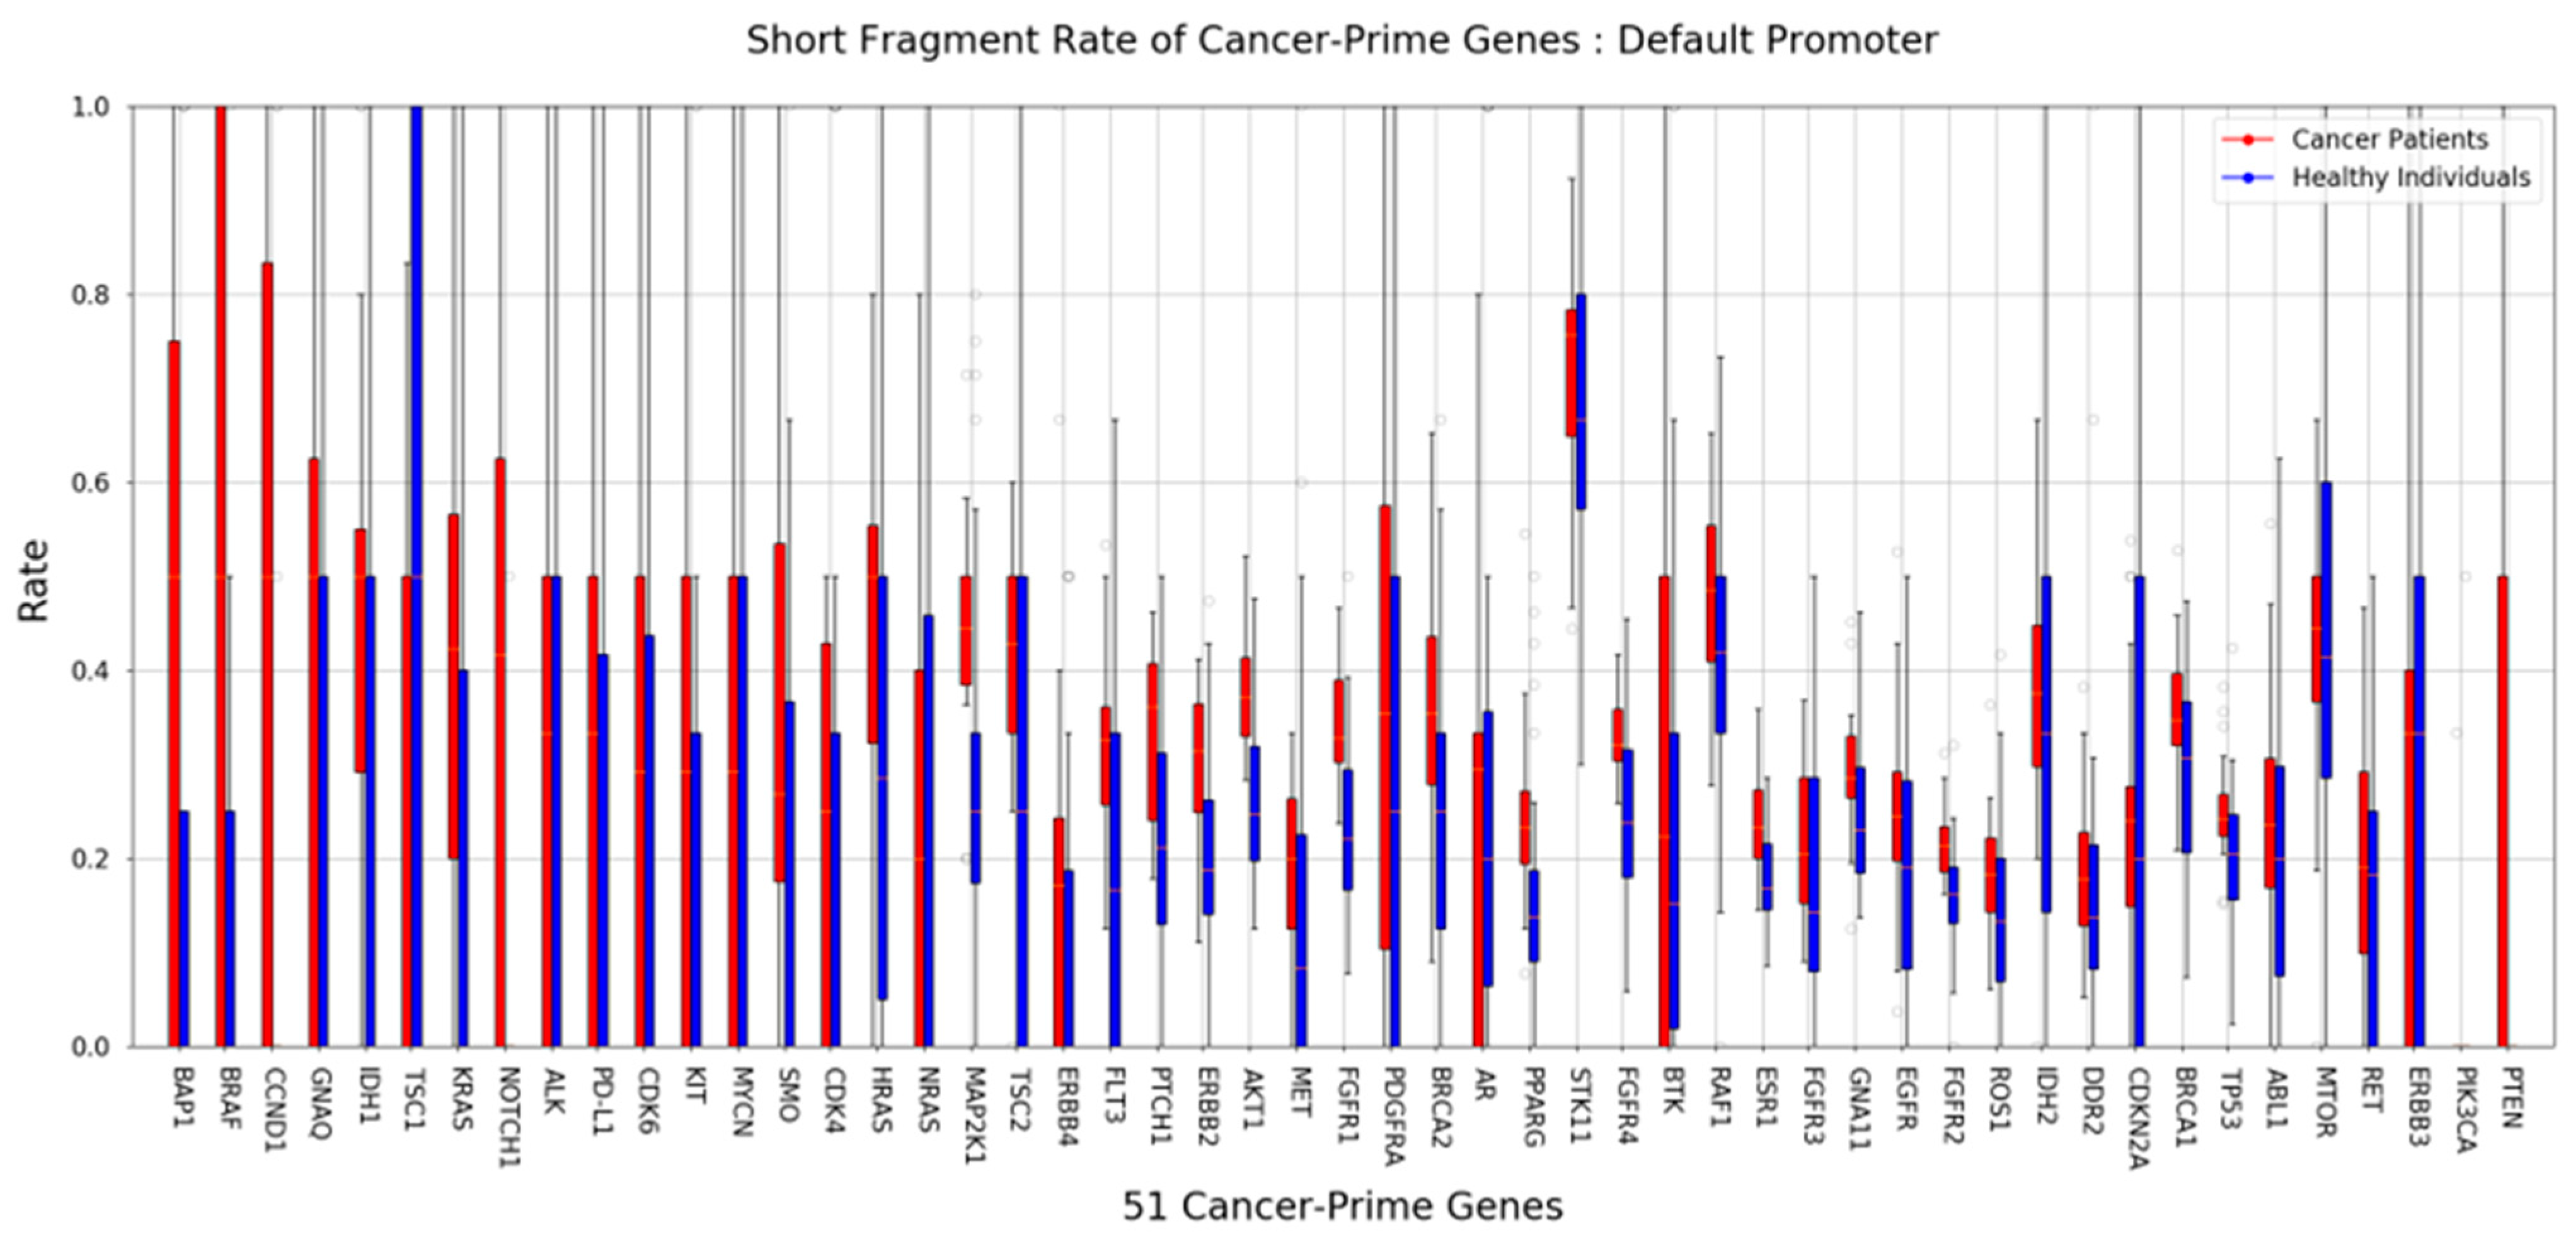
2.3. Short Fragment Ratio (SFR)

To detect cancer, we used cfDNA obtained from MeDIP to compare the length of cfDNA in the plasma of cancer patients and the plasma of healthy donors. Many previous studies have already shown that shorter-length cfDNA exists in patients with various diseases, including cancer. Although ctDNA derived from cancer is only a small portion of the total, we distinguished the difference more clearly by using the proportion of short cfDNA. The insert size estimated from the mapping information was used as the length of cfMeDNA (circulating free methylated DNA). The short fragment rate (SFR) was calculated as the proportion of short fragments among all fragments. cfMeDNAs with a length of 100 to 240 bp were set as full fragments, and those with a length of 100 to 160 bp were set as short fragments. To calculate the skewness of the cfMeDNA length distribution, 100 to 240 bp fragments were used. Simply looking at the trend, the proportion of short cfDNA in the patient’s plasma was high (Figure 3A,B). Next, for detailed quantification, we calculated the SFR by dividing healthy samples and cancer patients and compared the differences. In conclusion, a high level of significant SFR difference was observed in cancer patients (p value = 1.63 × 10⁻⁸; Figure 3C). Surprisingly, focusing on the CpG island resulted in a clearer distinction (p value = 1.97 × 10⁻¹¹; Figure 3D). To verify the ability to distinguish between normal and cancer samples using SFR, the ROC curve was calculated. At the whole genome level, the AUC was 0.909. Interestingly, applying this to the CpG island region raised the AUC to 0.950 (Figure 3E,F). We identified how SFRs differed in the promoter regions of 51 well-known cancer-related genes [36]. In particular, the SFR of the BAP1 gene promoter was statistically significantly higher in cancer patients (Figure 4).

2.4. 5′End-Motif

Short fragments occurred depending on the type of acting DNase. In particular, it is known to show characteristic differences when DNA is fragmented within cancer cells. We classified the collected short cfDNAs using the sequences of their 5′end-motifs. The length of the motif used in the 5′end-motif frequency analysis was 4 bp. There were 256 possible 4-mer motifs, among which 199 motifs showed significant differences between gastric cancer patients and healthy subjects. Here, 115 and 83 motifs were frequent and infrequent in gastric cancer patients and healthy people, respectively. In other previous studies, abnormal activation of DNase I was reported in gastric cancer [30]. As a result of the action of DNase I, a thiamine end-motif was generated, and in our results, T-end SFRs accounted for a statistically significantly high proportion in the top 10 rank (Table 2). Usually, when cfDNA is generate, the A-end sequences are generated by DFFB (DNA fragmentation factor B). Interestingly, in our significant list, T-end motifs were frequent in gastric cancer patients, and A-end motifs were frequent in healthy subjects. The Mann–Whitney U test was used as the statistical test for the frequency of differences between groups, and the list of significant motifs was calculated based on the p-values.

3. Discussion

We hypothesized that there would be a clearer difference between cancer and healthy samples if methylation changes were limited to cfDNA. In this study, hypermethylated cfDNA predominated in both cancer and healthy donor plasma due to MeDIP capture. Hypermethylation was more prevalent in cancer genomes. As our results showed, MeDIP had the effect of making these characteristics more evident. It is well known that many diseases, including cancer, are related to methylation change. Moreover, methylation change is related to age-, gender-, species-, and organ-specific factors [37]. However, to be free from these factors, individual cancer-derived substances were compared with a pool of 40 healthy donor plasma results.
Of course, comparing within the same type of specimen can yield more accurate results than comparing plasma and tissue. Nevertheless, there are many studies attempting to determine whether the characteristics of cancer tissue are reflected in blood for liquid biopsy. We obtained common DMRs between cancer tissue and plasma of cancer patients compared with plasma of healthy people. Although a more in-depth study of the obtained results was not conducted, we believe it will be good material for future research.
Because methylation differences were well reflected using MeDIP, we expected to discover CMRs within the DMRs. An extreme DMR was also set between cancer and normal plasma for dramatic results. Unfortunately, the CMR seems to have little to do with the DMR. This result is expected to have occurred because a very small amount of cfDNA, including ctDNA, was used as a control. Nonetheless, surprisingly, there was a match rate of about 40% between cancer tissue and cancer patient plasma. This was the result of the characteristics of cancer tissue being reflected in the blood. Sometimes, many tissues have tissue-specific mutations and methylation patterns depending on the type of cancer [38,39]. It is expected that the CMR may contain clues that can predict not only the presence or absence of cancer but also the type of cancer.
Short-fragment DNA provides useful clues for ctDNA classification using liquid biopsy. Especially in the early stages, ctDNA accounts for less than 1% of cfDNA [40,41]. Therefore, there are limitations in clearly distinguishing cancer from normal samples with only these small changes. We hypothesized that cfDNA derived from cancer could be more clearly identified through methylation capture. Surprisingly, when our method used SFR to distinguish cancer from normal samples, the AUC of the ROC was 0.909. Additionally, when limited to CpG islands, the AUC increased to 0.95. This showed that SFR can more clearly distinguish between cancer and normal conditions under certain conditions, such as methylation. We applied methylation capture and CpG island piecemeal, but we expect that better discrimination ability will be achieved in the future.
All living organisms have enzymes that break down nucleic acids, and DNases and RNases act differently depending on the type of tissue or disease. The action of these different DNases resulted in shorter lengths of cancer-derived cfDNA. In particular, all nucleic acids exposed due to apoptosis or necrosis were fragmented by various DNases and RNases, and some were exuded into the blood. Verification is necessary to clearly reveal the direct basis for the relationship between DNase and 5′end-motif in the results presented in our study. Nevertheless, our study showed that cancer diagnosis is possible by utilizing the characteristics of ctDNA in cfDNA. In particular, if the DNase action is more clearly identified for each cancer type, it is expected that cancer can be diagnosed using only the short sequence of the fragment (only 4 bp).
Although the genes we used in our analysis were limited to 51, these genes are already well-known cancer-related genes. Genes with high methylated-SFR in cancer patients, such as AKT1, BAP1, BRCA1/2, BRAF, CCND1, ERBB2, ESR1, FGFR1/2/4, FLT3, HRAS, IDH1, KRAS, MAP2K1, PPARG, PTCH1, PTEN, ROS1, SMO, and TP53, may act as direct or indirect suppressors in gastric cancer. In particular, BAP1 is a well-known TSG, and its role in gastric cancer has also been identified. This study did not conduct experiments to support the function of highly frequent, methylated SFR genes, including BAP1, in gastric cancer. However, shorter fragmentation and methylation of TSGs and oncogenes may not be unrelated to the development of cancer. Characteristics of the fragments, such as differences in methylation or the length of these genes in the blood, may be the result of their origin from actual cancer tissue. In other words, identification of these characteristics can provide a clear basis for cancer diagnosis using liquid biopsy. Unfortunately, gastric cancer was not ranked in the classification using tissue-specific hypermethylation markers. Perhaps methylation capture may simplify features of the tissue, including stomach, that we were unaware of.
In conclusion, we initiated this study out of curiosity to see whether known properties of ctDNA could be further elucidated through methylation. Although there were limitations in obtaining normal controls, we believe that our approach offers new possibilities for future gastric cancer diagnosis and characterization using liquid biopsy. We plan to conduct large-scale clinical research using the methods identified in this study. In addition, by securing a strong normal control group for clarifying the characteristics of tissue and plasma, and applying various analysis methods to cfDNA, including ctDNA, it is expected that we will be able to get one step closer to cancer diagnosis using liquid biopsy.

4. Materials and Methods

4.1. 40 Healthy Donor Plasmas, 22 Pairs of GC Tissue and Blood, DNA Extraction

In this study, tissue and blood were randomly collected in pairs from 22 patients with cancer stages I to IV (IRB: CUH2022-8-012). For comparative study and normalization, 40 healthy human plasma samples were used (Innovative Research, Novi, MI, USA). cfDNA was collected using the Apostile cfDNA prep kit (Beckman Coulter, Brea, CA, USA). Genomic DNA was extracted from the tissue using a DNeasy kit (Qiagen, Hilden, Germany) and cut into sizes of less than 200 bp using Bioruptor Pico (Diagenode, Denville, NJ, USA). The size and quality of all nucleic acids was measured using TapeStation 4150 (Agilent Technologies, Santa Clara, CA, USA) and a Qubit 4 Fluorometer (Thermofisher Scientific, Waltham, MA, USA).

4.2. MeDIP Sequencing

For the MeDIP sequencing of cfDNA and fragmented gDNA, we followed previous methods [42]. The sequencing data were generated using a MGI G400 sequencer. Each output of sequencing produced more than two times the depth.

4.3. Data Processing and Mapping

The Cutadapt-2.4 program was used to select high-quality sequence data [43]. Adapter sequences and low-quality bases from the back of the original sequence were removed to obtain a high-quality sequence. The high-quality sequences were mapped to the hg38 human genome, and the mem command of the BWA-0.7.15 program was used for the mapping task [44]. Duplicate sequence data were removed using the MarkDuplicates command in the Picard-2.7.1 program. Flowcharts and tools used in data processing, such as DMR, CMR, and SFR, are available in Supplementary Figure S1.

Supplementary Materials

The following supporting information can be downloaded at: https://www.mdpi.com/article/10.3390/ijms25137377/s1.

Author Contributions

S.Y.S., conceptualization (equal), data curation (equal), formal analysis (equal), resources (equal), supervision (equal), writing—review and editing (equal); S.H.Y., conceptualization (equal), data curation (equal), formal analysis (equal), resources (equal), writing—review and editing (supporting); J.-H.B., conceptualization (equal), data curation (lead), formal analysis (lead), methodology (lead), software (lead), validation (lead), visualization (lead), writing—original draft (lead); S.-H.L., conceptualization (equal), data curation (equal), formal analysis (equal), supervision (equal), writing—review and editing (equal); S.Y.L., conceptualization (equal), funding acquisition (lead), investigation (lead), project administration (lead), resources (lead), supervision (lead), writing—review and editing (equal). All authors have read and agreed to the published version of the manuscript.

Funding

This paper was supported by funding from the Biomedical Research Institute, Jeonbuk National University Hospital (CUH2022-0006).

Institutional Review Board Statement

The study was approved by the Ethics Committee/Institutional Review Board (IRB) of Jeonbuk National University Hospital (IRB: CUH2022-8-012) (approval date: 1 September 2022). In addition, prior to the commencement of the study, written informed consent was obtained from all participants.

Informed Consent Statement

Informed consent was obtained from all subjects involved in the study.

Data Availability Statement

All data are available upon reasonable request to the corresponding author of the article.

Conflicts of Interest

The authors declare no conflicts of interest.

References

  1. Nagai, H.; Kim, Y.H. Cancer prevention from the perspective of global cancer burden patterns. J. Thorac. Dis. 2017, 9, 448. [Google Scholar] [CrossRef] [PubMed]
  2. Sung, H.; Ferlay, J.; Siegel, R.L.; Laversanne, M.; Soerjomataram, I.; Jemal, A.; Bray, F. Global cancer statistics 2020: GLOBOCAN estimates of incidence and mortality worldwide for 36 cancers in 185 countries. CA Cancer J. Clin. 2021, 71, 209–249. [Google Scholar] [CrossRef] [PubMed]
  3. Arnold, M.; Rutherford, M.J.; Bardot, A.; Ferlay, J.; Andersson, T.M.; Myklebust, T.Å.; Tervonen, H.; Thursfield, V.; Ransom, D.; Shack, L. Progress in cancer survival, mortality, and incidence in seven high-income countries 1995–2014 (ICBP SURVMARK-2): A population-based study. Lancet Oncol. 2019, 20, 1493–1505. [Google Scholar] [CrossRef]
  4. Park, S.H.; Kang, M.J.; Yun, E.H.; Jung, K.-W. Epidemiology of gastric cancer in Korea: Trends in incidence and survival based on Korea Central Cancer Registry Data (1999–2019). J. Gastric Cancer 2022, 22, 160. [Google Scholar] [CrossRef]
  5. Hong, S.; Won, Y.-J.; Lee, J.J.; Jung, K.-W.; Kong, H.-J.; Im, J.-S.; Seo, H.G. Cancer statistics in Korea: Incidence, mortality, survival, and prevalence in 2018. Cancer Res. Treat. Off. J. Korean Cancer Assoc. 2021, 53, 301. [Google Scholar] [CrossRef] [PubMed]
  6. Ma, S.; Zhou, M.; Xu, Y.; Gu, X.; Zou, M.; Abudushalamu, G.; Yao, Y.; Fan, X.; Wu, G. Clinical application and detection techniques of liquid biopsy in gastric cancer. Mol. Cancer 2023, 22, 7. [Google Scholar] [CrossRef] [PubMed]
  7. Lone, S.N.; Nisar, S.; Masoodi, T.; Singh, M.; Rizwan, A.; Hashem, S.; El-Rifai, W.; Bedognetti, D.; Batra, S.K.; Haris, M. Liquid biopsy: A step closer to transform diagnosis, prognosis and future of cancer treatments. Mol. Cancer 2022, 21, 79. [Google Scholar] [CrossRef] [PubMed]
  8. Soda, N.; Clack, K.; Shiddiky, M.J. Recent advances in liquid biopsy technologies for cancer biomarker detection. Sens. Diagn. 2022, 1, 343–375. [Google Scholar] [CrossRef]
  9. Alix-Panabières, C.; Pantel, K. Clinical applications of circulating tumor cells and circulating tumor DNA as liquid biopsy. Cancer Discov. 2016, 6, 479–491. [Google Scholar] [CrossRef]
  10. Diehl, F.; Schmidt, K.; Choti, M.A.; Romans, K.; Goodman, S.; Li, M.; Thornton, K.; Agrawal, N.; Sokoll, L.; Szabo, S.A. Circulating mutant DNA to assess tumor dynamics. Nat. Med. 2008, 14, 985–990. [Google Scholar] [CrossRef]
  11. Fujii, H.; Nagakura, H.; Kobayashi, N.; Kubo, S.; Tanaka, K.; Watanabe, K.; Horita, N.; Hara, Y.; Nishikawa, M.; Miura, K. Liquid biopsy for detecting epidermal growth factor receptor mutation among patients with non-small cell lung cancer treated with afatinib: A multicenter prospective study. BMC Cancer 2022, 22, 1035. [Google Scholar] [CrossRef] [PubMed]
  12. Nigro, M.C.; Marchese, P.V.; Deiana, C.; Casadio, C.; Galvani, L.; Di Federico, A.; De Giglio, A. Clinical utility and application of liquid biopsy genotyping in lung cancer: A comprehensive review. Lung Cancer Targets Ther. 2023, 14, 11–25. [Google Scholar] [CrossRef] [PubMed]
  13. Nacchio, M.; Sgariglia, R.; Gristina, V.; Pisapia, P.; Pepe, F.; De Luca, C.; Migliatico, I.; Clery, E.; Greco, L.; Vigliar, E. KRAS mutations testing in non-small cell lung cancer: The role of Liquid biopsy in the basal setting. J. Thorac. Dis. 2020, 12, 3836. [Google Scholar] [CrossRef] [PubMed]
  14. Fernandes, G.; Rodrigues, A.; Matos, C.; Barata, F.; Cirnes, L.; Ferreira, L.; Lopes, J.A.; Felizardo, M.; Fidalgo, P.; Brito, U. Liquid biopsy in the management of advanced lung cancer: Implementation and practical aspects. Cancer Treat. Res. Commun. 2023, 36, 100725. [Google Scholar] [CrossRef] [PubMed]
  15. Di Sario, G.; Rossella, V.; Famulari, E.S.; Maurizio, A.; Lazarevic, D.; Giannese, F.; Felici, C. Enhancing clinical potential of liquid biopsy through a multi-omic approach: A systematic review. Front. Genet. 2023, 14, 1152470. [Google Scholar] [CrossRef]
  16. Amelio, I.; Bertolo, R.; Bove, P.; Buonomo, O.C.; Candi, E.; Chiocchi, M.; Cipriani, C.; Di Daniele, N.; Ganini, C.; Juhl, H. Liquid biopsies and cancer omics. Cell Death Discov. 2020, 6, 131. [Google Scholar] [CrossRef]
  17. Chen, G.; Zhang, J.; Fu, Q.; Taly, V.; Tan, F. Integrative analysis of multi-omics data for liquid biopsy. Br. J. Cancer 2023, 128, 505–518. [Google Scholar] [CrossRef]
  18. Dulbecco, R. A turning point in cancer research: Sequencing the human genome. Science 1986, 231, 1055–1056. [Google Scholar] [CrossRef]
  19. Jones, P.A.; Baylin, S.B. The epigenomics of cancer. Cell 2007, 128, 683–692. [Google Scholar] [CrossRef]
  20. Zhou, J.; Sears, R.L.; Xing, X.; Zhang, B.; Li, D.; Rockweiler, N.B.; Jang, H.S.; Choudhary, M.N.; Lee, H.J.; Lowdon, R.F. Tissue-specific DNA methylation is conserved across human, mouse, and rat, and driven by primary sequence conservation. BMC Genom. 2017, 18, 1–17. [Google Scholar] [CrossRef]
  21. Ghosh, S.; Yates, A.J.; Frühwald, M.C.; Miecznikowski, J.C.; Plass, C.; Smiraglia, D. Tissue specific DNA methylation of CpG islands in normal human adult somatic tissues distinguishes neural from non-neural tissues. Epigenetics 2010, 5, 527–538. [Google Scholar] [CrossRef] [PubMed]
  22. Sun, K.; Jiang, P.; Chan, K.A.; Wong, J.; Cheng, Y.K.; Liang, R.H.; Chan, W.-K.; Ma, E.S.; Chan, S.L.; Cheng, S.H. Plasma DNA tissue mapping by genome-wide methylation sequencing for noninvasive prenatal, cancer, and transplantation assessments. Proc. Natl. Acad. Sci. USA 2015, 112, E5503–E5512. [Google Scholar] [CrossRef] [PubMed]
  23. Li, W.; Li, Q.; Kang, S.; Same, M.; Zhou, Y.; Sun, C.; Liu, C.-C.; Matsuoka, L.; Sher, L.; Wong, W.H. CancerDetector: Ultrasensitive and non-invasive cancer detection at the resolution of individual reads using cell-free DNA methylation sequencing data. Nucleic Acids Res. 2018, 46, e89. [Google Scholar] [CrossRef] [PubMed]
  24. Mouliere, F.; Rosenfeld, N. Circulating tumor-derived DNA is shorter than somatic DNA in plasma. Proc. Natl. Acad. Sci. USA 2015, 112, 3178–3179. [Google Scholar] [CrossRef] [PubMed]
  25. Chen, E.; Cario, C.L.; Leong, L.; Lopez, K.; Márquez, C.P.; Chu, C.; Li, P.S.; Oropeza, E.; Tenggara, I.; Cowan, J. Cell-free DNA concentration and fragment size as a biomarker for prostate cancer. Sci. Rep. 2021, 11, 5040. [Google Scholar] [CrossRef] [PubMed]
  26. Lo, Y.D.; Han, D.S.; Jiang, P.; Chiu, R.W. Epigenetics, fragmentomics, and topology of cell-free DNA in liquid biopsies. Science 2021, 372, eaaw3616. [Google Scholar] [CrossRef] [PubMed]
  27. Cristiano, S.; Leal, A.; Phallen, J.; Fiksel, J.; Adleff, V.; Bruhm, D.C.; Jensen, S.Ø.; Medina, J.E.; Hruban, C.; White, J.R. Genome-wide cell-free DNA fragmentation in patients with cancer. Nature 2019, 570, 385–389. [Google Scholar] [CrossRef] [PubMed]
  28. Desai, N.A.; Shankar, V. Single-strand-specific nucleases. FEMS Microbiol. Rev. 2003, 26, 457–491. [Google Scholar] [CrossRef]
  29. Balian, A.; Hernandez, F.J. Nucleases as molecular targets for cancer diagnosis. Biomark. Res. 2021, 9, 1–16. [Google Scholar] [CrossRef]
  30. Yang, W. Nucleases: Diversity of structure, function and mechanism. Q. Rev. Biophys. 2011, 44, 1–93. [Google Scholar] [CrossRef]
  31. Zhou, Z.; Ma, M.-J.L.; Chan, R.W.; Lam, W.J.; Peng, W.; Gai, W.; Hu, X.; Ding, S.C.; Ji, L.; Zhou, Q. Fragmentation landscape of cell-free DNA revealed by deconvolutional analysis of end motifs. Proc. Natl. Acad. Sci. USA 2023, 120, e2220982120. [Google Scholar] [CrossRef]
  32. Lienhard, M.; Grimm, C.; Morkel, M.; Herwig, R.; Chavez, L. MEDIPS: Genome-wide differential coverage analysis of sequencing data derived from DNA enrichment experiments. Bioinformatics 2014, 30, 284–286. [Google Scholar] [CrossRef] [PubMed]
  33. Vrba, L.; Futscher, B.W. A suite of DNA methylation markers that can detect most common human cancers. Epigenetics 2018, 13, 61–72. [Google Scholar] [CrossRef]
  34. Moss, J.; Magenheim, J.; Neiman, D.; Zemmour, H.; Loyfer, N.; Korach, A.; Samet, Y.; Maoz, M.; Druid, H.; Arner, P. Comprehensive human cell-type methylation atlas reveals origins of circulating cell-free DNA in health and disease. Nat. Commun. 2018, 9, 5068. [Google Scholar] [CrossRef] [PubMed]
  35. Zhang, Y.; Liu, T.; Meyer, C.A.; Eeckhoute, J.; Johnson, D.S.; Bernstein, B.E.; Nusbaum, C.; Myers, R.M.; Brown, M.; Li, W. Model-based analysis of ChIP-Seq (MACS). Genome Biol. 2008, 9, 1–9. [Google Scholar] [CrossRef]
  36. Lee, S.H.; Park, C.K.; Lee, S.Y.; Choi, C.M. Treatment outcomes and safety of afatinib in advanced squamous cell lung cancer progressed after platinum-based doublet chemotherapy and immunotherapy (SPACE study). Thorac. Cancer 2021, 12, 1264–1268. [Google Scholar] [CrossRef] [PubMed]
  37. Boks, M.P.; Derks, E.M.; Weisenberger, D.J.; Strengman, E.; Janson, E.; Sommer, I.E.; Kahn, R.S.; Ophoff, R.A. The relationship of DNA methylation with age, gender and genotype in twins and healthy controls. PLoS ONE 2009, 4, e6767. [Google Scholar] [CrossRef]
  38. Lakshminarasimhan, R.; Liang, G. The role of DNA methylation in cancer. Adv. Exp. Med. Biol. 2016, 945, 151–172. [Google Scholar] [CrossRef]
  39. Nishiyama, A.; Nakanishi, M. Navigating the DNA methylation landscape of cancer. Trends Genet. 2021, 37, 1012–1027. [Google Scholar] [CrossRef]
  40. Stejskal, P.; Goodarzi, H.; Srovnal, J.; Hajdúch, M.; van’t Veer, L.J.; Magbanua, M.J.M. Circulating tumor nucleic acids: Biology, release mechanisms, and clinical relevance. Mol. Cancer 2023, 22, 15. [Google Scholar] [CrossRef]
  41. Neumann, M.H.; Bender, S.; Krahn, T.; Schlange, T. ctDNA and CTCs in liquid biopsy–current status and where we need to progress. Comput. Struct. Biotechnol. J. 2018, 16, 190–195. [Google Scholar] [CrossRef]
  42. Shen, S.Y.; Burgener, J.M.; Bratman, S.V.; De Carvalho, D.D. Preparation of cfMeDIP-seq libraries for methylome profiling of plasma cell-free DNA. Nat. Protoc. 2019, 14, 2749–2780. [Google Scholar] [CrossRef] [PubMed]
  43. Martin, M. Cutadapt removes adapter sequences from high-throughput sequencing reads. EMBnet. J. 2011, 17, 10–12. [Google Scholar] [CrossRef]
  44. Li, H.; Durbin, R. Fast and accurate short read alignment with Burrows–Wheeler transform. Bioinformatics 2009, 25, 1754–1760. [Google Scholar] [CrossRef] [PubMed]
Figure 1. Size and composition of DMR obtained by comparing tissue and plasma of gastric cancer patients with healthy donor plasma. (A) The graph shows the total number and size of DMRs obtained by comparing the gastric cancer patients’ plasma or tissue to healthy donor plasma. (B) Red and blue bars represent the proportion of methylation gain and loss among total DMRs, respectively, when compared to heathy donor plasma. (C,D) The graph shows the total size of methylation gained and methylation lost.
Ijms 25 07377 g001
Figure 2. Size and distribution of CMR obtained by comparing tissue and plasma of gastric cancer patients. Red and black bars represent DMRs found only in the patient’s plasma and tissue, respectively. The green bars show commonly presented methylation regions in the patients’ plasma and tissue.
Ijms 25 07377 g002
Figure 3. Distribution of SFR and ability to distinguish between gastric cancer and normal samples. (A) The graph shows the length and distribution of cfDNA obtained from the plasma of cancer patients (red) and healthy people (black). (B) SFRs were displayed for each individual and divided into genomic regions (grey) and CpG islands (red and black). (C,D) The graph shows the SFR between the two groups of cancer patients and healthy people in genomic and CpG island regions, respectively. (E,F) The graph shows the ROC curve and AUC score of SFR in genomic and CpG island regions, respectively. ROC, receiver operating characteristic; AUC, area under the ROC curve.
Ijms 25 07377 g003
Figure 4. Differences in SFR within cancer-related genes. The graph shows the differences in SFR in the plasma of 22 patients (red) and 40 healthy people (blue) for each promoter of 51 cancer-related genes.
Ijms 25 07377 g004
Table 1. Information of specimens in the study.
GroupEthnicityTissueSampleCapture# Samples# Individual
Gastric
Cancer
KoreanPlasmacfDNAMeDIP2222
CancergDNAMeDIP22
HealthyHispanicPlasmacfDNAMeDIP4040
Table 2. List of the top 10 significant 5′end-motifs.
MotifAverage Frequency (Rate)p-Value
Cancer PatientsHealthy Individuals
CCAC0.0121980.0100765.03 × 10−11
AGCT0.0032540.0048466.11 × 10−11
TCCT0.0045310.0031616.11 × 10−11
TCAG0.0028900.0017858.16 × 10−11
TACG0.0006660.0004499.85 × 10−11
AGTC0.0023730.0031929.89 × 10−11
AGTT0.0023560.0043421.20 × 10−10
TCAA0.0025750.0016061.20 × 10−10
AGAT0.0026910.0037701.32 × 10−10
AGCC0.0032520.0039591.45 × 10−10
Disclaimer/Publisher’s Note: The statements, opinions and data contained in all publications are solely those of the individual author(s) and contributor(s) and not of MDPI and/or the editor(s). MDPI and/or the editor(s) disclaim responsibility for any injury to people or property resulting from any ideas, methods, instructions or products referred to in the content.

