Article

Transcriptional Silencing of 35S rDNA in Tragopogon porrifolius Correlates with Cytosine Methylation in Sequence-Specific Manner

Institute of Biophysics of the Czech Academy of Sciences, 612 65 Brno, Czech Republic
*
Author to whom correspondence should be addressed.
Int. J. Mol. Sci. 2024, 25(14), 7540; https://doi.org/10.3390/ijms25147540
Submission received: 12 April 2024 / Revised: 21 June 2024 / Accepted: 4 July 2024 / Published: 9 July 2024
(This article belongs to the Section Molecular Plant Sciences)

Abstract

:
Despite the widely accepted involvement of DNA methylation in the regulation of rDNA transcription, the relative participation of different cytosine methylation pathways is currently described only for a few model plants. Using PacBio, Bisulfite, and RNA sequencing; PCR; Southern hybridizations; and FISH, the epigenetic consequences of rDNA copy number variation were estimated in two T. porrifolius lineages, por1 and por2, the latter with more than twice the rDNA copy numbers distributed approximately equally between NORs on chromosomes A and D. The lower rDNA content in por1 correlated with significantly reduced (>90%) sizes of both D-NORs. Moreover, two (L and S) prominent rDNA variants, differing in the repetitive organization of intergenic spacers, were detected in por2, while only the S-rDNA variant was detected in por1. Transcriptional activity of S-rDNA in por1 was associated with secondary constriction of both A-NORs. In contrast, silencing of S-rDNA in por2 was accompanied by condensation of A-NORs, secondary constriction on D-NORs, and L-rDNA transcriptional activity, suggesting (i) bidirectional nucleolar dominance and (ii) association of S-rDNAs with A-NORs and L-rDNAs with D-NORs in T. porrifolius. Each S- and L-rDNA array was formed of several sub-variants differentiating both genetically (specific SNPs) and epigenetically (transcriptional efficiency and cytosine methylation). The most significant correlations between rDNA silencing and methylation were detected for symmetric CWG motifs followed by CG motifs. No correlations were detected for external cytosine in CCGs or asymmetric CHHs, where methylation was rather position-dependent, particularly for AT-rich variants. We conclude that variations in rDNA copy numbers in plant diploids can be accompanied by prompt epigenetic responses to maintain an appropriate number of active rDNAs. The methylation dynamics of CWGs are likely to be the most responsible for regulating silent and active rDNA states.

1. Introduction

35S rRNA genes (rDNA) are one of the most abundant repetitive elements in eukaryotic genomes. Hundreds to thousands of rDNA copies are typically organized into tandem arrays, the so-called nucleolar organizing regions (NORs) [1,2]. Its repetitive nature makes rDNA one of the most unstable genomic regions, where unequal recombination may result in intragenomic variability in rDNA copy numbers [3,4,5,6,7], which may play an important role in maintaining genomic integrity, gene expression diversity, and evolutionary adaptability [8,9,10]. Furthermore, recombination plays an important role in sequence homogenization when individual rDNA units in an array evolve concertedly, resulting in the co-existence of numerous nearly identical units in the same genome [11]. Regardless, multiple rDNA variants can be simultaneously present in the same genome and even within a single rDNA array [12,13,14,15], and different rRNA variants can be integrated into ribosomes in a tissue-specific manner [16].
The rDNA is transcribed by RNA polymerase I (Pol I) into a single pre-rRNA transcript formed of 18S, 5.8S, and 26S rRNAs; two internal transcribed spacers (ITS1 and ITS2); and two external (3′ETS1 and 5′ETS2) transcribed spacers, which is then processed into the 18S, 5.8S, and 26S rRNA mature forms [17]. Each transcribed region in a tandem array is separated from both neighboring ones by long, highly variable “non-transcribed” spacers (NTS), which form, together with ETS1 and ETS2, the so-called intergenic spacer (IGS). The occurrence of conserved structural features such as PolI promoter(s), the transcription initiation site (TIS), the transcription termination site (TTS), and tandem repeats indicate that the IGS is a functionally important region participating in the control of Pol I transcription [18]. All these common structural elements within IGS may be arranged in highly complex patterns, resulting in variations between related species, populations, and even within an individual [13,14,15].
Because the cellular demand for protein synthesis varies during development, only subsets of rRNA genes are active, and their transcription is under epigenetic dosage control [19]. In genetic hybrids, one manifestation of dosage control is nucleolar dominance (ND), an epigenetic phenomenon in which the rDNAs of one progenitor are repressed [20]. Active rDNAs exhibit open euchromatic structures, while silent rDNAs show a more compact heterochromatic structure, and an intermediate chromatin configuration indicates the rDNAs primed for transcriptional activation [21]. The interplay of DNA methylation, histone modification, and chromatin remodeling directed by non-coding RNAs, often derived from IGS, may be required to establish specific transcriptional states at individual rDNA units [22,23,24,25,26,27]. The ratio of active to inactive rDNAs is often tissue-specific and is stably propagated through cell cycle progression [16,28]. Although the mechanism and functional relevance of rDNA silencing are well understood, little is known about how and which genes are chosen for inactivation [29].
DNA methylation at the 5′-cytosine, mediated by a spectrum of DNA methyltransferases, is the most widespread epigenetic mark of DNA in eukaryotes with diverse functions, such as heterochromatin formation [30], transposon silencing [31], mammalian X-chromosome inactivation [32], and gene imprinting [33]. In plants, cytosine methylation may occur in all sequence contexts, CG, CHG, and CHH (H = A, C, or T) [31]. However, the mechanisms responsible for targeting 5 mC in specific sequence contexts and the mutual roles of the individual methylated motifs in rDNA silencing/activation are not fully understood. The methylation pattern can be guided by specific histone modifications [34,35], the pairing of repetitive sequences [36], small RNA interactions [37], and transcription factors [38]. Active DNA demethylation, mediated by DNA glycosylases is crucial for genome-wide epigenetic reprogramming and locus-specific gene activation during plant development [39].
Tragopogon porrifolius (2n = 2x = 12) is a polyphyletic, morphologically highly variable diploid species composed of at least three subspecies, native throughout the Mediterranean [40]. T. porrifolius ssp. porrifolius, phylogenetically well separated from other collections, has a karyotype possessing two NORs on chromosome pairs A and D, while the remaining subspecies, australis and cupani, have only one NOR on chromosomes A, as is typical of most species of the genus [41,42,43].
To characterize the genetic and epigenetic relationships between A- and D-NORs in T. porrifolius ssp. porrifolius (hereafter referred to as T. porrifolius), we used two highly related por1 and por2 lineages (Figure S1) that substantially differed in rDNA copy numbers and relative sizes of A- and D-NORs. Based on these differences, global repetitive organization of IGS (PacBio sequencing), transcriptional activity (RNA-seq, cDNA-CAPS), higher-order chromatin structure (Fluorescence In situ Hybridizations), and cytosine methylation (Bisulfite-Illumina sequencing) were assigned to both A- and D-NORs. Furthermore, the genetic and epigenetic consequences associated with variations in rDNA copy numbers were evaluated. Finally, methylation dynamics of individual sequence motifs in multiple genetically highly related rDNA variants, both transcriptionally active and silent, were used for the estimation of the relative participation of different cytosine methylation pathways in the regulation of rDNA transcription.

2. Results

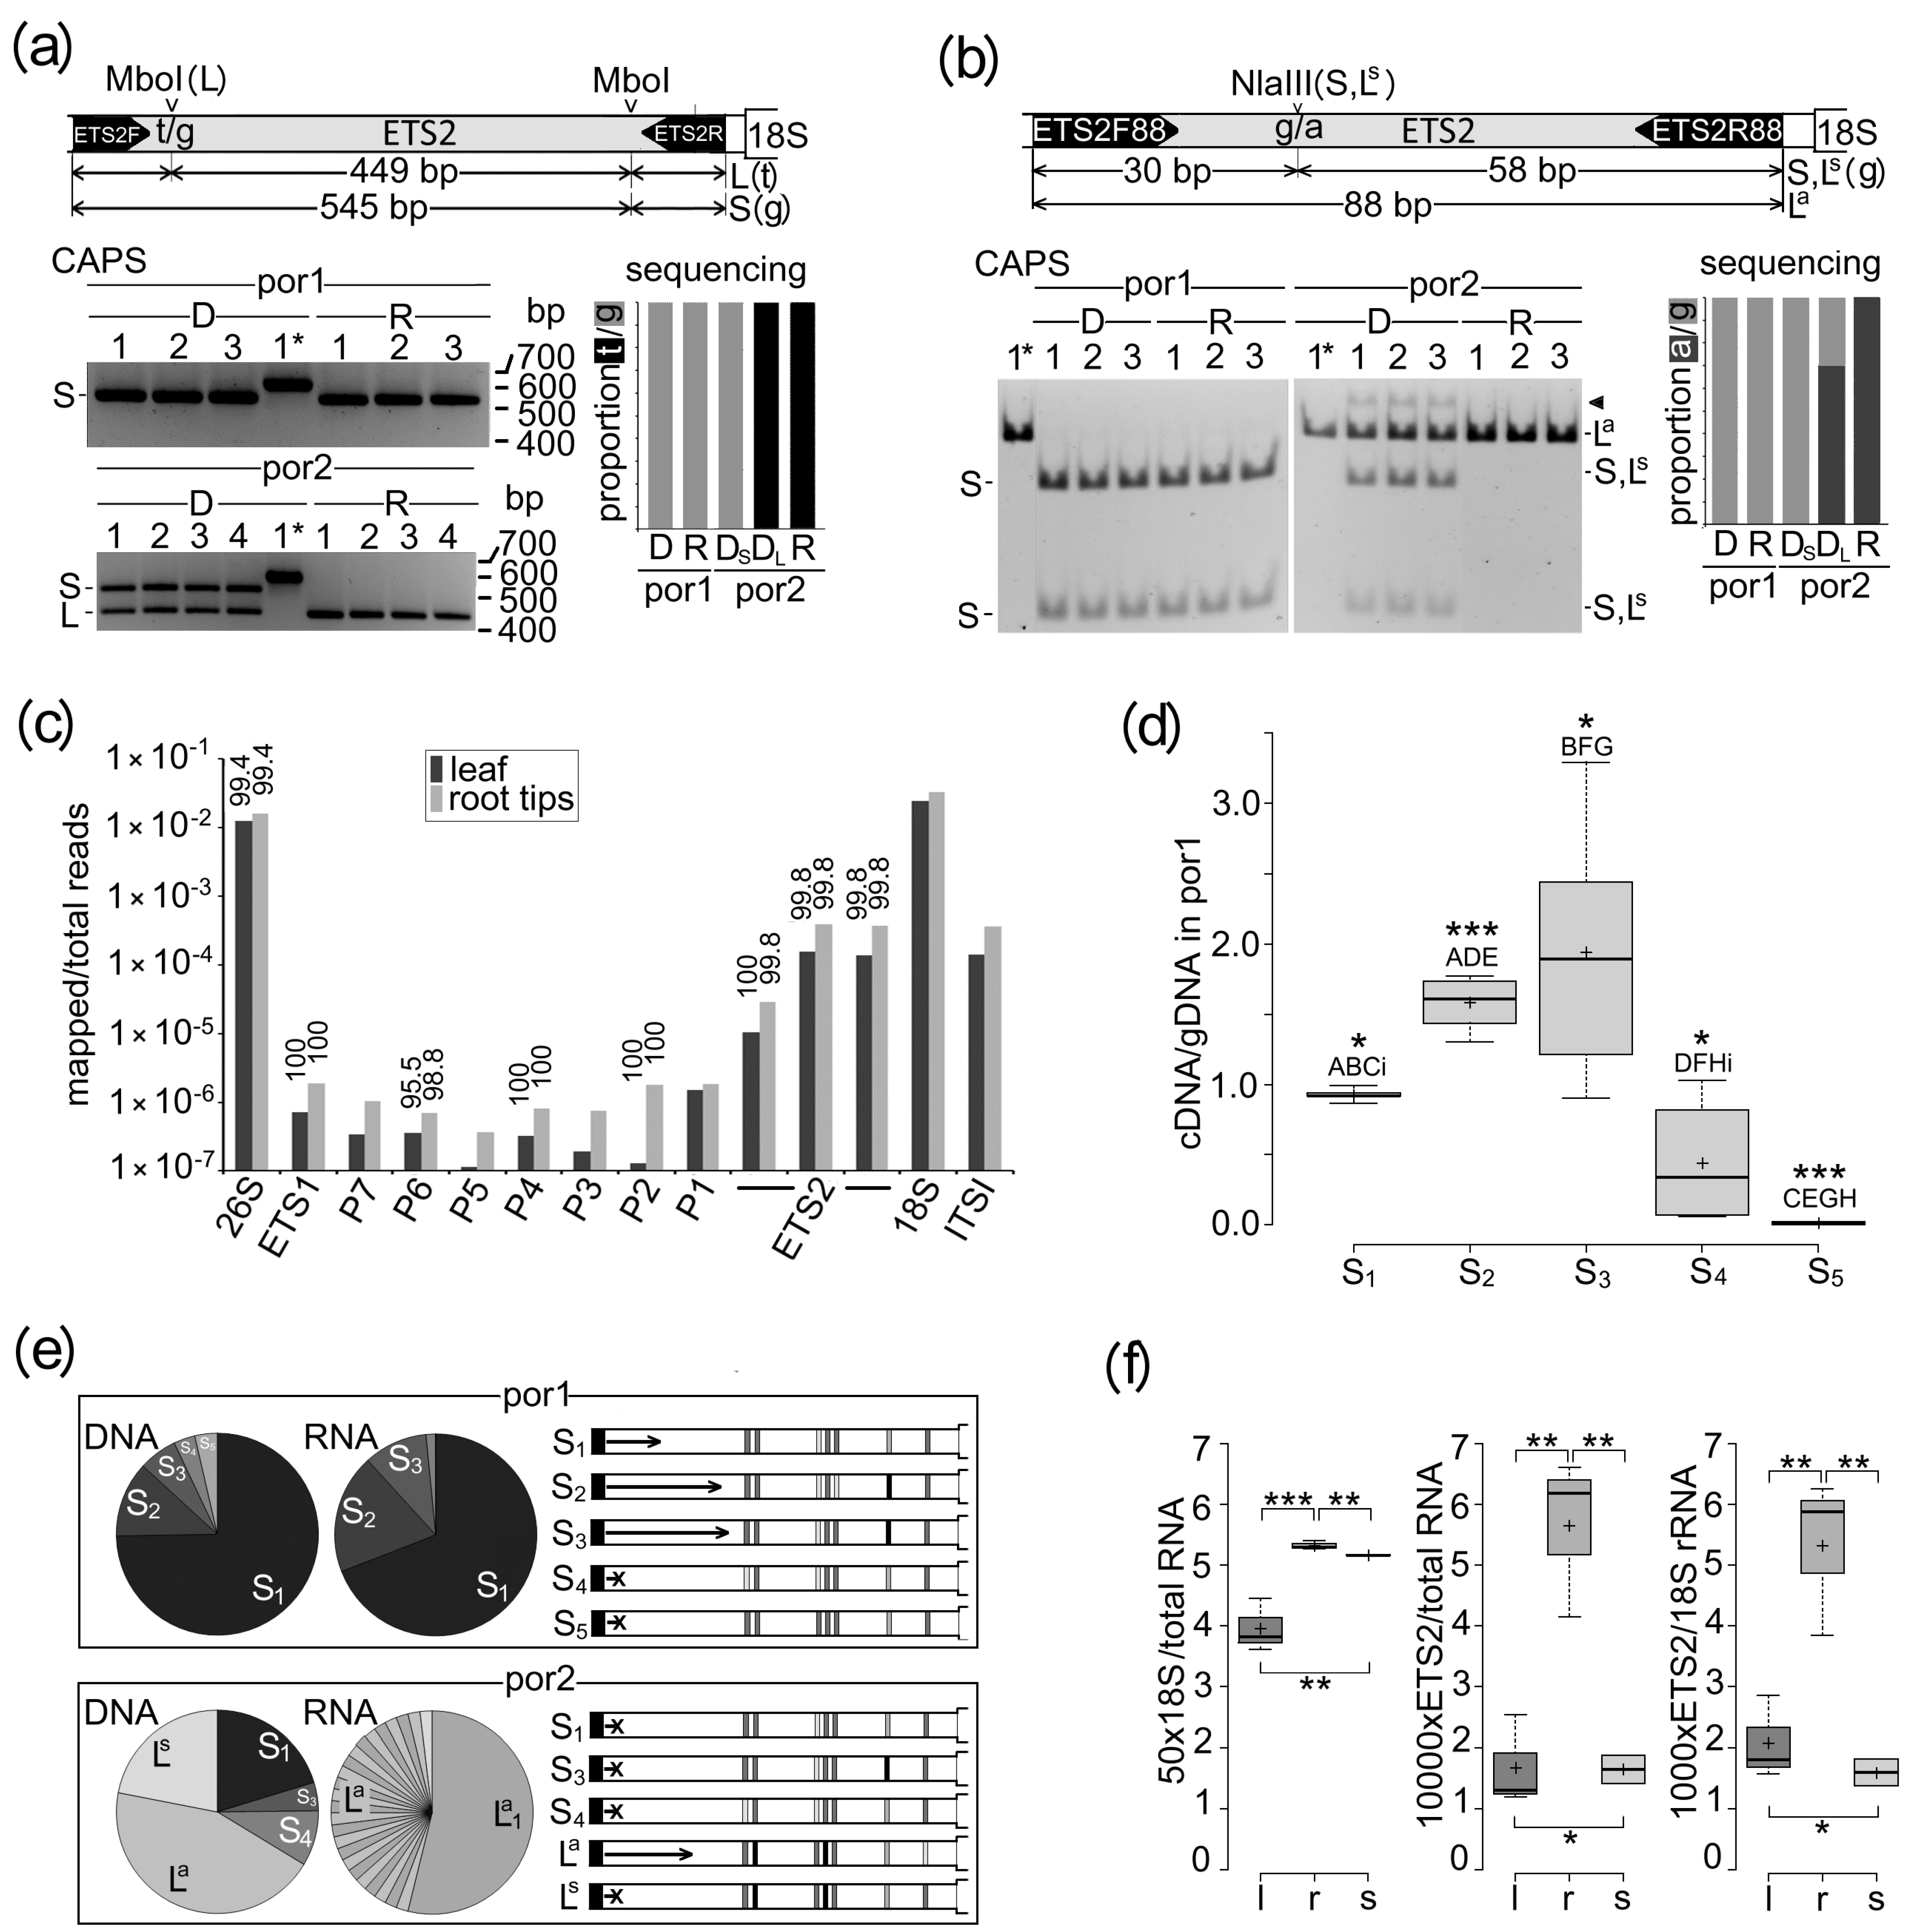
2.1. One Abundant rDNA Variant Was Detected in por1, Whereas Two rDNA Variants Occurred in por2

We used long PacBio sequences to analyze the structure variability of rDNA units in the por1 and por2 lineages of T. porrifolius. The IGSs in both lineages were built of common sequence motifs mainly represented by multiple kinds of tandemly arranged repeats (R) and dispersed promoter elements (Ps) (Figure 1a). The most abundant repeat R103 was composed of 103–104 bp long, equally oriented repetitive units distributed across multiple (3–5) blocks of variable sizes (1–12 R103 units). Each block of R103 repeats was flanked by Ps (~80 bp) that shared the motif TATATATRGGG closely related to plant TIS for PolI. The region covering P5 and R103c was frequently deleted, increasing the structural variability of IGS (Figure S2b). Sequence similarities between individual Ps were considerably high (>95%) (Table S1). Arrays of R103 and P repeats were mostly interrupted by two microsatellites (R2, R7), and one satellite (R156). R2 and R7 were represented by partially degenerated (AT)0–50 and (C2T2G3)7 motifs, respectively, the latter with the propensity to form G4 structures. The satellite R156 was mostly formed from four 152–158 long units. These three repeats were seldom deleted, resulting in rarely occurring truncated IGSs (Figure S2b). Degenerated dimers of both 98 bp and 16 bp long regions and a short CpG island were detected in ETS2.
Alignment of PacBio reads (Figure 1a), PCR amplifications (Figure 1b), and Southern hybridizations (Figure 1c) consistently revealed two major rDNA variants (called L and S) in por2, while only S-rDNA variant was found in the por1. The most noticeable differences between both variants were (i) the relative lengths of the R103b and R103d repeat arrays (Figure 1a) and (ii) two abundant T>G substitutions in ETS2 (Figure 1e). Despite different lengths, the R103bL and R103bS satellites were highly related, differing mainly in the insertion of the R103 dimmer formed of h- and g-R103 variants. In contrast, repeat arrays R103dL and R103dS differed in all repeat units. Semiquantitative evaluations of hybridization signals (Figure 1c) and sequencing (Figure S2d and Table S2) revealed that (i) L-rDNA in por2 was substantially more abundant than S-rDNA in both por1 and por2 lineages and (ii) por2 lineage contained more than twice as much rDNA as por1.
On the phylogenetic tree, the S- and L-rDNA variants formed two well-supported clades (Figure 1d). Each clade comprised several subclades, indicating the presence of at least five abundant subvariants in S-rDNA (S1–S5) and two subvariants in L-rDNA (La and Ls). One prominent G>A transition found within the target for NlaIII (Figure 1a,e) distinguished La- from both S- and Ls-rDNAs. Four abundant nucleotide substitutions distinguished S-rDNA subvariants, whose mutual proportions substantially differed between por1 and por2 (Figure 1f and Figure S2d).

2.2. Multiple rDNA Variants within Each L- and S-rDNA Array Differed in Transcriptional Activity

To determine the relative transcription activity of individual rDNA variants, we carried out transcriptome analyses by RT-CAPS and RNAseq. To distinguish L- and S-rDNA variants by CAPS, we used MboI having two targets in the L-rDNA and a single target in the S-rDNA (Figure 2a). In por2, genomic CAPS visualized two bands corresponding to L- and S-rDNAs, while there was a single fragment derived from the S-rDNA in the por1 lineage. At the transcriptome level, the S-rDNA variant was amplified in por1, whereas only the L-rDNA variant was amplified in por2. There was no amplification of the S-rDNA variant in this lineage. Consistent with the RT-CAPS analysis, only L-rDNA specific transcripts (both MboI targets) were detected in the por2 transcriptome by RNAseq (right bar charts). To distinguish La-rDNAs from both Ls- and S-rDNA variants by CAPS, we used NlaIII having one target in both Ls- and S-rDNAs but no target in La-rDNA (Figure 2b). In por2, genomic CAPS visualized undigested PCR products corresponding to La-rDNA and two digested fragments corresponding to a mixture of S- and Ls-rDNAs, while there were only digested fragments derived from the S-rDNA in the por1 lineage. At the RNA level, the S-rDNA variant was amplified in por1, whereas only the La-rDNA variant was amplified in por2. There was no amplification of the Ls and S-variants in this lineage. Consistent with the RT-CAPS analysis, only specific transcripts from La-rDNA (no target for NlaIII) were detected in the por2 transcriptome by RNAseq (right bar charts). Considering the entire rDNA unit, the number of other polymorphic sites that distinguished L- and S-rDNA variants in the por2 confirmed the selective silencing of the S-rDNAs (Figure 2c). All rDNA sequence motifs were detected in the transcripts but with extremely variable frequency. The most abundant transcripts originated from 18S and 26S rRNA genes, followed by substantially lower contents of transcripts from ETS2 and ITS regions. An even lower transcript content was associated with ETS1 and all seven core promoters. All transcripts were more abundant in root tips than in leaves.
In contrast to the por2 lineage, the S-rDNAs were transcriptionally active in por1 (Figure 2a,b). The three most abundant S-rDNA variants (S1–S3) (Figure 1f) were also frequently detected in the transcriptome, although in different proportions than in the genome (Figure 2d,e). Significant enrichment in the transcriptome was associated with under-represented S2-rDNA, indicating higher specific transcription than S1-rDNA. An elevated proportion in the transcriptome, although statistically insignificant, was also detected for S3-rDNA, the third most abundant variant in por1. Both the least abundant S4- and S5-rDNA variants were transcriptionally silenced as follows from their relative contents in genomes and transcriptomes.
To estimate tissue-specific variations in the transcriptional efficiency of 35S rDNA more precisely, the contents of ETS2 and 18S rRNA transcripts were related to the total RNA in young leaves, root tips, and five-day-old seedlings (Figure 2f). Compared to leaves, the RNA transcripts in root tips were significantly (p2 < 0.01) enriched by 18S rRNA if normalized to the total RNA. Enrichment was also detected for seedlings, but only with moderate statistical support (0.05 > p2 > 0.01). Only root tips showed a moderate enrichment of ETS2 primary transcripts relative to both young leaves and seedlings if normalized to total RNA or 18S rRNA. Because S- and Ls-rDNA variants were silenced in all examined por2 tissues (Figure 2a–c and Figure S2), we supposed that tissue-specific transcriptional changes were associated with (epigenetic) changes within La-rDNA.

2.3. Estimation of the Positions of Individual rDNA Variants within Chromosomal Complement

The distribution of rDNA on individual chromosomes and chromatin condensation was analyzed in root tips by fluorescence in situ hybridization (FISH) using 18S rDNA and 5S rDNA probes (Figure 3 and Figure S4). In the por1 metaphases, the 18S rDNA probe hybridized to two large sites on a submetacetric A-chromosome pair and two faint sites on a pair of D-chromosomes (Figure 3b and Figure S4c). On both A- and D-chromosomes the signals were clustered at subtelomeric positions. The 5S rDNA probe hybridized to four interstitial sites, two of which were localized on A-chromosomes. In the por2 metaphases, the 18S probe hybridized to four strong sites on chromosomes A and D (Figure 3d and Figure S4f). The signals on the D-chromosomes were stronger than the signals on the A-chromosomes. The 5S rDNA probe hybridization patterns were similar to those in por1.
The secondary constrictions, a hallmark of transcription activity of 35S rDNA, were observed during prophase, on both A-chromosomes in por1 (Figure 3a and Figure S4a,b), while they were located on both D-chromosomes in por2 (Figure 3c and Figure S4d,e). In the por1 interphase, most 18S rDNA signals were located around the nucleolus exhibiting variable levels of chromatin condensation (Figure 3e). In por2, only a fraction of 18S rDNA was located around the nucleolus while two highly condensed signals occurred outside the nucleolus (Figure 3f). Thus, these results collectively indicated that bidirectional nucleolar dominance, associated either with transcriptionally active A-NORs in por1 or with dominant D-NORs in por2, occurred in T. porrifolius. The relative sizes of individual rDNA loci (Figure 3g, h) and their epigenetic (condensed/decondensed) patterns were similar in all analyzed individuals within each por1 and por2 lineage.
Owing to highly related sequences of S-rDNA and L-rDNA variants, it was not possible to assign individual rDNA variants to corresponding NORs by FISH, using specific probes. However, indirect assignment of S-rDNA to A-NORs and L-rDNA to D-NORs was performed based on correlations between (i) the total number of in-size similar NORs (Figure 3 and Figure S4) and the total number of abundant rDNA variants (Figure 1c) in por1 and por2 lineages, (ii) mutual magnitudes of A- and D-NORs and proportions of S- and L-rDNAs in por2 (Figure 3h), (iii) chromatin condensations of both A-NORs in por2 (Figure 3c and Figure S4d,e) and the silent state of S-rDNA in this lineage (Figure 2e), (iv) secondary constrictions on both D-NORs and transcriptional dominance of L-rDNA in por2 (Figure 3a,c,d and Figure S4a,b,d,e). As it is widely accepted that chromatin structure and transcription of rDNA are controlled by specific epigenetic markers, we further analyzed differences between individual rDNA variants in selected epigenetic modifications.

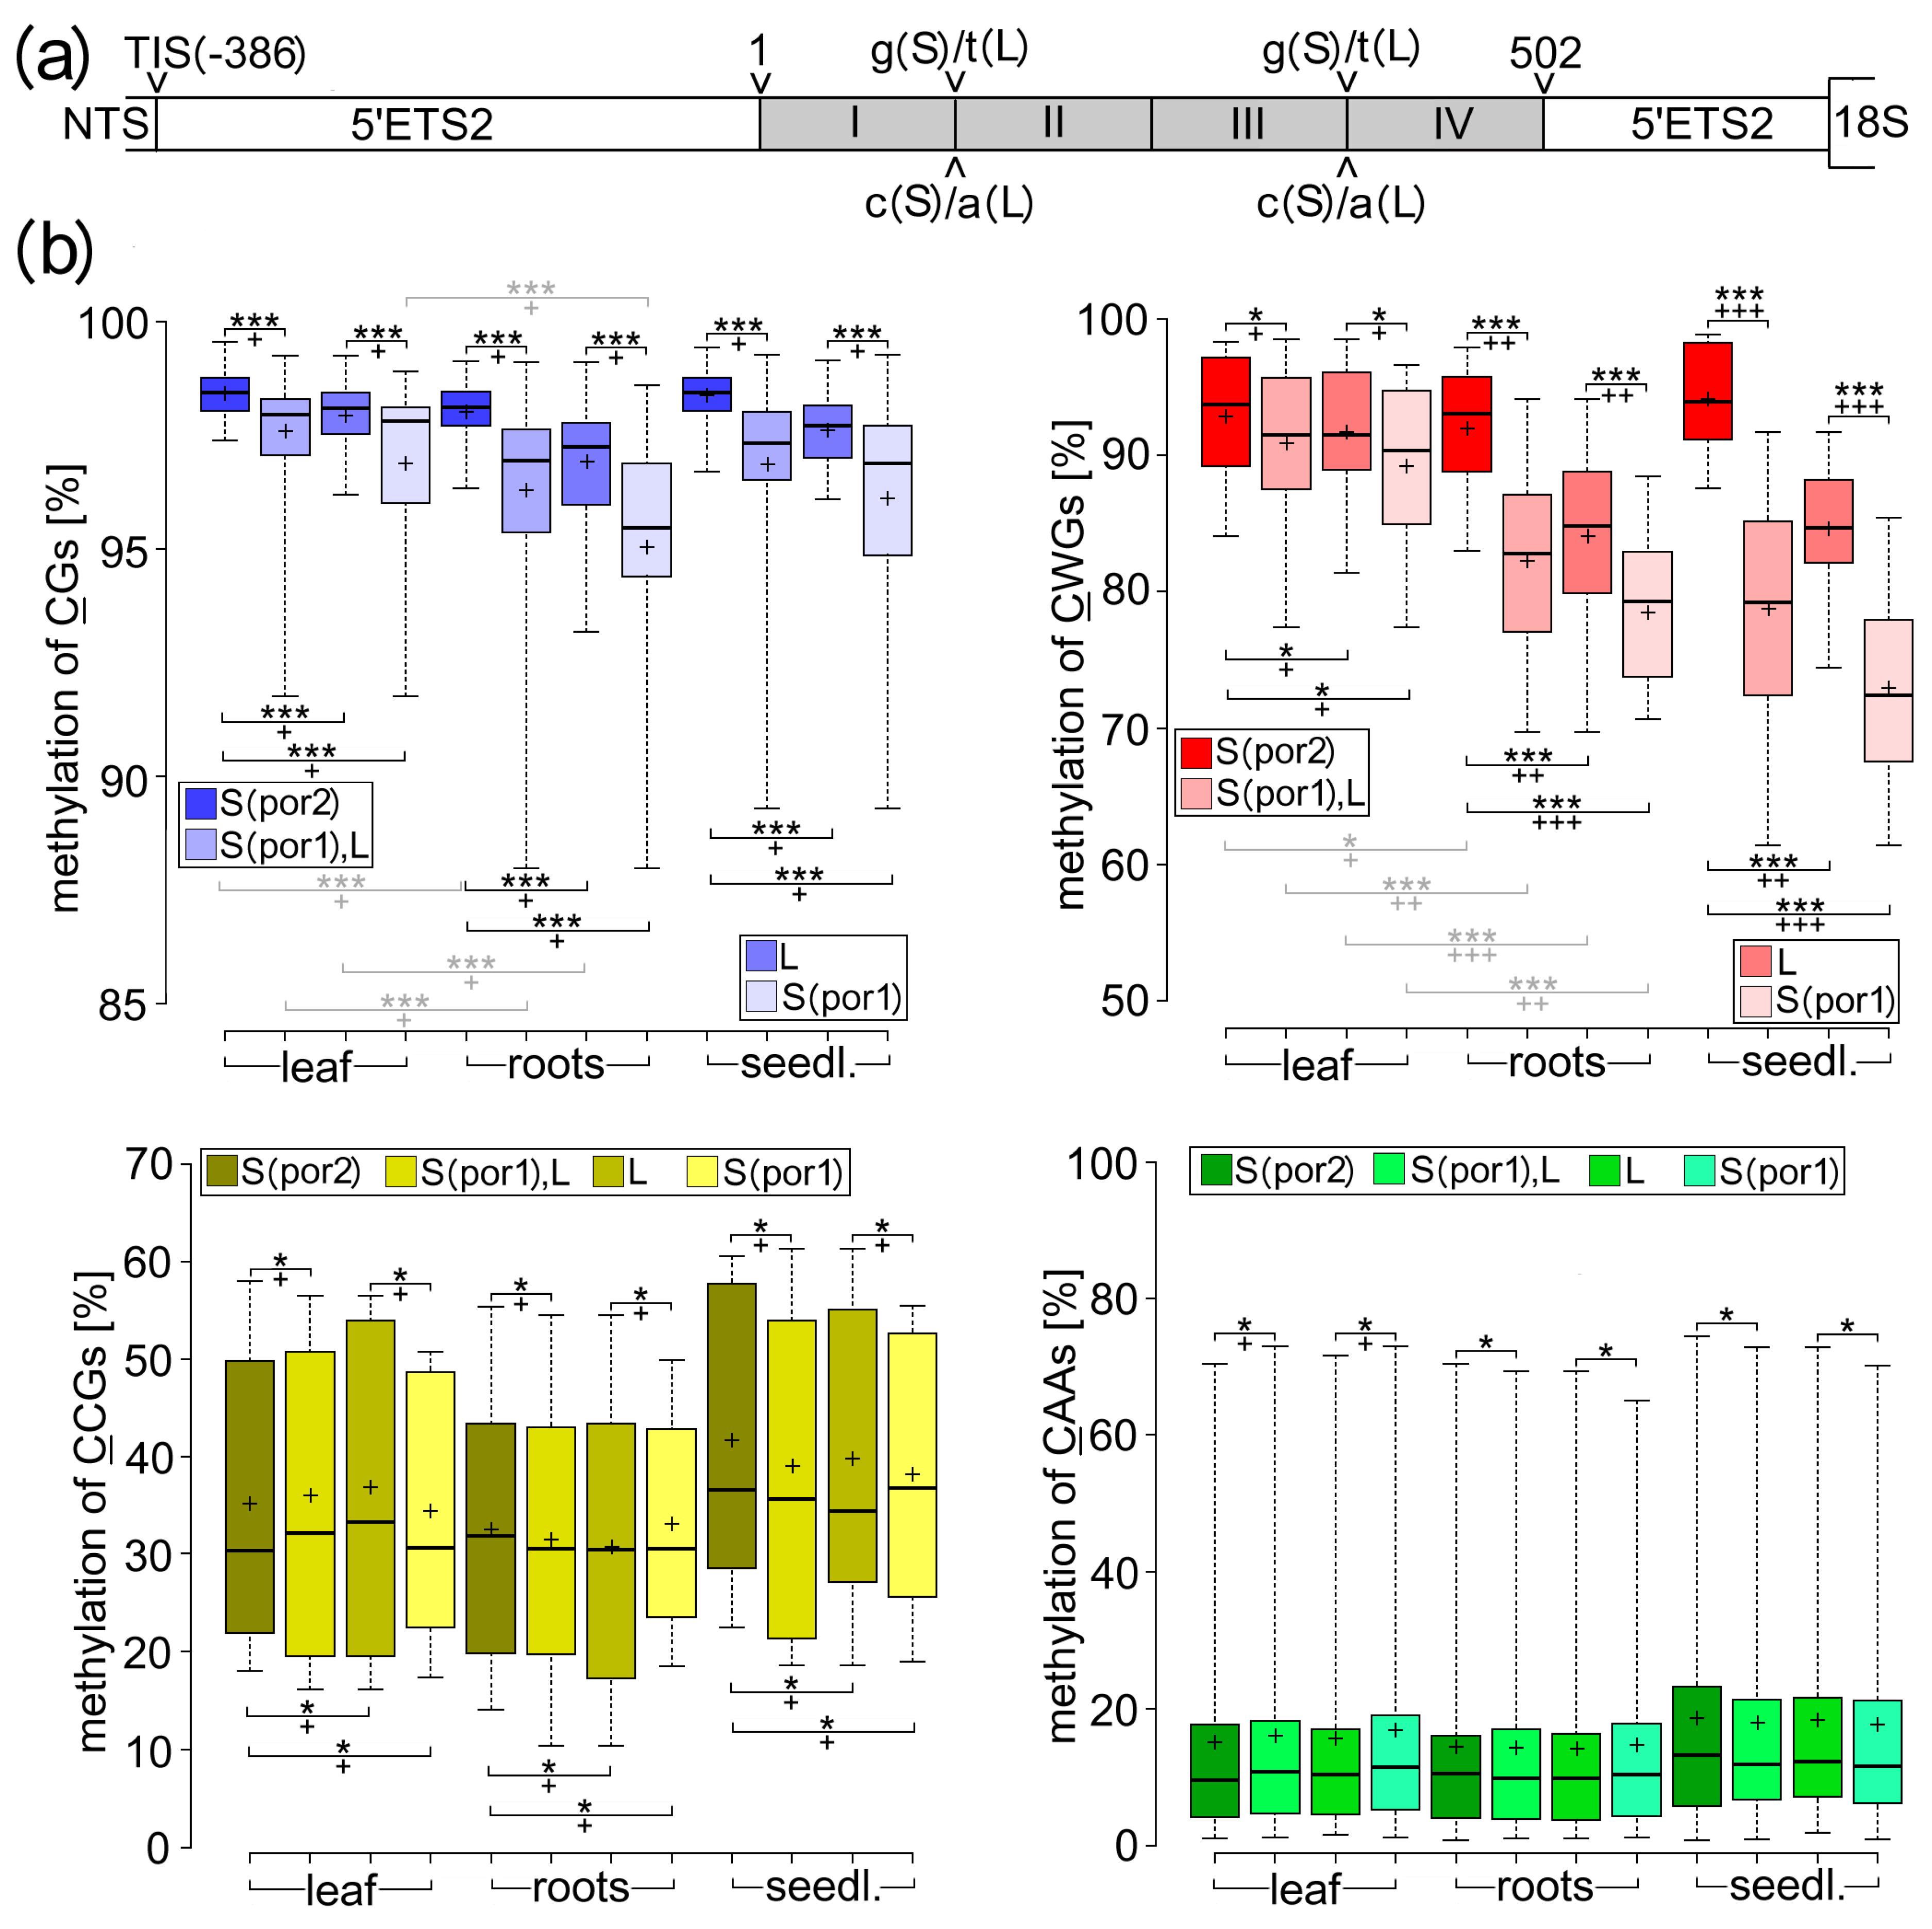
2.4. Transcriptional Variability between Individual rDNA Variants Correlated with Their Cytosine Methylation, Particularly in CWG Motifs

To assess the role of individual epigenetic modifications in silencing S-rDNA transcription, por2 seedlings were treated with 5-azacytidine (AzaC), 9-(2,3-dihydroxypropyl) adenine (DHPA), and sodium butyrate (NaBT) known to selectively interfere with respective biochemical pathways. The relative transcription of individual rDNA variants was estimated using cDNA-CAPS (Figure S3). S-rDNA variants were partially activated during germination by DNA-hypomethylating AzaC and DHPA, although AzaC was substantially more efficient than the latter. NaBT, an inhibitor of histone deacetylase [44], had negligible or no effect on activation, although associated morphological changes, represented predominantly by delayed growth of the primary root, were similar to those induced by AzaC (Figure S3f). Co-treatment with AzaC and NaBT did not lead to additive or synergistic effects. Because it was difficult to distinguish between drug-activated and persistently active S-rDNAs, the por1 lineage was not subjected to analogous treatments.
To comprehensively characterize the participation of individual methylated cytosines in the regulation of rDNA transcription in T. porrifolius, numerous rDNA variants, differing in specific transcriptional activity, were subjected to bisulfite conversion in combination with Illumina sequencing. We focused on the 5′-ETS2 region representing the 5′- end of the primary transcript (Figure 1a) and containing homogenized specific SNPs allowing discrimination between individual rDNA variants (Figure 4a and Figure S5a). Two G>T transversions discriminated between major L- and S-rDNA variants. The G>A transition differentiated between La- and (S + Ls)-rDNA variants on the plus (G-rich) strand. In addition, several other SNPs discriminated between individual S-rDNA variants in por1 (Figure 1f and Figure 2e). To estimate the statistical support of differences in methylation patterns between individual rDNA variants we used: (i) eight biological samples that differed substantially in overall rDNA transcription efficiency (Table S3, sheet 1), (ii) methylation analyses of each respective cytosine (Figure 4) and (iii) methylation analyses of whole Illumina read (Figure S6b).
An initial comparison of all active and all silenced rDNA variants showed statistically well-supported enrichment of methylated CG or CWG motifs, but not CCGs and CHHs, in silenced rDNA variants compared to active ones (Table S3, Sheet 2B). These differences were more pronounced in seedlings and root tips than in leaves. Despite the higher average methylation of CGs (97.3%) than CWGs (88.0%), the absolute differences between the methylation of silent and active rDNAs in root tips and seedlings were substantially greater for CWGs (Ds-a > 10.5%) than for CGs (Ds-a < 1.7%), suggesting that the methylation dynamics of CWGs are likely to be most responsible for regulating active and silent rDNA states in T. porrifolius.
To support this assumption, methylation patterns were compared between several pairs of rDNA variants with well-estimated relative transcriptional efficiency: (i) Silent S-rDNAs from por2 were compared with active L-rDNAs from por2 or active S-rDNAs from por1 (Figure 4b and Figures S5b–d, S6b and S7). (ii) Silent (S + Ls)-rDNAs from por2 were compared with active La-rDNAs from por2 or active S-rDNAs from por1 (Figures S5e,f, S6d and S7). (iii) Silent Ls-rDNAs were compared with active La-rDNAs (Figure S8). (iv) On average, less-active L-rDNAs from por2 were compared with, on average, more-active S-rDNAs from por1 (Figure 4b and Figure S5b). (v) Active La-rDNAs from por2 were compared with active S-rDNAs from por1 (Figures S5e and S6d). (vi) On average, less-active S1,4,5-rDNAs were compared with, on average, more-active S2,3-rDNAs in por1 (Figure S9a–c). (vii) Silent S5-rDNAs were compared with active S2-rDNAs or S1,3,4-rDNAs in por1 (Figure S9d–f). (viii) Less-active S1,3,4-rDNAs were compared with more-active S2-rDNAs in por1 (Figure S9d–f).
All pairwise comparisons revealed that each CWG, but not each CG, CCG, or CHH, was more densely methylated in rDNA with a lower transcription efficiency (Figures S5, S7, S8b,d and S9a,e). It is necessary to emphasize that the substantially lower methylation of all CWGs in S-rDNAs from por1 than in L-rDNAs from por2 (Figures S5b and S7) also correlated with higher specific activity of S-rDNA in por1 than L-rDNA in por2. Considering the comparable demands for the number of active rRNA genes in the highly related por1 and por2 lineages and the substantially lower content of S-rDNA in por1 than L-rDNA in por2 (Table S2), the specific activity of S-rDNA in por1 was higher than the specific activity of L-rDNA in por2. All these differences were always most pronounced in seedlings but negligible in leaves. The vast majority of CGs were also methylated more densely in transcriptionally less-active rDNA variants; however, the absolute differences were substantially lower (up to 10%; Figure S5b) than in the case of CWGs (up to 46%; Figure S9d). In contrast, CHHs and the outer cytosine in CCGs showed often higher methylation in the transcriptionally more-active rDNA(s), with the most illustrative example represented by the S2,3- and the S1,4,5-rDNA variants in por1 (Figure S9a).
These results, based on the comparison of methylation of individual Cs, were further supported by statistical evaluations of methylation differences between individual rDNA variants within a given tissue as well as between individual tissues for a given rDNA variant (Figure 4 and Figures S6, S8c and S9b,f). Similar methylation behavior of both symmetrical CG and CWG motifs were characterized by statistically significantly (p2 < 0.01) supported enrichment of methylation (Figure 4) in the following: (i) S-rDNAs compared to L-rDNAs, both from por2 root tips and seedlings, (ii) L-rDNAs from por2 compared to S-rDNAs from por1 root tips and seedlings, (iii) S-rDNAs from por2 compared to S-rDNAs from por1 root tips and seedlings, and (iv) leaves compared to root tips (seedlings) for transcriptionally active rDNAs (S from por1 or L from por2) but not for silent rDNA variants (S from por2). Substantially larger absolute differences between average methylations were detected for CWGs than for CGs in all pairwise comparisons. In contrast, no pairwise comparison detected statistically significantly supported differences for CAAs or CCGs, either between individual rDNAs or between individual tissues. However, AT-rich CHHs (CAA, CTA, and CAT), as well as CCGs, showed an even wider overall range of methylation than the CWGs (Table S3, sheet 2B). Consistently, more than 70% of the pairwise differences between the methylation ranges of individual CAAs, CTAs, or CCGs were supported statistically significantly (Figure S10). However, these proportions were substantially reduced (<30%) for the CGs and CWGs. These analyses indicate that the methylation of individual AT-rich CHHs and perhaps also CCGs was influenced by their spatial position within ETS2. In contrast, the overall methylation variability of CWGs and, to a lesser extent, CGs is mainly due to global epigenetic differences between individual rDNA variants, mainly between active and silent, and also between active rDNAs in different tissues.

3. Discussion

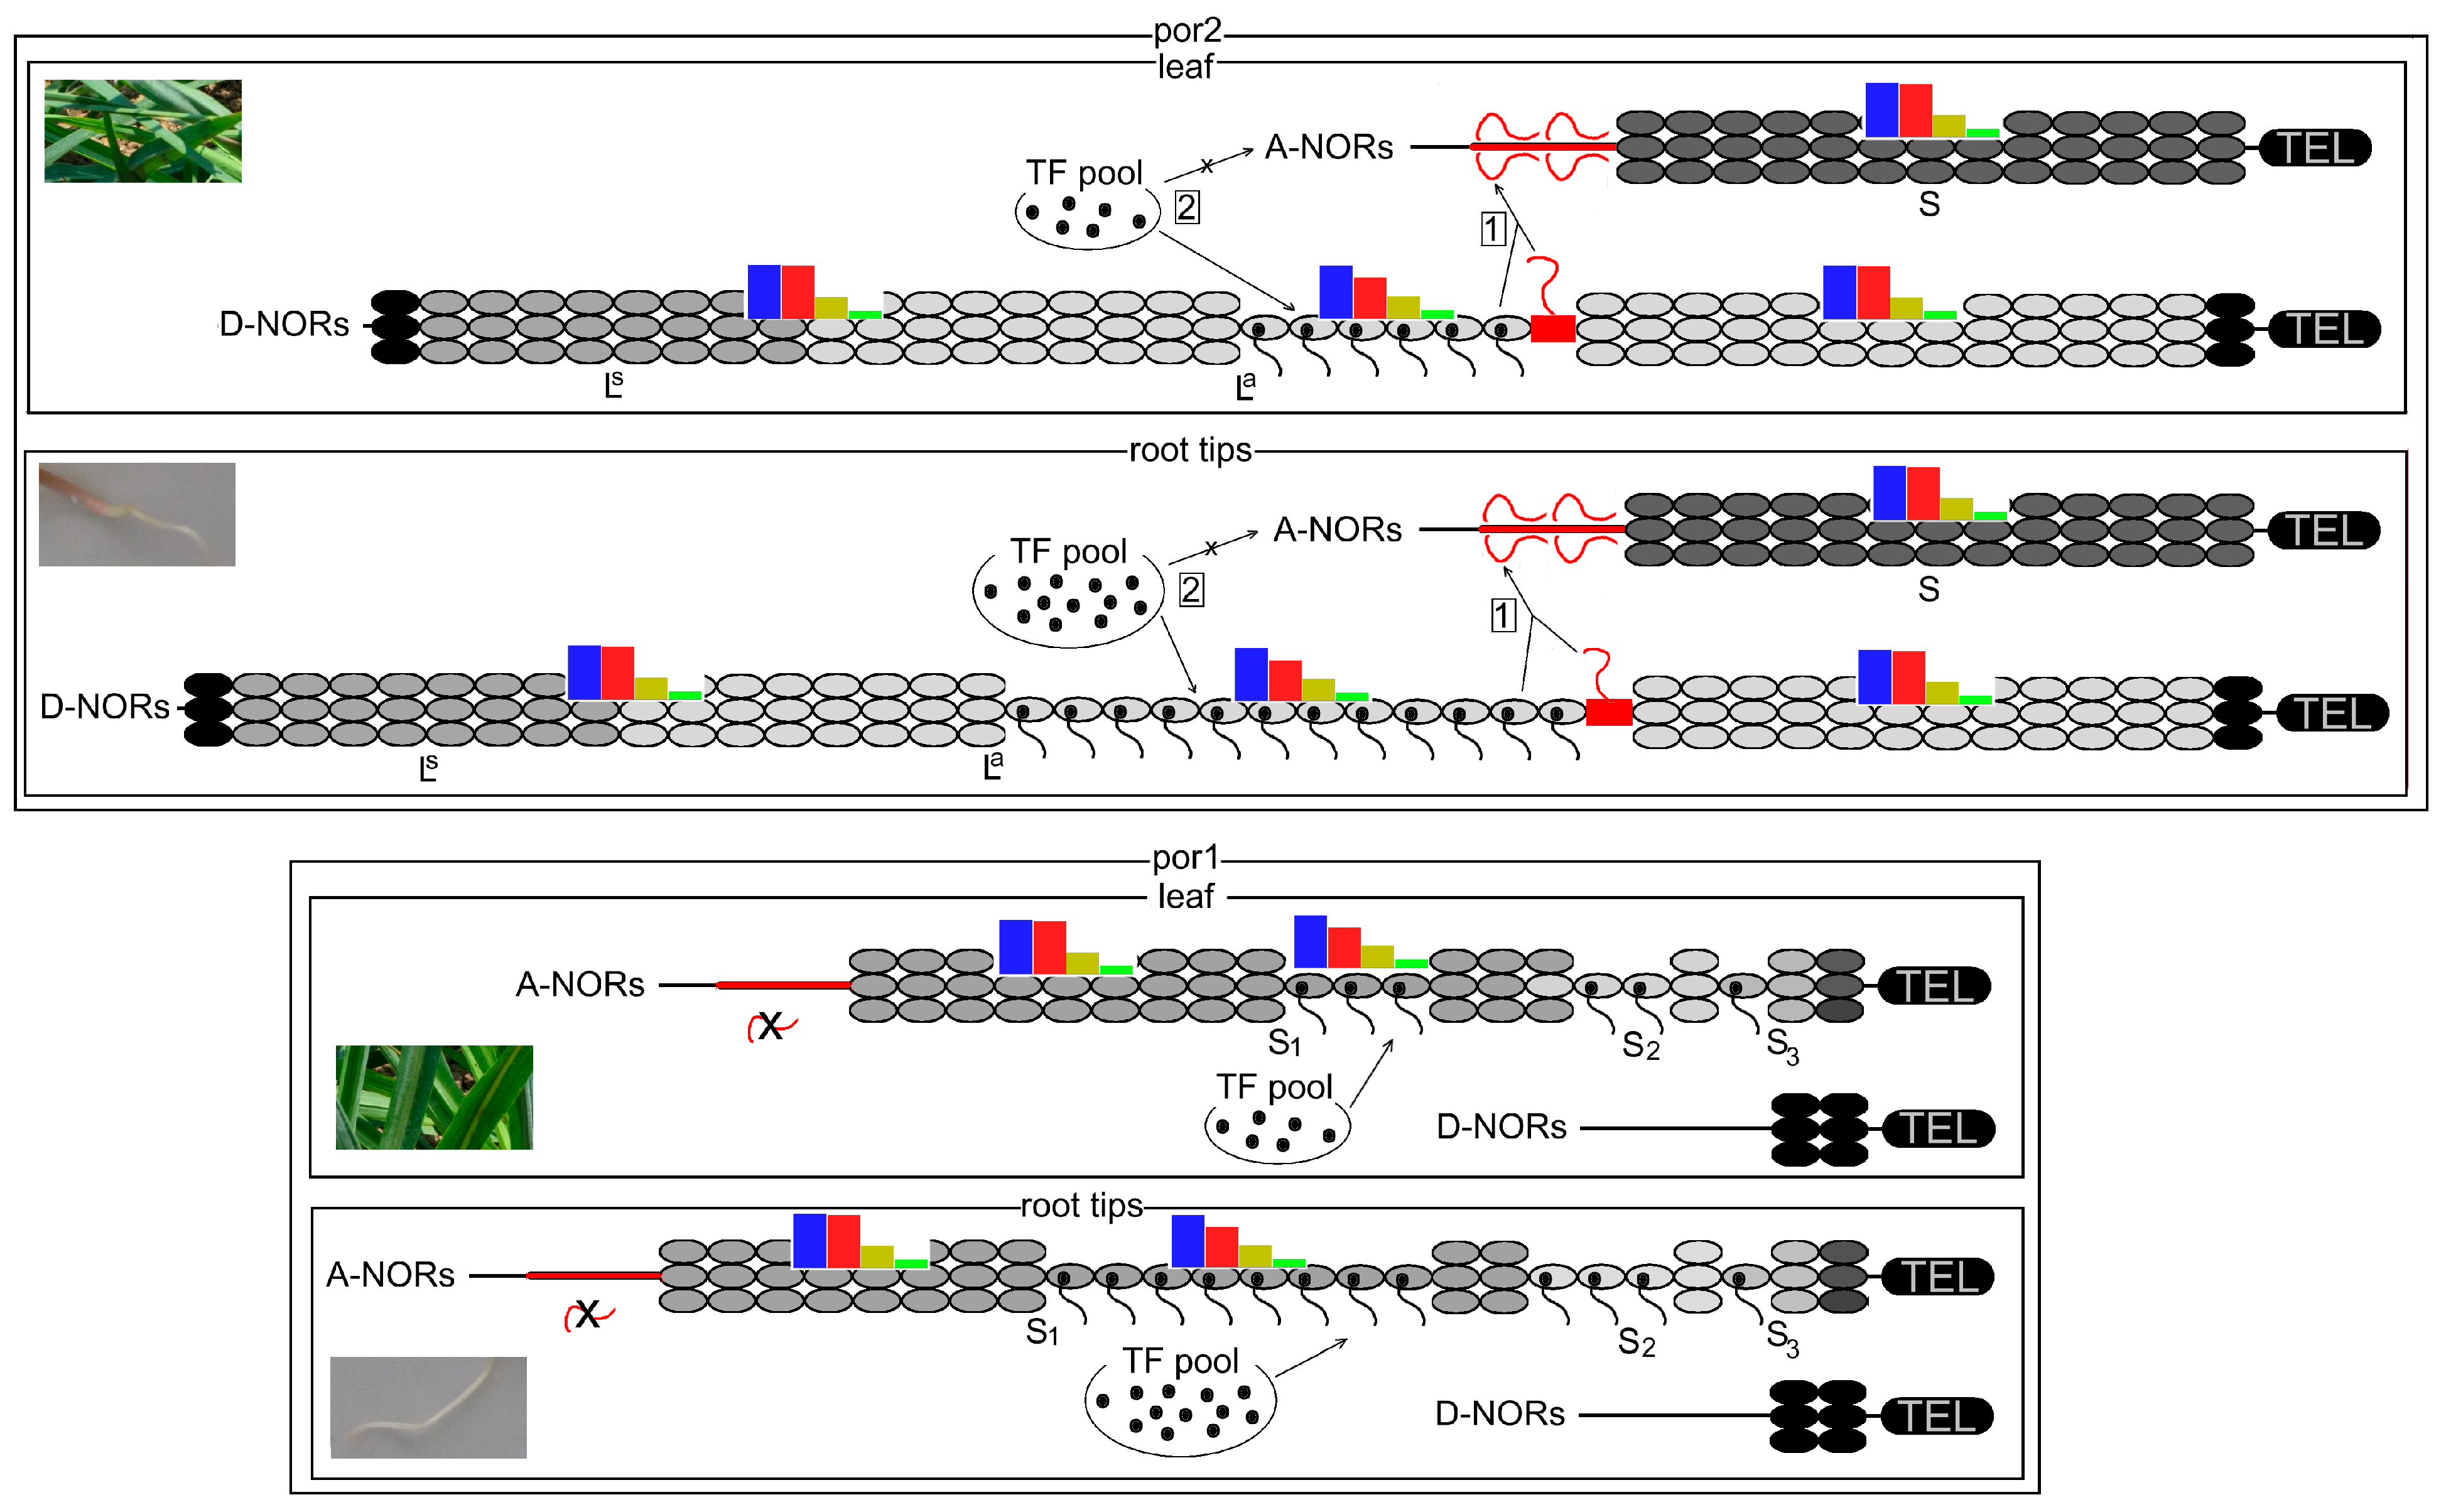
3.1. Bidirectional Nuclear Dominance in Non-Hybrid Diploid Tragopogon porrifolius ssp. Porrifolius

The chromosomal complement (2n = 2x = 12), distribution of NORs on chromosomes A and D (Figure 3 and Figure S4), flower morphology (Figure S1), and the highly related ETS2 indicated that por1 and por2 lineages are considerably more closely related to each other compared to other T. porrifolius accessions. The closest relatives are the accessions from T. porrifolius ssp. porrifolius [45,46]. The approximately 150 diploid Tragopogon species can be classified into 3 karyotypes differing in the localization of NORs on (i) A- and D-chromosomes, (ii) only A-chromosomes, and (iii) only D-chromosomes [42]. Highly homogeneous ETS2 sequences did not provide evidence that the por1 or por2 arose from hybridization between progenitors with the last two karyotypes. Of course, the original differences between A- and D-NORs, if inherited from possible interspecific hybridization, may have been obscured by homogenization during the evolution of T. porrifolius. More likely, the elevated number of NORs in T. porrifolius and several other diploid Tragopogon species resulted from translocation events [41,46]. Thus, T. porrifolius represents a rare example of a non-hybrid diploid with a well-established ND, as indicated by the secondary constriction on D-NORs accompanied by condensation of A-NORs and, at the molecular level, selective silencing of one of two abundant rDNA variants distinct in IGS structure. The dominant character of D-NORs can be preserved even during their silenced state in allotetraploid T. mirus, where Ad-NORs inherited from the T. dubius progenitor dominate both Ap- and Dp-NORs inherited from the T. porrifolius progenitor [47]. Deleting large portions of both Ad-NORs induced selective activation of only Dp-NORs [48]. The selective silencing of S-rDNA characterized by a shorter satellite located upstream of the TIS in T. porrifolius is most reminiscent of diploid Hordeum vulgare, where the activity of the two NORs positively correlates with the number of the 135 bp repeats located upstream of the promoters [49,50].
If both negligible D-NORs in por1 arose as a consequence of the homologous deletion of a large portion of the L-rDNAs, then it is likely that this deletion induced such epigenetic changes in the transcriptionally activated A-NORs that lead to S-rDNA epigenetic variants with a methylation pattern similar to that in dominant La-rDNA in por2. The most pronounced hypomethylation occurred in CWGs and to a lesser extent in CGs, predominantly in seedlings and root tips. At the same time, no or negligible changes in methylations were associated with other motifs. These changes suggest (i) the functionality of some silenced S-rDNA in por2, (ii) similar mechanisms leading to epigenetic patterning in active NORs in por1 and por2, and (iii) the occurrence of bidirectional ND in T. porrifolius. Of course, D-NORs in por2 could have arisen also through extensive amplification of D-NORs in por1. However, this direction of rDNA evolution seems less likely given that DNA breaks are more likely in long rDNA arrays [48], and amplifications to such an extent have not yet been observed. The following mechanisms that may be involved in the selective silencing/activation of different rDNA variants (NORs) in T. porrifolius can be envisioned.

3.1.1. Competition between Promoters (Enhancers) for Limited Regulatory Elements

The non-hybrid feature of the diploid T. porrifolius genome suggests a relatively homogeneous population of transcription factors (TF) involved in 35S rDNA transcription. However, even very small sequence variations between rDNA genes can affect nucleosome positioning or base pairing with noncoding RNAs, thus inhibiting or facilitating TF action [51,52]. Because no structural differences were found between the respective core promoters in both abundant rDNA variants in T. porrifolius, we assume that the satellites that are located between the P2 and P3 promoters and represent the most significant differences between L- and S-rDNAs may bind TF with an efficiency proportional to its lengths, as proposed for Xenopus [53,54,55,56] and Cucumis [57]. In por2, a limited pool of certain TF can be exhausted by the longer repeat in the more abundant L-rDNA, which are dispersed within the nucleolus available for transcription, while S-genes with a shorter repeat and lower affinity to TF are silenced (Figure 5). In contrast, the tiny D-NORs in por1 left enough transcription factors to activate the A-NORs. In plants, correlations between transcriptional efficiency and the length of tandem repeats surrounding promoters were detected in diploids Hordeum vulgare [50]; Vigna radiata [18]; Solanum [58]; and the allopolyploids Triticum-Aegilops [59], Triticum-Secale [60], and Tragopogon mirus [48,61]. However, no such correlations were detected in artificial Solanum allopolyploids [62], Brassica [63], and Arabidopsis [64], suggesting that other mechanisms may participate in selecting rDNA variants for silencing.

3.1.2. Intact D-NORs Mediate Silencing of A-NORs

The correlation between the silencing of A-NORs and the integrity of D-NORs in T. porrifolius suggests that intact D-NORs can trigger the transcriptional silencing of A-NORs. It is likely that some in trans acting factors, generated by intact transcriptionally active NORs in por2, can selectively compete with the transcriptional machinery of A-NORs, leading to silencing and increased cytosine methylation, particularly in CWGs (Figure 5). A drastic reduction in the copy numbers of rDNA in D-NORs can completely interrupt the production of these factors, leading to activating A-NORs. A similar scenario can be envisaged for T. mirus [47,48] (see above). The activation of silent 35S rRNA genes was recently described in A. thaliana mutants with artificially reduced copy numbers of rDNA [65]. Activating fully functional rDNAs, currently, facultative heterochromatin appears to represent a common mechanism for eliminating the fatal consequences triggered by various biotic or abiotic stimuli. The more stable heterochromatic locus serves as a reserve that can be mobilized relatively quickly after disruption of the epigenetic interactions between the loci.
Although the nature of the “silencers” is largely unknown, specific non-coding RNAs associated with D-NORs may be the most likely candidates. Highly variable rDNA intergenic transcripts are likely involved in rDNA silencing in the mouse [26] and selective silencing of A. thaliana-derived rDNA homeologs in the allotetraploid A. suecica [25,66]. In A. thaliana, specific IGS transcripts from minor rDNA variant(s) might generate siRNA for RNA-directed de novo methylation, which could be involved in silencing the major rDNA variant [67,68]. In this context, it is necessary to emphasize that IGS transcripts in por2 were derived exclusively from D-NORs, although steady-state levels were extremely low. Furthermore, unrelated sequences inserted near the PolI promoter may produce artificial ncRNA that can act as specific silencers, similar to a recently proposed mechanism in animals [69].

3.1.3. Mutual Locations of Particular rDNA Variants within NORs

In T. porrifolius, several rDNA variants that differed genetically and epigenetically were assigned to each A- and D-NOR. Due to the considerably long and repetitive nature of the rDNA unit, their actual organization within each NOR is currently unknown. This can only be speculated by analogy with several already properly analyzed plant models. In Oryza sativa, the rDNA units arranged at the distal end of a single NOR are formed of more copies of the sub-repeats in the IGS than units located proximally [70]. Each of the three prominent rDNA variants in A. thaliana, differing in length of 3′-ETS, is clustered over distances as large as 1.5 Mbp along the NOR4. The cluster with the longest 3′-ETS is located at the distal end [12]. In Allium cernum, rDNAs with the same number of the A-subrepeats within IGS are clustered into blocks [71].
Thus, we suppose that in T. porrifolius, individual genetically and epigenetically highly related rDNA variants are clustered rather than intermingled within each NOR (Figure 5). Such arrangement evolved via concerted evolution, resulting in homogenization and mutation spreading among neighboring rDNA units, a mechanism recently proposed by Wang et al. [72]. This process can be accompanied by gradual epigenetic modifications [73,74]. Transcriptionally active and hypomethylated, particularly at CWG motifs, epigenetic variants probably occupy a central decondensed region(s), whereas transcriptionally silent and highly methylated variants form highly condensed boundary knobs. This is consistent with the ultralong sequencing of rDNA in A. thaliana, which revealed that most rDNA activity occurs in the central region of NOR4 [75]. These observations suppose that selective rDNA silencing is regulated on a multimegabase scale to inactivate large clusters of rDNA within each NOR rather than by mechanisms dependent on subtle gene sequence variation. These three models are not necessarily exclusive; the action of silencers, a lack of TF, and the positional effect can simultaneously lead to the induction of specific epigenetic states across each NOR.

3.2. Molecular Mechanisms Leading to Sequence-Dependent Relationships between Cytosine Methylation and rDNA Transcription

Correlations between transcriptional silencing and overall cytosine methylation in rDNA variants from T. porrifolius are consistent with the generally accepted view that elevated cytosine methylation is associated with rDNA silencing [76]. However, correlations between the methylation of a given cytosine and the transcriptional activity of corresponding rDNA variants in T. porrifolius are substantially influenced by the surrounding sequence contexts. The most pronounced correlations were detected for CWGs, consistent with methylation dynamics in the moss Physcomitrium patens, where CHG methylation appeared to be a stronger transcriptional suppressor than CG methylation [77], even though CWGs and CCGs were evaluated together. We assume that the variable methylation dynamics of individual C-motifs in T. porrifolius can be at least partially controlled by the fine-tuning of individual methylation pathways, which are known to be more or less specific to individual sequence contexts (Figure 5) [35,78]. The average methylation of CGs (97%), CWGs (88%), CCGs (35%), and CHHs (7%) in ETS2 from T. porrifolius matched the order found in other plants [79], suggesting that most DNA methylation pathways common in seed plants were conserved in T. porrifolius.
DNA methylation is dynamically controlled by de novo methylation, maintenance methylation, and active demethylation [80]. The de novo DNA methylation in all sequence contexts is mediated by DOMAINS REARRANGED METHYLTRANSFERASE 1/2 (DRM1/2), which is guided to targets via an RNA-directed DNA methylation (RdDM) pathway [37,81]. The increased affinity of DRM2 for CAs and CTs compared to CGs [82] may be related in some way to the more pronounced differences in CWG methylation compared to CG methylation detected between silent and active rDNA variants in T. porrifolius.
The methylation of CGs is maintained by METHYLTRANSFERASE 1 (MET1) [83], which methylates hemimethylated CpG sites during replication so that methylation of CGs is restored during the S-phase [84]. MET1 can also interact with HISTONE DEACETYLASE 6 (HDA6), which is required for MET1-dependent CG methylation in a locus-specific manner and for silencing of rDNA [23,85]. These participants in CG methylation may be regulated in a manner leading to statistically supported correlations between cytosine methylation and rDNA silencing. However, because Met1 activity is rather independent of the heterochromatic repressive mark H3K9me2 [35], absolute differences in CG methylation between active and silent rDNA can be kept low, as observed in T. porrifolius.
In contrast, methylation in CHGs is maintained through a positive feedback loop in which SUPPRESSOR OF VARIEGATION 3–9 HOMOLOGs 4, 5, and 6 (SUVH4/5/6) recognize CHG methylation and dimethylate histone H3, resulting in heterochromatic mark H3K9me2, which is subsequently recognized by CHROMOMETHYLASE 3 (CMT3). This methylates unmethylated CHGs during the late G2 phase [86]. CHG methylations can, therefore, be kept out of rDNA by a histone demethylase, IBM1, which removes methylation from H3K9me2 [87]. Thus, heterochromatic/euchromatic proportion in rDNA from T. porrifolius can be regulated by finely orchestrated regulation of SUVH methylases and IBM1 demethylase followed by promoting CMT3, which may lead to the strongest correlation between the methylation of the CWG motifs and rDNA silencing. Another striking feature of the CWG methylation dynamics described here is substantially more pronounced hypomethylation in seedlings and root tips than leaves, albeit only in transcriptionally active rDNAs. This is consistent with A. thaliana, where global CG methylations were 1% higher in shoots relative to root tips, whereas CHG methylations were 5% higher in shoots relative to root tips [88]. This can be partially explained by a model that assumes that CG (and partially also CCG) methylations are rapidly restored during the S phase by MET1, whereas CWG methylations require H3K9me2 deposition and, therefore, must occur in late G2 [84], resulting in a sharp reduction in methylated CHGs in rapidly dividing cells such as root tips and seedlings, but not young leaves.
The methylation dynamics of the CCGs characterized by (i) substantially lower overall methylation, consistent with whole-genome methylation analyses in A. thaliana [89]; (ii) no correlation between methylation and silencing; and (iii) a higher positional effect indicate that CWG and CCG methylations in rDNA from T. porrifolius are regulated by different mechanisms (a) CMT3 can methylate the outer cytosine in CCGs only when the internal cytosine is methylated by MET1, whereas the methylation of CWGs only requires CMT3 [90]. (b) CMT3 is preferentially recruited to CCGs through minor SUVH5 and SUVH6 [89]. (c) CG and CCG methylations are rapidly restored during the S phase by MET1. In contrast, CWG methylation requires H3K9me2 deposition and must occur in G2 [84]. Thus, the methylation dynamics of rather pseudo symmetrical CCGs appear to be more like AT-rich CHHs than CWGs.
The maintenance of CHH methylation is controlled through two pathways, DRM1/2 driven by RdDM [31] and CMT2, which can form a self-reinforcing loop with SUVH. However, the binding affinity is much lower than that of CMT3 [91], consistent with the negligible correlation between CHH methylation and rDNA silencing in T. porrifolius. The altered specificity of CMT2, preferentially targeting CAAs, CTAs, or CATs [89,92], corresponds well to the order observed in rDNA from T. porrifolius. The highly biased methylation pattern of CHHs, characterized by a small fraction (3%) of relatively highly methylated (>50%) AT-rich CHHs complemented by a relatively large fraction (30%) of poorly methylated (<1%) CHHs, may also be mediated by DRM2 directed to targets by specific ncRNAs. Such a biased methylation pattern, stably maintained in all rDNA variants regardless of transcriptional activity, indicates that the methylation patterns of AT-rich CHHs can also be guided by the surrounding sequences or chromatin structure.

4. Material and Methods

4.1. Plant Material and Drug Treatments

Two lineages of T. porrifolius were used in this work. The por1 lineage was obtained from Soltis and Soltis seed collection, 2611-2, originating from the Pullman region, Washington, the United States [43]. The por2 lineage originated from seed collection at Masaryk University, the Czech Republic (TP-1123-2001). It is necessary to emphasize that its 35S rDNA structural features were highly related to T. porrifolius accessions from Soltis and Soltis collection, 2612, originating from the Potlach region, Idaho, United States [43]. Obtained seeds were planted in a garden and flowering plants were repeatedly self-pollinated. Despite almost identical flower morphology (Figure S1a), por1 plants were significantly taller than por2 plants (Figure S1b), and the por1 lineage produced slightly more seeds on average than the por2 lineage (Figure S1c).
Young leaves (whole centrally situated the youngest leaf weighing 80–120 mg), root tips (fresh 5–10 mm), and entire seedlings (five days old) were used for comparative transcription and methylation analyses. Leaves and root tips were harvested from five- to six-month-old plants (August, September); one por1 (por-34) and two por2 (por2-15 and por2-134) plants were used as material sources. Two samples of seedlings, one for each por1 and por2 lineage, were represented by five siblings that were combined and analyzed simultaneously. Germination conditions can be found in the following paragraph (control water). For FISH, meristematic cells were isolated from primary roots of three-day-old seedlings or roots of four-week-old plants grown in soil.
To induce DNA hypomethylation, por2 seeds (five for each experiment/drug) were treated with 200 µM of 5-azacytidine (AzaC) or 50 µM of 9-(2,3-dihydroxypropyl) adenine (DHPA) in water [93]. Histone acetylation was modified with 10 mM of sodium butyrate (NaBT) in water [44,94]. A mixture of 200 µM of AzaC with 10 mM of NaBT was also checked. The seedlings germinated in the water served as a control. During germination, the seeds were shaken on a horizontal shaker at 70 rpm, room temperature, and lighting conditions of 12 h light and 12 h dark. The solutions were replaced daily. Total DNAs and RNAs were isolated from each four- to five-day-old seedling (three biological replicates).

4.2. DNA and RNA Extractions and cDNA Preparations

Total DNAs were extracted using either the modified cetyltrimethylammonium bromide method [14] or a NucleoSpin Plant II Midi kit (Macherey-Nagel, Düren, Germany). Total RNAs were extracted using either a Tri Reagent (Sigma-Aldrich, St. Louis, MO, USA or RNeasy Plant Mini kit (QIAGEN, Hilden, Germany) and stripped of DNA traces using TURBO DNA-free (Invitrogen, Waltham, MA, USA). The quantity of nucleic acids was checked using a nanophotometer N60 (Implen GmbH, Munich, Germany) or fluorimeter Quantus (PROMEGA, Madison, WI, USA). The quality of nucleic acids was determined by agarose gel electrophoresis. Reverse transcriptions (20 µL), consisting of 1 µg of total RNA, 50 ng of random primers (Generi Biotech, Hradec Kralove, Czech Republic), 10 nmol of each dNTP, and 20 units of ProtoScript II (New England Biolabs, Ipswich, MA, USA), were followed by RNAse A treatments (Sigma-Aldrich, St. Louis, MO, USA).

4.3. PCR, CAPS, and Southern Hybridization

PCR amplification was used to distinguish between rDNA variants providing the PCR products of variable sizes (Figure 1b). In addition, PCR products of identical sizes were distinguished by Cleaved Amplified Polymorphic Sequences (CAPS) (Figure 2c,d). PCR amplification (20 µL) typically consisted of 3 ng of genomic DNA (0.4 µL of cDNA), 8 pmol of each primer (Table S4), 4.8 nmol of each dNTP, and 0.8 units of Taq polymerase (Finnzymes, Espoo, Finland). If necessary, the PCR products were desalted using Qiex II (QIAGEN, Hilden, Germany). The 605 bp ETS2 region (Figure 2c) was amplified by primers ETS2F/ETS2R and cycling consisting of an initial denaturation step at 95 °C/180 s; 30 cycles of 95 °C/20 s, 60 °C/20 s, and 72 °C/40 s; and a final extension of 72 °C/5 min. After digestion with MboI, the DNA fragments were size separated by 2% agarose electrophoresis. Alternatively, PCR products were cloned by QIAGEN PCR Cloning plus Kit (QIAGEN, Hilden, Germany and Sanger-sequenced (Microsynth GmbH, Balgach, Switzerland) to evaluate sequence variability in ETS2 both in the genome and primary transcript. The 88 bp ETS2 region (Figure 2d) was amplified by primers ETS2F88/ETS2R88 and cycling consisting of an initial denaturation step at 95 °C/180 s; 30 cycles of 95 °C/20 s, 64 °C/20 s, and 72 °C/25 s; and a final extension of 72 °C/5 min. PCR products were digested with NlaIII and size-separated by 10% PAGE.
Southern hybridization was used to distinguish S- and L- rDNA variants based on the size variability of IGSs (Figure 1c). Genomic DNAs (1.5 µg) were digested with MboI (10 U; 2 × 4 h), size-separated by agarose electrophoresis, and blotted onto nylon membranes (GE Healthcare). The hybridization was carried out in a modified Church–Gilbert buffer [95]. The hybridization signals were visualized by Typhon FLA 9000 (GE HealthCare, Chicago, IL, USA) and quantitatively analyzed using ImageQuant (GE HealthCare, Chicago, IL, USA). The hybridization probe was represented by a mixture of 102–104 bp long R103 repeats derived from accessions FN666261 and HG915911. For preparation, an equimolar mixture of recombinant plasmids was used as a template for PCR with primes NTSF/ETS2R1 (Table S4) and cycling consisted of an initial denaturation step at 95 °C/180 s; 30 cycles of 95 °C/20 s, 55 °C/20 s, and 72 °C/180 s; and a final 72 °C/5 min extension. PCR products were digested with BstNI, size-separated using 2% agarose electrophoresis, and purified with QiexII (QIAGEN, Hilden, Germany).

4.4. High-Throughput DNA Sequencing

About 5 μg of intact DNAs from each por1 and por2 were subjected to PacBio sequencing at SeqMe (Dobříš, Czech Republic) and GATC Biotech (Konstanz, Germany), respectively. The average lengths of PacBio reads were 5799 bp and 2901 bp for por1 and por2, respectively. The numbers of reads were 52,275 and 579,525 for por1 and por2, respectively. The read quality of each read was estimated from the number of corresponding circular subreads. Using CLC genomic Workbench 20.0 (QIAGEN, Hilden, Germany), 515 and 1042 PacBio reads from por1 and por2, respectively, were mapped to a reference sequence (9097 bp) assembled from available accessions (GenBank) for the Tragopogon 26S rRNA gene (AF036493.1 and KT179725.1 from T. dubius), 18S rRNA gene (KT179662 and U42502 from T. dubius), IGS (HG915911 from T. porrifolius), and ITS1-5.8S_rDNA_gene–ITS2 region (consensus sequence derived from T. porrifolius accessions FN675706, FN675707, FN675708, FN675709, FN675710, and AJ633494). Because most mapped reads contained substantially longer IGS than the original reference sequence, a new, more representative reference sequence (11,265 bp) was constructed from all mapped reads. Remapping all accessible reads to this longer reference yielded 621 and 1150 mapped reads from por1 and por2, respectively. Newly mapped reads were mostly homologous to highly variable repetitive IGS, suggesting the legitimacy of repeated mapping at complex repetitive regions, particularly in rDNA IGS.
For RNA sequencing, 5 µg of DNA-free, high-quality total RNAs was sequenced at SeqMe (Dobříš, Czech Republic) using the Illumina platform. To estimate the proportions of individual rRNA variants in primary transcripts, Illumina reads were mapped by CLC genomic Workbench 20.0 (QIAGEN, Hilden, Germany) to several reference sequences covering variable sites distinguishing individual rDNA variants.
For cytosine methylation analysis, 3–5 μg of high-quality DNAs were bisulfite-treated and Illumina-sequenced at Macrogen, Inc. (Seoul, Republic of Korea). The genome coverage, read quality, and other parameters are listed in Table S5. Using the CLC genomic Workbench 20.0 (QIAGEN, Hilden, Germany), Illumina reads were mapped to several c. 120 nt long reference sequences within ETS2 (regions I–VI; consensus sequence derived from long PacBio reads), which distinguished rDNA variants distinct in specific transcriptional activity. Mapped reads were aligned using the CLC genomic Workbench 20.0 (QIAGEN, Hilden, Germany), and only reads identical to the reference sequence were subjected to methylation analysis using CyMate (Cytosine Methylation Analysis Tool for Everyone; http://www.cymate.org; access from 4 October 2022 to 30 February 2024) (96). To achieve well-supported estimations of the differences between the methylation of individual rDNA variants, we used both basic tools provided by this program: (i) the average methylation level of each respective cytosine and (ii) the proportion of Illumina reads with all demethylated CWGs or CCGs or CAAs or CATs. For highly methylated CGs, this mode was used to estimate the proportions of reads where at least one of the neighboring CGs was demethylated.

4.5. Sequence Analyses

The copy numbers and lengths of tandemly arrayed monomeric units (R103, R156, R7), as well as the overall lengths of repetitive regions in IGSs, were estimated using the Tandem Repeats Finder (97) (https://tandem.bu.edu/trf/trf.html; access from 15 January 2022 to 22 February 2022) and dot plot diagrams constructed by either the YASS genomic similarity search tool (http://bioinfo.unif-lille.fr/yass/; access from 17 January 2022 to 20 February 2022) or dotmatcher (http://www.bioinformatics.nl/cgi-bin/emboss/dotmatcher; access from 25 January 2022 to 26 February 2022).
The ETS2 sequences were aligned either using the MUSCLE alignment software implemented in MEGA7 Molecular Evolutionary Genetics Analysis 10.1.1. (long Sanger or PacBio; Figure 1d) or using BioEdit Sequence Alignment Editor 7.2.5 (12/11/2013) (short Illumina—methylation analyses), and the phylogenetic trees were constructed with the MEGA 7 [96]. The evolutionary history was inferred using a maximum likelihood method based on the Tamura–Nei model (98). The confidence of inferred evolutionary relationships was assessed using bootstrap analysis with 1000 repetitions. The sequence identity between individual promoters was computed from the SNP distributions using the Sequence Identity matrix implemented in BioEdit 7.2.5 (12/11/2013) (Table S1).
Statistical supports of the differences between samples (methylation density between rDNA variants, between tissues, and between individual cytosines) were estimated by both the non-parametric Mann–Whitney U-test (http://vassarstats.net/utest.html; access from 11 March 2022 to 13 February 2024) and parametric Student’s t-test (Microsoft Excel, Microsoft 365). The difference “Ds-a” between methylation medians (means) of silent (lower specific transcriptional activity) rDNA variant and active (higher specific transcriptional activity) rDNA was used for semiquantitative evaluations of absolute differences [%] and directionality in the methylation of each pair of rDNA variants.

4.6. Fluorescence In Situ Hybridization

Chromosome squashes were prepared according to [97], with slight modifications. Enzymatic treatment of roots prior to squashing lasted 90 min. Slides were treated with RNase A (100 µg/mL) in a humidified chamber at 37 °C for 1 h, rinsed in 2 × standard saline citrate (SSC) at room temperature (RT) for 3 × 5 min, treated with pepsin (50 µg/mL) at RT for 5 min, rinsed in 2 × SSC (3 × 5 min), fixed in 3.7% formaldehyde/phosphate-buffered saline (PBS) for 10 min, rinsed in 2 × SSC (3 × 5 min), dehydrated in an ethanol series (75%, 90%, and 100%) for 2 min each, and air-dried. The probes used were 18S rDNA (a cloned gene from a tomato, GenBank # X51576.1) and 5S rDNA (an Artemisia tridentata S4 clone, GenBank # JX101915.1). The 5S probe was labeled with SpectrumGreen dUTP using a Nick Translation Kit (Abbott Molecular, Des Plaines, IL, USA). The 18S probe was labeled with Amersham FluoroLinkTM Cy3-dUTP (GE Healthcare, Chalfont Saint Giles, England) using the Nick Translation Mix from Roche (Basel, Switzerland) according to the manufacturer’s instructions. The hybridization mix (50% formamide, 10% dextran sulfate, 0.2 × SSC, and 75–100 ng of each labeled probe in a 30 µL volume) was heated (10 min/75 °C), cooled on ice (5 min), pipetted onto a slide, and covered with a plastic coverslip. The slide was incubated in a humidified chamber at 75 °C/5 min, 65 °C/2 min, 55 °C/2 min, 45 °C/2 min, and 37 °C for 35 hrs and then washed for 2 × 5 min in 2 × SSC at 42 °C, 2 × 5 min in 0.1 × SSC at 42 °C, 2 × 5 min in 2 × SSC at 42 °C, 5 min in 2 × SSC at RT, and 7 min in 4 × SSC/0.1% Tween 20 at RT, with final brief wash in PBS. The chromosomes were counterstained in Vectashield (Vector Laboratories, Inc., Burlingame, CA, USA) containing 1.5 µg/mL of 4′,6-diamidino-2′-phenylindole (DAPI). Fluorescence images were captured using an Olympus AX 70 fluorescence microscope equipped with a digital camera. Images were analyzed and processed using ISIS software (MetaSystems, Altlussheim, Germany). Chosen chromosomes were cut from the picture in Adobe Photoshop CS6.

4.7. Data Availability

The FASTQ sequencing data generated from this study were submitted to NCBI as twelve biosamples (Table S6) deposited in the BioProject ID PRJNA634996. The FASTA sequencing data generated from Sanger sequencing of ETS2 cDNA were submitted to NCBI under GenBank accessions MW036554–MW036631.

5. Conclusions

Relationships between transcription and cytosine methylation in individual sequence contexts were comprehensively characterized in several genetically highly related 35S rDNA variants, native to two T. porrifolius lineages substantially differing in rDNA copy numbers and the direction of nucleolar dominance. The methylation dynamics of CG, CWG, CCG, and CHH motifs contributed differently to global methylation changes associated with transcriptional silencing/activation, suggesting that they can be differentially involved in the regulation of rDNA transcription in T. porrifolius. The most relevant is CWG methylation as follows from the statistically best-supported correlations between silencing and cytosine methylation in tissues with a high mitotic index, such as root tips and seedlings, but not in young leaves. A self-reinforcing loop between CWG methylation and H3K9 methylation may be responsible for the most prominent epigenetic changes in chromatin structure leading to complete but reversible silencing of rDNA in T. porrifolius. In contrast, highly stable methylations in individual rDNA variants, as well as in individual tissues, were associated with the external cytosine in CCG motifs and some AT-rich CHH motifs, whose methylations were rather position-dependent. The CCG methylation dynamics appeared to be more reminiscent of CAAs (CHHs) than CWGs, as evidenced by the wide variability of methylations between individual CCGs and no correlations between methylation and silencing.

Supplementary Materials

The following supporting information can be downloaded at: https://www.mdpi.com/article/10.3390/ijms25147540/s1.

Author Contributions

R.M.: Conceptualization; Writing—Review and Editing. R.K.: Data Curation; Methodology; Investigation. A.K. (Alena Kuderova): Resources; Methodology; Investigation. K.Ř.: Writing—Original Draft; Validation; Formal Analysis. J.S.: Formal Analysis; Methodology. A.K. (Ales Kovarik): Conceptualization; Writing—Review and Editing; Project Administration. All authors have read and agreed to the published version of the manuscript.

Funding

This work was supported by the Grant Agency of the Czech Republic [grant number 20-28029S].

Institutional Review Board Statement

Not applicable.

Informed Consent Statement

Not applicable.

Data Availability Statement

Data are contained within the article and Supplementary Materials.

Conflicts of Interest

The authors declare that they have no conflicts of interest with the contents of this article.

References

  1. Garcia, S.; Kovarik, A.; Leitch, A.R.; Garnatje, T. Cytogenetic features of rRNA genes across land plants: Analysis of the Plant rDNA database. Plant J. 2017, 89, 1020–1030. [Google Scholar] [CrossRef] [PubMed]
  2. Rosato, M.; Kovarik, A.; Garilleti, R.; Rossello, J.A. Conserved Organisation of 45S rDNA Sites and rDNA Gene Copy Number among Major Clades of Early Land Plants. PLoS ONE 2016, 11, e0162544. [Google Scholar] [CrossRef] [PubMed]
  3. Kobayashi, T. A new role of the rDNA and nucleolus in the nucleus-rDNA instability maintains genome integrity. Bioessays 2008, 30, 267–272. [Google Scholar] [CrossRef] [PubMed]
  4. Kobayashi, T.; Ganley, A.R.D. Recombination regulation by transcription-induced cohesin dissociation in rDNA repeats. Science 2005, 309, 1581–1584. [Google Scholar] [CrossRef] [PubMed]
  5. Sims, J.; Copenhaver, G.P.; Schlogelhofer, P. Meiotic DNA Repair in the Nucleolus Employs a Nonhomologous End-Joining Mechanism. Plant Cell 2019, 31, 2259–2275. [Google Scholar] [CrossRef] [PubMed]
  6. Tsang, E.; Carr, A.M. Replication fork arrest, recombination and the maintenance of ribosomal DNA stability. DNA Repair 2008, 7, 1613–1623. [Google Scholar] [CrossRef]
  7. Long, Q.; Rabanal, F.A.; Meng, D.Z.; Huber, C.D.; Farlow, A.; Platzer, A.; Zhang, Q.R.; Vilhjalmsson, B.J.; Korte, A.; Nizhynska, V.; et al. Massive genomic variation and strong selection in Arabidopsis thaliana lines from Sweden. Nat. Genet. 2013, 45, 884–890. [Google Scholar] [CrossRef] [PubMed]
  8. Waters, E.R.; Schaal, B.A. Heat shock induces a loss of rRNA-encoding DNA repeats in Brassica nigra. Proc. Natl. Acad. Sci. USA 1996, 93, 1449–1452. [Google Scholar] [CrossRef] [PubMed]
  9. Kobayashi, T. Regulation of ribosomal RNA gene copy number and its role in modulating genome integrity and evolutionary adaptability in yeast. Cell. Mol. Life Sci. 2011, 68, 1395–1403. [Google Scholar] [CrossRef]
  10. Paredes, S.; Branco, A.T.; Hartl, D.L.; Maggert, K.A.; Lemos, B. Ribosomal DNA Deletions Modulate Genome-Wide Gene Expression: “rDNA-Sensitive” Genes and Natural Variation. PLoS Genet. 2011, 7, e1001376. [Google Scholar] [CrossRef] [PubMed]
  11. Ganley, A.R.D.; Kobayashi, T. Highly efficient concerted evolution in the ribosomal DNA repeats: Total rDNA repeat variation revealed by whole-genome shotgun sequence data. Genome Res. 2007, 17, 184–191. [Google Scholar] [CrossRef] [PubMed]
  12. Copenhaver, G.P.; Pikaard, C.S. Two-dimensional RFLP analyses reveal megabase-sized clusters of rRNA gene variants in Arabidopsis thaliana, suggesting local spreading of variants as the mode for gene homogenization during concerted evolution. Plant J. 1996, 9, 273–282. [Google Scholar] [CrossRef] [PubMed]
  13. Havlova, K.; Dvorackova, M.; Peiro, R.; Abia, D.; Mozgova, I.; Vansacova, L.; Gutierrez, C.; Fajkus, J. Variation of 45S rDNA intergenic spacers in Arabidopsis thaliana. Plant Mol. Biol. 2016, 92, 457–471. [Google Scholar] [CrossRef] [PubMed]
  14. Matyasek, R.; Kuderova, A.; Kutilkova, E.; Kucera, M.; Kovarik, A. Intragenomic heterogeneity of intergenic ribosomal DNA spacers in Cucurbita moschata is determined by DNA minisatellites with variable potential to form non-canonical DNA conformations. DNA Res. 2019, 26, 273–286. [Google Scholar] [CrossRef] [PubMed]
  15. Galian, J.A.; Rosato, M.; Rossello, J.A. Incomplete sequence homogenization in 45S rDNA multigene families: Intermixed IGS heterogeneity within the single NOR locus of the polyploid species Medicago arborea (Fabaceae). Ann. Bot. 2014, 114, 243–251. [Google Scholar] [CrossRef] [PubMed]
  16. Sims, J.; Sestini, G.; Elgert, C.; von Haeseler, A.; Schlogelhofer, P. Sequencing of the Arabidopsis NOR2 reveals its distinct organization and tissue-specific rRNA ribosomal variants. Nat. Commun. 2021, 12, 387. [Google Scholar] [CrossRef] [PubMed]
  17. Saez-Vasquez, J.; Delseny, M. Ribosome Biogenesis in Plants: From Functional 45S Ribosomal DNA Organization to Ribosome Assembly Factors. Plant Cell 2019, 31, 1945–1967. [Google Scholar] [CrossRef] [PubMed]
  18. Hemleben, V.; Zentgraf, U. Structural organization and regulation of transcription by RNA polymerase I of plant nuclear ribosomal RNA genes. Plant Promot. Transcr. Factors 1994, 20, 3–24. [Google Scholar]
  19. Grummt, I. The nucleolus-guardian of cellular homeostasis and genome integrity. Chromosoma 2013, 122, 487–497. [Google Scholar] [CrossRef] [PubMed]
  20. Tucker, S.; Vitins, A.; Pikaard, C.S. Nucleolar dominance and ribosomal RNA gene silencing. Curr. Opin. Cell Biol. 2010, 22, 351–356. [Google Scholar] [CrossRef]
  21. Xie, W.B.; Ling, T.; Zhou, Y.G.; Feng, W.J.; Zhu, Q.Y.; Stunnenberg, H.G.; Grummt, I.; Tao, W. The chromatin remodeling complex NuRD establishes the poised state of rRNA genes characterized by bivalent histone modifications and altered nucleosome positions. Proc. Natl. Acad. Sci. USA 2012, 109, 8161–8166. [Google Scholar] [CrossRef]
  22. Durut, N.; Abou-Ellail, M.; Pontvianne, F.; Das, S.; Kojima, H.; Ukai, S.; de Bures, A.; Comella, P.; Nidelet, S.; Rialle, S.; et al. A Duplicated Nucleolin Gene with Antagonistic Activity Is Required for Chromatin Organization of Silent 45S rDNA in Arabidopsis. Plant Cell 2014, 26, 1330–1344. [Google Scholar] [CrossRef] [PubMed]
  23. Earley, K.; Lawrence, R.J.; Pontes, O.; Reuther, R.; Enciso, A.J.; Silva, M.; Neves, N.; Gross, M.; Viegas, W.; Pikaard, C.S. Erasure of histone acetylation by Arabidopsis HDA6 mediates large-scale gene silencing in nucleolar dominance. Genes Dev. 2006, 20, 1283–1293. [Google Scholar] [CrossRef] [PubMed]
  24. Pontvianne, F.; Blevins, T.; Chandrasekhara, C.; Feng, W.; Stroud, H.; Jacobsen, S.E.; Michaels, S.D.; Pikaard, C.S. Histone methyltransferases regulating rRNA gene dose and dosage control in Arabidopsis. Genes Dev. 2012, 26, 945–957. [Google Scholar] [CrossRef] [PubMed]
  25. Preuss, S.B.; Costa-Nunes, P.; Tucker, S.; Pontes, O.; Lawrence, R.J.; Mosher, R.; Kasschau, K.D.; Carrington, J.C.; Baulcombe, D.C.; Viegas, W.; et al. Multimegabase Silencing in Nucleolar Dominance Involves siRNA-Directed DNA Methylation and Specific Methylcytosine-Binding Proteins. Mol. Cell 2008, 32, 673–684. [Google Scholar] [CrossRef] [PubMed]
  26. Santoro, R.; Schmitz, K.M.; Sandoval, J.; Grummt, I. Intergenic transcripts originating from a subclass of ribosomal DNA repeats silence ribosomal RNA genes in trans. EMBO Rep. 2010, 11, 52–58. [Google Scholar] [CrossRef] [PubMed]
  27. Pikaard, C.S.; Chandrasekhara, C.; McKinlay, A.; Enganti, R.; Fultz, D. Reaching for the off switch in nucleolar dominance. Plant J. 2023, 115, 1185–1192. [Google Scholar] [CrossRef] [PubMed]
  28. Tseng, H. Cell-type-specific regulation of RNA polymerase I transcription: A new frontier. Bioessays 2006, 28, 719–725. [Google Scholar] [CrossRef]
  29. Shiba, H.; Takayania, S. RNA silencing systems and their relevance to allele-specific DNA methylation in plants. Biosci. Biotechnol. Biochem. 2007, 71, 2632–2646. [Google Scholar] [CrossRef]
  30. Schmitz, R.J.; Lewis, Z.A.; Galli, M.G. DNA Methylation: Shared and Divergent Features across Eukaryotes. Trends Genet. 2019, 35, 818–827. [Google Scholar] [CrossRef] [PubMed]
  31. Law, J.A.; Jacobsen, S.E. Establishing, maintaining and modifying DNA methylation patterns in plants and animals. Nat. Rev. Genet. 2010, 11, 204–220. [Google Scholar] [CrossRef] [PubMed]
  32. Disteche, C.M.; Berletch, J.B. X-chromosome inactivation and escape. J. Genet. 2015, 94, 591–599. [Google Scholar] [CrossRef] [PubMed]
  33. Satyaki, P.R.V.; Gehring, M. DNA methylation and imprinting in plants: Machinery and mechanisms. Crit. Rev. Biochem. Mol. Biol. 2017, 52, 163–175. [Google Scholar] [CrossRef] [PubMed]
  34. Dhayalan, A.; Rajavelu, A.; Rathert, P.; Tamas, R.; Jurkowska, R.Z.; Ragozin, S.; Jeltsch, A. The Dnmt3a PWWP Domain Reads Histone 3 Lysine 36 Trimethylation and Guides DNA Methylation. J. Biol. Chem. 2010, 285, 26114–26120. [Google Scholar] [CrossRef]
  35. Du, J.M.; Johnson, L.M.; Jacobsen, S.E.; Patel, D.J. DNA methylation pathways and their crosstalk with histone methylation. Nat. Rev. Mol. Cell Biol. 2015, 16, 519–532. [Google Scholar] [CrossRef] [PubMed]
  36. Gladyshev, E.; Kleckner, N. DNA sequence homology induces cytosine-to-thymine mutation by a heterochromatin-related pathway in Neurospora. Nat. Genet. 2017, 49, 887–894. [Google Scholar] [CrossRef] [PubMed]
  37. Matzke, M.A.; Mosher, R.A. RNA-directed DNA methylation: An epigenetic pathway of increasing complexity. Nat. Rev. Genet. 2014, 15, 394–408. [Google Scholar] [CrossRef] [PubMed]
  38. Zhu, H.; Wang, G.H.; Qian, J. Transcription factors as readers and effectors of DNA methylation. Nat. Rev. Genet. 2016, 17, 551–565. [Google Scholar] [CrossRef]
  39. Li, Y.; Kumar, S.; Qian, W.Q. Active DNA demethylation: Mechanism and role in plant development. Plant Cell Rep. 2018, 37, 77–85. [Google Scholar] [CrossRef] [PubMed]
  40. Mavrodiev, E.V.; Soltis, P.S.; Gitzendanner, M.A.; Baldini, R.M.; Soltis, D.E. Polyphyly of Tragopogon porrifolius L. (asteraceae), a European native with intercontinental disjuncts. Int. J. Plant Sci. 2007, 168, 889–904. [Google Scholar] [CrossRef]
  41. Ownbey, M.; McCollum, G.D. The chromosomes of Tragopogon. Rhodora 1954, 56, 7–21. [Google Scholar]
  42. Wilson, F.D. Karyotypes of Tragopogon (Compositae, Lactuceae). Brittonia 1983, 35, 341–350. [Google Scholar] [CrossRef]
  43. Pires, J.C.; Lim, K.Y.; Kovarik, A.; Matyasek, R.; Boyd, A.; Leitch, A.R.; Leitch, I.J.; Bennett, M.D.; Soltis, P.S.; Soltis, D.E. Molecular cytogenetic analysis of recently evolved Tragopogon (Asteraceae) allopolyploids reveal a karyotype that is additive of the diploid progenitors. Am. J. Bot. 2004, 91, 1022–1035. [Google Scholar] [CrossRef] [PubMed]
  44. Chen, Z.J.; Pikaard, C.S. Epigenetic silencing of RNA polymerase I transcription: A role for DNA methylation and histone modification in nucleolar dominance. Genes Dev. 1997, 11, 2124–2136. [Google Scholar] [CrossRef] [PubMed]
  45. Gultepe, M.; Coskuncelebi, K.; Makbul, S.; Vladimirov, V. Chromosome counts of Tragopogon L. (Asteraceae) from Turkey. Caryologia 2015, 68, 193–199. [Google Scholar] [CrossRef]
  46. Mavrodiev, E.V.; Tancig, M.; Sherwood, A.M.; Gitzendanner, M.A.; Rocca, J.; Soltis, P.S.; Soltis, D.E. Phylogeny of Tragopogon L. (Asteraceae) based on internal and external transcribed spacer sequence data. Int. J. Plant Sci. 2005, 166, 117–133. [Google Scholar] [CrossRef]
  47. Matyasek, R.; Tate, J.A.; Lim, Y.K.; Srubarova, H.; Koh, J.; Leitch, A.R.; Soltis, D.E.; Soltis, P.S.; Kovarik, A. Concerted evolution of rDNA in recently formed tragopogon allotetraploids is typically associated with an inverse correlation between gene copy number and expression. Genetics 2007, 176, 2509–2519. [Google Scholar] [CrossRef] [PubMed]
  48. Dobesova, E.; Malinska, H.; Matyasek, R.; Leitch, A.R.; Soltis, D.E.; Soltis, P.S.; Kovarik, A. Silenced rRNA genes are activated and substitute for partially eliminated active homeologs in the recently formed allotetraploid, Tragopogon mirus (Asteraceae). Heredity 2015, 114, 356–365. [Google Scholar] [CrossRef] [PubMed]
  49. Subrahmanyam, N.C.; Azad, A.A. Nucleoli and Ribosomal-Rna Cistron Numbers in Hordeum Species and Interspecific Hybrids Exhibiting Suppression of Secondary Constriction. Chromosoma 1978, 69, 265–273. [Google Scholar] [CrossRef]
  50. Maroof, M.A.S.; Allard, R.W.; Zhang, Q.F. Genetic Diversity and Ecogeographical Differentiation among Ribosomal DNA Alleles in Wild and Cultivated Barley. Proc. Natl. Acad. Sci. USA 1990, 87, 8486–8490. [Google Scholar] [CrossRef]
  51. Felle, M.; Exler, J.H.; Merkl, R.; Dachauer, K.; Brehm, A.; Grummt, I.; Langst, G. DNA sequence encoded repression of rRNA gene transcription in chromatin. Nucleic Acids Res. 2010, 38, 5304–5314. [Google Scholar] [CrossRef] [PubMed]
  52. Manelyte, L.; Strohner, R.; Gross, T.; Langst, G. Chromatin Targeting Signals, Nucleosome Positioning Mechanism and Non-Coding RNA-Mediated Regulation of the Chromatin Remodeling Complex NoRC. PLoS Genet. 2014, 10, e1004157. [Google Scholar] [CrossRef] [PubMed]
  53. Putnam, C.D.; Pikaard, C.S. Cooperative Binding of the Xenopus Rna Polymerase-I Transcription Factor Xubf to Repetitive Ribosomal Gene Enhancers. Mol. Cell Biol. 1992, 12, 4970–4980. [Google Scholar] [CrossRef] [PubMed]
  54. Pikaard, C.S. Ribosomal Gene Promoter Domains Can Function as Artificial Enhancers of Rna-Polymerase-I Transcription, Supporting a Promoter Origin for Natural Enhancers in Xenopus. Proc. Natl. Acad. Sci. USA 1994, 91, 464–468. [Google Scholar] [CrossRef] [PubMed]
  55. Caudy, A.A.; Pikaard, C.S. Xenopus ribosomal RNA gene Intergenic Spacer elements conferring transcriptional enhancement and nucleolar dominance-like competition in oocytes. J. Biol. Chem. 2002, 277, 31577–31584. [Google Scholar] [CrossRef] [PubMed]
  56. Reeder, R.H.; Roan, J.G. The Mechanism of Nucleolar Dominance in Xenopus Hybrids. Cell 1984, 38, 39–44. [Google Scholar] [CrossRef] [PubMed]
  57. Zentgraf, U.; Hemleben, V. Complex-Formation of Nuclear Proteins with the Rna Polymerase-I Promoter and Repeated Elements in the External Transcribed Spacer of Cucumis-Sativus Ribosomal DNA. Nucleic Acids Res. 1992, 20, 3685–3691. [Google Scholar] [CrossRef] [PubMed]
  58. Komarova, N.Y.; Grimm, G.W.; Hemleben, V.; Volkov, R.A. Molecular evolution of 35S rDNA and taxonomic status of Lycopersicon within Solanum sect. Petota. Plant Syst. Evol. 2008, 276, 59–71. [Google Scholar] [CrossRef]
  59. Martini, G.; Odell, M.; Flavell, R.B. Partial Inactivation of Wheat Nucleolus Organizers by the Nucleolus Organizer Chromosomes from Aegilops-Umbellulata. Chromosoma 1982, 84, 687–700. [Google Scholar] [CrossRef]
  60. Silva, M.; Pereira, H.S.; Bento, M.; Santos, A.P.; Shaw, P.; Delgado, M.; Neves, N.; Viegas, W. Interplay of Ribosomal DNA Loci in Nucleolar Dominance: Dominant NORs are Up-Regulated by Chromatin Dynamics in the Wheat-Rye System. PLoS ONE 2008, 3, e3824. [Google Scholar] [CrossRef] [PubMed]
  61. Matyasek, R.; Dobesova, E.; Huska, D.; Jezkova, I.; Soltis, P.S.; Soltis, D.E.; Kovarik, A. Interpopulation hybridization generates meiotically stable rDNA epigenetic variants in allotetraploid Tragopogon mirus. Plant J. 2016, 85, 362–377. [Google Scholar] [CrossRef] [PubMed]
  62. Komarova, N.Y.; Grabe, T.; Huigen, D.J.; Hemleben, V.; Volkov, R.A. Organization, differential expression and methylation of rDNA in artificial Solanum allopolyploids. Plant Mol. Biol. 2004, 56, 439–463. [Google Scholar] [CrossRef] [PubMed]
  63. Chen, Z.J.; Pikaard, C.S. Transcriptional analysis of nucleolar dominance in polyploid plants: Biased expression/silencing of progenitor rRNA genes is developmentally regulated in Brassica. Proc. Natl. Acad. Sci. USA 1997, 94, 3442–3447. [Google Scholar] [CrossRef] [PubMed]
  64. Wanzenbock, E.M.; Schofer, C.; Schweizer, D.; Bachmair, A. Ribosomal transcription units integrated via T-DNA transformation associate with the nucleolus and do not require upstream repeat sequences for activity in Arabidopsis thaliana. Plant J. 1997, 11, 1007–1016. [Google Scholar] [CrossRef] [PubMed]
  65. Lopez, F.B.; Fort, A.; Tadini, L.; Probst, A.V.; McHale, M.; Friel, J.; Ryder, P.; Pontvianne, F.; Pesaresi, P.; Sulpice, R.; et al. Gene dosage compensation of rRNA transcript levels in Arabidopsis thaliana lines with reduced ribosomal gene copy number. Plant Cell 2021, 33, 1135–1150. [Google Scholar] [CrossRef] [PubMed]
  66. Matzke, M.; Kanno, T.; Claxinger, L.; Huettel, B.; Matzke, A.J.M. RNA-mediated chromatin-based silencing in plants. Curr. Opin. Cell Biol. 2009, 21, 367–376. [Google Scholar] [CrossRef] [PubMed]
  67. Abou-Ellail, M.; Cooke, R.; Saez-Vasquez, J. Variations on a team Major and minor variants of Arabidopsis thaliana rDNA genes. Nucleus 2011, 2, 294–299. [Google Scholar] [CrossRef] [PubMed]
  68. Earley, K.W.; Pontvianne, F.; Wierzbicki, A.T.; Blevins, T.; Tucker, S.; Costa-Nunes, P.; Pontes, O.; Pikaard, C.S. Mechanisms of HDA6-mediated rRNA gene silencing: Suppression of intergenic Pol II transcription and differential effects on maintenance versus siRNA-directed cytosine methylation. Genes Dev. 2010, 24, 1119–1132. [Google Scholar] [CrossRef] [PubMed]
  69. Vydzhak, O.; Luke, B.; Schindler, N. Non-coding RNAs at the Eukaryotic rDNA Locus: RNA-DNA Hybrids and Beyond. J. Mol. Biol. 2020, 432, 4287–4304. [Google Scholar] [CrossRef] [PubMed]
  70. Fujisawa, M.; Yamagata, H.; Kamiya, K.; Nakamura, M.; Saji, S.; Kanamori, H.; Wu, J.Z.; Matsumoto, T.; Sasaki, T. Sequence comparison of distal and proximal ribosomal DNA arrays in rice (Oryza sativa L.) chromosome 9S and analysis of their flanking regions. Theor. Appl. Genet. 2006, 113, 419–428. [Google Scholar] [CrossRef] [PubMed]
  71. Chester, M.; Sykorova, E.; Fajkus, J.; Leitch, A.R. Single Integration and Spread of a Copia-Like Sequence Nested in rDNA Intergenic Spacers of Allium cernuum (Alliaceae). Cytogenet. Genome Res. 2010, 129, 35–46. [Google Scholar] [CrossRef] [PubMed]
  72. Wang, W.C.; Zhang, X.Z.; Garcia, S.; Leitch, A.R.; Kovarik, A. Intragenomic rDNA variation-the product of concerted evolution, mutation, or something in between? Heredity 2023, 131, 179–188. [Google Scholar] [CrossRef] [PubMed]
  73. Kovarik, A.; Dadejova, M.; Lim, Y.K.; Chase, M.W.; Clarkson, J.J.; Knapp, S.; Leitch, A.R. Evolution of rDNA in allopolyploids: A potential link between rDNA homogenization and epigenetics. Ann. Bot. 2008, 101, 815–823. [Google Scholar] [CrossRef] [PubMed]
  74. Liu, Z.W.; Liu, J.; Liu, F.Q.; Zhong, X.H. Depositing centromere repeats induces heritable intragenic heterochromatin establishment and spreading in Arabidopsis. Nucleic Acids Res. 2023, 51, 6039–6054. [Google Scholar] [CrossRef]
  75. Fultz, D.; Mckinlay, A.; Enganti, R.; Pikaard, C.S. Sequence and epigenetic landscapes of active and silent nucleolus organizer regions in. Sci. Adv. 2023, 9, eadj4509. [Google Scholar] [CrossRef] [PubMed]
  76. Guo, X.; Han, F.P. Asymmetric Epigenetic Modification and Elimination of rDNA Sequences by Polyploidization in Wheat. Plant Cell 2014, 26, 4311–4327. [Google Scholar] [CrossRef] [PubMed]
  77. Domb, K.; Katz, A.; Harris, K.D.; Yaari, R.; Kaisler, E.; Nguyen, V.H.; Hong, U.V.T.; Griess, O.; Heskiau, K.G.; Ohad, N.; et al. DNA methylation mutants in Physcomitrella patens elucidate individual roles of CG and non-CG methylation in genome regulation. Proc. Natl. Acad. Sci. USA 2020, 117, 33700–33710. [Google Scholar] [CrossRef] [PubMed]
  78. Zabet, N.R.; Catoni, M.; Prischi, F.; Paszkowski, J. Cytosine methylation at CpCpG sites triggers accumulation of non-CpG methylation in gene bodies. Nucleic Acids Res. 2017, 45, 3777–3784. [Google Scholar] [CrossRef] [PubMed]
  79. Bewick, A.J.; Ji, L.X.; Niederhuth, C.E.; Willing, E.M.; Hofmeister, B.T.; Shi, X.L.; Wang, L.; Lu, Z.F.; Rohr, N.A.; Hartwig, B.; et al. On the origin and evolutionary consequences of gene body DNA methylation. Proc. Natl. Acad. Sci. USA 2016, 113, 9111–9116. [Google Scholar] [CrossRef] [PubMed]
  80. Lei, M.G.; Zhang, H.M.; Julian, R.; Tang, K.; Xie, S.J.; Zhu, J.K. Regulatory link between DNA methylation and active demethylation in. Proc. Natl. Acad. Sci. USA 2015, 112, 3553–3557. [Google Scholar] [CrossRef]
  81. Cao, X.F.; Jacobsen, S.E. Role of the arabidopsis DRM methyltransferases in de novo DNA methylation and gene silencing. Curr. Biol. 2002, 12, 1138–1144. [Google Scholar] [CrossRef] [PubMed]
  82. Zhong, X.H.; Du, J.M.; Hale, C.J.; Gallego-Bartolome, J.; Feng, S.H.; Vashisht, A.A.; Chory, J.; Wohlschlegel, J.A.; Patel, D.J.; Jacobsen, S.E. Molecular Mechanism of Action of Plant DRM De Novo DNA Methyltransferases. Cell 2014, 157, 1050–1060. [Google Scholar] [CrossRef] [PubMed]
  83. Saze, H.; Scheid, O.M.; Paszkowski, J. Maintenance of CpG methylation is essential for epigenetic inheritance during plant gametogenesis. Nat. Genet. 2003, 34, 65–69. [Google Scholar] [CrossRef] [PubMed]
  84. Borges, F.; Donoghue, M.T.A.; LeBlanc, C.; Wear, E.E.; Tanurdzic, M.; Berube, B.; Brooks, A.; Thompson, W.F.; Hanley-Bowdoin, L.; Martienssen, R.A. Loss of Small-RNA-Directed DNA Methylation in the Plant Cell Cycle Promotes Germline Reprogramming and Somaclonal Variation. Curr. Biol. 2021, 31, 591–600.e4. [Google Scholar] [CrossRef] [PubMed]
  85. Liu, X.C.; Yu, C.W.; Duan, J.; Luo, M.; Wang, K.C.; Tian, G.; Cui, Y.H.; Wu, K.Q. HDA6 Directly Interacts with DNA Methyltransferase MET1 and Maintains Transposable Element Silencing in Arabidopsis. Plant Physiol. 2012, 158, 119–129. [Google Scholar] [CrossRef] [PubMed]
  86. Du, J.M.; Zhong, X.H.; Bernatavichute, Y.V.; Stroud, H.; Feng, S.H.; Caro, E.; Vashisht, A.A.; Terragni, J.; Chin, H.G.; Tu, A.; et al. Dual Binding of Chromomethylase Domains to H3K9me2-Containing Nucleosomes Directs DNA Methylation in Plants. Cell 2012, 151, 167–180. [Google Scholar] [CrossRef]
  87. Inagaki, S.; Miura-Kamio, A.; Nakamura, Y.; Lu, F.L.; Cui, X.; Cao, X.F.; Kimura, H.; Saze, H.; Kakutani, T. Autocatalytic differentiation of epigenetic modifications within the Arabidopsis genome. EMBO J. 2010, 29, 3496–3506. [Google Scholar] [CrossRef] [PubMed]
  88. Widman, N.; Feng, S.; Jacobsen, S.E.; Pellegrini, M. Epigenetic differences between shoots and roots in Arabidopsis reveals tissue-specific regulation. Epigenetics 2014, 9, 236–242. [Google Scholar] [CrossRef] [PubMed]
  89. Gouil, Q.; Baulcombe, D.C. DNA Methylation Signatures of the Plant Chromomethyltransferases. PLoS Genet. 2016, 12, e1006526. [Google Scholar] [CrossRef] [PubMed]
  90. Yaari, R.; Noy-Malka, C.; Wiedemann, G.; Gershovitz, N.A.; Reski, R.; Katz, A.; Ohad, N. DNA Methyltransferase 1 is involved in (m)CG and (m)CCG DNA methylation and is essential for sporophyte development in Physcomitrella patens. Plant. Mol. Biol. 2015, 88, 387–400. [Google Scholar] [CrossRef] [PubMed]
  91. Stroud, H.; Do, T.; Du, J.M.; Zhong, X.H.; Feng, S.H.; Johnson, L.; Patel, D.J.; Jacobsen, S.E. Non-CG methylation patterns shape the epigenetic landscape in. Nat. Struct. Mol. Biol. 2014, 21, 64–72. [Google Scholar] [CrossRef] [PubMed]
  92. Li, Q.; Eichten, S.R.; Hermanson, P.J.; Zaunbrecher, V.M.; Song, J.W.; Wendt, J.; Rosenbaum, H.; Madzima, T.F.; Sloan, A.E.; Huang, J.; et al. Genetic Perturbation of the Maize Methylome. Plant Cell 2014, 26, 4602–4616. [Google Scholar] [CrossRef] [PubMed]
  93. Kovarik, A.; Van Houdt, H.; Holy, A.; Depicker, A. Drug-induced hypomethylation of a posttranscriptionally silenced transgene locus of tobacco leads to partial release of silencing. FEBS Lett. 2000, 467, 47–51. [Google Scholar] [CrossRef] [PubMed]
  94. Xu, Y.; Miao, Y.X.; Cai, B.T.; Yi, Q.P.; Tian, X.J.; Wang, Q.H.; Ma, D.; Luo, Q.; Tan, F.; Hu, Y.F. A histone deacetylase inhibitor enhances rice immunity by derepressing the expression of defense-related genes. Front. Plant Sci. 2022, 13, 1041095. [Google Scholar] [CrossRef]
  95. Matyasek, R.; Fulnecek, J.; Leitch, A.R.; Kovarik, A. Analysis of two abundant, highly related satellites in the allotetraploid Nicotiana arentsii using double-strand conformation polymorphism analysis and sequencing. New Phytol. 2011, 192, 747–759. [Google Scholar] [CrossRef] [PubMed]
  96. Kumar, S.; Stecher, G.; Tamura, K. MEGA7: Molecular Evolutionary Genetics Analysis Version 7.0 for Bigger Datasets. Mol. Biol. Evol. 2016, 33, 1870–1874. [Google Scholar] [CrossRef] [PubMed]
  97. Jenkins, G.; Hasterok, R. BAC ‘landing’ on chromosomes of Brachypodium distachyon for comparative genome alignment. Nat. Protoc. 2007, 2, 88–98. [Google Scholar] [CrossRef] [PubMed]
Figure 1. Structural differences between rDNA variants in T. porrifolius. (a) The common structure of the plant 35S rDNA repeat unit and the arrangements of seven PolI promoter–like elements (P) and various tandem repeats (R) in the two most prominent S- and L-rDNA variants in T. porrifolius. Fine variants of R103 repeats are distinguished by the letters a–s. Seven abundant SNPs found within 5′ETS2 are numbered 1–7. Four (1, 3, 5, and 6) are specific for S-rDNA, one (7) is specific for L-rDNA, and two (2 and 4) distinguish L- and S-rDNA variants. Locations and expected sizes of PCR products and Mbol-digested fragments are highlighted. (b) PCR products using primers NTSF and ETS2R1 (Table S4). (c) Southern hybridizations of the R103 probe to MboI-restricted genomic DNAs. Because MboI targets are absent from each R103 and P repeat but present in each ETS1, ETS2, and R156 region, complete P1–P3 and P4–P7 regions are released as long blocks of sizes specific for S- and L-rDNA variants. The structural uniformity of IGSs within the por1 lineage was documented by two prominent hybridization signals detected in each individual, whereas four signals were characteristic for each por2 plant. (d) Based on seven SNPs within ETS2 (panel a), the maximum likelihood method and the Tamura–Nei model revealed three statistically well-supported rDNA branches (S1-5, La, and Ls), which correlate with the occurrence of targets for NlaIII and MboI. (e) The proportions of individual nucleotides participating in seven abundant SNVs within ETS2 from por1 (columns S1) and por2 (columns S2 and L). The assignments to selected rDNA variants are shown above the columns. (f) The overall proportions of individual rDNA variants in por1 and por2 genomes were estimated from (panel f).
Ijms 25 07540 g001
Figure 2. Transcription of individual rDNA variants in por1 and por2. (a,b) CAPS analyses of indicated restriction targets which distinguished either L-rDNA from S-rDNA (a) or La-rDNA from both Ls- and S-rDNAs (b) in genomes (columns D) and primary transcripts (R). DNAs were separated either in 1.5% agarose (a) or in 10% polyacrylamide (b) gels. Asterisks indicate lanes with undigested PCR products as control. Arrowheads indicate the hypothetical DNA-NlaIII adduct. Bar charts show the proportions of diagnostic targets in genomes (columns DS and DL) and primary transcripts (R) detected by sequencing. (c) The number of Illumina reads derived from transcriptome and mapped to individual rDNA regions related to the total number of reads in both leaves and root tips. The percentage of the L-rDNA is shown above each relevant column. (d) The transcriptional efficiencies (specific transcription) of individual S-rDNA variants in por1 are demonstrated as the ratio between the proportions of a given variant in the primary transcript (cDNA) and genome (gDNA) (Table S8). Statistically significantly supported (p2< 0.01) differences between variants are highlighted by identical capital letters; moderately (0.01 < p2 < 0.05) supported differences are highlighted by identical small letters. One asterisk indicates statistically unsupported (p2 > 0.05) differences between proportions of a given rDNA variant in genomes and transcriptomes; three asterisks indicate significant (p2 < 0.01) differences between proportions of a given rDNA variant in genomes and transcriptomes. (e) Proportions of abundant rDNA variants in genomes (DNA) and transcriptomes (RNA) from por1 and por2 (pie charts) indicate differing transcriptional efficiency (arrow lengths) of individual rDNA variants, differentiated by seven polymorphic sites in ETS2. (f) Relative contents of ETS2 and 18S rRNA transcripts in leaves (l), root tips (r), and seedlings (s). Mapped ETS2 transcripts were related either to mature 18S rRNAs or total RNAs. In addition, mature 18S rRNAs were related to total RNAs (Table S7). Box plots represent the minimum, 1st quartile, median, 3rd quartile, maximum, and mean (+). One, two, and three asterisks indicate statistically unsupported (p2 > 0.05), moderately supported (0.01 < p2 < 0.05), and significantly supported (p2 < 0.01) differences, respectively.
Ijms 25 07540 g002
Figure 3. Secondary constrictions in por1 can be assigned to A-NORs, whereas secondary constrictions in por2 are associated with D-NORs. FISH of 18S rDNA (red) and 5S rDNA (green) to prophases (a,c), metaphases (b,d), and interphases (e,f) in por1 (a,b,e) and por2 (c,d,f). Presumptive chromosomal localizations of individual rDNA variants are depicted on excised and enlarged chromosomes A and D on the right side of each panel (ad). In por1, the decondensed 35S rDNA region on each chromosome A is split by two condensed foci (asterisk) into three decondensed subregions, which may correspond to three transcribed S1–3-rDNA variants. The decondensed 35S rDNA region on each chromosome D is uninterrupted and perhaps corresponds to a single abundant transcribed La-rDNA variant detected in por2. 35S and 5S signals were assigned to individual chromosomes according to the Ownbey and McCollumns nomenclature [41,43]. Chromosomes were counterstained with DAPI (blue). Representatives were selected from 34 analyzed metaphases (prophases) for each por1 and por2. The relative sizes of 35S rDNA signals associated with A- and D-NORs were averaged from seven metaphases and presented as pie charts for both por1 (g) and por2 (h) lineages. For comparison, the proportions of S- and L-rDNA variants are shown in the same way.
Ijms 25 07540 g003
Figure 4. Methylation dynamics of individual C-motifs within L- and S-rDNAs. (a) Two g>t (c>a) substitutions distinguished bisulfite-modified L- and S-rDNAs within ETS2 (regions I–IV). (b) Methylation ranges of indicated C-motifs for a given tissue were compared between (i) silent S-rDNA from por2 and all active S-rDNA from por1 and L-rDNA from por2, (ii) L-rDNA from por2 and S-rDNA from por1, (iii) S-rDNA and L-rDNA from por2, and (iv) S-rDNA from por2 and por1. In addition, selected pairwise comparisons between leaves and root tips were performed for a given rDNA variant (gray). All comparisons were evaluated in Table S3, sheet 4A. Box plots are constructed using the minimum, 1st quartile, median, 3rd quartile, maximum, and mean (+). One, and three asterisks indicate statistically unsupported (p2 > 0.05), and significantly supported (p2 < 0.01) differences, respectively, between compared samples. One, two, and three crosses indicate |Ds-a| < 5%, 5% < |Ds-a| < 10% and 10% < |Ds-a|, respectively (Materials and Methods). Differences between rDNA variants are highlighted in black, whereas differences between tissues are gray. Complementary analyses showing the proportions of hypomethylated Illumina reads and the differences between La and (S + Ls) rDNA variants are shown in Figure S5.
Ijms 25 07540 g004
Figure 5. Proposed mechanisms participating in the regulation of ND in T. porrifolius. (1) Transcriptionally active D-NORs in por2 mediate the silencing of A-NORs through some in trans acting factors. (2) Some limited TFs are exhausted from A-NORs due to their elevated affinity to D-NORs. Higher rDNA transcription in root tips can be due to a higher content of TF. The action of in trans acting factors and lack of TF can induce locus-specific chromatin condensation and transcriptional silencing. Deleting a large part of both D-NORs can lead to the extinction of in trans acting factors and the availability of all TFs, followed by chromatin decondensation and transcriptional activation of A-NORs in por1. Condensed and decondensed chromatin can differ in DNA methylation, mainly in CWGs (red bars) and, to a lower extent, in CGs (blue). In contrast, methylation of CCG (yellow) and CHH (green) motifs are invariable. Because the proportions of both chromatin conformations can significantly differ between NORs as well as between tissues, overall methylation patterns in individual rDNA variants and tissues depend on these proportions. Clustering, rather than intermingling, and relative spatial position along NORs may affect the specific transcriptional activity of individual rDNA variants within A-NOR (S1–5) and D-NOR (La and Ls). Only one NOR is shown for each A- and D-pair, and the length of constriction is proportional to the transcriptional activity.
Ijms 25 07540 g005
Disclaimer/Publisher’s Note: The statements, opinions and data contained in all publications are solely those of the individual author(s) and contributor(s) and not of MDPI and/or the editor(s). MDPI and/or the editor(s) disclaim responsibility for any injury to people or property resulting from any ideas, methods, instructions or products referred to in the content.

