Abstract
Tulipa L. is a genus of significant economic, environmental, and cultural importance in several parts of the world. The exact number of species in the genus remains uncertain due to inherent taxonomic challenges. We utilized next-generation sequencing technology to sequence and assemble the plastid genomes of seven Tulipa species collected in Kazakhstan and conducted a comparative analysis. The total number of annotated genes was 136 in all seven studied Tulipa species, 114 of which were unique, including 80 protein-coding, 30 tRNA, and 4 rRNA genes. Nine regions (petD, ndhH, ycf2-ycf3, ndhA, rpl16, clpP, ndhD-ndhF, rpoC2, and ycf1) demonstrated significant nucleotide variability, suggesting their potential as molecular markers. A total of 1388 SSRs were identified in the seven Tulipa plastomes, with mononucleotide repeats being the most abundant (60.09%), followed by dinucleotide (34.44%), tetranucleotide (3.90%), trinucleotide (1.08%), pentanucleotide (0.22%), and hexanucleotide (0.29%). The Ka/Ks values of the protein-coding genes ranged from 0 to 3.9286, with the majority showing values <1. Phylogenetic analysis based on a complete plastid genome and protein-coding gene sequences divided the species into three major clades corresponding to their subgenera. The results obtained in this study may contribute to understanding the phylogenetic relationships and molecular taxonomy of Tulipa species.
1. Introduction
Tulipa L. belongs to the Liliaceae Juss. family, and it is a genus with high economic, environmental, and cultural value in many regions of the world [1,2]. The Tulipa species are widely distributed in the Middle East, Southern Europe, North Africa, and Central Asia territories [3]. The Tien Shan and Pamir-Alay mountains are the key centers for the diversity of Tulipa species in Central Asia [3,4,5]. According to different studies in the literature, the number of species in the genus Tulipa varies from 40 to 150 [6,7,8,9,10]. In Kazakhstan, the genus is represented by 42 species and demonstrates adaptability to a wide range of ecological conditions across the country [2]. This adaptability allows Tulipa species to thrive in diverse ecosystems, including Kazakhstan’s steppe, meadow, desert, and forest regions [2]. The clarity regarding the number of species and the taxonomy of the genus remains elusive due to a high level of morphological variation in Tulipa plants, ongoing discoveries of new species, and the presence of synonyms [9,11]. In addition to the high level of variation between species, a high intra-population genetic diversity level is often reported for a number of studied Tulipa species [12]. These studies have typically been conducted using various polymorphic types of DNA markers [13,14,15,16,17,18,19,20,21,22]. Specifically, molecular markers such as random amplified polymorphic DNA (RAPD) [13], inter-simple sequence repeats (ISSRs) [14,15,16], amplified fragment length polymorphisms (AFLPs) [17,18,19], conserved DNA-derived polymorphisms (CDDPs) [20], simple sequence repeats (SSRs) [12], and single-nucleotide polymorphisms (SNPs) [21,22] have been extensively employed to assess the genetic diversity of Tulipa species populations. In Kazakhstan, representatives of Tulipa also have been studied using botanical methods [23,24]. Quantitative indicators of teratological variability in 26 wild Tulipa species from Kazakhstan, both in nature and in cultivation, were analyzed. These indicators can provide valuable insights for future breeding studies [25]. The analysis of the ontogenetic structure of cenopopulations, as well as the morphological and anatomical structure of T. ostrowskiana Regel in the Ili Alatau mountains, revealed the influence of the insolation regime of slopes on the age structure and morphometric parameters [26].
Tulipa species have been classified using nuclear genome sizes [1,8] and a phylogenetic study of five plastid regions and the ITS region [9]. This classification divides the species into four subgenera, Clusianae (Baker) Zonn. and Veldkamp, Orithyia (D. Don) Baker, Eriostemones (Boiss.) Raamsd., and Tulipa, and twelve sections [8]. In Kazakhstan, Tulipa species belong to three of the four subgenera mentioned earlier: Orithyia, Eriostemones, and Tulipa. Further, a series of molecular phylogenetic investigations on Tulipa species utilizing Sanger sequencing technology have been conducted [27,28,29,30]. Kuhara and coauthors [27] carried out phylogenetic analysis of wild and garden Tulipa samples using the coding regions trnL and matK and the intergenic spacer region trnT-L of the plastid genome. Turktas et al. [28] and Hajdari et al. [30] conducted phylogenetic studies using plastid trnL-trnF and nuclear ribosomal ITS regions to examine the phylogenetic relationships of Tulipa species in Turkey and Kosovo, respectively. In a study by Ma et al. [29], DNA barcoding markers (matK, psbA-trnH, and rbcL) were used for species identification of the medicinal plant T. edulis. matK was optimal for the identification of T. edulis and its adulterants in contrast to rbcL and psbA-trnH [29]. Recently, an investigation into the phylogenetic relationships within the genus Tulipa was conducted using DNA sequences from the ITS region [31]. The authors [31] proposed a taxonomic concept consisting of four subgenera (Tulipa, Eriostemones, Orithyia, and Clusianae) and two sections. However, despite these recent attempts to establish a cohesive classification for the genus Tulipa, inherent taxonomic challenges persist, suggesting additional studies, including those based on plastid genomes.
The chloroplast, a cellular organelle responsible for photosynthesis, possesses its own genome and is uniparentally inherited in most angiosperms [32]. The structure of the angiosperm plastid genome is typically circular and consists of two inverted repeats (IRs) flanked by a large single-copy (LSC) region and a small single-copy (SSC) region [33,34]. Plastid genome sequences have proven to be efficient tools for assessing phylogenetic relationships [35,36,37], species identification [29], and the identification of polymorphic regions crucial for the development of novel DNA barcode markers [38,39].
The general characterization of the plastid genomes of T. altaica [40], T. buhseana [41], T. iliensis [42], T. patens [43], T. gesneriana [44], and T. sinkiangensis [45] have been published and the sequences are available at the National Center for Biotechnology Information (NCBI) database. A comparative analysis of five Tulipa plastid genomes was conducted by Li and coauthors [46]. The authors [46] reported that six noncoding regions (rps16-trnQ, trnE-trnT, accD-psaI, rpl32-trnL, rps15-ycf1, and rps4-trnT) and two coding regions (trnT and ycf1) were highly variable in the studied Tulipa plastid genomes. A comparative analysis of the plastid genome in Tulipa species growing in Kazakhstan has not been reported in the existing scientific literature. Hence, evaluating genetic variations in the sequences of plastid genomes of the Tulipa species from Kazakhstan may provide a wealth of information for the genetic analyses of the genus, including studies related to taxonomic assessments.
The purpose of this study was to analyze the plastid genome sequences of seven Tulipa species belonging to the section Kolpakowskianae Raamsd. ex Zonn and Veldk. [1], including T. behmiana Regel, T. brachystemon Regel, T. kolpakowskiana Baker, T. lemmersii Zonn., A. Peterse and J. de Groot, T. ostrowskiana Regel, T. tetraphylla Baker, and T. zenaidae Vved., collected in Kazakhstan. Almost all studied species are endemic to the territory of Kazakhstan, except for T. kolpakowskiana, which is endemic to northern Tien Shan [47], and T. tetraphylla, which is native to Central Asia and northwest Xinjiang [48]. The species T. brachystemon, T. kolpakowskiana, T. ostrowskiana, and T. zenaidae are listed in the Red Book of Kazakhstan [47].
2. Results
2.1. Features of the Seven Tulipa Plastomes
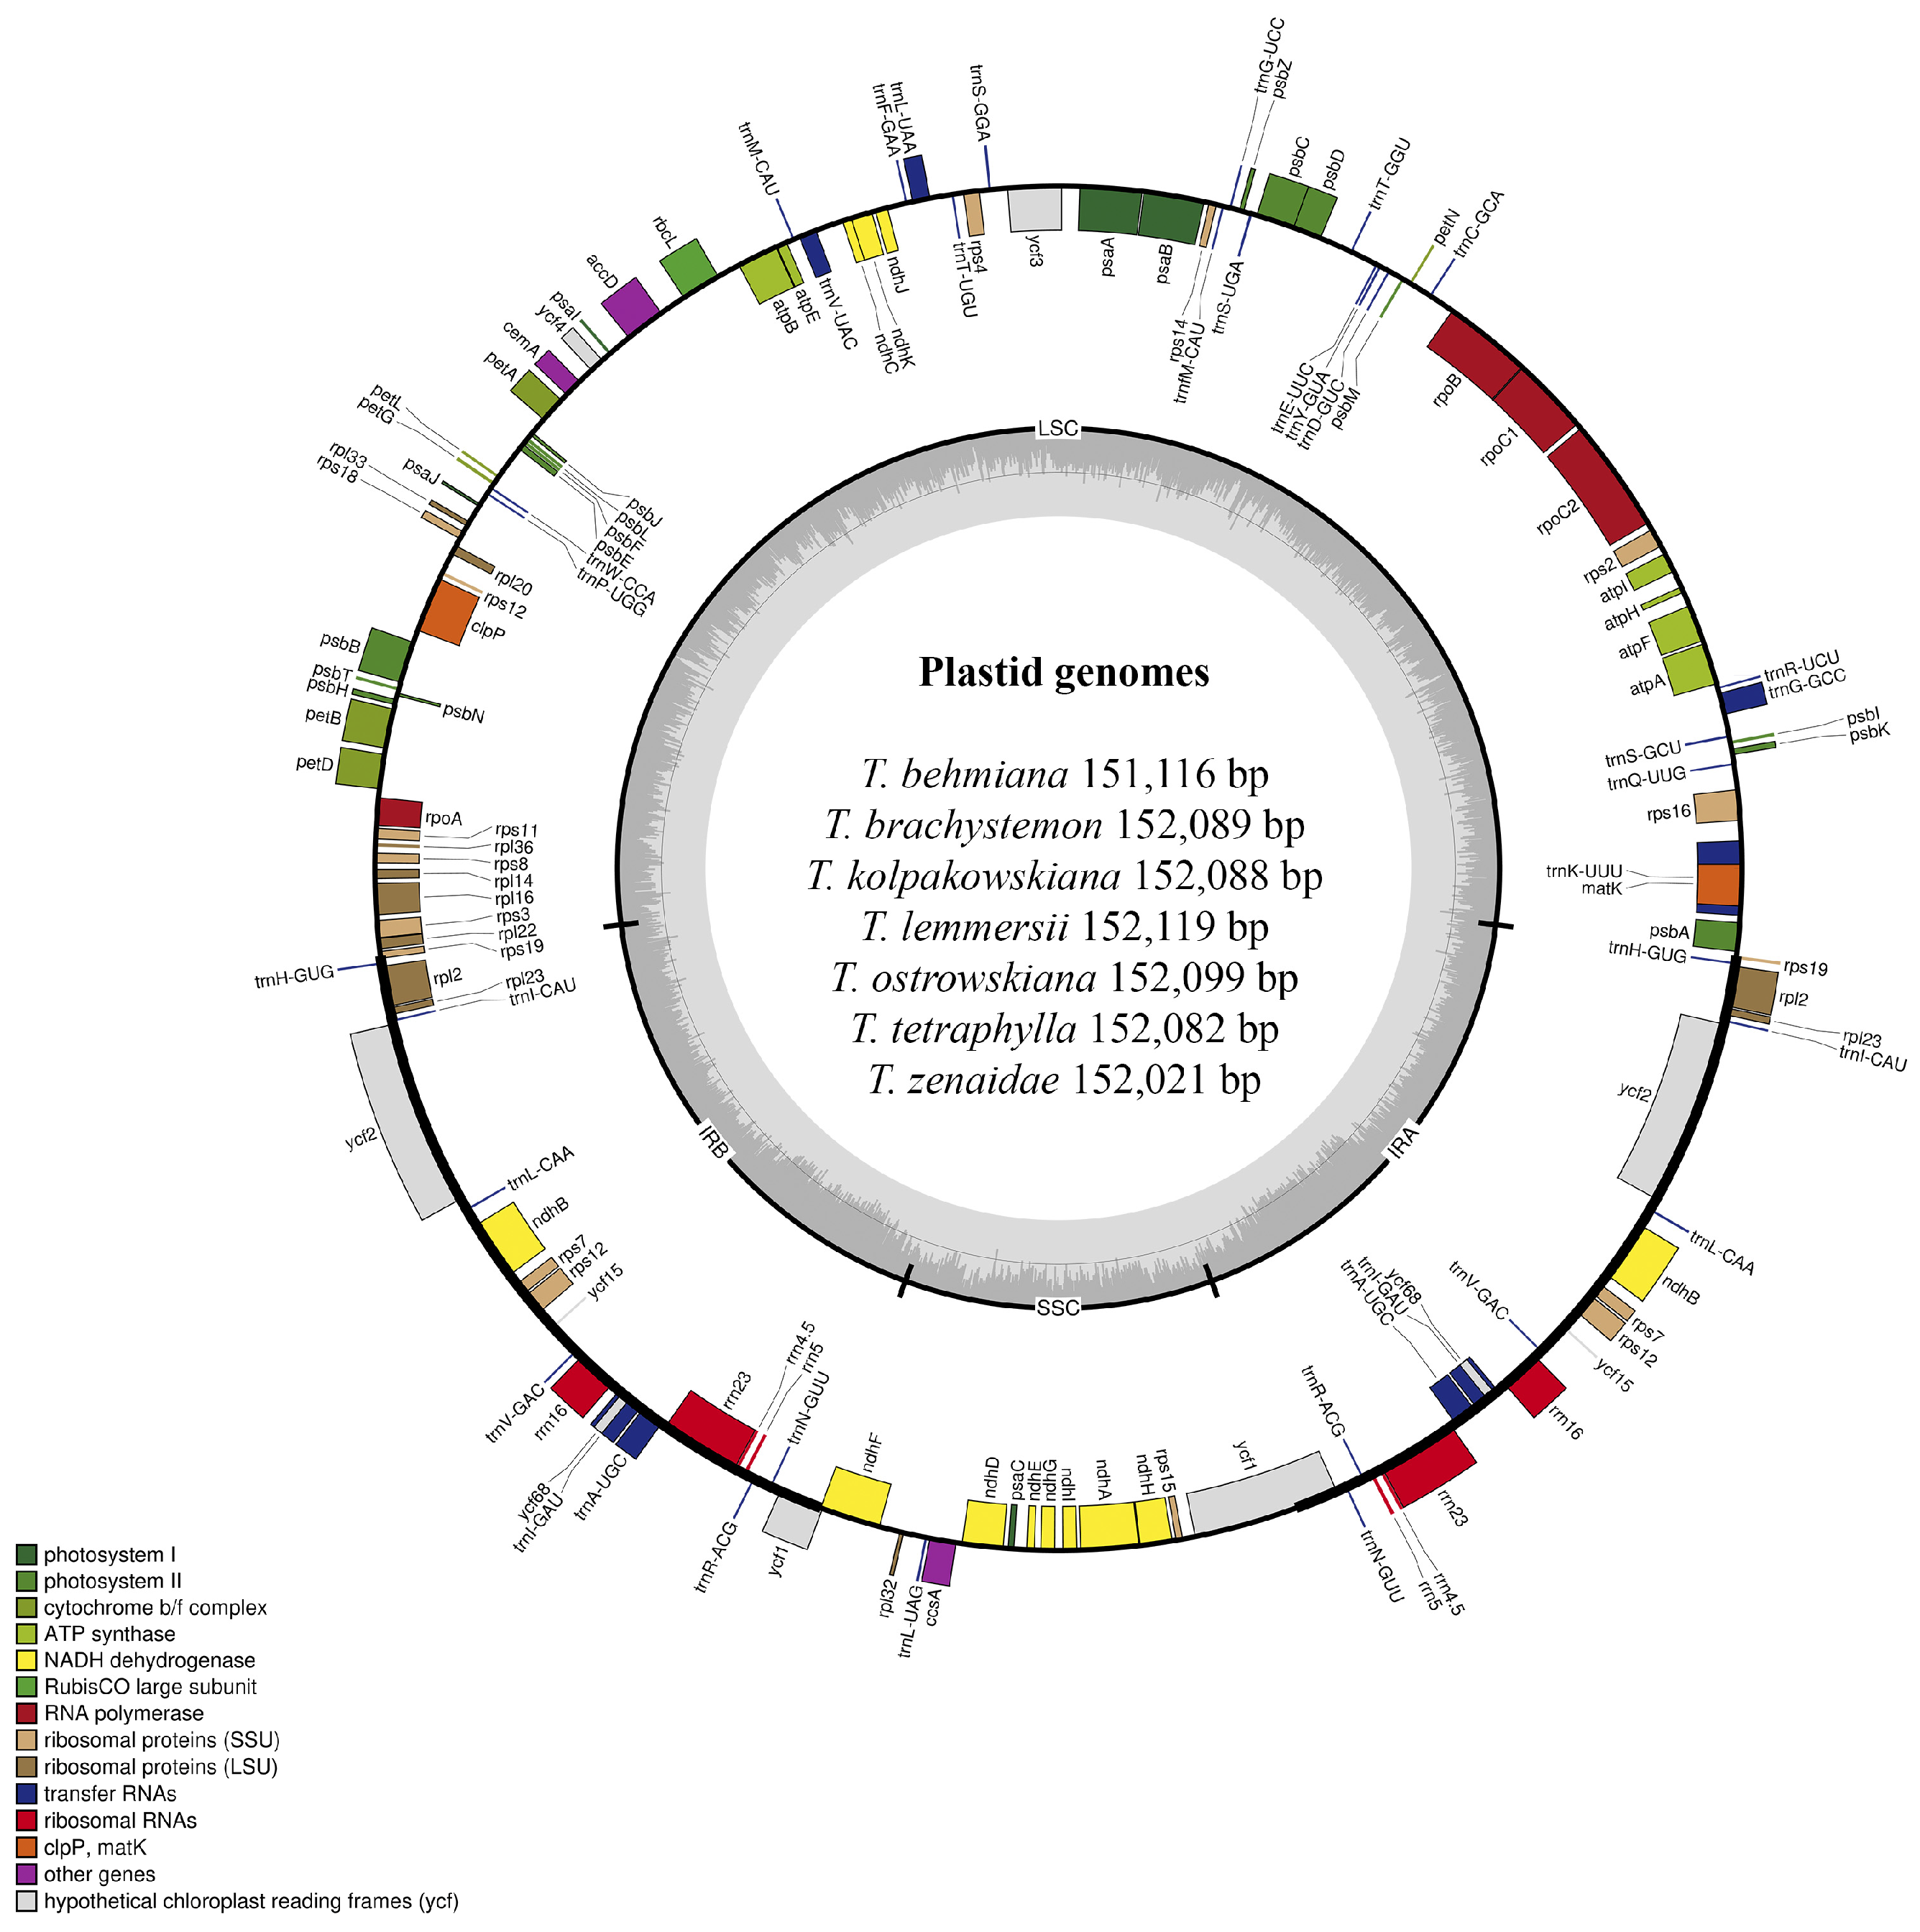
Plastid genomes of T. behmiana, T. brachystemon, T. kolpakowskiana, T. lemmersii, T. ostrowskiana, T. tetraphylla, and T. zenaidae were sequenced on an Illumina NovaSeq 6000 platform (Illumina Inc., San Diego, CA, USA). The filtered data for all seven species resulted in a final yield exceeding 26 GB. The Q20 quality values were 99.02% for T. behmiana, 99.02% for T. brachystemon, 98.31% for T. kolpakowskiana, 98.15% for T. lemmersii, 99.05% for T. ostrowskiana, 99.05% for T. tetraphylla, and 98.75% for T. zenaidae. The Q30 values for T. behmiana, T. brachystemon, T. kolpakowskiana, T. lemmersii, T. ostrowskiana, T. tetraphylla, and T. zenaidae were 95.77%, 95.72%, 93.71%, 93.31%, 95.89%, 95.88%, and 94.97%, respectively. The Tulipa species’ sequenced plastomes had a typical quadripartite structure (Figure 1), with two copies of inverted repeat regions and two single-copy regions (LSC and SSC).
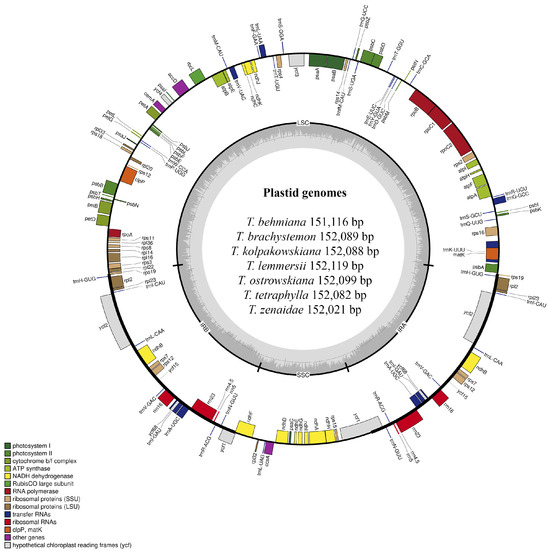
Figure 1.
Plastid genome map of T. behmiana, T. brachystemon, T. kolpakowskiana, T. lemmersii, T. ostrowskiana, T. tetraphylla, and T. zenaidae species from Kazakhstan. Within the circle, darker grey shades indicate GC content, whereas lighter grey shades indicate AT content. The plastid genome boundaries are divided into the LSC, SSC, IRA, and IRB regions. Genes from various functional groups are color-coded.
The total length of the seven Tulipa species plastomes ranged in size from 151,116 bp in T. behmiana to 152,119 bp in T. lemmersii. The LSC region ranged from 81,328 bp (T. behmiana) to 82,317 bp (T. lemmersii), the SSC region from 17,092 bp (T. behmiana) to 17,163 bp (T. ostrowskiana), and the IR regions from 56,652 bp (T. brachystemon, T. kolpakowskiana, and T. ostrowskiana) to 56,696 bp (T. behmiana). The overall GC content of the assembled plastomes of T. behmiana, T. brachystemon, T. kolpakowskiana, T. lemmersii, T. ostrowskiana, T. tetraphylla, and T. zenaidae was 36.69%, 36.65%, 36.65%, 36.63%, 36.64%, 36.63%, and 36.64%, respectively. Whereas the GC content of the LSC regions ranged from 34.53% (T. tetraphylla) to 34.62% (T. behmiana), that of the SSC regions ranged from 30.08% (T. behmiana) to 30.11% (T. kolpakowskiana and T. brachystemon), and that of the IR regions ranged from 42.02% in T. behmiana to 42.05% in T. brachystemon, T. kolpakowskiana, and T. ostrowskiana. The annotated plastid genomes of the seven Tulipa species have been deposited in GenBank. All seven analyzed plastid genomes displayed similar gene content and arrangement. The total number of annotated genes was 136 in all seven studied Tulipa species, 114 of which were unique, including 80 protein-coding genes, 30 tRNA genes, and 4 rRNA genes (Table 1).

Table 1.
Features of plastid genomes in seven Tulipa species.
Out of the 136 genes, 22 were duplicated, including10 protein-coding genes (rps7, rps19, rps12, rpl2, rpl23, ndhB, ycf1, ycf2, ycf15, and ycf68), 8 tRNA genes (trnA-UGC, trnH-GUG, trnI-CAU, trnI-GAU, trnL-CAA, trnN-GUU, trnR-ACG, and trnV-GAC) and 4 rRNA genes (rrn4.5, rrn5, rrn16, and rrn23). Ten protein-coding genes (rpoC, rps12, rps16, rpl2, rpl16, ndhA, ndhB, petB, petD, and atpF) and six tRNA genes (trnA-UGC, trnG-GCC, trnI-GAU, trnK-UUU, trnL-UAA, and trnV-UAC) contained one intron, while two protein-coding genes (clpP and ycf3) contained two introns. The duplicated copies of the rps19 and ycf1 genes and the two copies of the ycf68 gene found in all seven Tulipa plastomes were annotated as pseudogenes (Table 2).
Table 2.
List of genes annotated in seven plastomes of Tulipa species.
2.2. Repeat Sequence Analysis
A total of 1388 simple sequence repeats (SSRs) were identified in the seven Tulipa species plastomes by the MIcroSAtellite Identification Tool (MISA). The number of SSRs in the Tulipa plastomes ranged from 195 (T. behmiana) to 202 (T. zenaidae). Among all the identified SSRs, the mononucleotide repeat was the most abundant, comprising 60.09% of the total SSRs, followed by dinucleotide (34.44%), tetranucleotide (3.90%), trinucleotide (1.08%), pentanucleotide (0.22%), and hexanucleotide (0.29%) repeats. The A/T represented a larger proportion of the mononucleotide repeats (800) than C/G repeats (34). The AT/AT content (327) was more abundant than the AG/CT content (151) in dinucleotide repeats. Most of the tetranucleotide repeats consisted of AAAT/ATTT content (27). Pentanucleotide (3) and hexanucleotide (4) repeats were found to be very rare among the seven Tulipa plastomes. The pentanucleotide repeat was detected only in T. ostrowskiana, T. tetraphylla, and T. zenaidae, while the hexanucleotide repeat was identified in the plastid genomes of T. behmiana and T. ostrowskiana (Table 3). Most of the identified SSRs were detected in the intergenic regions of the studied Tulipa plastomes (File S1).
Table 3.
Types and amounts of simple sequence repeat markers (SSRs) in the plastomes of seven Tulipa species.
Other long repeat types, including forward, palindromic, complement, and reverse repeats in the studied Tulipa plastomes, were identified. The analysis of the seven Tulipa plastomes using REPuter detected 347 repeats. Palindromic repeats (193) were the most abundant type, followed by forward (125), reverse (23), and complementary (6) repeats. Complementary repeats were rare and found only in T. behmiana (1), T. brachystemon (1), T. lemmersii (1), T. ostrowskiana (2), and T. tetraphylla (1) plastomes. Tandem Repeats Finder recognized 282 tandem repeats in the seven Tulipa plastomes, ranging from 37 in T. zenaidae to 43 in T. brachystemon (Figure 2).
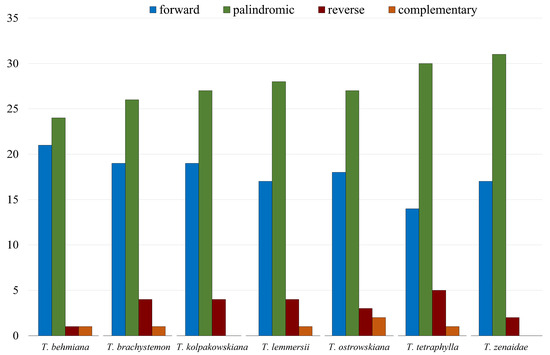
Figure 2.
Number of forward, palindromic, reverse, and complementary repeats identified in plastid genomes of T. behmiana, T. brachystemon, T. kolpakowskiana, T. lemmersii, T. ostrowskiana, T. tetraphylla, and T. zenaidae.
Repeats ranging from 30 to 39 bp were the most abundant in all seven studied plastid genomes, with counts of 34, 36, 36, 35, 37, 38, and 37 for T. behmiana, T. brachystemon, T. kolpakowskiana, T. lemmersii, T. ostrowskiana, T. tetraphylla, and T. zenaidae, respectively. Each Tulipa plastome contained a single repeat with a length of 89 base pairs or more (Figure 3).
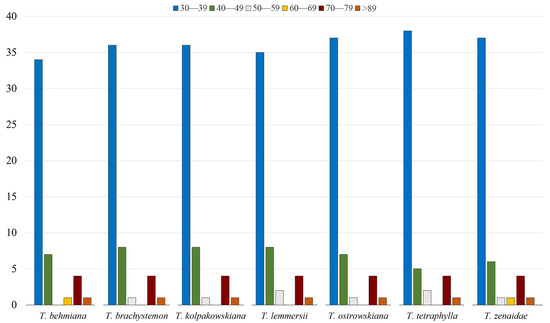
Figure 3.
The categorization of long repeats by their lengths in plastid genomes of T. behmiana, T. brachystemon, T. kolpakowskiana, T. lemmersii, T. ostrowskiana, T. tetraphylla, and T. zenaidae.
2.3. Nucleotide Diversity Analysis
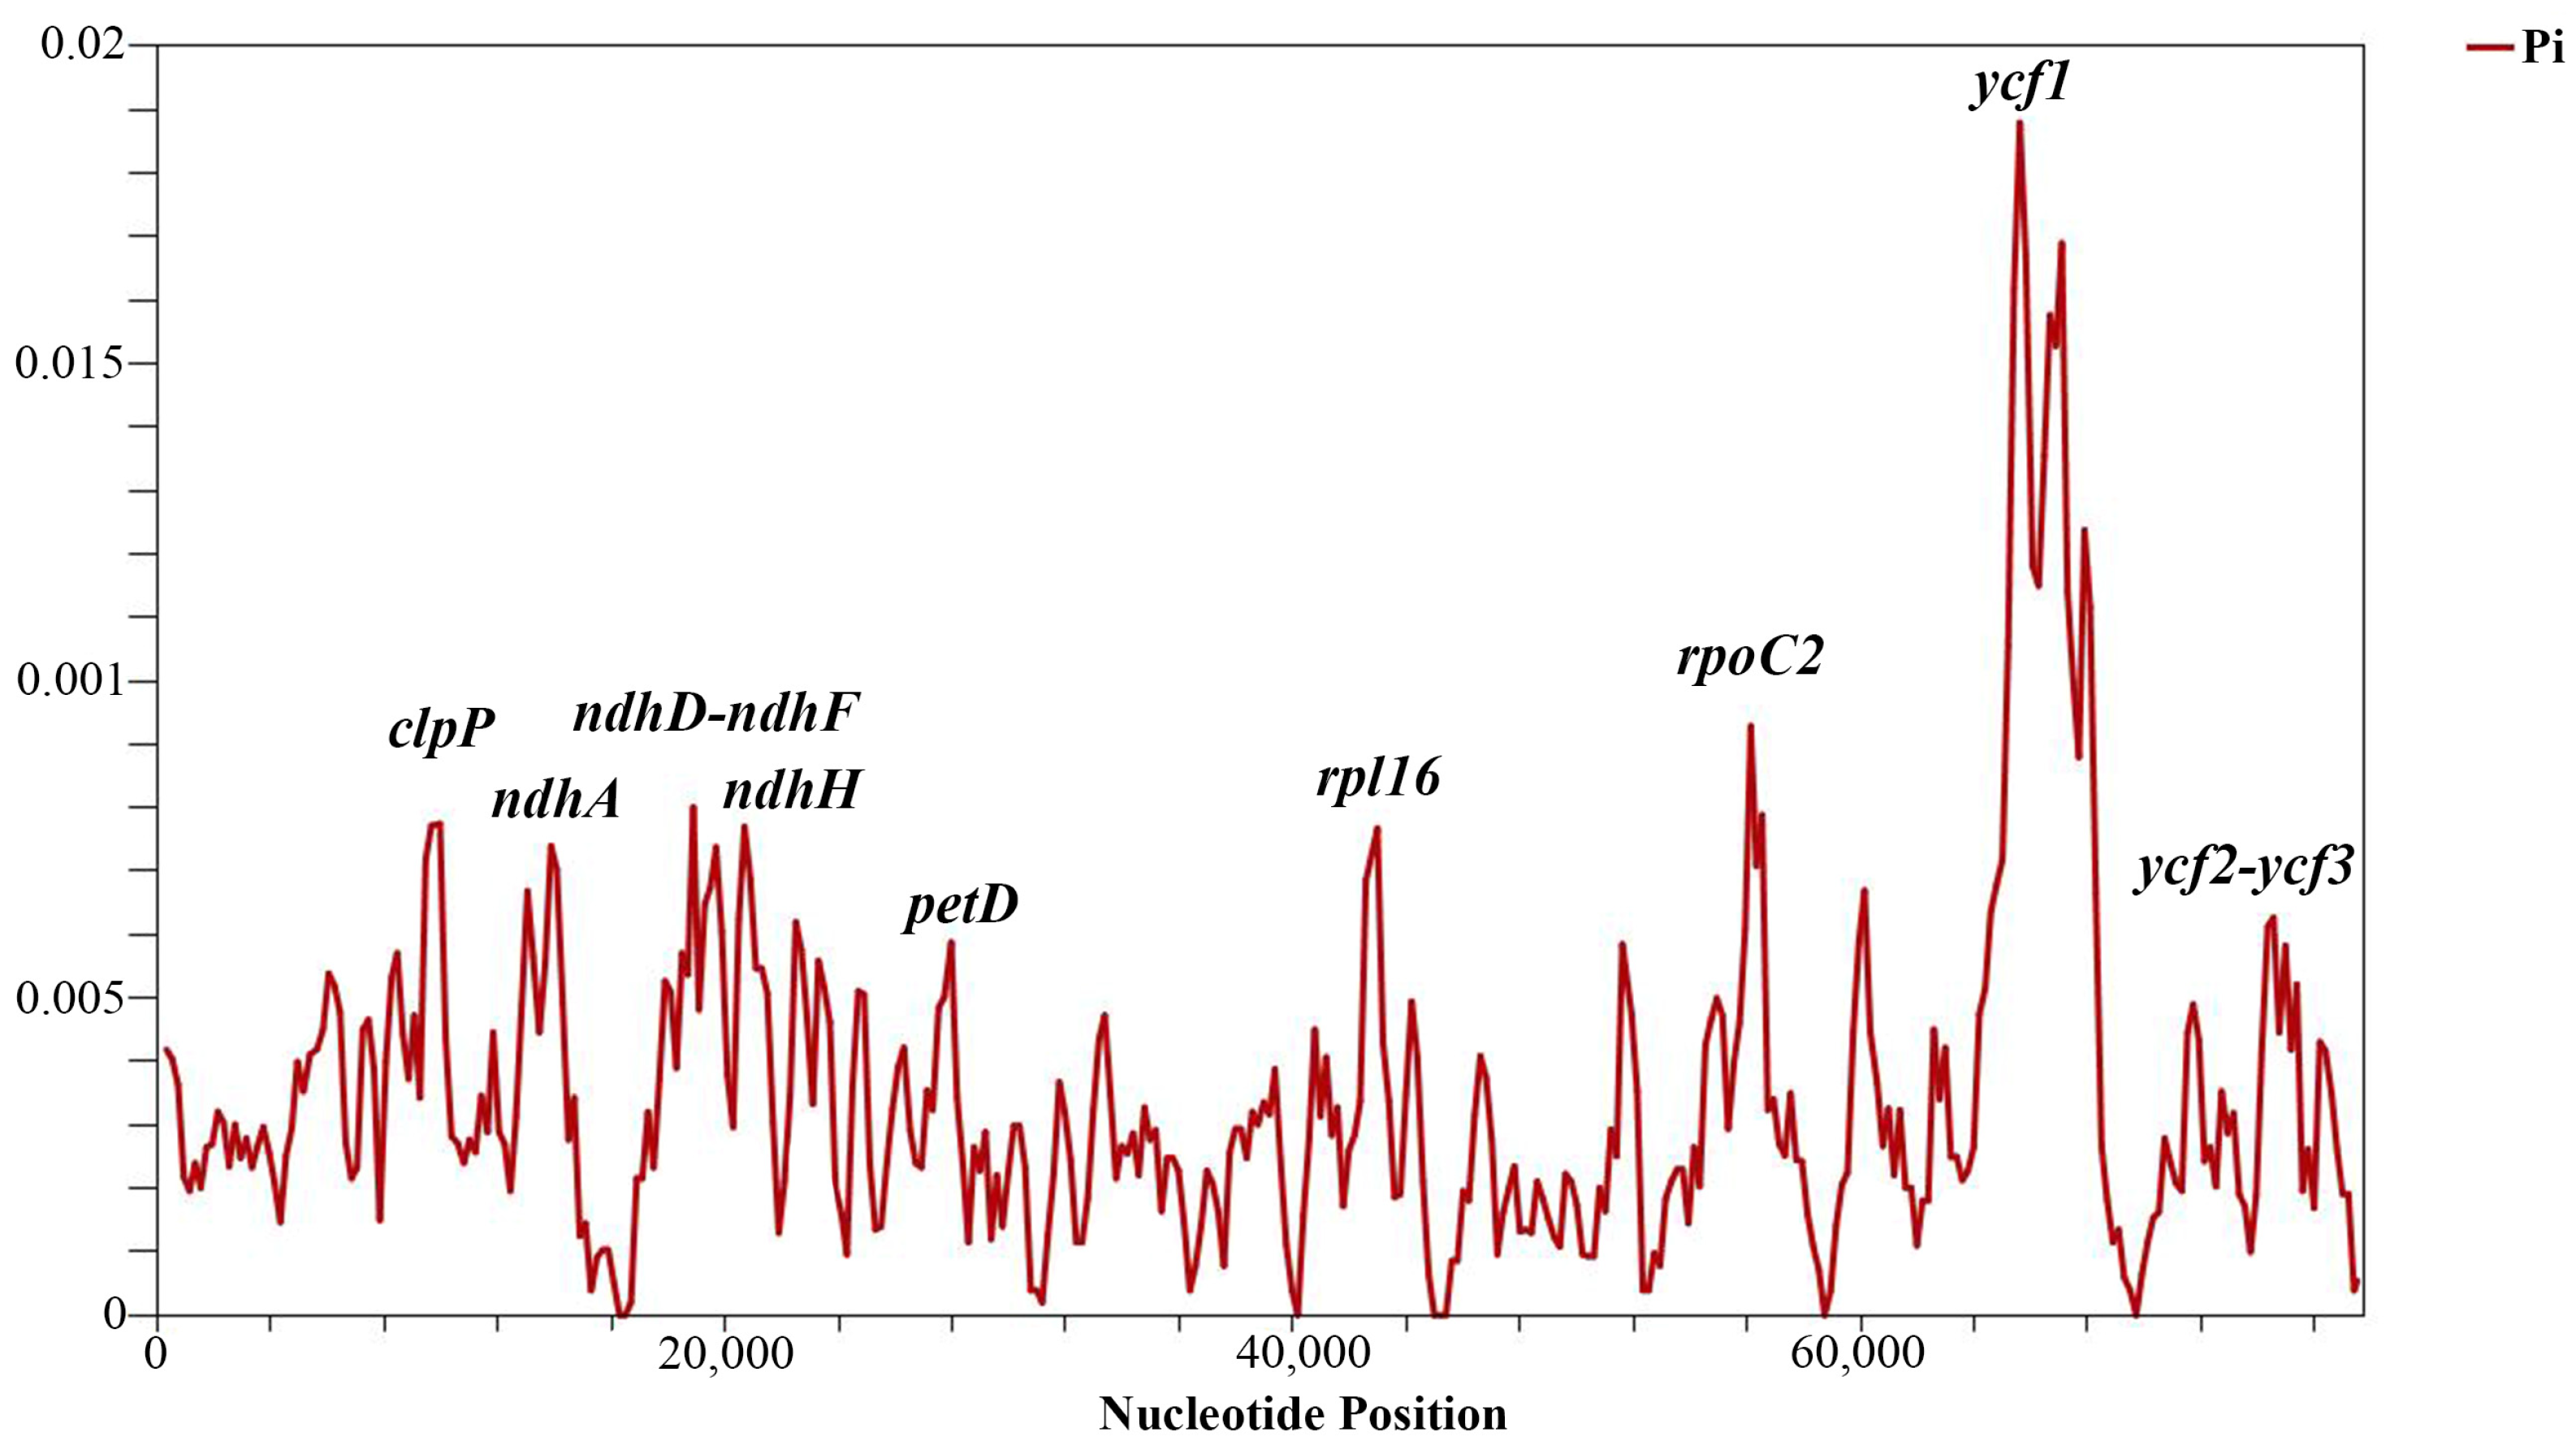
Sliding window analysis identified highly variable regions in the analyzed protein-coding genes of the Tulipa species. The nucleotide variability (Pi) values for the 80 protein-coding genes ranged from 0 to 0.01880, with a mean of 0.00347. Nine regions exhibited relatively high Pi values: petD, ndhH, ycf2-ycf3, ndhA, rpl16, clpP, ndhD-ndhF, rpoC2, and ycf1. The most variable region was ycf1, with a Pi value of 0.02089, indicating more than one variable hotspot (Figure 4). The length, parsimony informative sites, and nucleotide diversity of the variable regions are provided in Table 4.
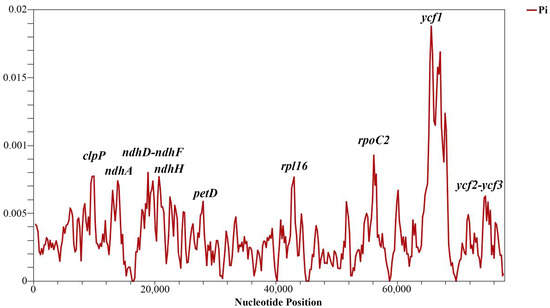
Figure 4.
Nucleotide variability (Pi) analysis in 80 protein-coding genes of Tulipa plastid genomes using sliding window analysis (window length 600 bp and step size 200 bp). The vertical axis indicates the nucleotide diversity for each window, and the horizontal axis represents the midpoint position.
Table 4.
Highly variable regions in the nucleotide sequences of protein-coding genes among the analyzed Tulipa species.
2.4. Selective Pressure Analysis
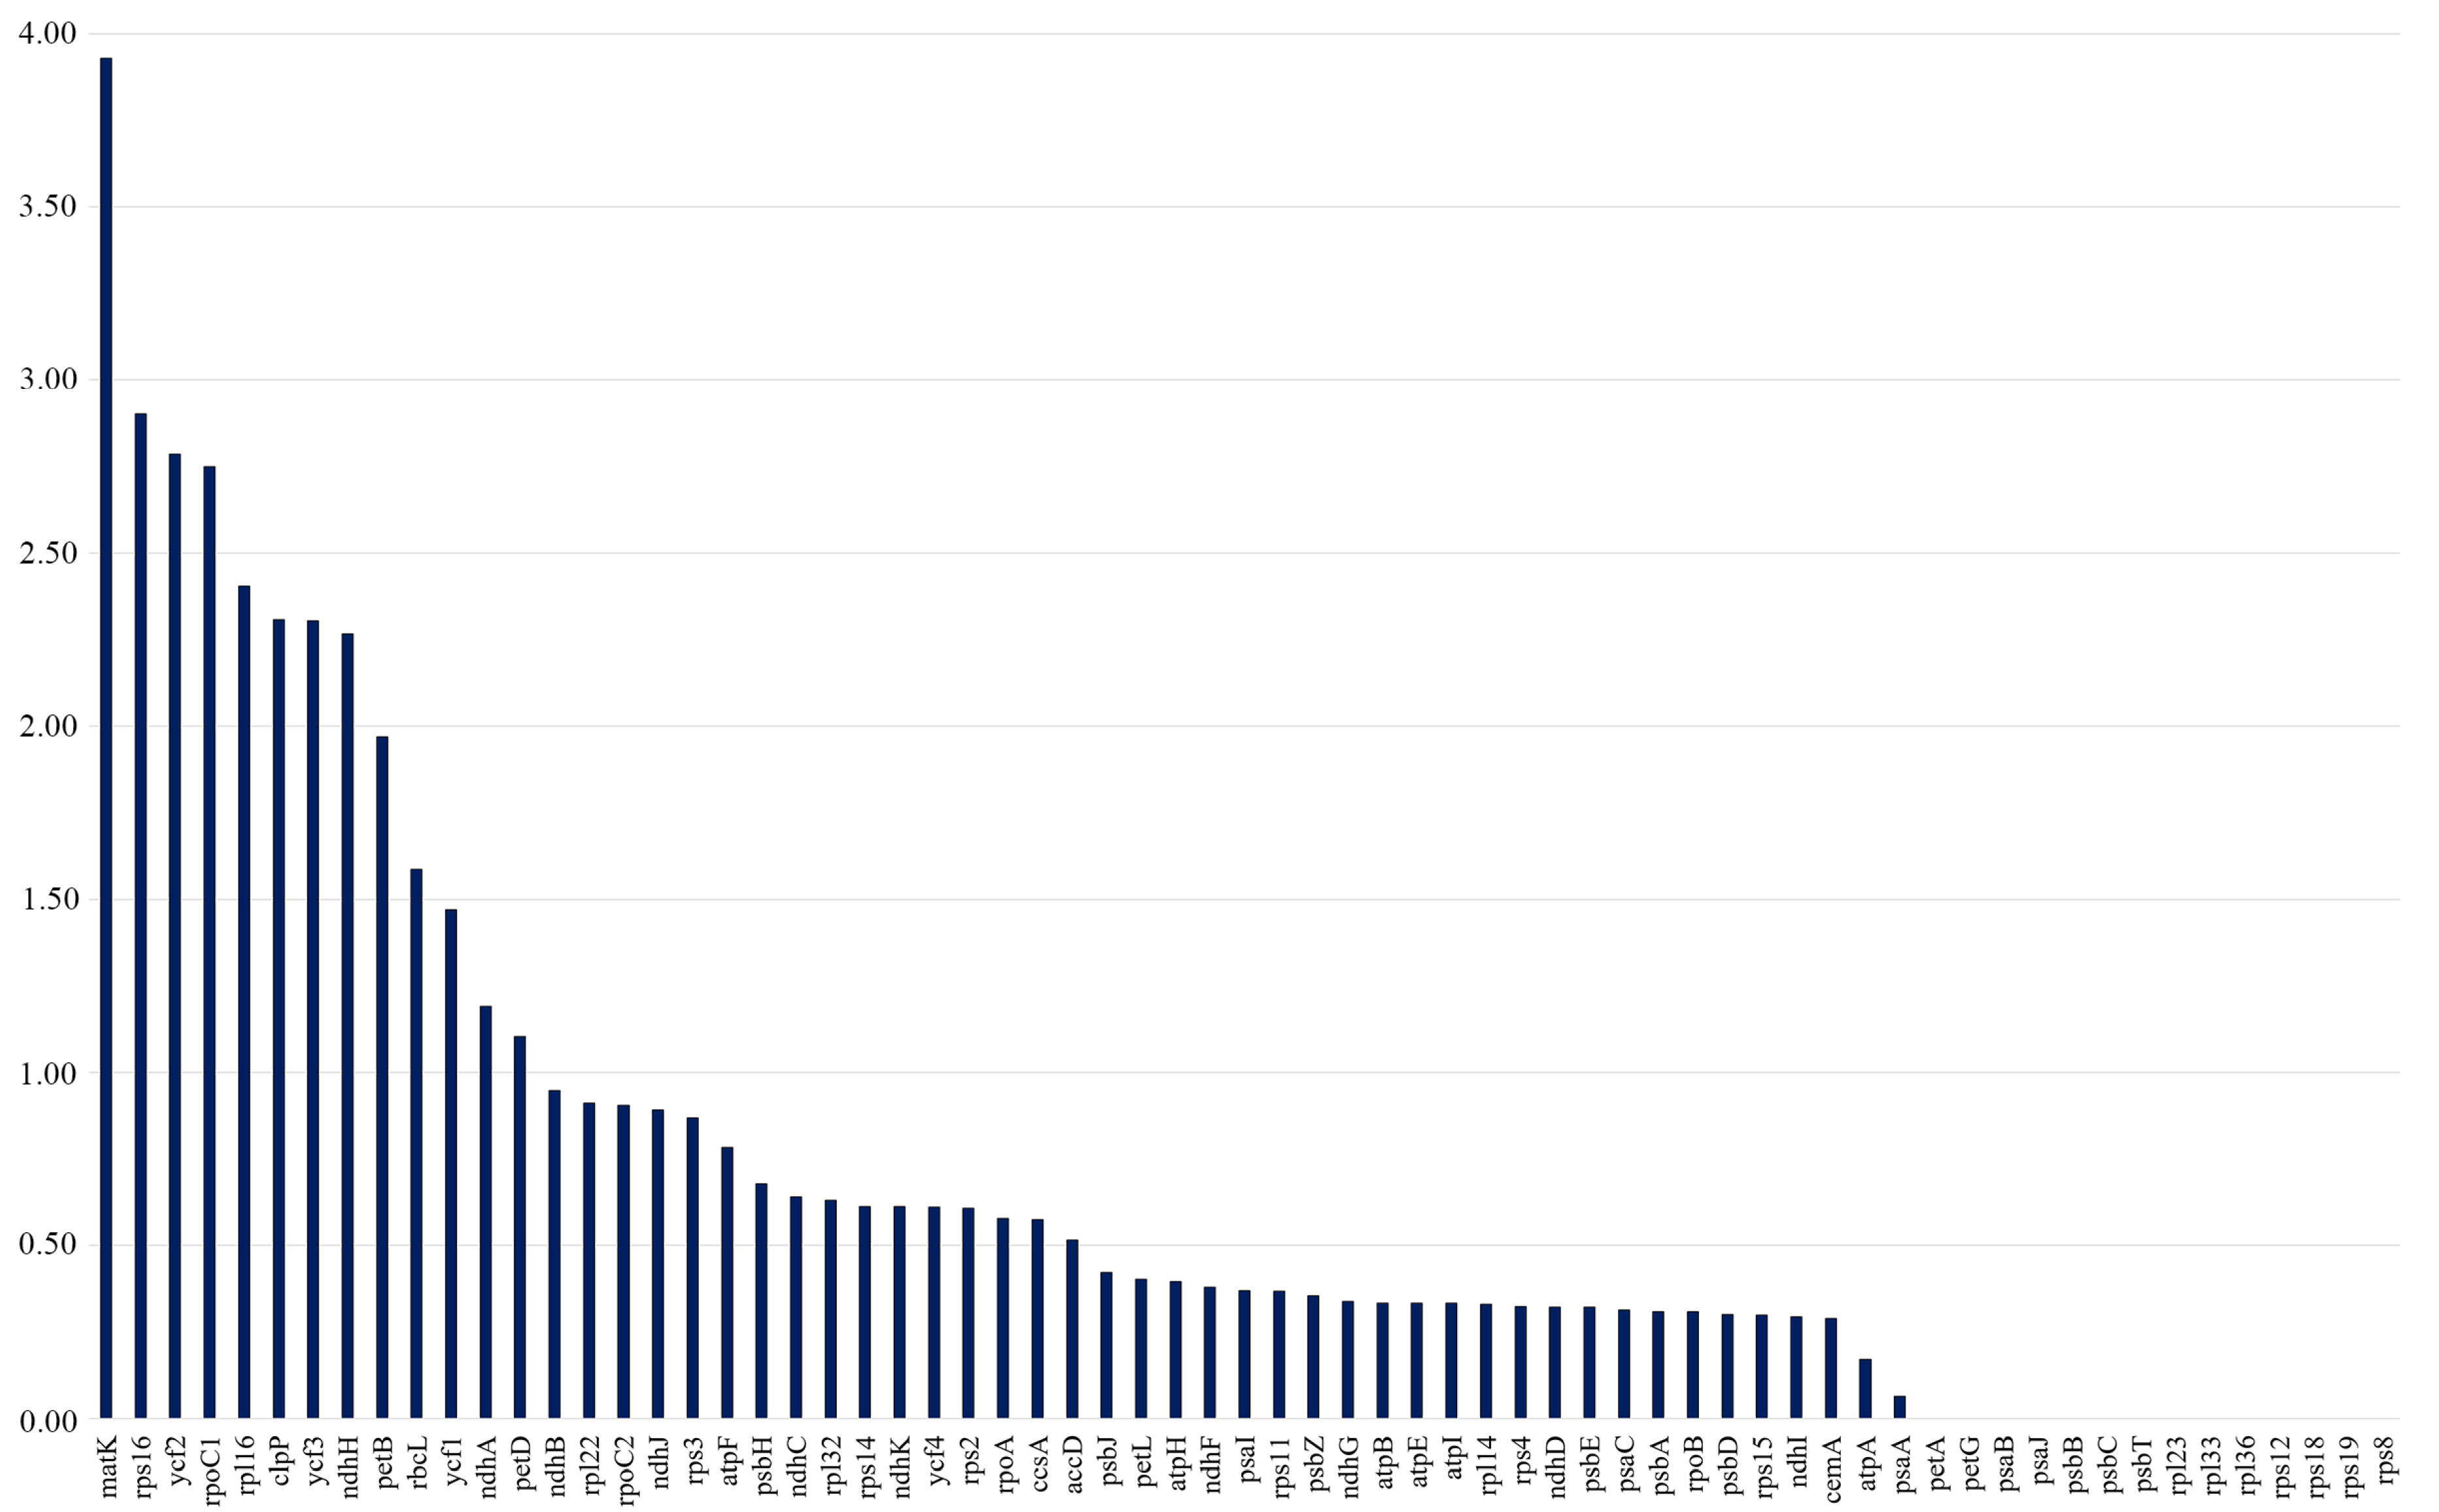
The Ka/Ks ratios were calculated separately for all 80 protein-coding genes across 17 Tulipa plastid genomes. The Ka/Ks values of the protein-coding genes ranged from 0 to 3.9286, with the majority of the genes having Ka/Ks values less than 1. It was indicated that matK had the highest average Ka/Ks ratio of 3.9286, followed by rps16 (2.9024), ycf2 (2.7857), rpoC1 (2.7500), rpl16 (2.4048), clpP (2.3077), ycf3 (2.3043), ndhH (2.2667), petB (1.9688), rbcL (1.5862), ycf1 (1.4694), ndhA (1.1905), and petD (1.1039), suggesting positive selection. The Ka/Ks values of the remaining 54 protein-coding genes were all less than 1, indicating that these genes were under purifying selection (Figure 5).

Figure 5.
The Ka/Ks ratios of protein-coding genes from 17 Tulipa plastid genomes. The vertical axis indicates the Ka/Ks values (ratios), and the horizontal axis represents the protein-coding genes of the plastid genomes.
2.5. Contraction and Expansion of the Inverted Repeat Regions
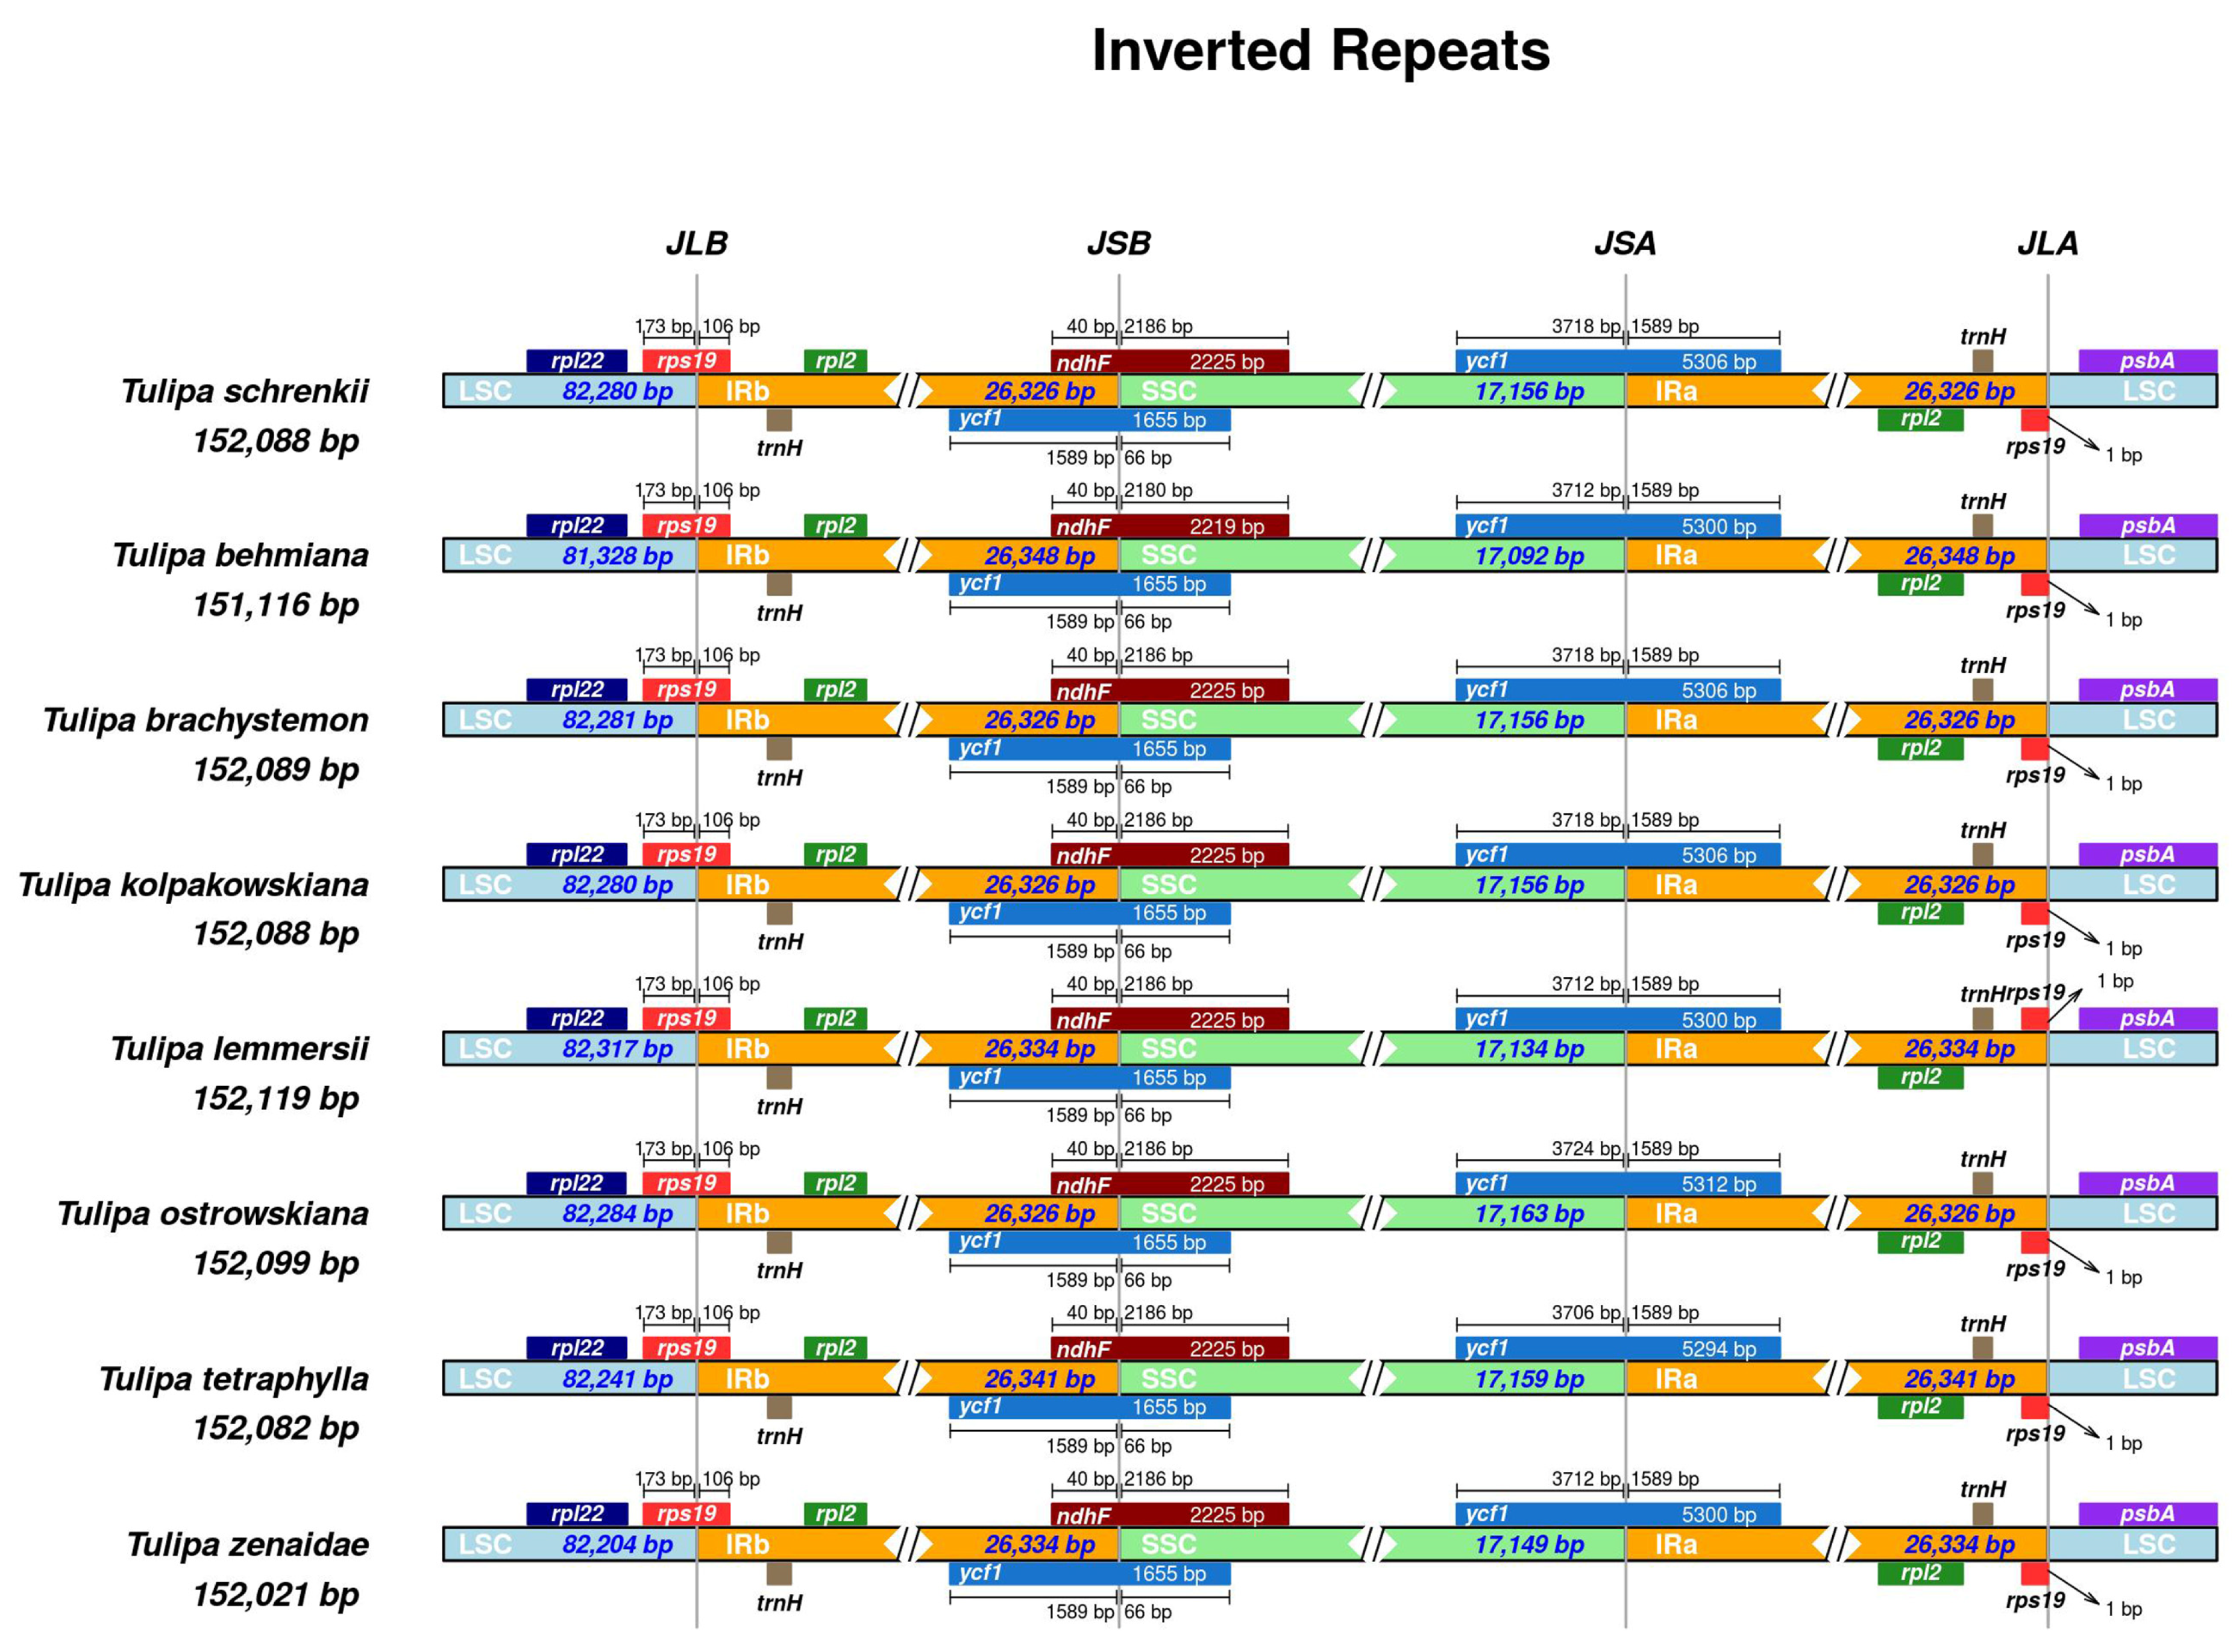
Analysis of contraction and expansion in the junction regions of LSC, SSC, and IR was conducted in the seven studied Tulipa plastomes with T. schrenkii (NC063594.1) as the reference. In all compared Tulipa plastomes, the placement of the rpl22 and psbA genes was exclusively within the LSC region. Conversely, both the rpl2 and trnH genes were located entirely in the IR regions. The positioning of the rps19 genes occurred at the IRa/LSC and LSC/IRb junctions, with the integration of 106 bp into the IRb. The genes ndhF and ycf1 extended beyond the IRb/SSC borders, incorporating 40 bp and 1589 bp into the IRb region. Furthermore, a duplicate copy of the ycf1 gene was evident at the IRa/SSC junction in all Tulipa plastomes, integrated into the IRa by 1589 bp (Figure 6).
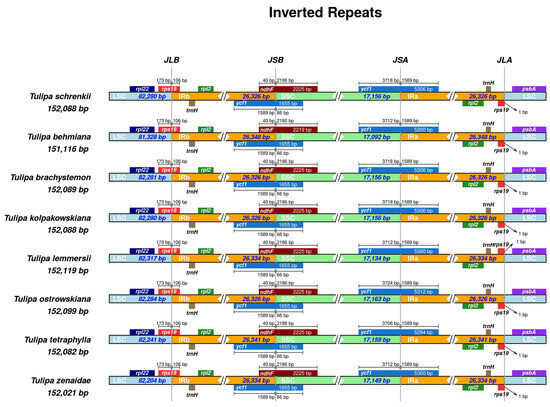
Figure 6.
Comparisons of the borders of the LSC, IR, and SSC regions among Tulipa plastomes. JLB indicates the junction sites between the LSC and IRb regions, JSB indicates the junction sites between the IRb and SSC regions, JSA indicates the junction sites between the SSC and IRa regions, and JLA indicates the junction sites between the IRa and LSC regions.
2.6. Phylogenetic Analysis
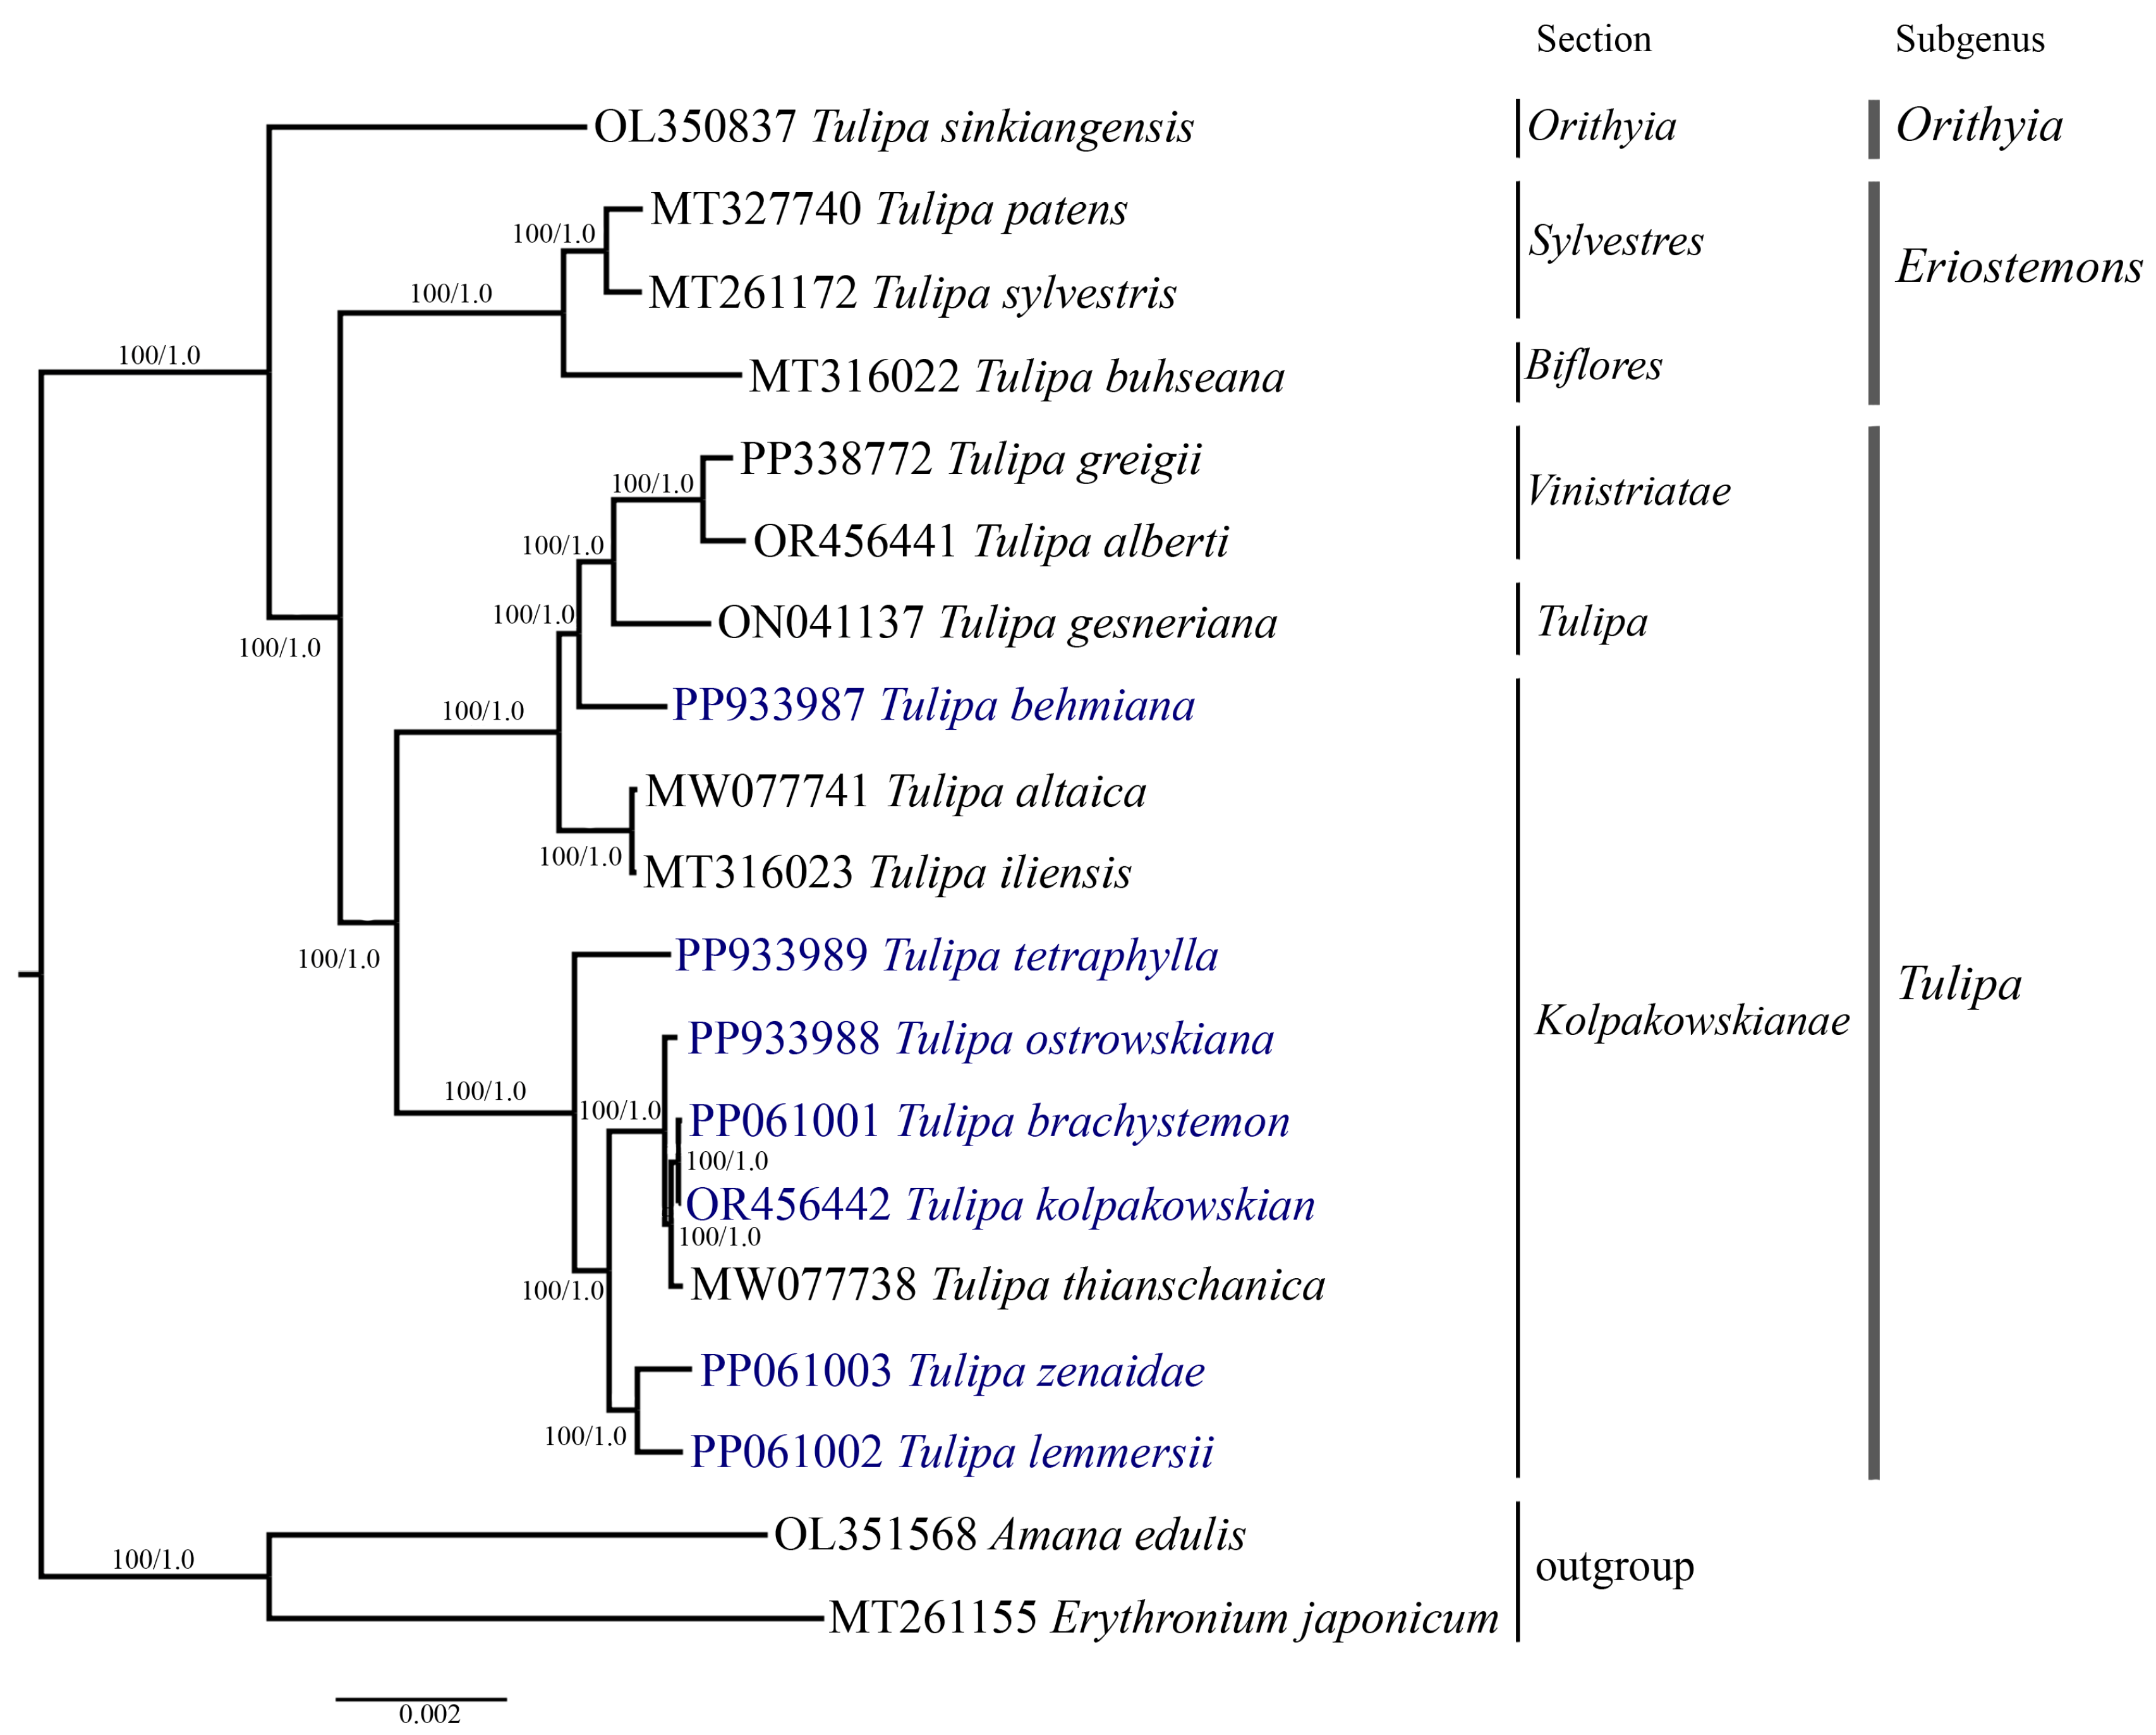
Phylogenetic analysis was conducted based on the nucleotide sequences of complete plastid genomes (Figure 7), protein-coding genes (File S2), and the ycf1 (Figure 8) gene of 19 samples, including the seven Tulipa species analyzed in this study, ten Tulipa species from GenBank, and two outgroup samples (Amana edulis and Erythronium japonicum) using the Maximum Likelihood (ML) and Bayesian inference (BI) methods. The phylogenetic trees derived from the nucleotide sequences of the complete plastid genome (Figure 7) and protein-coding genes (File S2) exhibited similar topologies, clustering the Tulipa species into three major clades corresponding to the subgenera Eriostemons, Tulipa, and Orithyia. The phylogenetic tree based on the ycf1 gene (Figure 8) nucleotide sequences grouped the species into two major clades, with species from the subgenus Orithyia being mixed together with species from the subgenus Tulipa.

Figure 7.
The phylogenetic tree was reconstructed using complete plastid genome sequences from 17 Tulipa species and two outgroup species, employing both Maximum Likelihood (ML) and Bayesian Inference (BI) methods. The numbers at the branch nodes represent ML bootstrap/BI posterior probability values. The species analyzed in this study are highlighted in blue.
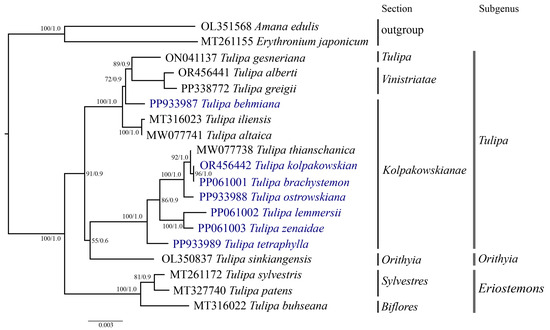
Figure 8.
Phylogenetic tree inferred from ycf1 gene nucleotide sequences for 17 Tulipa species and two outgroup species using Maximum Likelihood (ML) and Bayesian Inference (BI) methods. The numbers at the branch nodes represent ML bootstrap/BI posterior probability values. The species analyzed in this study are highlighted in blue.
Six Tulipa species collected in Kazakhstan (T. brachystemon, T. kolpakowskiana, T. lemmersii, T. ostrowskiana, T. tetraphylla, and T. zenaidae) formed one subclade with T. thianschanica from GenBank, all belonging to the section Kolpakowskianae of the subgenus Tulipa. The seventh species (T. behmiana) from Kazakhstan from the same section formed a separate subclade with species from the sections Tulipa and Vinistriatae, also within the subgenus Tulipa.
3. Discussion
In the present study, we have assembled the plastome sequences of seven Tulipa (T. behmiana, T. brachystemon, T. kolpakowskiana, T. lemmersii, T. ostrowskiana, T. tetraphylla, and T. zenaidae) species from Kazakhstan and conducted a comparative analysis. The plastid genome of seven Tulipa species has a typical quadripartite structure consisting of two IR regions separated by the LSC and SSC regions. A greater proportion of GC content more than 40% was identified within the IR (IRa and IRb) region in contrast to the LSC and SSC regions. This observation aligns consistently with data reported in previous studies on Tulipa species [46]. The increased GC content identified in the IR region may be a consequence of the presence of four rRNA (rrn4.5, rrn5, rrn16, and rrn23) genes [49,50].
The comparative analysis of the seven studied Tulipa genomes revealed 114 unique genes, including 80 protein-coding genes, 30 tRNA genes, and 4 rRNA genes. Plastid genomes often exhibit variation in gene content, and pseudogenes are identified as non-functional remnants of once-active genes [51]. We annotated four pseudogenes (duplicated copies of the rps19 and ycf1 genes and two copies of the ycf68 gene) in the studied Tulipa plastomes. The pseudogenization of ycf1, ycf68, the exact function of which remains unclear, and rps19, which encodes ribosomal protein S19 in plastid genomes, is well documented [52,53,54], reflecting the dynamic evolution of plant genomes involving processes such as functional transfer to the nuclear genome [55]. The genes ycf1, ycf68, and rps19 are common in Tulipa plastid genomes and are often annotated as pseudogenes [45,46,56]. Moreover, the structural variations at the junction sites of LSC, SSC, and IR regions, as reported in prior studies [46,57], were partially attributed to the presence of the pseudogenes ycf1 and rps19, which were identified in this study. The loss of the infA gene is evident across all seven examined plastid genomes. Comparative analyses with the plastid genomes of various Tulipa species, including T. altaica [40,46], T. buhseana [41], T. iliensis [42,46], T. patens [43,46], T. gesneriana [44], T. sinkiangensis [45], T. thianschanica, and T. sylvestris [40,46], reveals the absence of this gene in these species as well. The loss of the infA gene, which codes for translation initiation factor 1, may be attributed to its transfer from the plastid to the nuclear or mitochondrial genomes during angiosperm evolution [58]. The loss of the infA gene appears to occur independently and is not a unique phenomenon in the plastid genomes of angiosperms. Persistent exploration in this field holds the potential to reveal a more comprehensive understanding of the functional implications and evolutionary significance associated with pseudogenes or gene loss events.
The Ka/Ks ratio measures the selection pressure on a gene, indicating positive selection when Ka/Ks > 1 and purifying selection when Ka/Ks < 1 [59]. In this study, Ka/Ks analysis revealed that most genes (54) were under purifying selection, while 12 genes (rps16, ycf2, rpoC1, rpl16, clpP, ycf3, ndhH, petB, rbcL, ycf1, ndhA, and petD) were under positive selection. These results confirm that protein-coding genes are typically characterized by purifying selection [37,39].
SSRs, also known as microsatellites, have garnered significant attention in genetic research due to their abundance, polymorphic nature, and wide applicability [60,61,62]. The utilization of SSR markers provides valuable insights into genetic diversity, population structure, and evolutionary processes [63,64,65]. In our investigation, we identified 1388 SSRs across the plastomes of seven Tulipa species. Notably, mononucleotide repeats constituted the majority (60.09%) of the detected SSRs, with A/T being the most prevalent nucleotide content. These findings align with and confirm the outcomes reported in previous studies [57,66]. The intergenic regions in the seven Tulipa plastomes exhibited the highest percentage of identified SSRs, aligning with similar analyses conducted in other representatives of the Liliaceae family [67,68]. Furthermore, within the studied Tulipa plastomes, we identified palindromic, forward, reverse, complementary, and tandem repeats, with palindromic repeats (193) notably more abundant than forward, reverse, complement, and tandem repeats. Likewise, palindromic repeats emerge as the dominant repeat type in various plant species, such as within the genera Lilium [69], Polyspora [70], and Cicer [71]. Repetitive sequences are pivotal in facilitating genome rearrangements and are frequently utilized in phylogenetic studies to elucidate evolutionary relationships [72,73].
The polymorphic regions within plastid genomes can serve as molecular markers, offering valuable data for DNA barcoding and phylogenetic analysis [74,75,76]. In this study, the region of the ycf1 gene nucleotide sequences displayed the highest degree of polymorphism and was used for the phylogenetic analysis. The results obtained in this study are consistent with previous findings [57,77] and propose the potential use of these outcomes as DNA barcoding markers within Tulipa.
Initially, our focus was on sequencing the nuclear ITS region, as previously we successfully sequenced the ITS region and assessed the phylogeny of several genera, including Ranunculus [78], Allium [79], and Oxytropis [80]. However, the obtained results suggested the inefficiency of the ITS region for categorizing Tulipa species into their respective sections or subgenera (unpublished data). The literature survey showed that most of the conducted phylogenetic studies on Tulipa species have utilized regions of the plastid genome [27,28,29,30]. In this study, the data obtained from the comparative study of seven new and ten known plastid genome sequences proved to be informative and effective for molecular taxonomy analysis of Tulipa species.
Plastid genome sequences have previously been extensively utilized for phylogenetic reconstructions to elucidate the evolutionary relationships among plant species and resolve taxonomic ambiguities [53,54]. Tulipa is recognized as a taxonomically controversial genus due to the presence of diverse morphological characteristics within its species [9]. Molecular phylogenetic analysis of Tulipa has been carried out on a relatively small number of genetic loci, including plastid and nuclear DNA markers [9,11,27,28,29,30]. In this study, a phylogenetic tree was constructed based on the nucleotide sequences of the complete plastid genome (Figure 7), protein-coding genes (File S2), and ycf1 (Figure 8) gene. The dataset incorporated samples from 17 distinct Tulipa species, including seven species from Kazakhstan and two outgroup species. The species from section Kolpakowskianae, including those analyzed in this study (T. behmiana, T. brachystemon, T. kolpakowskiana, T. lemmersii, T. ostrowskiana, T. tetraphylla, and T. zenaidae) formed a single large clade along with species from the Tulipa and Vinistriatae sections in the analysis. These findings support the taxonomic concept proposed by B. Wilson [81] and Eker et al. [31], which merges the sections Vinistriatae and Kolpakowskianae into a single section named Tulipa.
In addition, the results from this study may provide valuable information for future Tulipa germplasm conservation strategies. Specifically, we identified over 1300 putative SSRs in the plastid genome sequences of seven Tulipa species. These SSRs can serve as potential DNA markers for population genetic studies, helping to identify the most genetically diverse populations and develop effective conservation strategies. Moreover, we identified polymorphic regions in the plastid genomes of the analyzed Tulipa species to find potential DNA barcoding markers that can be informative for the taxonomy of the genus. In this study, the ycf1 gene region was recognized as the most polymorphic, suggesting that the ycf1 gene can be used as a specific barcode for Tulipa species.
4. Materials and Methods
4.1. Plant Material and DNA Extraction
The plant leaves of seven Tulipa species (T. behmiana, T. brachystemon, T. kolpakowskiana, T. lemmersii, T. ostrowskiana, T. tetraphylla, and T. zenaidae) were collected from the Almaty, Zhambyl, and Turkestan regions of Kazakhstan. Permission was obtained to collect plant leaves of Tulipa species from the Forestry and Wildlife Committee of the Ministry of Ecology, Geology, and Natural Resources of the Republic of Kazakhstan. The collected fresh leaves were dried in silica gel for further DNA extraction. Genomic DNA was extracted, using the cetyltrimethylammonium bromide (CTAB) protocol [82], from the dried leaves of Tulipa samples.
4.2. Sequencing, Assembly, and Annotation
The sequencing part of the study was carried out according to our previous reports on the characterization of plastid genomes in Juniperus species [83,84,85]. DNA samples that successfully passed quality control assessments were used to prepare paired-end libraries with the TruSeq Nano DNA Kit (Illumina Inc., San Diego, CA, USA). Paired-end sequencing of the seven Tulipa species from Kazakhstan was conducted on an Illumina NovaSeq 6000 platform (Illumina Inc., San Diego, CA, USA) at Macrogen Inc. (Seoul, Republic of Korea). The quality control of raw reads was checked using FastQC (https://www.bioinformatics.babraham.ac.uk/projects/fastqc/, accessed on 27 May 2024) and trimmed using Trimmomatic 0.36 [86] to remove adapter sequences. Clean reads were assembled using NOVOPlasty version 4.3.3 [87]. The assembled plastome sequences of the seven Tulipa species were annotated using GeSeq [88] and PGA [89]. They were then manually corrected by comparing them with T. schrenkii (NC063594.1) as the reference. The annotated sequences of T. behmiana, T. brachystemon, T. kolpakowskiana, T. lemmersii, T. ostrowskiana, T. tetraphylla, and T. zenaidae plastomes obtained in this study have been deposited into the NCBI database under accession numbers PP933987, PP061001, OR456442, PP061002, PP933988, PP933989, and PP061003, respectively. The circular plastid genome map was drawn by Organellar Genome DRAW 1.3.1 (OGDRAW) [90].
4.3. Repeat Element Analysis, Nucleotide Diversity, IR Region Contraction and Expansion, and Ka/Ks Ratio Analysis
Tandem repeat sequences were detected using the Tandem Repeats Finder program [91] with the default settings. The REPuter web-based program [92] was used to find the forward (F), palindromic (P), reverse (R), and complementary (C) repeat elements with the following parameter settings: Hamming distance = 3 and minimum repeat size = 30 bp. The position and types of simple sequence repeats (SSRs) were detected using MISA online tool (https://webblast.ipk-gatersleben.de/misa/, accessed on 19 June 2024) [93] with thresholds for mononucleotide SSRs—eight repeats; for dinucleotide and trinucleotide—four repeats; and for tetranucleotide, pentanucleotide, and hexanucleotide—three repeats. The DnaSP 6 (DNA Sequence Polymorphism) package [94], with a 200 bp step size and a 600 bp window length, was used to calculate nucleotide diversity (Pi) for the aligned protein-coding genes of all Tulipa species. We separately isolated and aligned the 80 protein-coding genes to evaluate synonymous (Ks) and nonsynonymous (Ka) substitution rates. Subsequently, each gene’s Ka/Ks ratios were analyzed using DnaSP 6 [94]. The seven plastid genome and reference sample T. schrenkii (NC063594.1) junction sites were analyzed and visualized using IRscope (https://irscope.shinyapps.io/irapp/, accessed on 24 June 2024) online [95].
4.4. Phylogenetic Analysis
Phylogenetic analysis was conducted based on the alignment of the sequences of the complete plastid genome, protein-coding genes, and the ycf1 gene of seven Tulipa species collected in Kazakhstan, ten Tulipa samples from NCBI, and two outgroup samples, Amana edulis (OL351568) and Erythronium japonicum (MT261155). The program Geneious Prime® 2024.0.2 (https://www.geneious.com) was used for the alignment of nucleotide sequences. Phylogenetic analysis was conducted using the Maximum Likelihood (ML) and Bayesian inference (BI) methods. ML phylogenetic trees were reconstructed based on the TVM + F + I (complete plastid genome sequences), TVM + F + I + R4 (protein-coding genes), and K3Pu + F + G4 (ycf1 gene) best nucleotide substitution model according to Bayesian information criterion (BIC) using IQ-TREE 2.2.2.6 software [96]. BI trees were constructed using MrBayes 3.2.7 [97] with the following parameters: ngen = 3,000,000, samplefreq = 200, and burninfrac = 0.25. The resulting trees were visualized using FigTree 1.4.4 (http://tree.bio.ed.ac.uk/software/figtree/, accessed on 20 June 2024). The subgenus and section names of the Tulipa species in this analysis were given according to Veldkamp and Zonneveld [1].
5. Conclusions
In this study, the complete plastid genomes of seven Tulipa species (T. behmiana, T. brachystemon, T. kolpakowskiana, T. lemmersii, T. ostrowskiana, T. tetraphylla, and T. zenaidae) collected in Kazakhstan were analyzed. The structure and gene content of the studied plastid genomes of the seven Tulipa species were similar. The total length of the studied Tulipa plastomes ranged in size from 151,116 bp in T. behmiana to 152,119 bp in T. lemmersii. The total number of annotated genes was 136 in all seven studied Tulipa species, 114 of which were unique, including 80 protein-coding, 30 tRNA, and 4 rRNA genes. The analysis of the seven plastid genomes revealed the presence of 1388 simple sequence repeats, with counts ranging from 195 in T. behmiana to 202 in T. zenaidae. The nucleotide variability (Pi) values for the 80 protein-coding genes ranged from 0 to 0.01880. Among these genes, nine regions showed relatively high Pi values: petD, ndhH, ycf2-ycf3, ndhA, rpl16, clpP, ndhD-ndhF, rpoC2, and ycf1. Notably, ycf1 exhibited the highest variability (0.02089), indicating the presence of multiple variable hotspots. The ycf1 gene, along with complete plastid genome and protein-coding gene nucleotide sequences, was used for the phylogenetic analysis. The phylogenetic trees generated using Maximum Likelihood and Bayesian inference methods divided the species into three main clades corresponding to their respective subgenera. The nucleotide sequences of the ycf1 gene from the plastid genome can be recommended as a potential DNA barcoding marker for the genus Tulipa. The obtained nucleotide sequences of the seven Tulipa species may prove suitable for phylogenetic analysis and molecular taxonomy.
Supplementary Materials
The following supporting information can be downloaded at: https://www.mdpi.com/article/10.3390/ijms25147874/s1.
Author Contributions
Conceptualization, S.A. (Shyryn Almerekova) and S.A. (Saule Abugalieva); methodology, S.A. (Shyryn Almerekova); software, S.A. (Shyryn Almerekova); validation, S.A. (Shyryn Almerekova), Y.T., A.I. and M.Y.; formal analysis, S.A. (Shyryn Almerekova), M.Y. and Y.T.; investigation, S.A. (Shyryn Almerekova) and M.Y.; resources, S.A. (Saule Abugalieva) and A.I.; data curation, S.A. (Shyryn Almerekova), A.I. and Y.T.; writing—original draft preparation, S.A. (Shyryn Almerekova), Y.T. and S.A. (Saule Abugalieva); writing—review and editing, S.A. (Shyryn Almerekova) and S.A. (Saule Abugalieva); supervision, S.A. (Saule Abugalieva) and Y.T.; project administration, S.A. (Shyryn Almerekova); funding acquisition, S.A. (Saule Abugalieva). All authors have read and agreed to the published version of the manuscript.
Funding
This research was funded by the Science Committee of the Ministry of Science and Higher Education of the Republic of Kazakhstan (Grant No. AP14870612).
Institutional Review Board Statement
Not applicable.
Informed Consent Statement
Not applicable.
Data Availability Statement
All data are contained within the article and its Supplementary Files.
Conflicts of Interest
The authors declare no conflicts of interest.
References
- Veldkamp, J.F.; Zonneveld, B.J.M. The infrageneric nomenclature of Tulipa (Liliaceae). Plant Syst. Evol. 2012, 298, 87–92. [Google Scholar] [CrossRef]
- Ivaschenko, A.A.; Belyalov, O.V. Kazakhstan is the Birthplace of Tulips; Atamura: Almaty, Kazakhstan, 2019. [Google Scholar]
- Botschantzeva, Z.P. Tulips: Taxonomy, Morphology, Cytology, Phytogeography, and Physiology; CRC Press: Rotterdam, The Netherlands, 1962; (English Edition Translated by Varekamp, H.Q. 1982). [Google Scholar]
- Tojibaev, K.; Beshko, N. Reassessment of diversity and analysis of distribution in Tulipa (Liliaceae) in Uzbekistan. Nord. J. Bot. 2015, 33, 324–334. [Google Scholar] [CrossRef]
- Beshko, N.Y.; Abduraimov, O.S.; Kodirov, U.K.; Madaminov, F.M.; Mahmudov, A.V. The Current State of Cenopopulations of Some Endemic and Rare Species of the Genus Tulipa L. (Liliaceae) in the Tashkent Region (Uzbekistan). Arid Ecosyst. 2023, 13, 294–304. [Google Scholar] [CrossRef]
- Hall, A.D. The Genus Tulipa; Royal Horticultural Society: London, UK, 1940. [Google Scholar]
- Van Raamsdonk, L.W.D.; De Vries, T. Species relationships and taxonomy in Tulipa subgenus Tulipa (Liliaceae). Plant Syst. Evol. 1995, 195, 13–44. [Google Scholar] [CrossRef]
- Zonneveld, B.J. The systematic value of nuclear genome size for "all" species of Tulipa L. (Liliaceae). Plant Syst. Evol. 2009, 281, 217–245. [Google Scholar] [CrossRef]
- Christenhusz, M.J.; Govaerts, R.; David, J.C.; Hall, T.; Borland, K.; Roberts, P.S.; Fay, M.F. Tiptoe through the tulips–cultural history, molecular phylogenetics and classification of Tulipa (Liliaceae). Bot. J. Linn. Soc. 2013, 172, 280–328. [Google Scholar] [CrossRef]
- Eker, I.; Babaç, M.T.I.; Koyuncu, M. Revision of the genus Tulipa L. (Liliaceae) in Turkey. Phytotaxa 2014, 157, 1–112. [Google Scholar] [CrossRef]
- Hajdari, A.; Pulaj, B.; Schmiderer, C.; Mala, X.; Wilson, B.; Lluga-Rizani, K.; Mustafa, B. A phylogenetic analysis of the wild Tulipa species (Liliaceae) of Kosovo based on plastid and nuclear DNA sequence. Adv. Genet. 2021, 2, e202100016. [Google Scholar] [CrossRef]
- Pourkhaloee, A.; Khosh-Khui, M.; Arens, P.; Salehi, H.; Razi, H.; Niazi, A.; van Tuyl, J. Molecular analysis of genetic diversity, population structure, and phylogeny of wild and cultivated tulips (Tulipa L.) by genic microsatellites. Hortic. Environ. Biotechnol. 2018, 59, 875–888. [Google Scholar] [CrossRef]
- Qifu, L.; Tong, O.; Yancheng, J.; Caixia, W. Tulip RAPD analysis of cultivars and wild species in Xinjiang. Acta Agric. Univ. Jiangxiensis 2008, 30, 656–660. [Google Scholar]
- Kiani, M.; Memariani, F.; Zarghami, H. Molecular analysis of species of Tulipa L. from Iran based on ISSR markers. Plant Syst. Evol. 2012, 298, 1515–1522. [Google Scholar] [CrossRef]
- Kashin, A.S.; Kritskaya, T.A.; Schanzer, I.A. Genetic polymorphism of Tulipa gesneriana L. evaluated on the basis of the ISSR marking data. Russ. J. Genet. 2016, 52, 1134–1145. [Google Scholar] [CrossRef]
- Kritskaya, T.A.; Kashin, A.S.; Schanzer, I.A.; Danilov, V.A. Genetic differentiation of Tulipa suaveolens (Liliaceae) in the north-east of its range in the European part of Russia. Bot. Zhurnal 2018, 103, 187–201. [Google Scholar]
- Olivia, B.I.; Pamfil, D.; van Heusden, S.; van Tuyl, J.; Meijer-Dekens, F.; Bondrea, M.; Patrascu, V.A. AFLP as a modern technique for DNA fingerprinting and identification Tulipa cultivars. Bull. USAMV-CN 2007, 63, 64. [Google Scholar]
- Kutlunina, N.A.; Polezhaeva, M.A.; Permyakova, M.V. Morphologic and AFLP analysis of relationships between tulip species Tulipa biebersteiniana (Liliaceae). Russ. J. Genet. 2013, 49, 401–410. [Google Scholar] [CrossRef]
- Asgari, D.; Babaei, A.; Naghavi, M.R.; Kiani, M. Biodiversity status of Tulipa (Liliaceae) in Iran inferred from molecular characterization. Hortic. Environ. Biotechnol. 2020, 61, 559–567. [Google Scholar] [CrossRef]
- Haerinasab, M.Z.; Jalilian, N.; Eslami-Farouji, A. Genetic Diversity and Population Structure of Some Iranian Tulipa Species Within the Subgenus Eriostemones Using CDDP Method. Iran. J. Sci. Technol. Trans. A Sci. 2021, 45, 1273–1285. [Google Scholar] [CrossRef]
- Shahin, A.; van Kaauwen, M.; Esselink, D.; Bargsten, J.W.; van Tuyl, J.M.; Visser, R.G.; Arens, P. Generation and analysis of expressed sequence tags in the extreme large genomes Lilium and Tulipa. BMC Genom. 2012, 13, 640. [Google Scholar] [CrossRef]
- Tang, N.; Shahin, A.; Bijman, P.; Liu, J.; van Tuyl, J.; Arens, P. Genetic diversity and structure in a collection of tulip cultivars assessed by SNP markers. Sci. Hortic. 2013, 161, 286–292. [Google Scholar] [CrossRef]
- Ivaschenko, A.A. Distribution and status of populations of some endemic representatives of Syrdarya Karatau and Western Tien-Shan flora. Probl. Bot. South. Sib. Mong. 2021, 20, 213–220. [Google Scholar]
- Ivaschenko, A.A.; Chalikova, E.S. About the current state of some populations of the Tulipa greigii Regel in South Kazakhstan (O sovremennom sostoyanii nekotorykh populyatsiy Tulipa greigii Regel v Yuzhnom Kazakhstane). In Proceedings of the International Scientific and Practical Conference “Conservation of Biological Diversity and Development of a Network of Protected Areas”, Dedicated to the Anniversary of Doctor of Biological Sciences, Honorary Professor of KSPI T.M. Bragina, Kostanay, Kazakhstan, 26 February 2024; pp. 126–131, (In Russian with English Abstract). [Google Scholar]
- Ivaschenko, A.A. Quantitative indicators of teratological variability of Kazakhstan tulips in nature and culture. Mod. Phytomorphology 2014, 6, 151–154. [Google Scholar]
- Amalova, A.; Kurmanbayeva, M.; Turuspekov, Y.; Ivashchenko, A.; Abidkulova, K. Ontogenetic Structure of Cenopopulations of Tulipa Ostrowskiana Regel in Zailiysky Alatau. Eurasian J. Ecol. 2018, 56, 101–114. [Google Scholar] [CrossRef]
- Kuhara, T.; Nishikawa, T.; Sochacki, D.; Marasek-Ciolakowska, A.; Okazaki, K.; Yanagisawa, R. Phylogenetic analysis of wild and garden tulips using sequences of chloroplast DNA. In Proceedings of the XXIV International Eucarpia Symposium Section Ornamentals: Ornamental Breeding Worldwide, Warsaw, Poland, 2–5 September 2012; Volume 953, pp. 103–110. [Google Scholar]
- Turktas, M.; Metin, Ö.K.; Baştuğ, B.; Ertuğrul, F.; Sarac, Y.I.; Kaya, E. Molecular phylogenetic analysis of Tulipa (Liliaceae) based on noncoding plastid and nuclear DNA sequences with an emphasis on Turkey. Bot. J. Linn. Soc. 2013, 172, 270–279. [Google Scholar] [CrossRef]
- Ma, H.L.; Zhu, Z.B.; Zhang, X.M.; Miao, Y.Y.; Guo, Q.S. Species identification of the medicinal plant Tulipa edulis (Liliaceae) by DNA barcode marker. Biochem. Syst. Ecol. 2014, 55, 362–368. [Google Scholar] [CrossRef]
- Hajdari, A.; Pulaj, B.; Schmiderer, C.; Mala, X.; Lluga-Rizani, K.; Mustafa, B. Molecular phylogenetic analysis of wild Tulipa species (Liliaceae) present in Kosovo, based on plastid and nuclear DNA sequences. Authorea Prepr. 2020. [Google Scholar] [CrossRef]
- Eker, İ.; Tarıkahya Hacıoğlu, B.; Özgişi, K. Phylogeny and infrageneric classification of tulips. Plant Syst. Evol. 2024, 310, 23. [Google Scholar] [CrossRef]
- Douglas, S.E. Plastid evolution: Origins, diversity, trends. Curr. Opin. Genet. Dev. 1998, 8, 655–661. [Google Scholar] [CrossRef]
- Wang, W.; Lanfear, R. Long-reads reveal that the chloroplast genome exists in two distinct versions in most plants. Genome Biol. Evol. 2019, 11, 3372–3381. [Google Scholar] [CrossRef]
- Robbins, E.H.; Kelly, S. The evolutionary constraints on angiosperm chloroplast adaptation. Genome Biol. Evol. 2023, 15, evad101. [Google Scholar] [CrossRef]
- Jansen, R.K.; Cai, Z.; Raubeson, L.A.; Daniell, H.; Depamphilis, C.W.; Leebensmack, J.; Müller, K.F.; Guisingerbellian, M.; Haberle, R.C.; Hansen, A.K. Analysis of 81 genes from 64 plastid genomes resolves relationships in angiosperms and identifies genome-scale evolutionary patterns. Proc. Natl. Acad. Sci. USA 2007, 104, 19369–19374. [Google Scholar] [CrossRef]
- Ruhfel, B.R.; Gitzendanner, M.A.; Soltis, P.S.; Soltis, D.E.; Burleigh, J.G. From algae to angiosperms–inferring the phylogeny of green plants (Viridiplantae) from 360 plastid genomes. BMC Evol. Biol. 2014, 14, 23. [Google Scholar] [CrossRef] [PubMed]
- Xie, D.F.; Tan, J.B.; Yu, Y.; Gui, L.J.; Su, D.M.; Zhou, S.D.; He, X.J. Insights into phylogeny, age and evolution of Allium (Amaryllidaceae) based on the whole plastome sequences. Ann. Bot. 2020, 125, 1039–1055. [Google Scholar] [CrossRef]
- Hong, Z.; Wu, Z.; Zhao, K.; Yang, Z.; Zhang, N.; Guo, J.; Xu, D. Comparative analyses of five complete chloroplast genomes from the genus Pterocarpus (Fabacaeae). Int. J. Mol. Sci. 2020, 21, 3758. [Google Scholar] [CrossRef] [PubMed]
- Moghaddam, M.; Ohta, A.; Shimizu, M.; Terauchi, R.; Kazempour-Osaloo, S. The complete chloroplast genome of Onobrychis gaubae (Fabaceae-Papilionoideae): Comparative analysis with related IR-lacking clade species. BMC Plant Biol. 2022, 22, 75. [Google Scholar] [CrossRef] [PubMed]
- Zhou, J.T.; Yin, P.P.; Chen, Y.; Zhao, Y.P. The complete chloroplast genome of Tulipa altaica (Liliaceae), a wild relative of tulip. Mitochondrial DNA Part B 2019, 4, 2017–2018. [Google Scholar] [CrossRef]
- Ju, X.; Tang, N.; Shi, G.; Ye, R.; Hou, Z. Complete chloroplast genome of Tulipa buhseana (Liliaceae). Mitochondrial DNA Part B 2020, 5, 2360–2361. [Google Scholar] [CrossRef]
- Ju, X.; Shi, G.; Hou, Z.; Wu, C.; Liu, G.; Cao, C.; Tang, N. Characterization of the complete chloroplast genome of Tulipa iliensis (Liliaceae). Mitochondrial DNA Part B 2020, 5, 2362–2363. [Google Scholar] [CrossRef] [PubMed]
- Ju, X.; Shi, G.; Chen, S.; Dai, W.; He, T. Characterization and phylogenetic analysis of the complete chloroplast genome of Tulipa patens (Liliaceae). Mitochondrial DNA Part B 2021, 6, 2750–2751. [Google Scholar] [CrossRef]
- Yuan, L.; Yan, X.; Chen, X.; Zhu, X. The complete chloroplast genome of Tulipa gesneriana (Liliaceae) and its phylogenetic analysis. Mitochondrial DNA Part B 2022, 7, 1255–1256. [Google Scholar] [CrossRef]
- Xing, G.; Zhang, H.; Zhang, Y.; Lu, J.; Wu, T.; Tian, Z.; Qu, L. The complete chloroplast genome of Tulipa sinkiangensis ZM Mao (Liliaceae) with multi-flower. Mitochondrial DNA Part B 2023, 8, 45–47. [Google Scholar] [CrossRef] [PubMed]
- Li, J.; Price, M.; Su, D.M.; Zhang, Z.; Yu, Y.; Xie, D.F.; Gao, X.F. Phylogeny and comparative analysis for the plastid genomes of five Tulipa (Liliaceae). Biomed. Res. Int. 2021, 2021, 1–10. [Google Scholar] [CrossRef] [PubMed]
- Baitulin, I.O.; Sitpayeva, G.T. (Eds.) Red Book of Kazakhstan: Plants, 2nd ed.; LTD “Art-Print XXI”: Astana, Kazakhstan, 2014; Volume 2, Part 1; 452p. [Google Scholar]
- POWO. Plants of the World Online. Facilitated by the Royal Botanic Gardens, Kew. Published on the Internet. Available online: http://www.plantsoftheworldonline.org/ (accessed on 24 June 2024).
- Li, L.; Wu, Q.; Fang, L.; Wu, K.; Li, M.; Zeng, S. Comparative chloroplast genomics and phylogenetic analysis of Thuniopsis and closely related genera within Coelogyninae (Orchidaceae). Front. Genet. 2022, 13, 850201. [Google Scholar] [CrossRef] [PubMed]
- Zhang, D.; Tu, J.; Ding, X.; Guan, W.; Gong, L.; Qiu, X.; Su, H. Analysis of the chloroplast genome and phylogenetic evolution of Bidens pilosa. BMC Genom. 2023, 24, 113. [Google Scholar] [CrossRef] [PubMed]
- Li, W.; Yang, W.; Wang, X.J. Pseudogenes: Pseudo or real functional elements? J. Genet. Genom. 2013, 40, 171–177. [Google Scholar] [CrossRef] [PubMed]
- Liu, L.X.; Li, R.; Worth, J.R.; Li, X.; Li, P.; Cameron, K.M.; Fu, C.X. The complete chloroplast genome of Chinese bayberry (Morella rubra, Myricaceae): Implications for understanding the evolution of Fagales. Front. Plant Sci. 2017, 8, 968. [Google Scholar] [CrossRef] [PubMed]
- Ge, Y.; Dong, X.; Wu, B.; Wang, N.; Chen, D.; Chen, H.; Zhan, R. Evolutionary analysis of six chloroplast genomes from three Persea americana ecological races: Insights into sequence divergences and phylogenetic relationships. PLoS ONE 2019, 14, e0221827. [Google Scholar] [CrossRef]
- Pikunova, A.; Goryunova, S.; Golyaeva, O.; Dolzhikova, M.; Pavlenko, A.; Kurashev, O.; Goryunov, D. Plastome Data of Red Currant and Gooseberry Reveal Potential Taxonomical Issues within the Ribes Genus (Grossulariaceae). Horticulturae 2023, 9, 972. [Google Scholar] [CrossRef]
- Wicke, S.; Schneeweiss, G.M.; Depamphilis, C.W.; Müller, K.F.; Quandt, D. The evolution of the plastid chromosome in land plants: Gene content, gene order, gene function. Plant Mol. Biol. 2011, 76, 273–297. [Google Scholar] [CrossRef]
- Lu, R.S.; Yang, T.; Chen, Y.; Wang, S.Y.; Cai, M.Q.; Cameron, K.M.; Fu, C.X. Comparative plastome genomics and phylogenetic analyses of Liliaceae. Bot. J. Linn. Soc. 2021, 196, 279–293. [Google Scholar] [CrossRef]
- Li, P.; Lu, R.-S.; Xu, W.-Q.; Ohi-Toma, T.; Cai, M.-Q.; Qiu, Y.-X.; Cameron, K.M.; Fu, C.-X. Comparative Genomics and Phylogenomics of East Asian Tulips (Amana, Liliaceae). Front. Plant Sci. 2017, 8, 451. [Google Scholar] [CrossRef] [PubMed]
- Millen, R.S.; Olmstead, R.G.; Adams, K.L.; Palmer, J.D.; Lao, N.T.; Heggie, L.; Kavanagh, T.A.; Hibberd, J.M.; Gray, J.C.; Morden, C.W.; et al. Many parallel losses of infA from chloroplast DNA during angiosperm evolution with multiple independent transfers to the nucleus. Plant Cell 2001, 13, 645–658. [Google Scholar] [CrossRef] [PubMed]
- Kimura, M. The neutral theory of molecular evolution and the world view of the neutralists. Genome 1989, 31, 24–31. [Google Scholar] [CrossRef] [PubMed]
- Taheri, S.; Lee Abdullah, T.; Yusop, M.R.; Hanafi, M.M.; Sahebi, M.; Azizi, P.; Shamshiri, R.R. Mining and development of novel SSR markers using next generation sequencing (NGS) data in plants. Molecules 2018, 23, 399. [Google Scholar] [CrossRef] [PubMed]
- Almerekova, S.; Favarisova, N.; Turuspekov, Y.; Abugalieva, S. Cross-Genera Transferability of Microsatellite Markers and Phylogenetic Assessment of Three Salsola Species from Western Kazakhstan. Proc. Latv. Acad. Sci. B 2020, 74, 325–334. [Google Scholar] [CrossRef]
- Yermagambetova, M.; Almerekova, S.; Turginov, O.; Sultangaziev, O.; Abugalieva, S.; Turuspekov, Y. Genetic Diversity and Population Structure of Juniperus seravschanica Kom. Collected in Central Asia. Plants 2023, 12, 2961. [Google Scholar] [CrossRef] [PubMed]
- Kalia, R.K.; Rai, M.K.; Kalia, S.; Singh, R.; Dhawan, A.K. Microsatellite markers: An overview of the recent progress in plants. Euphytica 2011, 177, 309–334. [Google Scholar] [CrossRef]
- Cunha, C.P.; Resende, F.V.; Zucchi, M.I.; Pinheiro, J.B. SSR-based genetic diversity and structure of garlic accessions from Brazil. Genetica 2014, 142, 419e431. [Google Scholar] [CrossRef] [PubMed]
- Vasile, V.; Tîrziu, A.; Nicolae, E.; Ciucă, M.; Cornea, C.P. SSR markers are useful tools in wheat varietal purity and genetic diversity assessment. Seed Sci. Technol. 2023, 51, 145–156. [Google Scholar] [CrossRef]
- Almerekova, S.; Yermagambetova, M.; Osmonali, B.; Vesselova, P.; Abugalieva, S.; Turuspekov, Y. Characterization of the Plastid Genomes of Four Caroxylon Thunb. Species from Kazakhstan. Plants 2024, 13, 1332. [Google Scholar] [CrossRef]
- Kim, J.H.; Lee, S.I.; Kim, B.R.; Choi, I.Y.; Ryser, P.; Kim, N.S. Chloroplast genomes of Lilium lancifolium, L. amabile, L. callosum, and L. philadelphicum: Molecular characterization and their use in phylogenetic analysis in the genus Lilium and other allied genera in the order Liliales. PLoS ONE 2017, 12, e0186788. [Google Scholar] [CrossRef] [PubMed]
- Huang, J.; Yu, Y.; Liu, Y.M.; Xie, D.F.; He, X.J.; Zhou, S.D. Comparative chloroplast genomics of Fritillaria (Liliaceae), inferences for phylogenetic relationships between Fritillaria and Lilium and plastome evolution. Plants 2020, 9, 133. [Google Scholar] [CrossRef]
- Sheikh-Assadi, M.; Naderi, R.; Kafi, M.; Fatahi, R.; Salami, S.A.; Shariati, V. Complete chloroplast genome of Lilium ledebourii (Baker) Boiss and its comparative analysis: Lights into selective pressure and adaptive evolution. Sci. Rep. 2022, 12, 9375. [Google Scholar] [CrossRef]
- Fan, Z.F.; Ma, C.L. Comparative chloroplast genome and phylogenetic analyses of Chinese Polyspora. Sci. Rep. 2022, 12, 15984. [Google Scholar] [CrossRef] [PubMed]
- Temel, M.; Kaymaz, Y.; Ateş, D.; Kahraman, A.; Tanyolaç, M.B. The Complete Chloroplast Genome Sequence of Cicer bijugum, Genome Organization, and Comparison with Related Species. Curr. Genom. 2022, 23, 50. [Google Scholar] [CrossRef]
- Somaratne, Y.; Guan, D.L.; Wang, W.Q.; Zhao, L.; Xu, S.Q. The complete chloroplast genomes of two Lespedeza species: Insights into codon usage bias, RNA editing sites, and phylogenetic relationships in Desmodieae (Fabaceae: Papilionoideae). Plants 2019, 9, 51. [Google Scholar] [CrossRef]
- Ping, J.; Hao, J.; Wang, T.; Su, Y. Comparative analysis of plastid genomes reveals rearrangements, repetitive sequence features, and phylogeny in the Annonaceae. Front. Plant Sci. 2024, 15, 1351388. [Google Scholar] [CrossRef] [PubMed]
- Said, E.M.; Hassan, M.E. DNA barcodes in Egyptian olive cultivars (Olea europaea L.) using the rbcL and matK coding sequences. J. Crop Sci. Biotechnol 2023, 26, 447–456. [Google Scholar] [CrossRef]
- Manjarres-Hernández, E.H.; Morillo-Coronado, A.C. Phylogenetic Determination of Chenopodium quinoa Based on the Chloroplast Genes rbcL and matK. Int. J. Agron. 2023, 2023, 6681851. [Google Scholar] [CrossRef]
- Nadiya, F.; Aryasree, R.; Sreelekshmy, C.; Jinsha, P.T.; Nair, A.J.; Gangaprasad, A.; Rajalakshmi, R. Conservation and molecular identification of traditional rice varieties collected from Kerala using matK and rbcL DNA barcode markers. Ecol. Genet. Genom. 2023, 29, 100207. [Google Scholar] [CrossRef]
- Du, Y.; Bi, Y.; Yang, F.P.; Zhang, M.F.; Chen, X.Q.; Xue, J.; Zhang, X.H. Complete chloroplast genome sequences of Lilium: Insights into evolutionary dynamics and phylogenetic analyses. Sci. Rep. 2017, 7, 5751. [Google Scholar] [CrossRef] [PubMed]
- Almerekova, S.; Shchegoleva, N.; Abugalieva, S.; Turuspekov, Y. The molecular taxonomy of three endemic Central Asian species of Ranunculus (Ranunculaceae). PLoS ONE 2020, 15, e0240121. [Google Scholar] [CrossRef] [PubMed]
- Abugalieva, S.; Volkova, L.; Genievskaya, Y.; Ivaschenko, A.; Kotukhov, Y.; Sakauova, G.; Turuspekov, Y. Taxonomic assessment of Allium species from Kazakhstan based on ITS and matK markers. BMC Plant Biol. 2017, 17, 51–60. [Google Scholar] [CrossRef] [PubMed]
- Almerekova, S.; Mukhitdinov, N.; Abugalieva, S. Phylogenetic study of the endemic species Oxytropis almaatensis (Fabaceae) based on nuclear ribosomal DNA ITS sequences. BMC Plant Biol. 2017, 17, 173. [Google Scholar] [CrossRef] [PubMed]
- Wilson, B. Tulipa: The Taxonomy and Evolutionary History of the Genus and Its Impact on Conservation Priorities in Central Asia. Ph.D. Thesis, University of Cambridge, Cambridge, UK, 2023; p. 276. [Google Scholar]
- Doyle, J.J.; Doyle, J.L. A rapid DNA isolation procedure for small quantities of fresh leaf tissue. Phytochem. Bull. 1987, 19, 11–15. [Google Scholar]
- Almerekova, S.; Yermagambetova, M.; Abugalieva, S.; Turuspekov, Y. The complete chloroplast genome sequencing data of Juniperus sabina L. (Cupressaceae Bartl.) from Kazakhstan. Data Brief 2022, 45, 108644. [Google Scholar] [CrossRef] [PubMed]
- Yermagambetova, M.; Abugalieva, S.; Turuspekov, Y.; Almerekova, S. Illumina sequencing data of the complete chloroplast genome of rare species Juniperus seravschanica (Cupressaceae) from Kazakhstan. Data Brief 2023, 46, 108866. [Google Scholar] [CrossRef] [PubMed]
- Almerekova, S.; Yermagambetova, M.; Jumanov, S.; Abugalieva, S.; Turuspekov, Y. Comparative analysis of chloroplast genomes of seven Juniperus species from Kazakhstan. PLoS ONE 2024, 19, e0295550. [Google Scholar] [CrossRef] [PubMed]
- Bolger, A.M.; Lohse, M.; Usadel, B. Trimmomatic: A flexible trimmer for Illumina sequence data. Bioinformatics 2014, 30, 2114–2120. [Google Scholar] [CrossRef] [PubMed]
- Dierckxsens, N.; Mardulyn, P.; Smits, G. NOVOPlasty: De novo assembly of organelle genomes from whole genome data. Nucleic Acids Res. 2016, 45, e18. [Google Scholar] [CrossRef]
- Tillich, M.; Lehwark, P.; Pellizzer, T.; Ulbricht-Jones, E.S.; Fischer, A.; Bock, R.; Greiner, S. GeSeq—Versatile and accurate annotation of organelle genomes. Nucleic Acids Res. 2017, 45, W6–W11. [Google Scholar] [CrossRef]
- Qu, X.J.; Moore, M.J.; Li, D.Z.; Yi, T.S. PGA: A software package for rapid, accurate, and flexible batch annotation of plastomes. Plant Methods 2019, 15, 50. [Google Scholar] [CrossRef]
- Lohse, M.; Drechsel, O.; Bock, R. Organellar Genome DRAW (OGDRAW): A tool for the easy generation of high-quality custom graphical maps of plastid and mitochondrial genomes. Curr. Genet. 2007, 52, 267–274. [Google Scholar] [CrossRef]
- Benson, G. Tandem repeats finder: A program to analyze DNA sequences. Nucleic Acids Res. 1999, 27, 573–580. [Google Scholar] [CrossRef]
- Kurtz, S.; Choudhuri, J.V.; Ohlebusch, E.; Schleiermacher, C.; Stoye, J.; Giegerich, R. REPuter: The manifold applications of repeat analysis on a genomic scale. Nucleic Acids Res. 2001, 29, 4633–4642. [Google Scholar] [CrossRef]
- Beier, S.; Thiel, T.; Münch, T.; Scholz, U.; Mascher, M. MISA-web: A web server for microsatellite prediction. Bioinformatics 2017, 33, 2583–2585. [Google Scholar] [CrossRef] [PubMed]
- Librado, P.; Rozas, J. DnaSP v5: A software for comprehensive analysis of DNA polymorphism data. Bioinformatics 2009, 25, 1451–1452. [Google Scholar] [CrossRef] [PubMed]
- Amiryousefi, A.; Hyvönen, J.; Poczai, P. IRscope: An online program to visualize the junction sites of chloroplast genomes. Bioinformatics 2018, 34, 3030–3031. [Google Scholar] [CrossRef] [PubMed]
- Nguyen, L.T.; Schmidt, H.A.; von Haeseler, A.; Minh, B.Q. IQ-TREE: A fast and effective stochastic algorithm for estimating maximum-likelihood phylogenies. Mol. Biol. Evol. 2015, 32, 268–274. [Google Scholar] [CrossRef]
- Ronquist, F.; Teslenko, M.; van der Mark, P.; Ayres, D.L.; Darling, A.; Höhna, S.; Larget, B.; Liu, L.; Suchard, M.A.; Huelsenbeck, J.P. MrBayes 3.2: Efficient Bayesian Phylogenetic Inference and Model Choice Across a Large Model Space. Syst. Biol. 2012, 61, 539–542. [Google Scholar] [CrossRef]


Disclaimer/Publisher’s Note: The statements, opinions and data contained in all publications are solely those of the individual author(s) and contributor(s) and not of MDPI and/or the editor(s). MDPI and/or the editor(s) disclaim responsibility for any injury to people or property resulting from any ideas, methods, instructions or products referred to in the content. |
© 2024 by the authors. Licensee MDPI, Basel, Switzerland. This article is an open access article distributed under the terms and conditions of the Creative Commons Attribution (CC BY) license (https://creativecommons.org/licenses/by/4.0/).