
Disparities in Genetic Diversity Drive the Population Displacement of Two Invasive Cryptic Species of the Bemisia tabaci Complex in China
 ,
,  and
and 
Abstract
:1. Introduction
2. Results
2.1. Genetic Diversity
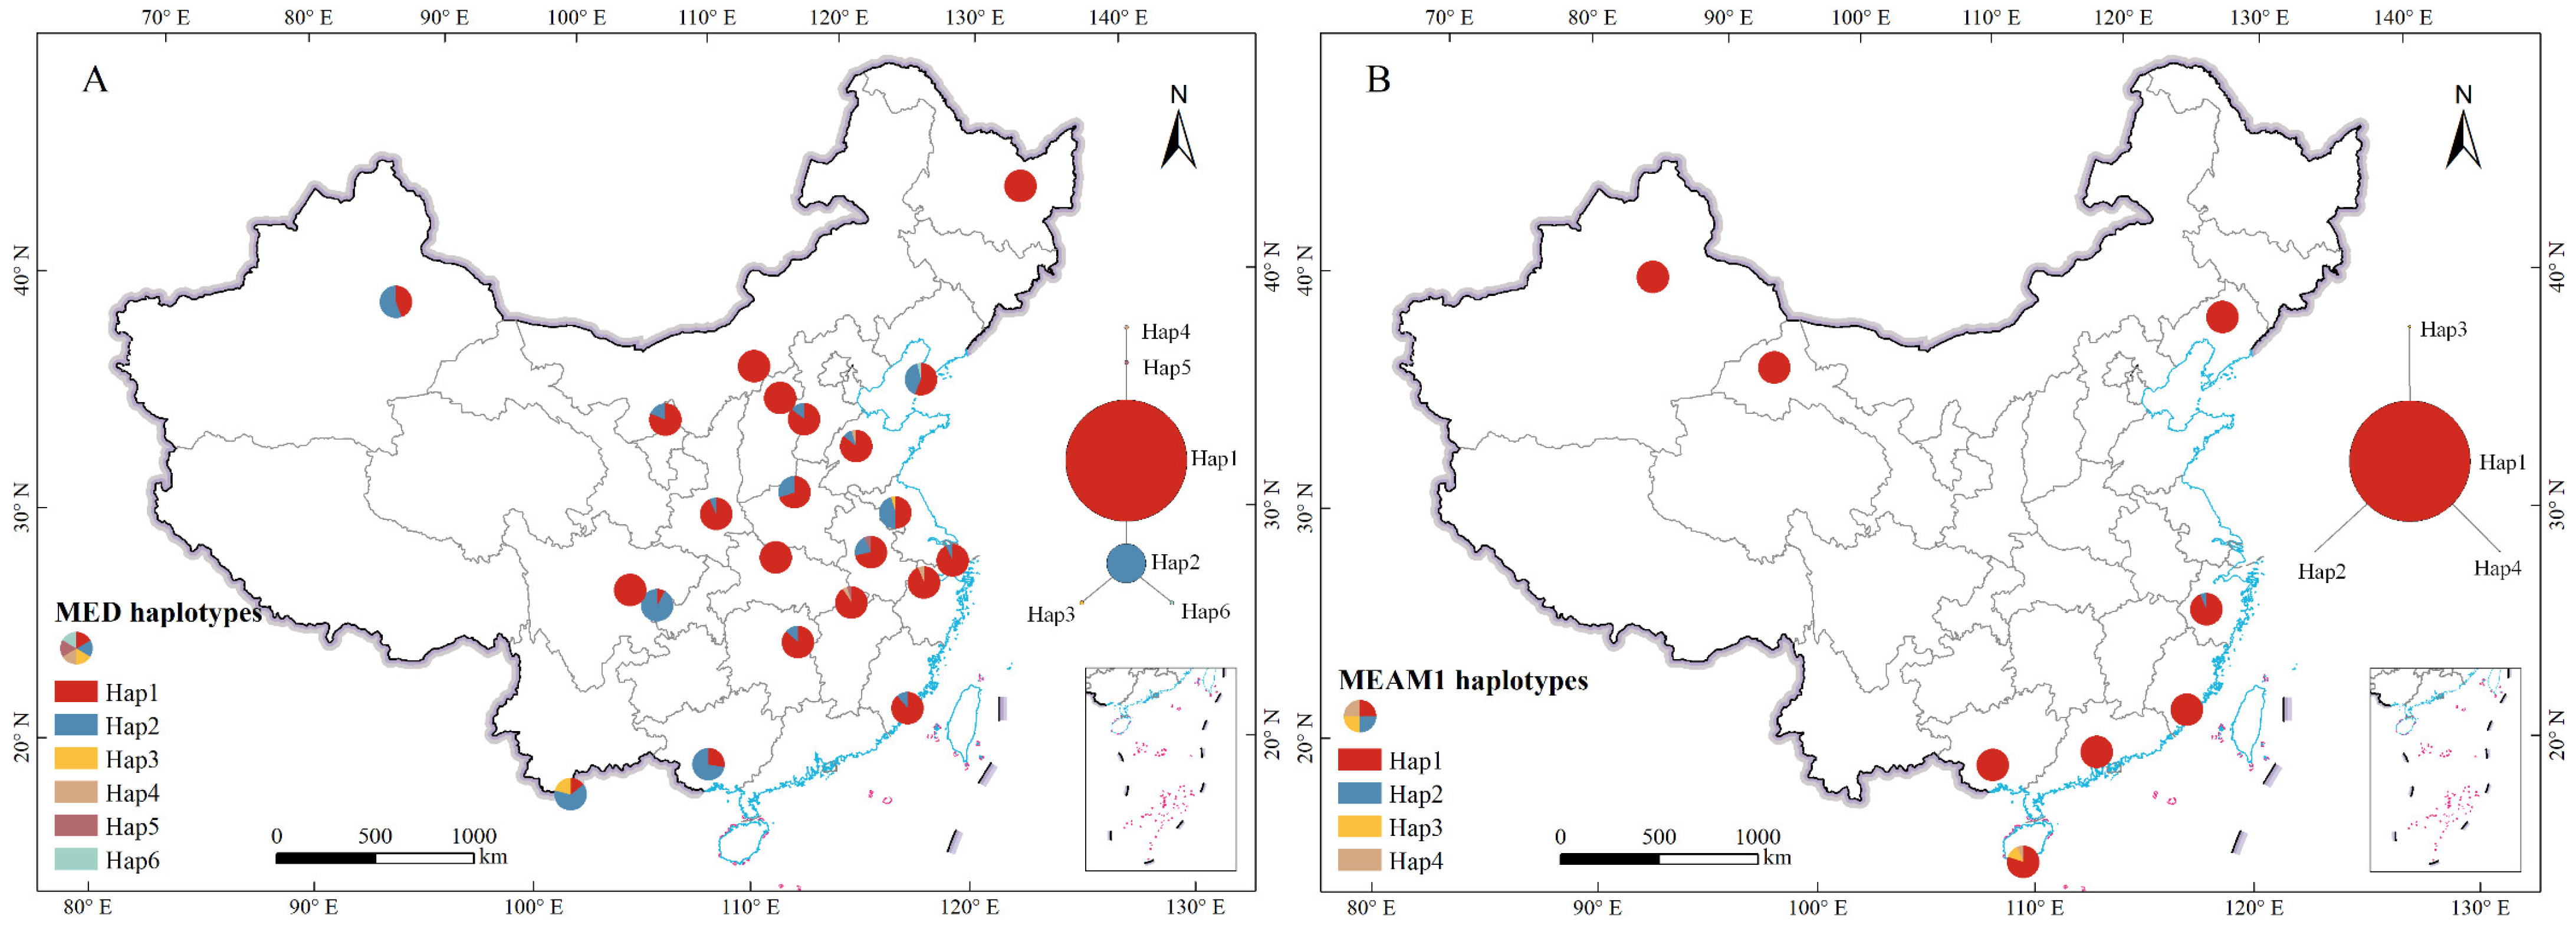
2.2. Haplotype Network
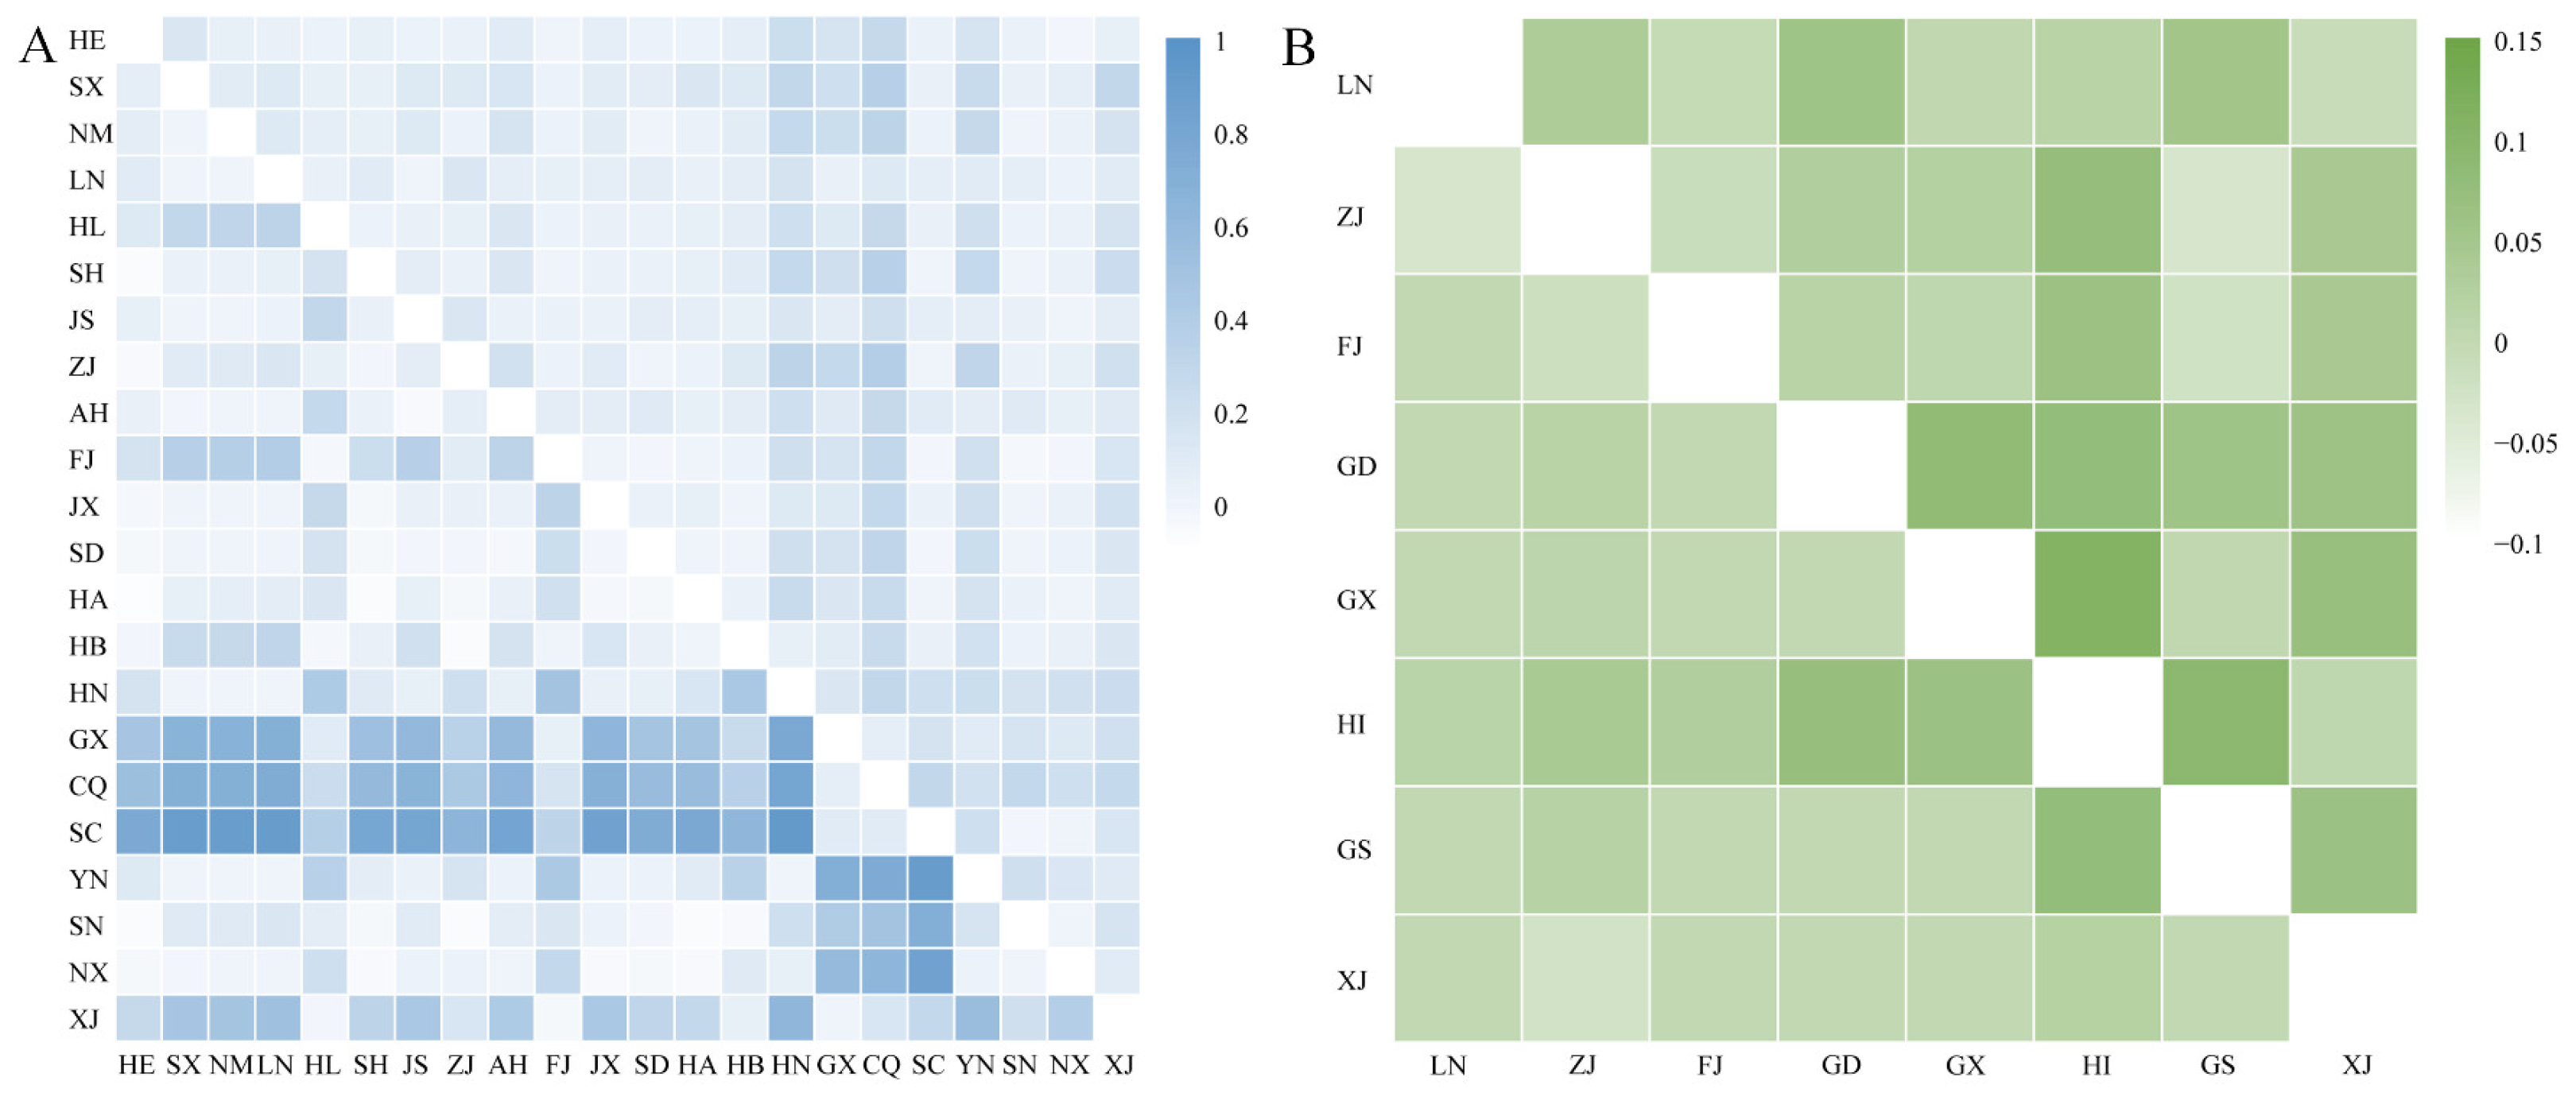
2.3. Genetic Differentiation
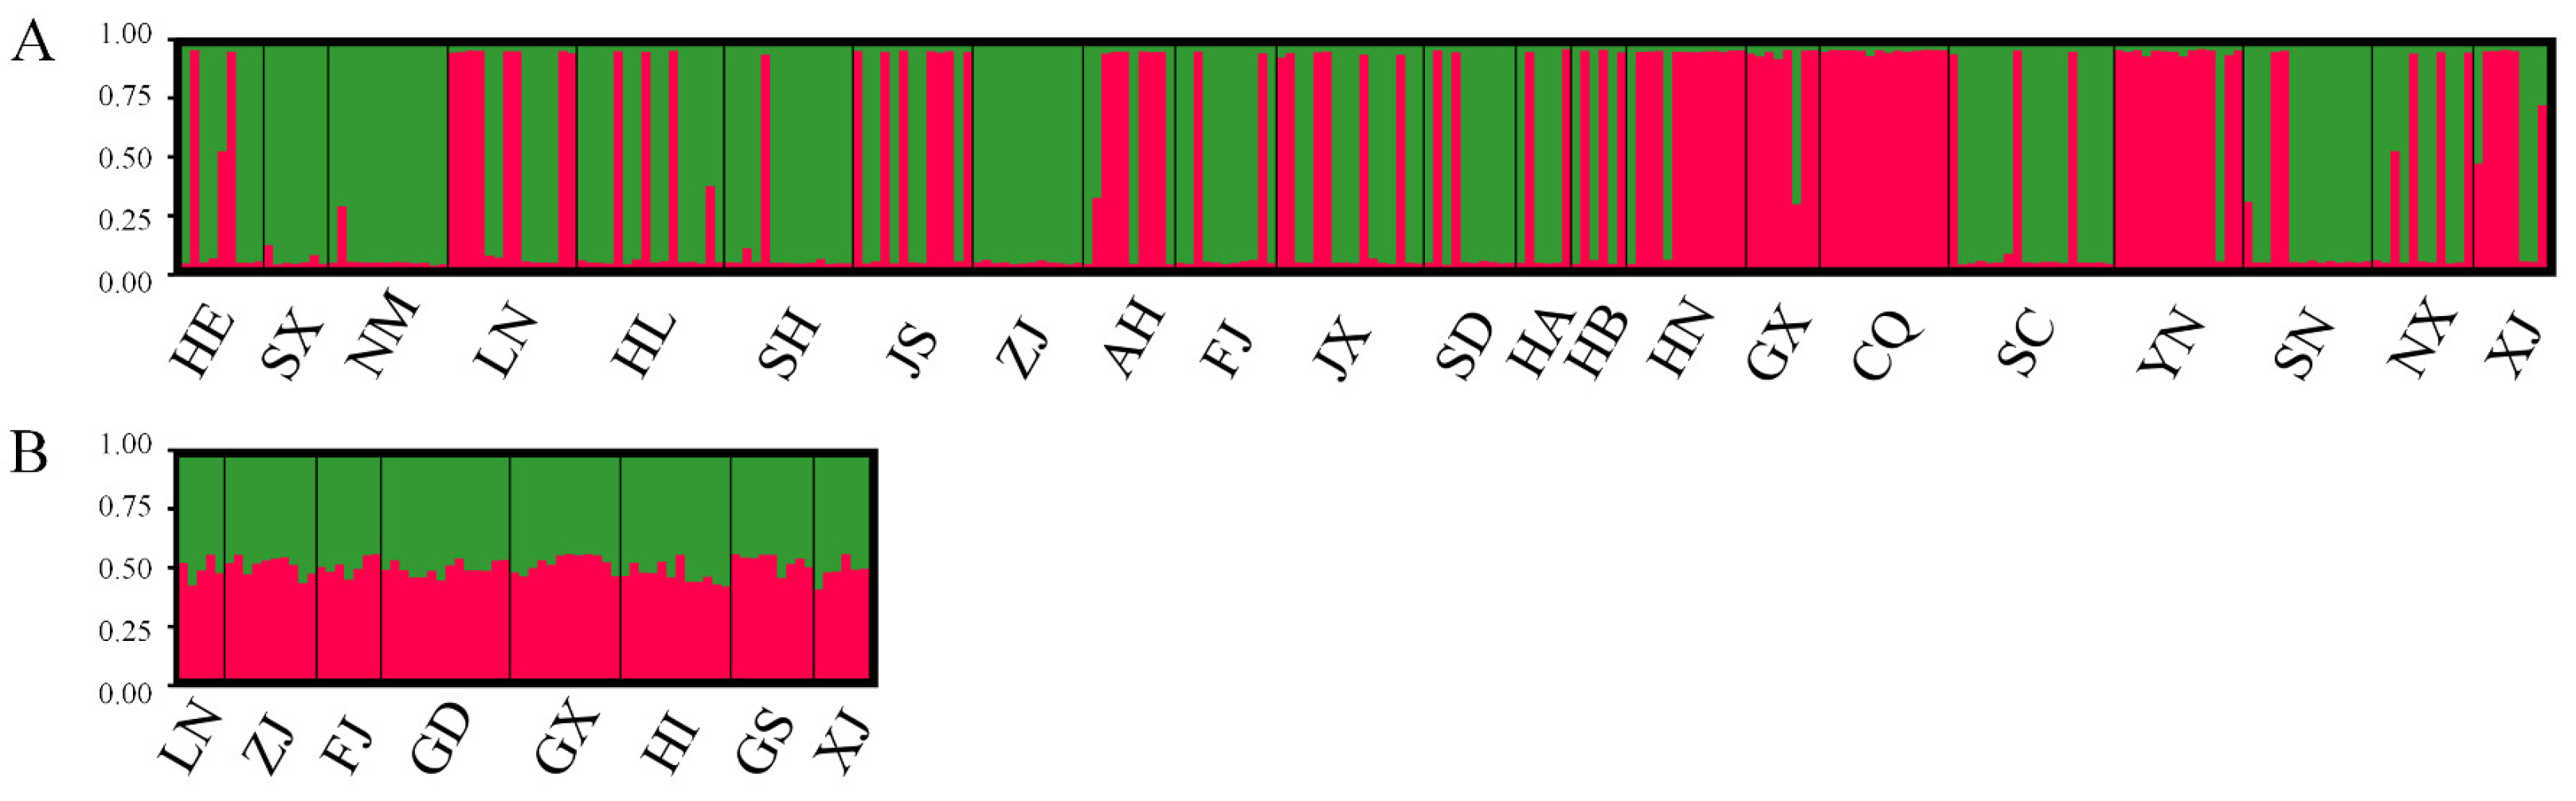
2.4. Population Genetic Structure
3. Discussion
4. Materials and Methods
4.1. Sample Collection and Identification
4.2. Mitochondrial DNA Amplification and Sequencing
4.3. Microsatellite Amplification and Genotyping
4.4. Mitochondrial Data Analyses
4.5. Microsatellite Data Analyses
Author Contributions
Funding
Institutional Review Board Statement
Informed Consent Statement
Data Availability Statement
Conflicts of Interest
References
- Jeschke, J.M.; Bacher, S.; Blackburn, T.M.; Dick, J.T.A.; Essl, F.; Evans, T.; Gaertner, M.; Hulme, P.E.; Kühn, I.; Mrugala, A.; et al. Defining the Impact of Non-Native Species. Conserv. Biol. 2014, 28, 1188–1194. [Google Scholar] [CrossRef] [PubMed]
- Gao, Y.L.; Reitz, S.R. Emerging Themes in Our Understanding of Species Displacements. Annu. Rev. Entomol. 2017, 62, 165–183. [Google Scholar] [CrossRef] [PubMed]
- Ellegren, H.; Galtier, N. Determinants of genetic diversity. Nat. Rev. Genet. 2016, 17, 422–433. [Google Scholar] [CrossRef] [PubMed]
- He, Z.Z.; Stotz, G.C.; Liu, X.; Liu, J.J.; Wang, Y.G.; Yang, J.; Li, L.F.; Zhang, W.J.; Nan, P.; Song, Z.P. A global synthesis of the patterns of genetic diversity in endangered and invasive plants. Biol. Conserv. 2024, 291, 110473. [Google Scholar] [CrossRef]
- Miura, O. Molecular genetic approaches to elucidate the ecological and evolutionary issues associated with biological invasions. Ecol. Res. 2007, 22, 876–883. [Google Scholar] [CrossRef]
- De Barro, P.J.; Liu, S.S.; Boykin, L.M.; Dinsdale, A.B. Bemisia tabaci: A Statement of Species Status. Annu. Rev. Entomol. 2011, 56, 1–19. [Google Scholar] [CrossRef] [PubMed]
- Wang, X.W.; Li, P.; Liu, S.S. Whitefly interactions with plants. Curr. Opin. Insect Sci. 2017, 19, 70–75. [Google Scholar] [CrossRef] [PubMed]
- Jones, D.R. Plant viruses transmitted by whiteflies. Eur. J. Plant Pathol. 2003, 109, 195–219. [Google Scholar] [CrossRef]
- Kanakala, S.; Ghanim, M. Global genetic diversity and geographical distribution of Bemisia tabaci and its bacterial endosymbionts. PLoS ONE 2019, 14, e0213946. [Google Scholar] [CrossRef] [PubMed]
- Wang, H.L.; Lei, T.; Wang, X.W.; Cameron, S.; Navas-Castillo, J.; Liu, Y.Q.; Maruthi, M.N.; Omongo, C.A.; Delatte, H.; Lee, K.Y.; et al. A comprehensive framework for the delimitation of species within the Bemisia tabaci cryptic complex, a global pest-species group. Insect Sci. 2024, 0, 1–22. [Google Scholar] [CrossRef] [PubMed]
- Xue, Y.T.; Lin, C.T.; Wang, Y.Z.; Zhang, Y.B.; Ji, L.Q. Ecological niche complexity of invasive and native cryptic species of the Bemisia tabaci species complex in China. J. Pest Sci. 2022, 95, 1245–1259. [Google Scholar] [CrossRef]
- Wang, H.L.; Lei, T.; Xia, W.Q.; Cameron, S.L.; Liu, Y.Q.; Zhang, Z.; Gowda, M.M.N.; Navas-Castillo, J.; Omongo, C.A.; Delatte, H.; et al. Insight into the microbial world of Bemisia tabaci cryptic species complex and its relationships with its host. Sci. Rep. 2019, 9, 6568. [Google Scholar] [CrossRef]
- Horowitz, A.R.; Ghanim, M.; Roditakis, E.; Nauen, R.; Ishaaya, I. Insecticide resistance and its management in Bemisia tabaci species. J. Pest Sci. 2020, 93, 893–910. [Google Scholar] [CrossRef]
- Campbell, L.I.; Nwezeobi, J.; van Brunschot, S.L.; Kaweesi, T.; Seal, S.E.; Swamy, R.A.R.; Namuddu, A.; Maslen, G.L.; Mugerwa, H.; Armean, I.M.; et al. Comparative evolutionary analyses of eight whitefly Bemisia tabaci sensu lato genomes: Cryptic species, agricultural pests and plant-virus vectors. BMC Genom. 2023, 24, 408. [Google Scholar] [CrossRef] [PubMed]
- Li, H.R.; Wang, J.C.; Peng, Y.; Guo, C.L.; Qu, W.M.; Yang, N.; Zhu, Y.Z.; Jeong, I.; Li, X.C.; Ghanim, M.; et al. Invasion genomics uncover complex introduction patterns of the globally invasive whitefly, Bemisia tabaci MED. Divers. Distrib. 2023, 29, 1172–1189. [Google Scholar] [CrossRef]
- Xia, J.X.; Guo, Z.J.; Yang, Z.Z.; Han, H.L.; Wang, S.L.; Xu, H.F.; Yang, X.; Yang, F.S.; Wu, Q.J.; Xie, W.; et al. Whitefly hijacks a plant detoxification gene that neutralizes plant toxins. Cell 2021, 184, 1693–1705.e1617. [Google Scholar] [CrossRef] [PubMed]
- Xue, Y.T.; Lin, C.T.; Wang, Y.Z.; Liu, W.X.; Wan, F.H.; Zhang, Y.B.; Ji, L.Q. Predicting Climate Change Effects on the Potential Distribution of Two Invasive Cryptic Species of the Bemisia tabaci Species Complex in China. Insects 2022, 13, 1081. [Google Scholar] [CrossRef] [PubMed]
- Luo, C.; Yao, Y.; Wang, R.; Yan, F.; Hu, D.; Zhang, Z. The use of mitochondrial cytochrome oxidase I (mt CO I) gene sequences for the identification of biotypes of Bemisia tabaci (Gennadius) in China. Acta Entomol. Sin. 2002, 45, 759–763, (In Chinese with English abstract). [Google Scholar]
- Chu, D.; Zhang, Y.J.; Brown, J.K.; Cong, B.; Xu, B.Y.; Wu, Q.J.; Zhu, G.R. The introduction of the exotic Q biotype of Bemisia tabaci from the Mediterranean region into China on ornamental crops. Fla. Entomol. 2006, 89, 168–174. [Google Scholar] [CrossRef]
- Guo, C.L.; Zhu, Y.Z.; Zhang, Y.J.; Keller, M.A.; Liu, T.X.; Chu, D. Invasion Biology and Management of Sweetpotato Whitefly (Hemiptera: Aleyrodidae) in China. J. Integr. Pest Manag. 2021, 12, 1–16. [Google Scholar] [CrossRef]
- Liu, B.M.; Yan, F.M.; Chu, D.; Pan, H.P.; Jiao, X.G.; Xie, W.; Wu, Q.J.; Wang, S.L.; Xu, B.Y.; Zhou, X.G.; et al. Difference in Feeding Behaviors of Two Invasive Whiteflies on Host Plants with Different Suitability: Implication for Competitive Displacement. Int. J. Biol. Sci. 2012, 8, 697–706. [Google Scholar] [CrossRef] [PubMed]
- Sun, D.B.; Liu, Y.Q.; Qin, L.; Xu, J.; Li, F.F.; Liu, S.S. Competitive displacement between two invasive whiteflies: Insecticide application and host plant effects. Bull. Entomol. Res. 2013, 103, 344–353. [Google Scholar] [CrossRef] [PubMed]
- Xiao, N.; Pan, L.L.; Zhang, C.R.; Shan, H.W.; Liu, S.S. Differential tolerance capacity to unfavourable low and high temperatures between two invasive whiteflies. Sci. Rep. 2016, 6, 24306. [Google Scholar] [CrossRef] [PubMed]
- Kirk, H.; Dorn, S.; Mazzi, D. Molecular genetics and genomics generate new insights into invertebrate pest invasions. Evol. Appl. 2013, 6, 842–856. [Google Scholar] [CrossRef] [PubMed]
- Fang, Y.; Chen, J.; Ruan, H.H.; Xu, N.; Que, Z.T.; Liu, H.Y. Genetic Diversity and Population Structure of Metaphire vulgaris Based on the Mitochondrial COI Gene and Microsatellites. Front. Genet. 2021, 12, 686246. [Google Scholar] [CrossRef]
- Hadjistylli, M.; Roderick, G.K.; Brown, J.K. Global Population Structure of a Worldwide Pest and Virus Vector: Genetic Diversity and Population History of the Bemisia tabaci Sibling Species Group. PLoS ONE 2016, 11, e0165105. [Google Scholar] [CrossRef] [PubMed]
- Lestari, S.M.; Khatun, M.F.; Acharya, R.; Sharma, S.R.; Shrestha, Y.K.; Jahan, S.M.H.; Aye, T.-T.; Lynn, O.M.; Win, N.K.K.; Hoat, T.X.; et al. Genetic diversity of cryptic species of Bemisia tabaci in Asia. Arch. Insect Biochem. Physiol. 2022, 112, e21981. [Google Scholar] [CrossRef]
- Jia, Z.Z.; Fu, K.Y.; Guo, W.C.; Jiang, W.H.; Ahmat, T.; Ding, X.H.; He, J.; Wang, X.W. CAP Analysis of the Distribution of the Introduced Bemisia tabaci (Hemiptera: Aleyrodidae) Species Complex in Xinjiang, China and the Southerly Expansion of the Mediterranean Species. J. Insect Sci. 2021, 21, 14. [Google Scholar] [CrossRef] [PubMed]
- Dickey, A.M.; Osborne, L.S.; Shatters Jr, R.G.; Hall, P.A.; McKenzie, C.L. Population genetics of invasive Bemisia tabaci (Hemiptera: Aleyrodidae) cryptic species in the United States based on microsatellite markers. J. Econ. Entomol. 2013, 106, 1355–1364. [Google Scholar] [CrossRef] [PubMed]
- Tsagkarakou, A.; Tsigenopoulos, C.S.; Gorman, K.; Lagnel, J.; Bedford, I.D. Biotype status and genetic polymorphism of the whitefly Bemisia tabaci (Hemiptera: Aleyrodidae) in Greece: Mitochondrial DNA and microsatellites. Bull. Entomol. Res. 2007, 97, 29–40. [Google Scholar] [CrossRef] [PubMed]
- Díaz, F.; Endersby, N.M.; Hoffmann, A.A. Genetic structure of the whitefly Bemisia tabaci populations in Colombia following a recent invasion. Insect Sci. 2015, 22, 483–494. [Google Scholar] [CrossRef] [PubMed]
- Chu, D.; Gao, C.S.; De Barro, P.; Wan, F.H.; Zhang, Y.J. Investigation of the genetic diversity of an invasive whitefly (Bemisia tabaci) in China using both mitochondrial and nuclear DNA markers. Bull. Entomol. Res. 2011, 101, 467–475. [Google Scholar] [CrossRef] [PubMed]
- Brown, J.K.; Paredes-Montero, J.R.; Stocks, I.C. The Bemisia tabaci cryptic (sibling) species group—Imperative for a taxonomic reassessment. Curr. Opin. Insect Sci. 2023, 57, 101032. [Google Scholar] [CrossRef] [PubMed]
- Tang, X.T.; Cai, L.; Shen, Y.; Xu, L.L.; Du, Y.Z. Competitive Displacement between Bemisia tabaci MEAM1 and MED and Evidence for Multiple Invasions of MED. Insects 2020, 11, 35. [Google Scholar] [CrossRef] [PubMed]
- Gautam, S.; Crossley, M.S.; Dutta, B.; Coolong, T.; Simmons, A.M.; da Silva, A.; Snyder, W.E.; Srinivasan, R. Low Genetic Variability in Bemisia tabaci MEAM1 Populations within Farmscapes of Georgia, USA. Insects 2020, 11, 834. [Google Scholar] [CrossRef] [PubMed]
- Wang, H.L.; Yang, J.; Boykin, L.M.; Zhao, Q.Y.; Wang, Y.J.; Liu, S.S.; Wang, X.W. Developing conversed microsatellite markers and their implications in evolutionary analysis of the Bemisia tabaci complex. Sci. Rep. 2014, 4, 6351. [Google Scholar] [CrossRef] [PubMed]
- Li, H.R.; Pan, H.P.; Tao, Y.L.; Zhang, Y.J.; Chu, D. Population genetics of an alien whitefly in China: Implications for its dispersal and invasion success. Sci. Rep. 2017, 7, 2228. [Google Scholar] [CrossRef] [PubMed]
- Chu, D.; Wan, F.H.; Tao, Y.L.; Liu, G.X.; Fan, Z.X.; Bi, Y.P. Genetic differentiation of Bemisia tabaci (Gennadius) (Hemiptera: Aleyrodidae) biotype Q based on mitochondrial DNA markers. Insect Sci. 2008, 15, 115–123. [Google Scholar] [CrossRef]
- Simón, B.; Cenis, J.L.; De La Rúa, P. Distribution patterns of the Q and B biotypes of Bemisia tabaci in the Mediterranean Basin based on microsatellite variation. Entomol. Exp. Appl. 2007, 124, 327–336. [Google Scholar] [CrossRef]
- Tsutsui, N.D.; Suarez, A.V.; Holway, D.A.; Case, T.J. Reduced genetic variation and the success of an invasive species. Proc. Natl. Acad. Sci. USA 2000, 97, 5948–5953. [Google Scholar] [CrossRef] [PubMed]
- Brévault, T.; Carletto, J.; Tribot, J.; Vanlerberghe-Masutti, F. Insecticide use and competition shape the genetic diversity of the aphid Aphis gossypii in a cotton-growing landscape. Bull. Entomol. Res. 2011, 101, 407–413. [Google Scholar] [CrossRef] [PubMed]
- Wang, Q.; Luo, C.; Wang, R. Insecticide Resistance and Its Management in Two Invasive Cryptic Species of Bemisia tabaci in China. Int. J. Mol. Sci. 2023, 24, 6048. [Google Scholar] [CrossRef] [PubMed]
- Chu, D.; Chen, G.F.; Xu, B.Y.; Wu, Q.J.; Zhang, Y.J. RAPD analysis of population genetic structure of Bemisia tabaci biotype B and biotype Q. Acta Entomol. Sin. 2007, 50, 264–270, (In Chinese with English abstract). [Google Scholar]
- Guo, X.J.; Rao, Q.; Zhang, F.; Luo, C.; Zhang, H.Y.; Gao, X.W. Diversity and Genetic Differentiation of the Whitefly Bemisia tabaci Species Complex in China Based on mtCOI and cDNA-AFLP Analysis. J. Integr. Agric. 2012, 11, 206–214. [Google Scholar] [CrossRef]
- Sun, D.B.; Li, J.; Liu, Y.Q.; Crowder, D.W.; Liu, S.S. Effects of reproductive interference on the competitive displacement between two invasive whiteflies. Bull. Entomol. Res. 2014, 104, 334–346. [Google Scholar] [CrossRef] [PubMed]
- De Barro, P.J.; Scott, K.D.; Graham, G.C.; Lange, C.L.; Schutze, M.K. Isolation and characterization of microsatellite loci in Bemisia tabaci. Mol. Ecol. Notes 2003, 3, 40–43. [Google Scholar] [CrossRef]
- Higgins, D.; Thompson, J.; Gibson, T. CLUSTAL W: Improving the sensitivity of progressive multiple sequence alignment through sequence weighting, position-specific gap penalties and weight matrix choice. Nucleic Acids Res. 1994, 22, 4673–4680. [Google Scholar] [CrossRef]
- Kumar, S.; Stecher, G.; Li, M.; Knyaz, C.; Tamura, K. MEGA X: Molecular Evolutionary Genetics Analysis across Computing Platforms. Mol. Biol. Evol. 2018, 35, 1547–1549. [Google Scholar] [CrossRef]
- Rozas, J.; Ferrer-Mata, A.; Sanchez-DelBarrio, J.C.; Guirao-Rico, S.; Librado, P.; Ramos-Onsins, S.E.; Sanchez-Gracia, A. DnaSP 6: DNA Sequence Polymorphism Analysis of Large Data Sets. Mol. Biol. Evol. 2017, 34, 3299–3302. [Google Scholar] [CrossRef] [PubMed]
- Bandelt, H.J.; Forster, P.; Rohl, A. Median-joining networks for inferring intraspecific phylogenies. Mol. Biol. Evol. 1999, 16, 37–48. [Google Scholar] [CrossRef] [PubMed]
- Excoffier, L.; Lischer, H.E.L. Arlequin suite ver 3.5: A new series of programs to perform population genetics analyses under Linux and Windows. Mol. Ecol. Resour. 2010, 10, 564–567. [Google Scholar] [CrossRef] [PubMed]
- Van Oosterhout, C.; Hutchinson, W.F.; Wills, D.P.M.; Shipley, P. MICRO-CHECKER: Software for identifying and correcting genotyping errors in microsatellite data. Mol. Ecol. Notes 2004, 4, 535–538. [Google Scholar] [CrossRef]
- Rousset, F. GENEPOP’007: A complete re-implementation of the GENEPOP software for Windows and Linux. Mol. Ecol. Resour. 2008, 8, 103–106. [Google Scholar] [CrossRef]
- Goudet, J. FSTAT (Version 1.2): A computer program to calculate F-statistics. J. Hered. 1995, 86, 485–486. [Google Scholar] [CrossRef]
- Yeh, F.; Yang, R.; Boyle, T. POPGENE, Version 1.32 Microsoft Windows-based freeware for populations genetic analysis; University of Alberta: Edmonton, AB, Canada, 1999. [Google Scholar]
- Pritchard, J.K.; Stephens, M.; Donnelly, P. Inference of population structure using multilocus genotype data. Genetics 2000, 155, 945–959. [Google Scholar] [CrossRef] [PubMed]
- Jakobsson, M.; Rosenberg, N.A. CLUMPP: A cluster matching and permutation program for dealing with label switching and multimodality in analysis of population structure. Bioinformatics 2007, 23, 1801–1806. [Google Scholar] [CrossRef] [PubMed]
- Rosenberg, N.A. DISTRUCT: A program for the graphical display of population structure. Mol. Ecol. Notes 2004, 4, 137–138. [Google Scholar] [CrossRef]


| Cryptic Species | Population Code | Collection Location | Coordinates |
|---|---|---|---|
| MED | HE | Hebei, Shijiazhuang | 38°10′ N, 114°30′ E |
| SX | Shanxi, Xinzhou | 39°11′ N, 113°15′ E | |
| NM | Inner Mongolia, Hohhot | 40°42′ N, 111°50′ E | |
| LN | Liaoning, Dalian | 39°14′ N, 121°43′ E | |
| HL | Heilongjiang, Mudanjiang | 46°48′ N, 130°24′ E | |
| SH | Shanghai, Pudong | 30°59′ N, 121°46′ E | |
| JS | Jiangsu, Huaian | 33°30′ N, 119°06′ E | |
| ZJ | Zhejiang, Hangzhou | 30°12′ N, 120°05′ E | |
| AH | Anhui, Hefei | 31°53′ N, 117°28′ E | |
| FJ | Fujian, Xiamen | 24°39′ N, 118°18′ E | |
| JX | Jiangxi, Jiujiang | 29°44′ N, 116°7′ E | |
| SD | Shandong, Jinan | 36°41′ N, 117°23′ E | |
| HA | Henan, Zhengzhou | 34°55′ N, 113°36′ E | |
| HB | Hubei, Xiangyang | 32°05′ N, 112°17′ E | |
| HN | Hunan, Changsha | 28°10′ N, 113°07′ E | |
| GX | Guangxi, Nanning | 23°43′ N, 106°48′ E | |
| CQ | Chongqing city, Tongnan | 30°04′ N, 105°49′ E | |
| SC | Sichuan, Chengdu | 30°49′ N, 104°21′ E | |
| YN | Yunnan, Xishuangbanna | 21°27′ N, 101°34′ E | |
| SN | Shaanxi, Xi’an | 34°10′ N, 109°08′ E | |
| NX | Ningxia, Yinchuan | 38°28′ N, 106°22′ E | |
| XJ | Xinjiang, Urumqi | 43°49′ N, 87°34′ E | |
| MEAM1 | LN | Liaoning, Shenyang | 41°51′ N, 123°25′ E |
| ZJ | Zhejiang, Jinhua | 29°05′ N, 119°39′ E | |
| FJ | Fujian, Xiamen | 24°39′ N, 118°18′ E | |
| GD | Guangdong, Guangzhou | 23°09′ N, 113°23′ E | |
| GX | Guangxi, Nanning | 23°43′ N, 106°48′ E | |
| HI | Hainan, Sanya | 18°18′ N, 109°32′ E | |
| GS | Gansu, Jiuquan | 40°31′ N, 95°47′ E | |
| XJ | Xinjiang, Urumqi | 43°49′ N, 87°34′ E |
| Cryptic Species | Population | Mitochondrial COI | Microsatellites | ||||||||||||
|---|---|---|---|---|---|---|---|---|---|---|---|---|---|---|---|
| h | Hd | π | k | Tajima’s D | Fu’s F | Na | Ne | I | Ho | He | FIS | p Value (HWE) | |||
| MED | HE | 2 | 0.264 | 0.00035 | 0.264 | −0.341 | 0.186 | 3.0 | 1.673 | 0.620 | 0.311 | 0.342 | 0.148 | 0.281 | |
| SX | 1 | — | — | — | — | — | 2.6 | 1.993 | 0.608 | 0.314 | 0.341 | 0.154 | 0.400 | ||
| NM | 1 | — | — | — | — | — | 3.0 | 2.038 | 0.748 | 0.339 | 0.415 | 0.224 | 0.020 | ||
| LN | 3 | 0.547 | 0.00078 | 0.593 | 0.261 | 0.280 | 3.0 | 2.282 | 0.762 | 0.314 | 0.417 | 0.281 | 0.000 | ||
| HL | 1 | — | — | — | — | — | 3.4 | 1.755 | 0.695 | 0.288 | 0.386 | 0.284 | 0.008 | ||
| SH | 2 | 0.138 | 0.00018 | 0.138 | −0.741 | −0.380 | 3.0 | 1.751 | 0.570 | 0.343 | 0.301 | −0.104 | 0.417 | ||
| JS | 3 | 0.567 | 0.00081 | 0.615 | 0.273 | 0.256 | 3.0 | 2.113 | 0.720 | 0.292 | 0.396 | 0.300 | 0.000 | ||
| ZJ | 2 | 0.133 | 0.00035 | 0.267 | −1.491 | 0.235 | 2.8 | 1.635 | 0.518 | 0.267 | 0.284 | 0.104 | 0.714 | ||
| AH | 3 | 0.473 | 0.00067 | 0.505 | −0.532 | −0.465 | 2.8 | 2.114 | 0.679 | 0.280 | 0.379 | 0.310 | 0.002 | ||
| FJ | 2 | 0.209 | 0.00028 | 0.209 | −0.529 | −0.011 | 3.0 | 2.102 | 0.685 | 0.309 | 0.369 | 0.207 | 0.058 | ||
| JX | 3 | 0.177 | 0.00035 | 0.264 | −1.175 | −1.310 | 2.8 | 2.001 | 0.655 | 0.325 | 0.373 | 0.159 | 0.001 | ||
| SD | 3 | 0.267 | 0.00049 | 0.371 | −1.457 | −0.728 | 3.0 | 1.858 | 0.672 | 0.360 | 0.375 | 0.092 | 0.429 | ||
| HA | 2 | 0.467 | 0.00062 | 0.467 | 0.820 | 0.818 | 2.4 | 1.791 | 0.620 | 0.300 | 0.372 | 0.280 | 0.062 | ||
| HB | 1 | — | — | — | — | — | 2.6 | 2.182 | 0.725 | 0.367 | 0.433 | 0.241 | 0.322 | ||
| HN | 2 | 0.248 | 0.00033 | 0.248 | −0.399 | 0.133 | 2.8 | 1.996 | 0.655 | 0.308 | 0.363 | 0.191 | 0.135 | ||
| GX | 2 | 0.425 | 0.00056 | 0.425 | 0.870 | 1.039 | 4.0 | 2.157 | 0.924 | 0.450 | 0.484 | 0.137 | 0.141 | ||
| CQ | 2 | 0.148 | 0.0002 | 0.148 | −0.714 | −0.317 | 3.4 | 2.012 | 0.710 | 0.343 | 0.365 | 0.098 | 0.268 | ||
| SC | 1 | — | — | — | — | — | 4.0 | 2.278 | 0.804 | 0.289 | 0.402 | 0.307 | 0.000 | ||
| YN | 3 | 0.560 | 0.00083 | 0.626 | −0.011 | −0.072 | 3.4 | 2.139 | 0.812 | 0.371 | 0.441 | 0.193 | 0.019 | ||
| SN | 2 | 0.133 | 0.00018 | 0.133 | −1.159 | −0.649 | 3.0 | 2.138 | 0.742 | 0.414 | 0.409 | 0.025 | 0.336 | ||
| NX | 2 | 0.325 | 0.00043 | 0.325 | 0.156 | 0.551 | 3.0 | 2.042 | 0.738 | 0.327 | 0.416 | 0.258 | 0.057 | ||
| XJ | 2 | 0.523 | 0.00069 | 0.523 | 1.505 | 1.405 | 2.6 | 1.698 | 0.580 | 0.250 | 0.336 | 0.317 | 0.074 | ||
| Overall | 6 | 0.401 | 0.00058 | 0.441 | −0.739 | −1.971 | 3.0 | 1.988 | 0.693 | 0.325 | 0.382 | 0.191 | 0.170 | ||
| MEAM1 | LN | 1 | — | — | — | — | — | 2.6 | 1.770 | 0.617 | 0.320 | 0.344 | 0.179 | 0.627 | |
| ZJ | 2 | 0.125 | 0.00017 | 0.125 | −1.162 | −0.700 | 3.0 | 2.117 | 0.644 | 0.360 | 0.330 | −0.038 | 1.000 | ||
| FJ | 1 | — | — | — | — | — | 2.6 | 2.149 | 0.635 | 0.343 | 0.341 | 0.071 | 0.420 | ||
| GD | 1 | — | — | — | — | — | 3.4 | 1.951 | 0.697 | 0.357 | 0.350 | 0.015 | 0.346 | ||
| GX | 1 | — | — | — | — | — | 3.0 | 1.794 | 0.585 | 0.267 | 0.296 | 0.141 | 0.047 | ||
| HI | 3 | 0.362 | 0.0005 | 0.381 | −1.002 | −0.918 | 3.0 | 2.247 | 0.736 | 0.450 | 0.406 | −0.065 | 0.094 | ||
| GS | 1 | — | — | — | — | — | 2.2 | 1.854 | 0.480 | 0.289 | 0.273 | 0.000 | 0.922 | ||
| XJ | 1 | — | — | — | — | — | 2.8 | 1.970 | 0.681 | 0.433 | 0.383 | −0.040 | 0.893 | ||
| Overall | 4 | 0.064 | 0.00009 | 0.065 | −1.529 | −5.383 | 2.8 | 1.981 | 0.634 | 0.352 | 0.340 | 0.033 | 0.543 | ||
| Cryptic Species | Locus | Number of Alleles (A) | Number of Homozygotes (Homs) | Number of Heterozygotes (Hets) | Allele Richness (AR) | Null Allele Frequency |
|---|---|---|---|---|---|---|
| MED | BEM6 | 5 | 249 | 8 | 3.517 | 0.352 |
| BEM15 | 7 | 197 | 60 | 2.224 | 0.003 | |
| BEM18 | 4 | 125 | 132 | 2.455 | 0.009 | |
| BEM23 | 3 | 230 | 27 | 1.605 | 0.014 | |
| BEM25 | 9 | 190 | 67 | 4.863 | 0.015 | |
| MEAM1 | BEM6 | 5 | 71 | 4 | 1.742 | 0.085 |
| BEM15 | 7 | 19 | 56 | 3.919 | 0.000 | |
| BEM18 | 3 | 57 | 18 | 1.851 | 0.000 | |
| BEM23 | 3 | 72 | 3 | 1.259 | 0.012 | |
| BEM25 | 7 | 24 | 51 | 4.167 | 0.027 |
| Population | Haplotype Distribution (%) | |||||
|---|---|---|---|---|---|---|
| Hap1 | Hap2 | Hap3 | Hap4 | Hap5 | Hap6 | |
| HE | 85.71 | 14.29 | ||||
| SX | 100 | |||||
| NM | 100 | |||||
| LN | 56.00 | 40.00 | 4.00 | |||
| HL | 100 | |||||
| SH | 92.86 | 7.14 | ||||
| JS | 50.00 | 45.45 | 4.55 | |||
| ZJ | 93.33 | 6.67 | ||||
| AH | 71.43 | 21.43 | 7.14 | |||
| FJ | 88.89 | 11.11 | ||||
| JX | 90.91 | 4.55 | 4.54 | |||
| SD | 85.72 | 9.52 | 4.76 | |||
| HA | 70.00 | 30.00 | ||||
| HB | 100 | |||||
| HN | 86.67 | 13.33 | ||||
| GX | 27.78 | 72.22 | ||||
| CQ | 7.69 | 92.31 | ||||
| SC | 100 | |||||
| YN | 14.28 | 64.29 | 21.43 | |||
| SN | 93.33 | 6.67 | ||||
| NX | 81.25 | 18.75 | ||||
| XJ | 44.44 | 55.56 | ||||
| Total | 73.70 | 23.82 | 0.99 | 0.74 | 0.50 | 0.25 |
| Population | Haplotype Distribution (%) | |||
|---|---|---|---|---|
| Hap1 | Hap2 | Hap3 | Hap4 | |
| LN | 100 | |||
| ZJ | 93.75 | 6.25 | ||
| FJ | 100 | |||
| GD | 100 | |||
| GX | 100 | |||
| HI | 80.00 | 13.33 | 6.73 | |
| GS | 100 | |||
| XJ | 100 | |||
| Total | 96.72 | 0.78 | 1.67 | 0.83 |
| Cryptic Species | Marker | Source of Variation | d.f. | Sum of Squares | Variance Components | Percentage of Variation |
|---|---|---|---|---|---|---|
| MED | mitochondrial COI | Among populations | 21 | 36.820 | 0.089 | 39.5 |
| Within populations | 381 | 51.740 | 0.136 | 60.5 | ||
| Total | 402 | 88.561 | 0.224 | |||
| microsatellites | Among populations | 21 | 86.170 | 0.133 | 11.8 | |
| Within populations | 492 | 490.629 | 0.997 | 88.2 | ||
| Total | 513 | 570.800 | 1.131 | |||
| MEAM1 | mitochondrial COI | Among populations | 7 | 0.347 | 0.001 | 3.7 |
| Within populations | 115 | 3.604 | 0.031 | 96.3 | ||
| Total | 122 | 3.951 | 0.033 | |||
| microsatellites | Among populations | 7 | 11.844 | 0.043 | 4.6 | |
| Within populations | 142 | 127.396 | 0.897 | 95.4 | ||
| Total | 149 | 139.240 | 0.940 |
Disclaimer/Publisher’s Note: The statements, opinions and data contained in all publications are solely those of the individual author(s) and contributor(s) and not of MDPI and/or the editor(s). MDPI and/or the editor(s) disclaim responsibility for any injury to people or property resulting from any ideas, methods, instructions or products referred to in the content. |
© 2024 by the authors. Licensee MDPI, Basel, Switzerland. This article is an open access article distributed under the terms and conditions of the Creative Commons Attribution (CC BY) license (https://creativecommons.org/licenses/by/4.0/).
Share and Cite
Xue, Y.; Wang, Y.; Chen, J.; Zhang, G.; Liu, W.; Wan, F.; Zhang, Y. Disparities in Genetic Diversity Drive the Population Displacement of Two Invasive Cryptic Species of the Bemisia tabaci Complex in China. Int. J. Mol. Sci. 2024, 25, 7966. https://doi.org/10.3390/ijms25147966
Xue Y, Wang Y, Chen J, Zhang G, Liu W, Wan F, Zhang Y. Disparities in Genetic Diversity Drive the Population Displacement of Two Invasive Cryptic Species of the Bemisia tabaci Complex in China. International Journal of Molecular Sciences. 2024; 25(14):7966. https://doi.org/10.3390/ijms25147966
Chicago/Turabian StyleXue, Yantao, Yusheng Wang, Jiqiang Chen, Guifen Zhang, Wanxue Liu, Fanghao Wan, and Yibo Zhang. 2024. "Disparities in Genetic Diversity Drive the Population Displacement of Two Invasive Cryptic Species of the Bemisia tabaci Complex in China" International Journal of Molecular Sciences 25, no. 14: 7966. https://doi.org/10.3390/ijms25147966
APA StyleXue, Y., Wang, Y., Chen, J., Zhang, G., Liu, W., Wan, F., & Zhang, Y. (2024). Disparities in Genetic Diversity Drive the Population Displacement of Two Invasive Cryptic Species of the Bemisia tabaci Complex in China. International Journal of Molecular Sciences, 25(14), 7966. https://doi.org/10.3390/ijms25147966